Exhibit 99.2
Supplemental Analyst Package First Quarter 2007 Earnings Call May 1, 2007

Table of Contents Financial Highlights ___________________________________________________________________________________1 Consolidated Balance Sheets __________________________________________________________________________3 Consolidated Statements of Operations __________________________________________________________________4 Consolidated Statements of Funds from Operations ________________________________________________________5 Capital Structure _____________________________________________________________________________________6 Portfolio Overview ____________________________________________________________________________________7 Property Results of Operations _________________________________________________________________________9 2007/2008 Leasing Status ______________________________________________________________________________10 First Quarter 2007 Acquisitions _________________________________________________________________________13 Owned Development Update ___________________________________________________________________________14 Third-party Development Update ________________________________________________________________________15 Management Services Update __________________________________________________________________________16 Investor Information __________________________________________________________________________________17
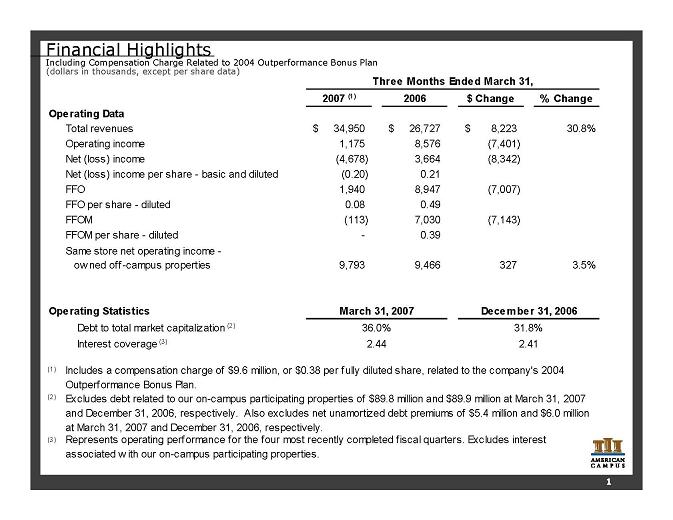
Financial Highlights Including Compensation Charge Related to 2004 Outperformance Bonus Plan (dollars in thousands, except per share data) 2007 (1) 2006 $ Change % Change Operating Data Total revenues 34,950 $ 26,727 $ 8,223 $ 30.8% Operating income 1,175 8,576 (7,401) Net (loss) income (4,678) 3,664 (8,342) Net (loss) income per share - basic and diluted (0.20) 0.21 FFO 1,940 8,947 (7,007) FFO per share - diluted 0.08 0.49 FFOM (113) 7,030 (7,143) FFOM per share - diluted - 0.39 Same store net operating income - ow ned off-campus properties 9,793 9,466 327 3.5% Operating Statistics Debt to total market capitalization (2) Interest coverage (3) (1) (2) (3) Includes a compensation charge of $9.6 million, or $0.38 per fully diluted share, related to the company's 2004 Outperformance Bonus Plan. March 31, 2007 December 31, 2006 Represents operating performance for the four most recently completed fiscal quarters. Excludes interest associated w ith our on-campus participating properties. 36.0% 31.8% Three Months Ended March 31, 2.44 2.41 Excludes debt related to our on-campus participating properties of $89.8 million and $89.9 million at March 31, 2007 and December 31, 2006, respectively. Also excludes net unamortized debt premiums of $5.4 million and $6.0 million at March 31, 2007 and December 31, 2006, respectively. 1
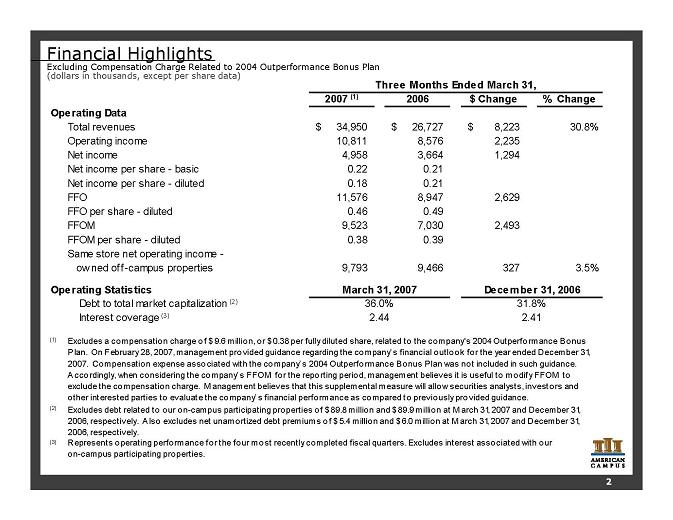
Financial Highlights Excluding Compensation Charge Related to 2004 Outperformance Bonus Plan (dollars in thousands, except per share data) 2007 (1) 2006 $ Change % Change Operating Data Total revenues 34,950 $ 26,727 $ 8,223 $ 30.8% Operating income 10,811 8,576 2,235 Net income 4,958 3,664 1,294 Net income per share - basic 0.22 0.21 Net income per share - diluted 0.18 0.21 FFO 11,576 8,947 2,629 FFO per share - diluted 0.46 0.49 FFOM 9,523 7,030 2,493 FFOM per share - diluted 0.38 0.39 Same store net operating income - ow ned off-campus properties 9,793 9,466 327 3.5% Operating Statistics Debt to total market capitalization (2) Interest coverage (3) (1) (2) (3) Excludes a compensation charge of $9.6 million, or $0.38 per fully diluted share, related to the company's 2004 Outperformance Bonus Plan. On February 28, 2007, management provided guidance regarding the company’s financial outlook for the year ended December 31, 2007. Compensation expense associated with the company’s 2004 Outperformance Bonus Plan was not included in such guidance. Accordingly, when considering the company’s FFOM for the reporting period, management believes it is useful to modify FFOM to exclude the compensation charge. M anagement believes that this supplemental measure will allow securities analysts, investors and other interested parties to evaluate the company’s financial performance as compared to previously provided guidance. March 31, 2007 December 31, 2006 Represents operating performance for the four most recently completed fiscal quarters. Excludes interest associated with our on-campus participating properties. 36.0% 31.8% Three Months Ended March 31, 2.44 2.41 Excludes debt related to our on-campus participating properties of $89.8 million and $89.9 millio n at M arch 31, 2007 and December 31, 2006, respectively. Also excludes net unamortized debt premiums of $5.4 million and $6.0 million at M arch 31, 2007 and December 31, 2006, respectively. 2
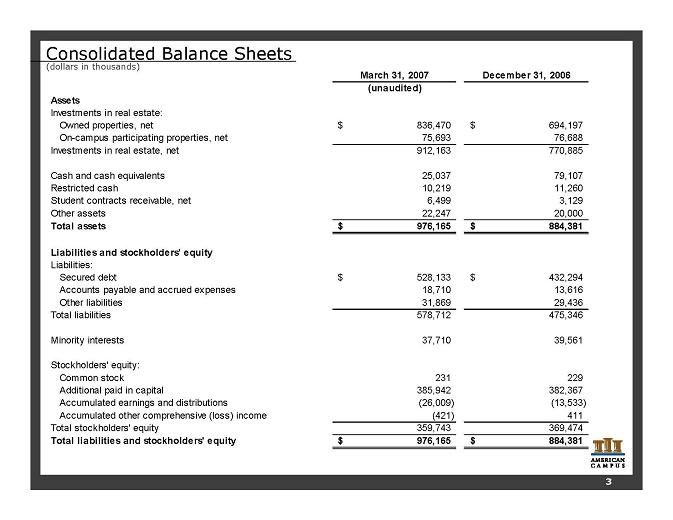
Consolidated Balance Sheets (dollars in thousands) 3 March 31, 2007 December 31, 2006 (unaudited) Assets Investments in real estate: Owned properties, net 836,470 $ 694,197 $ On-campus participating properties, net 75,693 76,688 Investments in real estate, net 912,163 770,885 Cash and cash equivalents 25,037 79,107 Restricted cash 10,219 11,260 Student contracts receivable, net 6,499 3,129 Other assets 22,247 20,000 Total assets 976,165 $ 884,381 $ Liabilities and stockholders' equity Liabilities: Secured debt 528,133 $ 432,294 $ Accounts payable and accrued expenses 18,710 13,616 Other liabilities 31,869 29,436 Total liabilities 578,712 475,346 Minority interests 37,710 39,561 Stockholders' equity: Common stock 231 229 Additional paid in capital 385,942 382,367 Accumulated earnings and distributions (26,009) (13,533) Accumulated other comprehensive (loss) income (421) 411 Total stockholders' equity 359,743 369,474 Total liabilities and stockholders' equity 976,165 $ 884,381 $
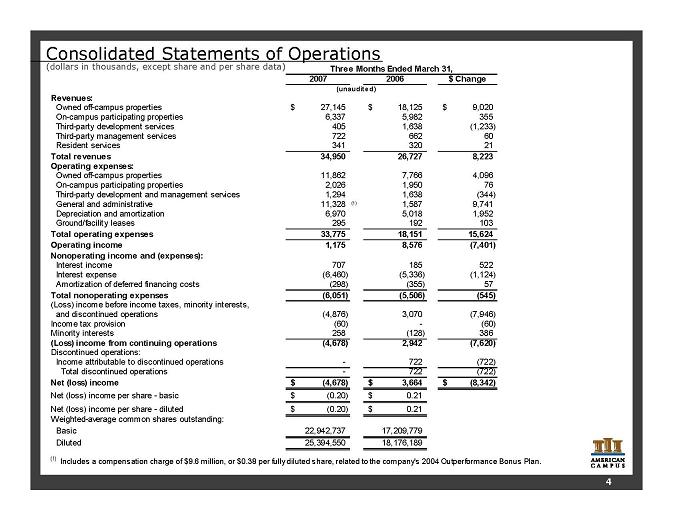
Consolidated Statements of Operations (dollars in thousands, except share and per share data) 2007 2006 $ Change Revenues: Owned off-campus properties 27,145 $ 18,125 $ 9,020 $ On-campus participating properties 6,337 5,982 355 Third-party development services 405 1,638 (1,233) Third-party management services 722 662 60 Resident services 341 320 21 Total revenues 34,950 26,727 8,223 Operating expenses: Owned off-campus properties 11,862 7,766 4,096 On-campus participating properties 2,026 1,950 76 Third-party development and management services 1,294 1,638 (344) General and administrative 11,328 (1) 1,587 9,741 Depreciation and amortization 6,970 5,018 1,952 Ground/facility leases 295 192 103 Total operating expenses 33,775 18,151 15,624 Operating income 1,175 8,576 (7,401) Nonoperating income and (expenses): Interest income 707 185 522 Interest expense (6,460) (5,336) (1,124) Amortization of deferred financing costs (298) (355) 57 Total nonoperating expenses (6,051) (5,506) (545) (Loss) income before income taxes, minority interests, and discontinued operations (4,876) 3,070 (7,946) Income tax provision (60) - (60) Minority interests 258 (128) 386 (Loss) income from continuing operations (4,678) 2,942 (7,620) Discontinued operations: Income attributable to discontinued operations - 722 (722) Total discontinued operations - 722 (722) Net (loss) income (4,678) $ 3,664 $ (8,342) $ Net (loss) income per share - basic (0.20) $ 0.21 $ Net (loss) income per share - diluted (0.20) $ 0.21 $ Weighted-average common shares outstanding: Basic 22,942,737 17,209,779 Diluted 25,394,550 18,176,189 Three Months Ended March 31, (unaudited) (1) Includes a compensation charge of $9.6 million, or $0.38 per fully diluted share, related to the company's 2004 Outperformance Bonus Plan. 4
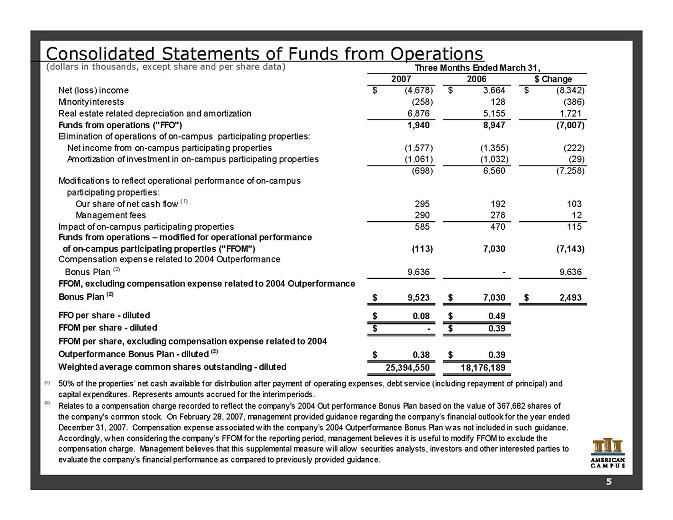
Consolidated Statements of Funds from Operations (dollars in thousands, except share and per share data) 2007 2006 $ Change Net (loss) income (4,678) $ 3,664 $ (8,342) $ Minority interests (258) 128 (386) Real estate related depreciation and amortization 6,876 5,155 1,721 Funds from operations ("FFO") 1,940 8,947 (7,007) Elimination of operations of on-campus participating properties: Net income from on-campus participating properties (1,577) (1,355) (222) Amortization of investment in on-campus participating properties (1,061) (1,032) (29) (698) 6,560 (7,258) Modifications to reflect operational performance of on-campus participating properties: Our share of net cash flow (1) 295 192 103 Management fees 290 278 12 Impact of on-campus participating properties 585 470 115 Funds from operations - modified for operational performance of on-campus participating properties ("FFOM") (113) 7,030 (7,143) Compensation expense related to 2004 Outperformance Bonus Plan (2) 9,636 - 9,636 FFOM, excluding compensation expense related to 2004 Outperformance Bonus Plan (2) 9,523 $ 7,030 $ 2,493 $ FFO per share - diluted 0.08 $ 0.49 $ FFOM per share - diluted - $ 0.39 $ FFOM per share, excluding compensation expense related to 2004 Outperformance Bonus Plan - diluted (2) 0.38 $ 0.39 $ Weighted average common shares outstanding - diluted 25,394,550 18,176,189 (1) (2) Three Months Ended March 31, 50% of the properties’ net cash available for distribution after payment of operating expenses, debt service (including repayment of principal) and capital expenditures. Represents amounts accrued for the interim periods. Relates to a compensation charge recorded to reflect the company's 2004 Out performance Bonus Plan based on the value of 367,682 shares of the company's common stock. On February 28, 2007, management provided guidance regarding the company’s financial outlook for the year ended December 31, 2007. Compensation expense associated w ith the company’s 2004 Outperformance Bonus Plan w as not included in such guidance. Accordingly, w hen considering the company’s FFOM for the reporting period, management believes it is useful to modify FFOM to exclude the compensation charge. Management believes that this supplemental measure w ill allow securities analysts, investors and other interested parties to evaluate the company’s financial performance as compared to previously provided guidance. 5

Capital Structure as of March 31, 2007 (dollars in thousands) Total Debt (1) 432,880 $ Total Equity Market Value (2) 769,978 Total Market Capitalization 1,202,858 $ Debt to Total Market Capitalization 36.0% Interest Coverage (3) 2.44 Principal Outstanding (1) Weighted Average Interest Rate Average Term to Maturity Fixed Rate Mortgage 401,848 $ 6.34% 5.7 Years Variable Rate Construction Loan 31,032 6.82% 1.5 Years Total / Weighted Average 432,880 $ 6.37% 5.4 Years (1) (2) (3) Fixed Rate Debt Maturity Schedule Represents operating performance for the four most recently completed fiscal quarters. Excludes interest associated with our on-campus participating properties. Excluding debt related to our on-campus participating properties totaling $89.8 million with a weighted average interest rate of 7.16% and average term to maturity of 13.5 years. Also excludes net unamortized debt premiums of $5.4 million. Based on share price of $30.29 at M arch 30, 2007. Assumes conversion of all common and preferred Operating Partnership units as well as any other securities convertible into common shares. $ 0 $ 0 $ 53,667 $ 51,332 $ 48,595 $ 69,105 $ 17,821 $ 51,588 $ 108,322 $ 1,418 $0 $10,000 $20,000 $30,000 $40,000 $50,000 $60,000 $70,000 $80,000 $90,000 $100,000 $110,000 $120,000 2007 2008 2009 2010 2011 2012 2013 2014 2015 2016 6
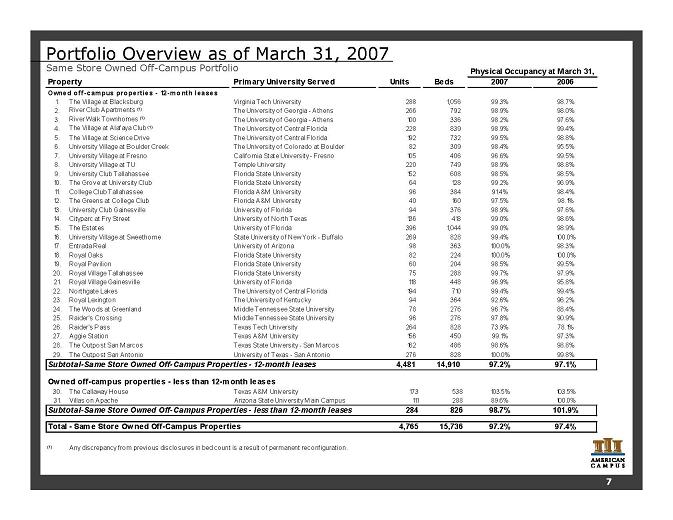
Portfolio Overview as of March 31, 2007 Same Store Owned Off-Campus Portfolio 7 Primary University Served Units Beds 2007 2006 1. The Village at Blacksburg Virginia Tech University 288 1,056 99.3% 98.7% 2. River Club Apartments (1) The University o f Georgia - Athens 266 792 98.9% 98.0% 3. River Walk Townhomes (1) The University o f Georgia - Athens 100 336 98.2% 97.6% 4. The Village at Alafaya Club (1) The University o f Central Florida 228 839 98.9% 99.4% 5. The Village at Science Drive The University of Central Florida 192 732 99.5% 98.8% 6. University Village at Boulder Creek The University of Colorado at Boulder 82 309 98.4% 95.5% 7. University Village at Fresno California State University - Fresno 105 406 96.6% 99.5% 8. University Village at TU Temple University 220 749 98.9% 98.8% 9. University Club Tallahassee Florida State University 152 608 98.5% 98.5% 10. The Grove at University Club Florida State University 64 128 99.2% 96.9% 11. College Club Tallahassee Florida A&M University 96 384 91.4% 98.4% 12. The Greens at College Club Florida A&M University 40 160 97.5% 98.1% 13. University Club Gainesville University of Florida 94 376 98.9% 97.6% 14. Cityparc at Fry Street University of North Texas 136 418 99.0% 98.6% 15. The Estates University of Florida 396 1,044 99.0% 98.9% 16. University Village at Sweethome State University of New York - Buffalo 269 828 99.4% 100.0% 17. Entrada Real University of Arizona 98 363 100.0% 98.3% 18. Royal Oaks Florida State University 82 224 100.0% 100.0% 19. Royal Pavilion Florida State University 60 204 98.5% 99.5% 20. Royal Village Tallahassee Florida State University 75 288 99.7% 97.9% 21. Royal Village Gainesville University of Florida 118 448 96.9% 95.8% 22. Northgate Lakes The University o f Central Florida 194 710 99.4% 99.4% 23. Royal Lexington The University o f Kentucky 94 364 92.6% 96.2% 24. The Woods at Greenland Middle Tennessee State University 78 276 96.7% 88.4% 25. Raider's Crossing Middle Tennessee State University 96 276 97.8% 90.9% 26. Raider's Pass Texas Tech University 264 828 73.9% 78.1% 27. Aggie Station Texas A&M University 156 450 99.1% 97.3% 28. The Outpost San Marcos Texas State University - San M arcos 162 486 98.6% 98.8% 29. The Outpost San Antonio University of Texas - San Antonio 276 828 100.0% 99.8% 4,481 14,910 97.2% 97.1% Owned off-campus properties - less than 12-month leases 30. The Callaway House Texas A&M University 173 538 103.5% 103.5% 31. Villas on Apache Arizona State University M ain Campus 111 288 89.6% 100.0% Subtotal-Same Store Owned Off-Campus Properties - less than 12-month leases 284 826 98.7% 101.9% Total - Same Store Owned Off-Campus Properties 4,765 15,736 97.2% 97.4% (1) Any discrepancy from previous disclosures in bed count is a result of permanent reconfiguration. Physical Occupancy at March 31, Property Subtotal-Same Store Owned Off-Campus Properties - 12-month leases Owned o ff-campus propert ies - 12-month leases
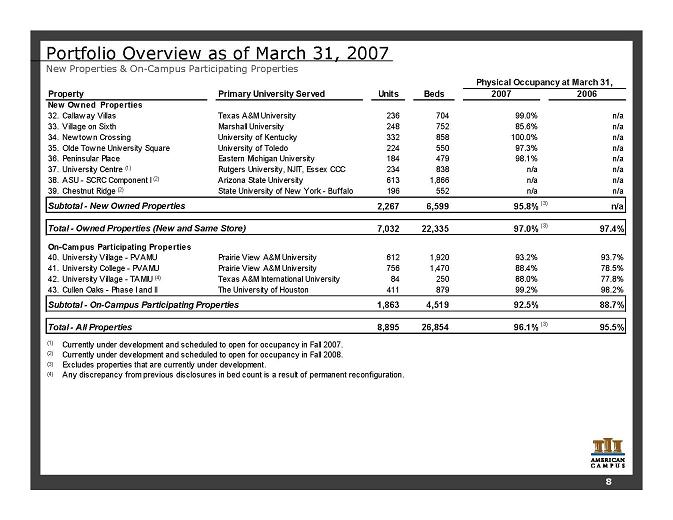
Portfolio Overview as of March 31, 2007 New Properties & On-Campus Participating Properties 8 Primary University Served Units Beds 2007 2006 32. Callaw ay Villas Texas A&M University 236 704 99.0% n/a 33. Village on Sixth Marshall University 248 752 85.6% n/a 34. New tow n Crossing University of Kentucky 332 858 100.0% n/a 35. Olde Tow ne University Square University of Toledo 224 550 97.3% n/a 36. Peninsular Place Eastern Michigan University 184 479 98.1% n/a 37. University Centre (1) Rutgers University, NJIT, Essex CCC 234 838 n/a n/a 38. ASU - SCRC Component I (2) Arizona State University 613 1,866 n/a n/a 39. Chestnut Ridge (2) State University of New York - Buffalo 196 552 n/a n/a 2,267 6,599 95.8% (3) n/a 7,032 22,335 97.0% (3) 97.4% 40. University Village - PVAMU Prairie View A&M University 612 1,920 93.2% 93.7% 41. University College - PVAMU Prairie View A&M University 756 1,470 88.4% 78.5% 42. University Village - TAMIU (4) Texas A&M International University 84 250 88.0% 77.8% 43. Cullen Oaks - Phase I and II The University of Houston 411 879 99.2% 98.2% 1,863 4,519 92.5% 88.7% 8,895 26,854 96.1% (3) 95.5% (1) Currently under development and scheduled to open for occupancy in Fall 2007. (2) Currently under development and scheduled to open for occupancy in Fall 2008. (3) Excludes properties that are currently under development. (4) Any discrepancy from previous disclosures in bed count is a result of permanent reconfiguration. Physical Occupancy at March 31, Property Subtotal - New Owned Properties New Owned Properties Total - Owned Properties (New and Same Store) On-Campus Participating Properties Subtotal - On-Campus Participating Properties Total - All Properties
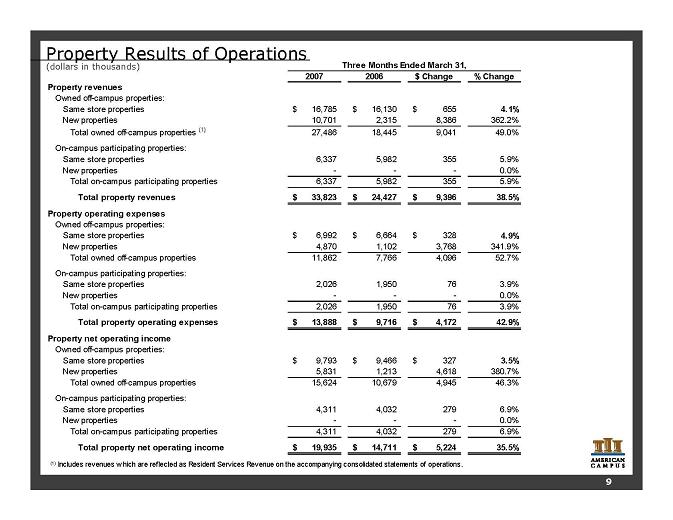
Property Results of Operations (dollars in thousands) 2007 2006 $ Change % Change Property revenues Owned off-campus properties: Same store properties 16,785 $ 16,130 $ 655 $ 4.1% New properties 10,701 2,315 8,386 362.2% Total owned off-campus properties (1) 27,486 18,445 9,041 49.0% On-campus participating properties: Same store properties 6,337 5,982 355 5.9% New properties - - - 0.0% Total on-campus participating properties 6,337 5,982 355 5.9% Total property revenues 33,823 $ 24,427 $ 9,396 $ 38.5% Property operating expenses Owned off-campus properties: Same store properties 6,992 $ 6,664 $ 328 $ 4.9% New properties 4,870 1,102 3,768 341.9% Total owned off-campus properties 11,862 7,766 4,096 52.7% On-campus participating properties: Same store properties 2,026 1,950 76 3.9% New properties - - - 0.0% Total on-campus participating properties 2,026 1,950 76 3.9% Total property operating expenses 13,888 $ 9,716 $ 4,172 $ 42.9% Property net operating income Owned off-campus properties: Same store properties 9,793 $ 9,466 $ 327 $ 3.5% New properties 5,831 1,213 4,618 380.7% Total owned off-campus properties 15,624 10,679 4,945 46.3% On-campus participating properties: Same store properties 4,311 4,032 279 6.9% New properties - - - 0.0% Total on-campus participating properties 4,311 4,032 279 6.9% Total property net operating income 19,935 $ 14,711 $ 5,224 $ 35.5% Three Months Ended March 31, (1) Includes revenues w hich are reflected as Resident Services Revenue on the accompanying consolidated statements of operations. 9
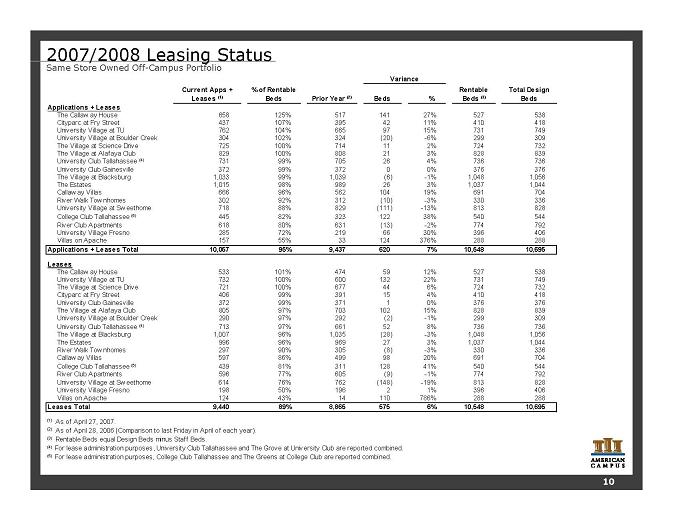
Current Apps + Leases (1) % of Rentable Beds Prior Year (2) Beds % Rentable Beds (3) Total Design Beds Applications + Leases The Callaw ay House 658 125% 517 141 27% 527 538 Cityparc at Fry Street 437 107% 395 42 11% 410 418 University Village at TU 762 104% 665 97 15% 731 749 University Village at Boulder Creek 304 102% 324 (20) -6% 299 309 The Village at Science Drive 725 100% 714 11 2% 724 732 The Village at Alafaya Club 829 100% 808 21 3% 828 839 University Club Tallahassee (4) 731 99% 705 26 4% 736 736 University Club Gainesville 372 99% 372 0 0% 376 376 The Village at Blacksburg 1,033 99% 1,039 (6) -1% 1,048 1,056 The Estates 1,015 98% 989 26 3% 1,037 1,044 Callaw ay Villas 666 96% 562 104 19% 691 704 River Walk Tow nhomes 302 92% 312 (10) -3% 330 336 University Village at Sw eethome 718 88% 829 (111) -13% 813 828 College Club Tallahassee (5) 445 82% 323 122 38% 540 544 River Club Apartments 618 80% 631 (13) -2% 774 792 University Village Fresno 285 72% 219 66 30% 396 406 Villas on Apache 157 55% 33 124 376% 288 288 Applications + Leases Total 10,057 95% 9,437 620 7% 10,548 10,695 Leases The Callaw ay House 533 101% 474 59 12% 527 538 University Village at TU 732 100% 600 132 22% 731 749 The Village at Science Drive 721 100% 677 44 6% 724 732 Cityparc at Fry Street 406 99% 391 15 4% 410 418 University Club Gainesville 372 99% 371 1 0% 376 376 The Village at Alafaya Club 805 97% 703 102 15% 828 839 University Village at Boulder Creek 290 97% 292 (2) -1% 299 309 University Club Tallahassee (4) 713 97% 661 52 8% 736 736 The Village at Blacksburg 1,007 96% 1,035 (28) -3% 1,048 1,056 The Estates 996 96% 969 27 3% 1,037 1,044 River Walk Tow nhomes 297 90% 305 (8) -3% 330 336 Callaw ay Villas 597 86% 499 98 20% 691 704 College Club Tallahassee (5) 439 81% 311 128 41% 540 544 River Club Apartments 596 77% 605 (9) -1% 774 792 University Village at Sw eethome 614 76% 762 (148) -19% 813 828 University Village Fresno 198 50% 196 2 1% 396 406 Villas on Apache 124 43% 14 110 786% 288 288 Leases Total 9,440 89% 8,865 575 6% 10,548 10,695 (1) As of April 27, 2007. (2) As of April 28, 2006 (Comparison to last Friday in April of each year). (3) Rentable Beds equal Design Beds minus Staff Beds. (4) For lease administration purposes, University Club Tallahassee and The Grove at University Club are reported combined. (5) For lease administration purposes, College Club Tallahassee and The Greens at College Club are reported combined. Variance 2007/2008 Leasing Status Same Store Owned Off-Campus Portfolio 10
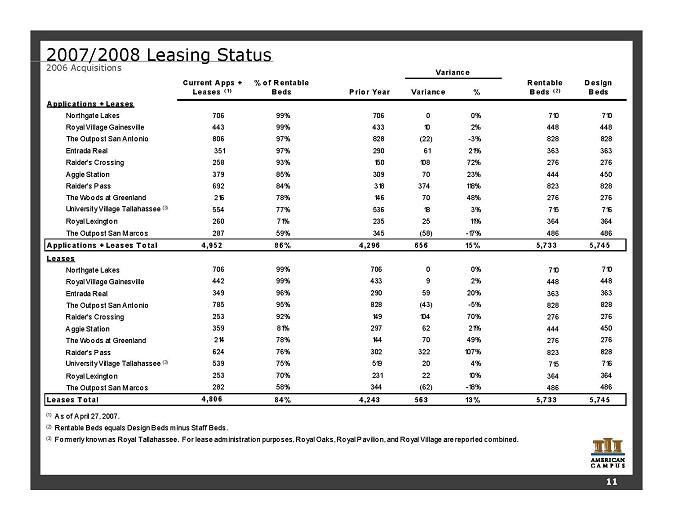
Current Apps + Leases ( 1) % o f R entable Beds P rior Year Variance % Rentable Beds ( 2) Design Beds Applicatio ns + Leases Northgate Lakes 706 99% 706 0 0% 710 710 Royal Village Gainesville 443 99% 433 10 2% 448 448 The Outpost San Antonio 806 97% 828 (22) -3% 828 828 Entrada Real 351 97% 290 61 21% 363 363 Raider's Crossing 258 93% 150 108 72% 276 276 Aggie Station 379 85% 309 70 23% 444 450 Raider's Pass 692 84% 318 374 118% 823 828 The Woods at Greenland 216 78% 146 70 48% 276 276 University Village Tallahassee (3) 554 77% 536 18 3% 715 716 Royal Lexington 260 71% 235 25 11% 364 364 The Outpost San M arcos 287 59% 345 (58) -17% 486 486 Applications + Leases Total 4,952 86% 4,296 656 15% 5,733 5,745 Leases Northgate Lakes 706 99% 706 0 0% 710 710 Royal Village Gainesville 442 99% 433 9 2% 448 448 Entrada Real 349 96% 290 59 20% 363 363 The Outpost San Antonio 785 95% 828 (43) -5% 828 828 Raider's Crossing 253 92% 149 104 70% 276 276 Aggie Station 359 81% 297 62 21% 444 450 The Woods at Greenland 214 78% 144 70 49% 276 276 Raider's Pass 624 76% 302 322 107% 823 828 University Village Tallahassee (3) 539 75% 519 20 4% 715 716 Royal Lexington 253 70% 231 22 10% 364 364 The Outpost San M arcos 282 58% 344 (62) -18% 486 486 Leases Total 4,806 84% 4,243 563 13% 5,733 5,745 (1) As of April 27, 2007. (2) Rentable Beds equals Design Beds minus Staff Beds. (3) Formerly known as Royal Tallahassee. For lease administration purposes, Royal Oaks, Royal Pavilion, and Royal Village are reported combined. Variance 2007/2008 Leasing Status 2006 Acquisitions 11
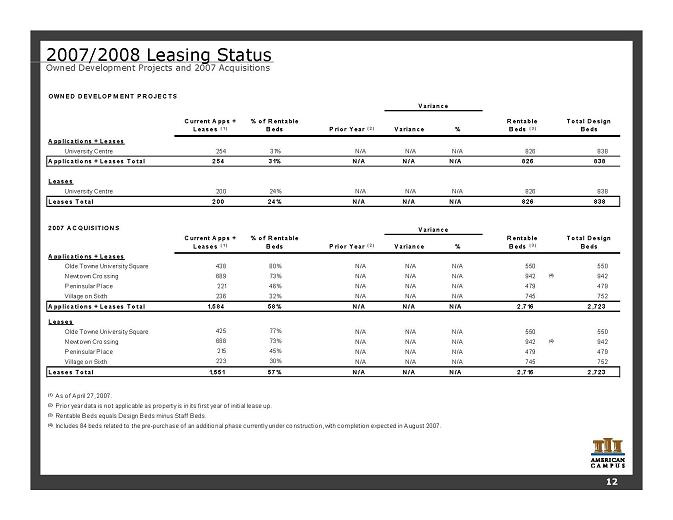
OWNED DEVELOPM ENT P ROJECTS Current A pps + Leases ( 1) % o f R entable Beds P rior Year ( 2) Variance % Rentable Beds ( 3) Total D esign Beds Applications + Leases University Centre 254 31% N/A N/A N/A 826 838 Applications + Leases Total 254 31% N/A N/A N/A 826 838 Leases University Centre 200 24% N/A N/A N/A 826 838 Leases Total 200 24% N/A N/A N/A 826 838 2007 ACQUISITIONS Current A pps + Leases ( 1) % o f R entable Beds P rior Year ( 2) Variance % Rentable Beds ( 3) Total D esign Beds Applications + Leases Olde Towne University Square 438 80% N/A N/A N/A 550 550 Newtown Crossing 689 73% N/A N/A N/A 942 (4) 942 Peninsular Place 221 46% N/A N/A N/A 479 479 Village on Sixth 236 32% N/A N/A N/A 745 752 Applications + Leases Total 1,584 58% N/A N/A N/A 2,716 2,723 Leases Olde Towne University Square 425 77% N/A N/A N/A 550 550 Newtown Crossing 688 73% N/A N/A N/A 942 (4) 942 Peninsular Place 215 45% N/A N/A N/A 479 479 Village on Sixth 223 30% N/A N/A N/A 745 752 Leases Total 1,551 57% N/A N/A N/A 2,716 2,723 (1) As of April 27, 2007. (2) P rior year data is no t applicable as property is in its first year of initial lease up. (3) Rentable Beds equals Design Beds minus Staff Beds. (4) Includes 84 beds related to the pre-purchase of an additional phase currently under construction, with completion expected in August 2007. Variance Variance 2007/2008 Leasing Status Owned Development Projects and 2007 Acquisitions 12
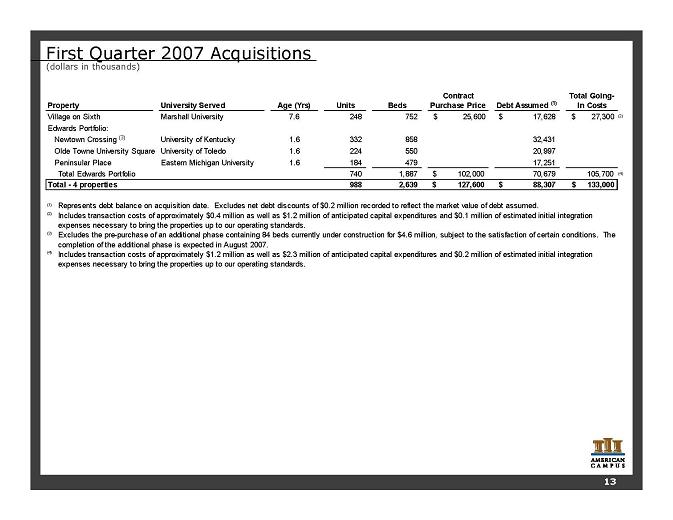
First Quarter 2007 Acquisitions (dollars in thousands) Property University Served Age (Yrs) Units Beds Contract Purchase Price Debt Assumed (1) Total Going- In Costs Village on Sixth Marshall University 7.6 248 752 $ 25,600 17,628 $ $ 27,300 (2) Edwards Portfolio: Newtown Crossing (3) University of Kentucky 1.6 332 858 32,431 Olde Towne University Square University of Toledo 1.6 224 550 20,997 Peninsular Place Eastern Michigan University 1.6 184 479 17,251 Total Edwards Portfolio 740 1,887 102,000 $ 70,679 105,700 (4) Total - 4 properties 988 2,639 127,600 $ 88,307 $ $ 133,000 (1) (2) (3) (4) Includes transaction costs of approximately $1.2 million as well as $2.3 million of anticipated capital expenditures and $0.2 million of estimated initial integration expenses necessary to bring the properties up to our operating standards. Represents debt balance on acquisition date. Excludes net debt discounts of $0.2 million recorded to reflect the market value of debt assumed. Includes transaction costs of approximately $0.4 million as well as $1.2 million of anticipated capital expenditures and $0.1 million of estimated initial integration expenses necessary to bring the properties up to our operating standards. Excludes the pre-purchase of an additional phase containing 84 beds currently under construction for $4.6 million, subject to the satisfaction of certain conditions. The completion of the additional phase is expected in August 2007. 13
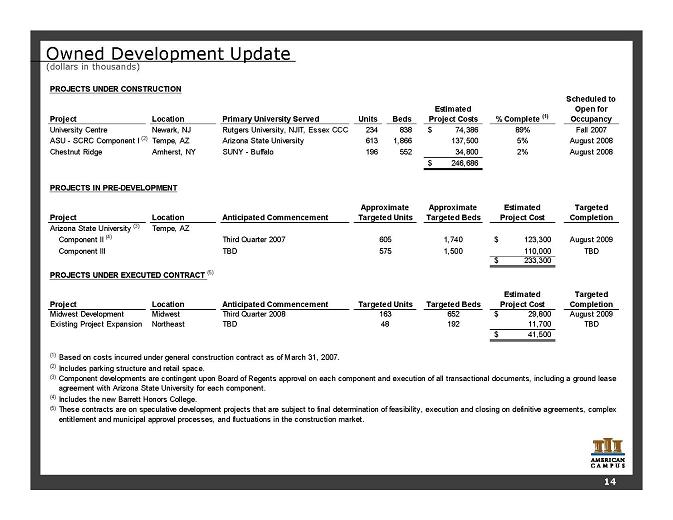
Owned Development Update (dollars in thousands) 14 PROJECTS UNDER CONSTRUCTION Location Primary University Served Units Beds Estimated Project Costs % Complete (1) Scheduled to Open for Occupancy University Centre Newark, NJ Rutgers University, NJIT, Essex CCC 234 838 74,386 $ 89% Fall 2007 ASU - SCRC Component I (2) Tempe, AZ Arizona State University 613 1,866 137,500 5% August 2008 Chestnut Ridge Amherst, NY SUNY - Buffalo 196 552 34,800 2% August 2008 246,686 $ PROJECTS IN PRE-DEVELOPMENT Location Anticipated Commencement Approximate Targeted Beds Estimated Project Cost Targeted Completion Tempe, AZ Component II (4) Third Quarter 2007 1,740 123,300 $ August 2009 Component III TBD 1,500 110,000 TBD 233,300 $ PROJECTS UNDER EXECUTED CONTRACT (5) Location Anticipated Commencement Targeted Beds Estimated Project Cost Targeted Completion Midwest Development Midwest Third Quarter 2008 652 29,800 $ August 2009 Existing Project Expansion Northeast TBD 192 11,700 TBD 41,500 $ (1) (2) (3) (4) (5) Project Component developments are contingent upon Board of Regents approval on each component and execution of all transactional documents, including a ground lease agreement with Arizona State University for each component. Project Approximate Targeted Units Arizona State University (3) These contracts are on speculative development projects that are subject to final determination of feasibility, execution and closing on definitive agreements, complex entitlement and municipal approval processes, and fluctuations in the construction market. 605 575 Based on costs incurred under general construction contract as of March 31, 2007. Project Targeted Units 163 Includes parking structure and retail space. Includes the new Barrett Honors College. 48
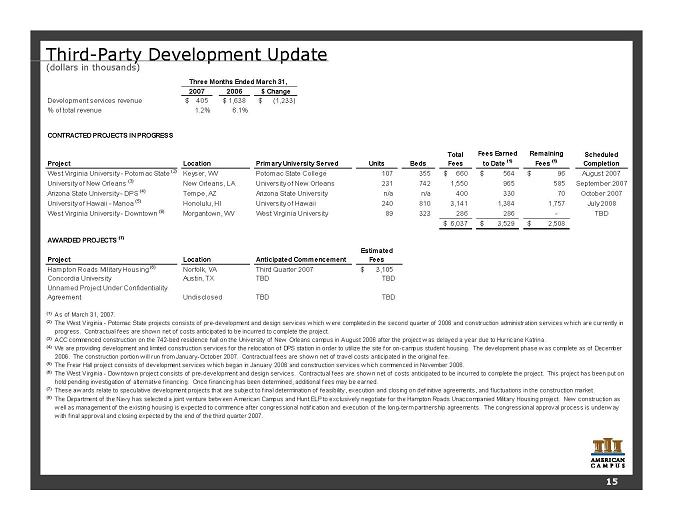
Third-Party Development Update (dollars in thousands) 2007 2006 $ Change Development services revenue 405 $ 1,638 $ (1,233) $ % of total revenue 1.2% 6.1% CONTRACTED PROJECTS IN PROGRESS Project Units Beds Total Fees Fees Earned to Date (1) Remaining Fees (1) Scheduled Completion West Virginia University - Potomac State (2) 107 355 660 $ 564 $ 96 $ August 2007 University of New Orleans (3) 231 742 1,550 965 585 September 2007 Arizona State University - DPS (4) Tempe, AZ Arizona State University n/a n/a 400 330 70 October 2007 University of Hawaii - Manoa (5) 240 810 3,141 1,384 1,757 July 2008 West Virginia University - Downtown (6) 89 323 286 286 - TBD 6,037 $ 3,529 $ 2,508 $ AWARDED PROJECTS (7) Project Estimated Fees Hampton Roads Military Housing (8) 3,105 $ Concordia University Austin, TX TBD TBD Undisclosed TBD TBD (1) (2) (3) (4) (5) (6) (7) (8) The Department of the Navy has selected a joint venture betw een American Campus and Hunt ELP to exclusively negotiate for the Hampton Roads Unaccompanied Military Housing project. New construction as w ell as management of the existing housing is expected to commence after congressional notification and execution of the long-term partnership agreements. The congressional approval process is underw ay w ith final approval and closing expected by the end of the third quarter 2007. The West Virginia - Dow ntow n project consists of pre-development and design services. Contractual fees are show n net of costs anticipated to be incurred to complete the project. This project has been put on hold pending investigation of alternative financing. Once financing has been determined, additional fees may be earned. The Frear Hall project consists of development services w hich began in January 2006 and construction services w hich commenced in November 2006. ACC commenced construction on the 742-bed residence hall on the University of New Orleans campus in August 2006 after the project w as delayed a year due to Hurricane Katrina. We are providing development and limited construction services for the relocation of DPS station in order to utilize the site for on-campus student housing. The development phase w as complete as of December 2006. The construction portion w ill run from January-October 2007. Contractual fees are show n net of travel costs anticipated in the original fee. These aw ards relate to speculative development projects that are subject to final determination of feasibility, execution and closing on definitive agreements, and fluctuations in the construction market. Third Quarter 2007 As of March 31, 2007. The West Virginia - Potomac State projects consists of pre-development and design services w hich w ere completed in the second quarter of 2006 and construction administration services w hich are currently in progress. Contractual fees are show n net of costs anticipated to be incurred to complete the project. Norfolk, VA Unnamed Project Under Confidentiality Agreement Three Months Ended March 31, Location Primary University Served West Virginia University University of Hawaii Location Anticipated Commencement New Orleans, LA University of New Orleans Keyser, WV Potomac State College Honolulu, HI Morgantown, WV 15
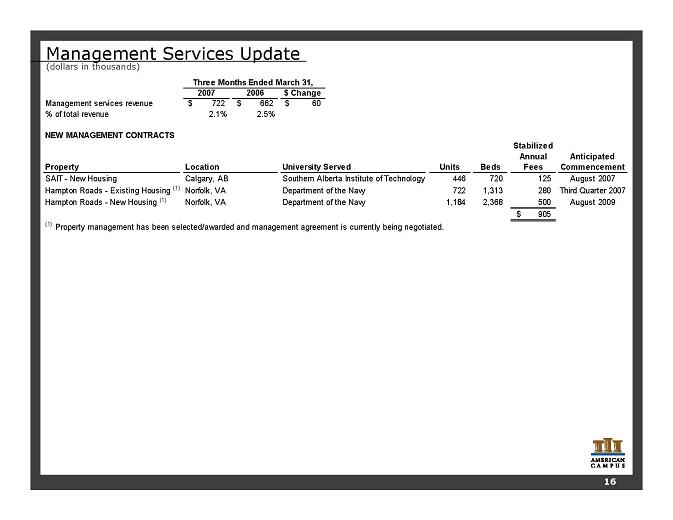
Management Services Update (dollars in thousands) 16 2007 2006 $ Change Management services revenue 722 $ 662 $ 60 $ % of total revenue 2.1% 2.5% NEW MANAGEMENT CONTRACTS Property Units Beds Stabilized Annual Fees Anticipated Commencement SAIT - New Housing 446 720 125 August 2007 Norfolk, VA Department of the Navy 722 1,313 280 Third Quarter 2007 Hampton Roads - New Housing (1) Norfolk, VA Department of the Navy 1,184 2,368 500 August 2009 905 $ (1) Three Months Ended March 31, Location University Served Property management has been selected/awarded and management agreement is currently being negotiated. Hampton Roads - Existing Housing (1) Calgary, AB Southern Alberta Institute of Technology
Investor Information Executive Management William C. Bayless, Jr. Chief Executive Officer Brian B. Nickel Chief Financial Officer James C. Hopke Chief Investment Officer Greg A. Dow ell Chief of Operations Research Coverage Jonathan Litt / Craig Melcher Citigroup Equity Research (212) 816-0231 / (212) 816-1685 jonathan.litt@citigroup.com / craig.melcher@citigroup.com Louis Taylor / Christeen Kim Deutsche Bank - North America (212) 250-4912 / (212) 250-6771 louis.taylor@db.com / christeen.kim@db.com Craig Leupold / Andrew McCulloch Green Street Advisors (949) 940-8780 cleupold@greenstreetadvisors.com / amcculloch@greenstreetadvisors.com Anthony Paolone / Joseph Dazio J.P. Morgan Securities (212) 622-6682 / (212) 622-6416 anthony.paolone@jpmorgan.com / joseph.c.dazio@jpmorgan.com Jordan Sadler / Karin Ford KeyBanc Capital Markets (917) 368-2280 / (917) 368-2293 jsadler@keybanccm.com / kford@keybanccm.com Steve Sakw a / Bill Acheson Merrill Lynch (212) 449-0335 / (212) 449-1920 steve_sakw a@ml.com / w illiam_acheson@ml.com David Rodgers RBC Capital Markets (216) 378-7626 dave.rodgers@rbccm.com Thayne Needles Robert W. Baird & Co., Inc. (703) 821-5781 tneedles@rw baird.com Alexander Goldfarb / Heath Binder UBS Investment Research (212) 713 8602 / (212) 713 3226 Alexander.goldfarb@ubs.com / heath.binder@ubs.com Stephen Sw ett Wachovia Securities, LLC (212) 909-0954 stephen.sw ett@w achovia.com Investor Relations: Gina Cow art VP, Investor Relations and Corporate Marketing American Campus Communities, Inc. is follow ed by the analysts listed above. Please note that any opinions, estimates or forecasts regarding American Campus Communities, Inc.'s performance made by such analysts are theirs alone and do not represent the opinions, forecasts or predictions of American Campus Communities, Inc. or its management. American Campus Communities, Inc. does not by its reference above or distribution imply its endorsement of or concurrence w ith such information, conclusions or recommendations. Additional Information Corporate Headquarters: American Campus Communities, Inc. 805 Las Cimas Parkw ay, Suite 400 Austin, Texas 78746 17
Forward Looking Statements This supplemental package contains forward-looking statements, which express the current beliefs and expectations of management. Except for historical information, the matters discussed in this supplemental package are forward-looking statements and can be identified by the use of the words “anticipate,” “believe,” “expect,” “intend,” “may,” “might,” “plan,” “estimate,” “project,” “should,” “will,” “result” and similar expressions. Such statements are based on current expectations and involve a number of known and unknown risks and uncertainties that could cause our future results, performance or achievements to differ significantly from the results, performance or achievements expressed or implied by such forward-looking statements. Our actual results could differ materially from those anticipated in these forward-looking statements as a result of various factors, including risks and uncertainties inherent in the national economy, the real estate industry in general, and in our specific markets; the effect of terrorism or the threat of terrorism; legislative or regulatory changes including changes to laws governing REITS; our dependence on key personnel whose continued service is not guaranteed; availability of qualified acquisition and development targets; availability of capital and financing; rising interest rates; rising insurance rates; impact of ad valorem and income taxation; changes in generally accepted accounting principals; and our continued ability to successfully lease and operate our properties. While we believe these forward-looking statements are based on reasonable assumptions, we can give no assurance that our expectations will be achieved. These forward-looking statements are made as of the date of this supplemental package, and we undertake no obligation to publicly update or revise any forward-looking statement, whether as a result of new information, future events or otherwise.