Exhibit 99.2
Supplemental Analyst Package Second Quarter 2007 Earnings Call July 31, 2007
Table of Contents Financial Highlights ________________________________________________________________________1 Consolidated Balance Sheets _______________________________________________________________3 Consolidated Statements of Operations _______________________________________________________4 Consolidated Statements of Funds from Operations _____________________________________________5 Capital Structure __________________________________________________________________________6 Portfolio Overview _________________________________________________________________________7 Property Results of Operations ______________________________________________________________9 2007/2008 Leasing Status ___________________________________________________________________10 Owned Development Update ________________________________________________________________13 Third-party Development Update _____________________________________________________________14 Management Services Update _______________________________________________________________15 Investor Information _______________________________________________________________________16
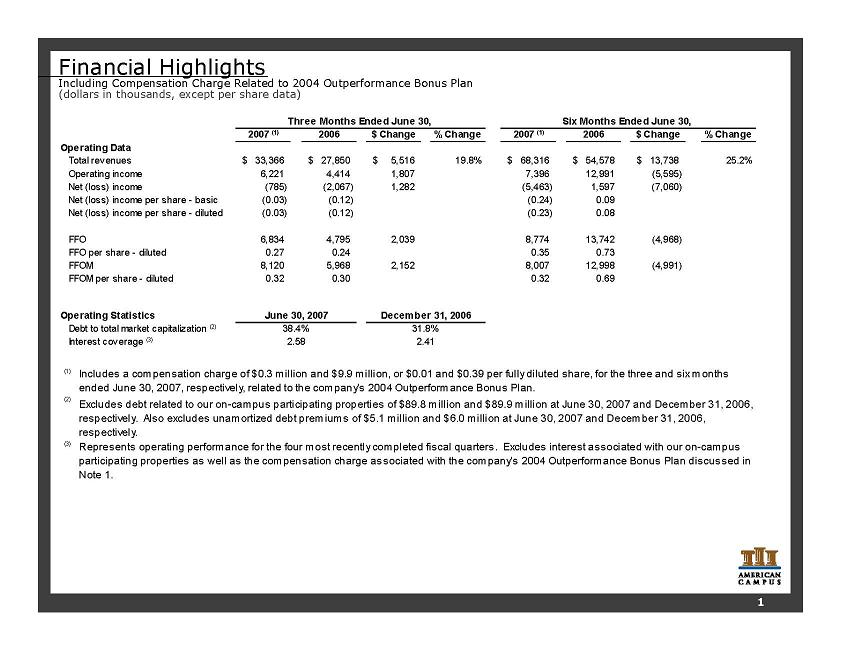
Financial Highlights Including Compensation Charge Related to 2004 Outperformance Bonus Plan (dollars in thousands, except per share data) 2007 (1) 2006 $ Change % Change 2007 (1) 2006 $ Change % Change 33,366 $ 27,850 $ 5,516 $ 19.8% 68,316 $ 54,578 $ 13,738 $ 25.2% 6,221 4,414 1,807 7,396 12,991 (5,595) (785) (2,067) 1,282 (5,463) 1,597 (7,060) Net (loss) income per share - basic (0.03) (0.12) (0.24) 0.09 Net (loss) income per share - diluted (0.03) (0.12) (0.23) 0.08 6,834 4,795 2,039 8,774 13,742 (4,968) FFO per share - diluted 0.27 0.24 0.35 0.73 8,120 5,968 2,152 8,007 12,998 (4,991) FFOM per share - diluted 0.32 0.30 0.32 0.69 (2) Excludes debt related to our on-campus participating properties of $89.8 million and $89.9 million at June 30, 2007 and December 31, 2006, respectively. Also excludes unamortized debt premiums of $5.1 million and $6.0 million at June 30, 2007 and December 31, 2006, respectively. (3) Represents operating performance for the four most recently completed fiscal quarters. Excludes interest associated with our on-campus participating properties as well as the compensation charge associated with the company's 2004 Outperformance Bonus Plan discussed in Note 1. Interest coverage (3) 2.58 2.41 (1) Includes a compensation charge of $0.3 million and $9.9 million, or $0.01 and $0.39 per fully diluted share, for the three and six months ended June 30, 2007, respectively, related to the company's 2004 Outperformance Bonus Plan. Operating Statistics June 30, 2007 December 31, 2006 Debt to total market capitalization (2) 38.4% 31.8% Three Months Ended June 30, Six Months Ended June 30, Operating Data Total revenues Operating income Net (loss) income FFO FFOM 1
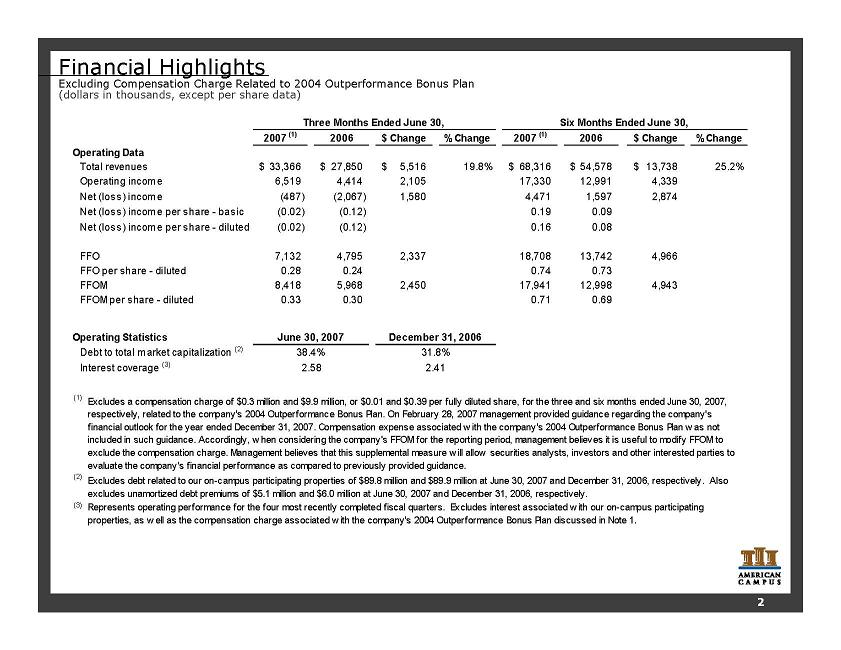
Financial Highlights Excluding Compensation Charge Related to 2004 Outperformance Bonus Plan (dollars in thousands, except per share data) 2007 (1) 2006 $ Change % Change 2007 (1) 2006 $ Change % Change 33,366 $ 27,850 $ 5,516 $ 19.8% 68,316 $ 54,578 $ 13,738 $ 25.2% 6,519 4,414 2,105 17,330 12,991 4,339 (487) (2,067) 1,580 4,471 1,597 2,874 Net (loss) income per share - basic (0.02) (0.12) 0.19 0.09 Net (loss) income per share - diluted (0.02) (0.12) 0.16 0.08 7,132 4,795 2,337 18,708 13,742 4,966 FFO per share - diluted 0.28 0.24 0.74 0.73 8,418 5,968 2,450 17,941 12,998 4,943 FFOM per share - diluted 0.33 0.30 0.71 0.69 (2) Excludes debt related to our on-campus participating properties of $89.8 million and $89.9 million at June 30, 2007 and December 31, 2006, respectively. Also excludes unamortized debt premiums of $5.1 million and $6.0 million at June 30, 2007 and December 31, 2006, respectively. (3) Represents operating performance for the four most recently completed fiscal quarters. Excludes interest associated w ith our on-campus participating properties, as w ell as the compensation charge associated w ith the company's 2004 Outperformance Bonus Plan discussed in Note 1. Interest coverage (3) 2.58 2.41 (1) Excludes a compensation charge of $0.3 million and $9.9 million, or $0.01 and $0.39 per fully diluted share, for the three and six months ended June 30, 2007, respectively, related to the company's 2004 Outperformance Bonus Plan. On February 28, 2007 management provided guidance regarding the company's financial outlook for the year ended December 31, 2007. Compensation expense associated w ith the company's 2004 Outperformance Bonus Plan w as not included in such guidance. Accordingly, w hen considering the company's FFOM for the reporting period, management believes it is useful to modify FFOM to exclude the compensation charge. Management believes that this supplemental measure w ill allow securities analysts, investors and other interested parties to evaluate the company's financial performance as compared to previously provided guidance. Operating Statistics June 30, 2007 December 31, 2006 Debt to total market capitalization (2) 38.4% 31.8% Three Months Ended June 30, Operating Data Total revenues Six Months Ended June 30, Operating income Net (loss) income FFO FFOM 2
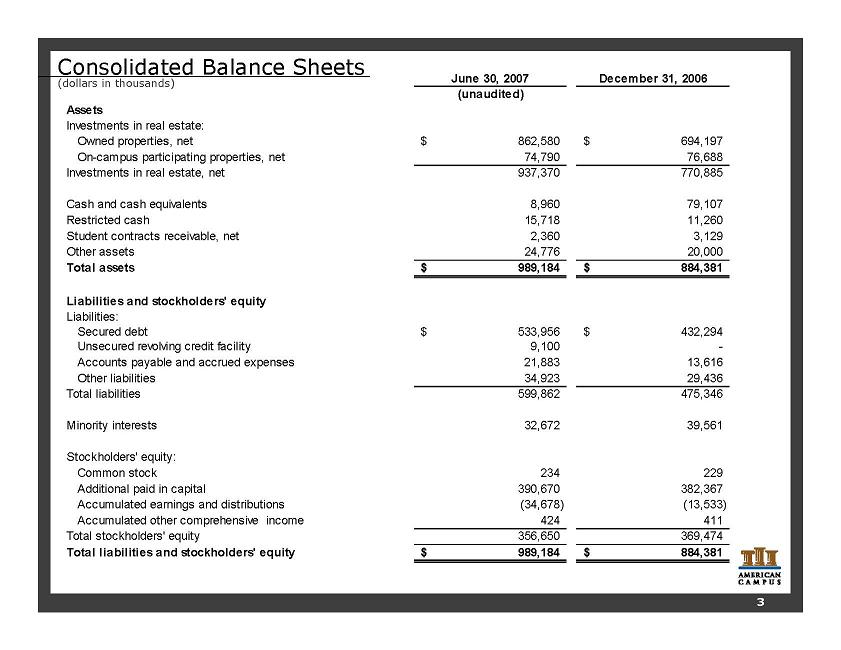
Consolidated Balance Sheets (dollars in thousands) 3 June 30, 2007 December 31, 2006 (unaudited) Assets Investments in real estate: Owned properties, net 862,580 $ 694,197 $ On-campus participating properties, net 74,790 76,688 Investments in real estate, net 937,370 770,885 Cash and cash equivalents 8,960 79,107 Restricted cash 15,718 11,260 Student contracts receivable, net 2,360 3,129 Other assets 24,776 20,000 Total assets 989,184 $ 884,381 $ Liabilities and stockholders' equity Liabilities: Secured debt 533,956 $ 432,294 $ Unsecured revolving credit facility 9,100 - Accounts payable and accrued expenses 21,883 13,616 Other liabilities 34,923 29,436 Total liabilities 599,862 475,346 Minority interests 32,672 39,561 Stockholders' equity: Common stock 234 229 Additional paid in capital 390,670 382,367 Accumulated earnings and distributions (34,678) (13,533) Accumulated other comprehensive income 424 411 Total stockholders' equity 356,650 369,474 Total liabilities and stockholders' equity 989,184 $ 884,381 $
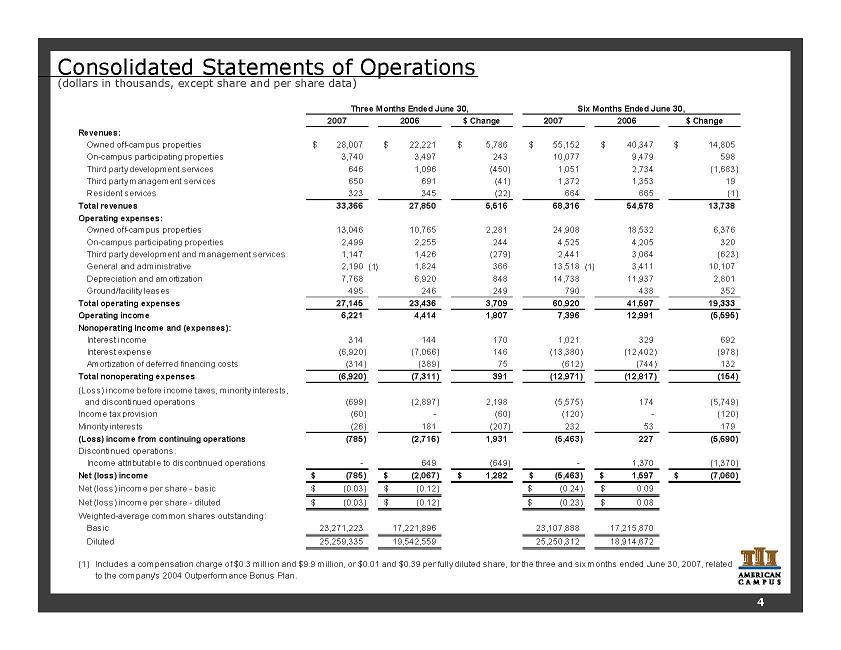
Consolidated Statements of Operations (dollars in thousands, except share and per share data) 2007 2006 $ Change 2007 2006 $ Change Revenues: Owned off-campus properties 28,007 $ 22,221 $ 5,786 $ 55,152 $ 40,347 $ 14,805 $ On-campus participating properties 3,740 3,497 243 10,077 9,479 598 Third party development services 646 1,096 (450) 1,051 2,734 (1,683) Third party management services 650 691 (41) 1,372 1,353 19 Resident services 323 345 (22) 664 665 (1) Total revenues 33,366 27,850 5,516 68,316 54,578 13,738 Operating expenses: Owned off-campus properties 13,046 10,765 2,281 24,908 18,532 6,376 On-campus participating properties 2,499 2,255 244 4,525 4,205 320 Third party development and management services 1,147 1,426 (279) 2,441 3,064 (623) General and administrative 2,190 (1) 1,824 366 13,518 (1) 3,411 10,107 Depreciation and amortization 7,768 6,920 848 14,738 11,937 2,801 Ground/facility leases 495 246 249 790 438 352 Total operating expenses 27,145 23,436 3,709 60,920 41,587 19,333 Operating income 6,221 4,414 1,807 7,396 12,991 (5,595) Nonoperating income and (expenses): Interest income 314 144 170 1,021 329 692 Interest expense (6,920) (7,066) 146 (13,380) (12,402) (978) Amortization of deferred financing costs (314) (389) 75 (612) (744) 132 Total nonoperating expenses (6,920) (7,311) 391 (12,971) (12,817) (154) (699) (2,897) 2,198 (5,575) 174 (5,749) Income tax provision (60) - (60) (120) - (120) Minority interests (26) 181 (207) 232 53 179 (Loss) income from continuing operations (785) (2,716) 1,931 (5,463) 227 (5,690) Discontinued operations: Income attributable to discontinued operations - 649 (649) - 1,370 (1,370) Net (loss) income (785) $ (2,067) $ 1,282 $ (5,463) $ 1,597 $ (7,060) $ Net (loss) income per share - basic (0.03) $ (0.12) $ (0.24) $ 0.09 $ Net (loss) income per share - diluted (0.03) $ (0.12) $ (0.23) $ 0.08 $ Weighted-average common shares outstanding: Basic 23,271,223 17,221,896 23,107,888 17,215,870 Diluted 25,259,335 19,542,559 25,250,312 18,914,672 (1) Three Months Ended June 30, Six Months Ended June 30, (Loss) income before income taxes, minority interests, and discontinued operations Includes a compensation charge of $0.3 million and $9.9 million, or $0.01 and $0.39 per fully diluted share, for the three and six months ended June 30, 2007, related to the company's 2004 Outperformance Bonus Plan. 4
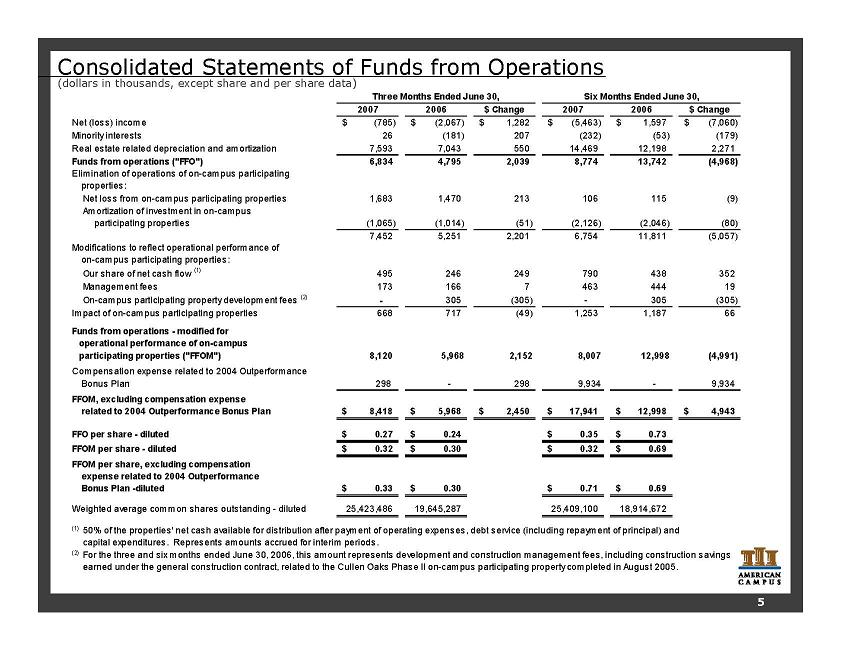
Consolidated Statements of Funds from Operations (dollars in thousands, except share and per share data) 2007 2006 $ Change 2007 2006 $ Change Net (loss) income (785) $ (2,067) $ 1,282 $ (5,463) $ 1,597 $ (7,060) $ Minority interests 26 (181) 207 (232) (53) (179) Real estate related depreciation and amortization 7,593 7,043 550 14,469 12,198 2,271 Funds from operations ("FFO") 6,834 4,795 2,039 8,774 13,742 (4,968) Net loss from on-campus participating properties 1,683 1,470 213 106 115 (9) Amortization of investment in on-campus participating properties (1,065) (1,014) (51) (2,126) (2,046) (80) 7,452 5,251 2,201 6,754 11,811 (5,057) Our share of net cash flow (1) 495 246 249 790 438 352 Management fees 173 166 7 463 444 19 On-campus participating property development fees (2) - 305 (305) - 305 (305) Impact of on-campus participating properties 668 717 (49) 1,253 1,187 66 8,120 5,968 2,152 8,007 12,998 (4,991) 298 - 298 9,934 - 9,934 8,418 $ 5,968 $ 2,450 $ 17,941 $ 12,998 $ 4,943 $ FFO per share - diluted 0.27 $ 0.24 $ 0.35 $ 0.73 $ FFOM per share - diluted 0.32 $ 0.30 $ 0.32 $ 0.69 $ 0.33 $ 0.30 $ 0.71 $ 0.69 $ Weighted average common shares outstanding - diluted 25,423,486 19,645,287 25,409,100 18,914,672 (1) (2) Funds from operations - modified for operational performance of on-campus participating properties ("FFOM") 50% of the properties' net cash available for distribution after payment of operating expenses, debt service (including repayment of principal) and capital expenditures. Represents amounts accrued for interim periods. For the three and six months ended June 30, 2006, this amount represents development and construction management fees, including construction savings earned under the general construction contract, related to the Cullen Oaks Phase II on-campus participating property completed in August 2005. Three Months Ended June 30, Six Months Ended June 30, Elimination of operations of on-campus participating properties: Modifications to reflect operational performance of on-campus participating properties: Compensation expense related to 2004 Outperformance Bonus Plan FFOM, excluding compensation expense related to 2004 Outperformance Bonus Plan FFOM per share, excluding compensation expense related to 2004 Outperformance Bonus Plan -diluted 5
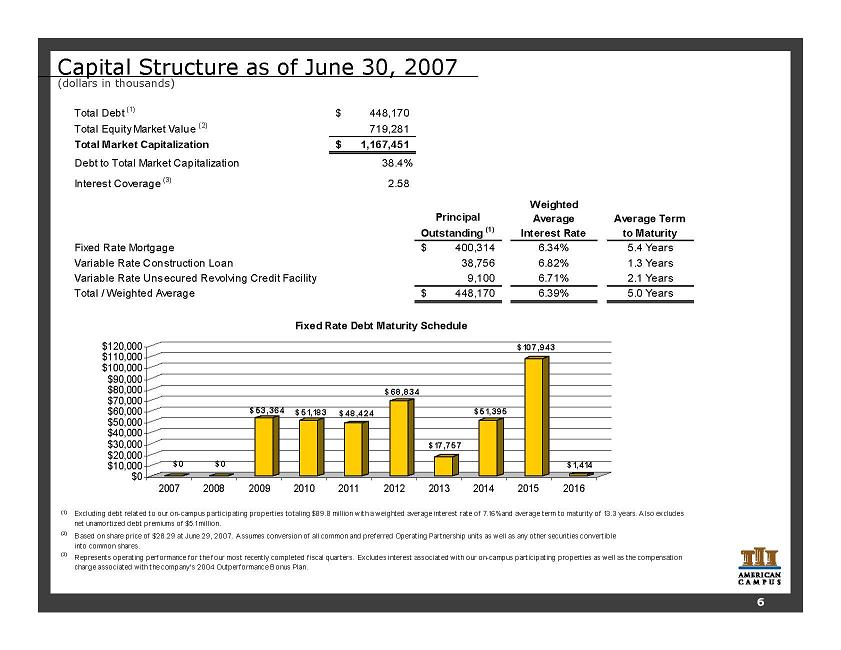
Capital Structure as of June 30, 2007 (dollars in thousands) Total Debt (1) 448,170 $ Total Equity Market Value (2) 719,281 Total Market Capitalization 1,167,451 $ Debt to Total Market Capitalization 38.4% Interest Coverage (3) 2.58 Principal Outstanding (1) Weighted Average Interest Rate Average Term to Maturity Fixed Rate Mortgage 400,314 $ 6.34% 5.4 Years Variable Rate Construction Loan 38,756 6.82% 1.3 Years Variable Rate Unsecured Revolving Credit Facility 9,100 6.71% 2.1 Years Total / Weighted Average 448,170 $ 6.39% 5.0 Years (1) (2) (3) Fixed Rate Debt Maturity Schedule Excluding debt related to our on-campus participating properties totaling $89.8 million with a weighted average interest rate of 7.16% and average term to maturity of 13.3 years. Also excludes net unamortized debt premiums of $5.1 million. Based on share price of $28.29 at June 29, 2007. Assumes conversion of all common and preferred Operating Partnership units as well as any other securities convertible into common shares. Represents operating performance for the four most recently completed fiscal quarters. Excludes interest associated with our on-campus participating properties as well as the compensation charge associated with the company's 2004 Outperformance Bonus Plan. $ 0 $ 0 $ 53,364 $ 51,183 $ 48,424 $ 68,834 $ 17,757 $ 51,395 $ 107,943 $ 1,414 $0 $10,000 $20,000 $30,000 $40,000 $50,000 $60,000 $70,000 $80,000 $90,000 $100,000 $110,000 $120,000 2007 2008 2009 2010 2011 2012 2013 2014 2015 2016 6
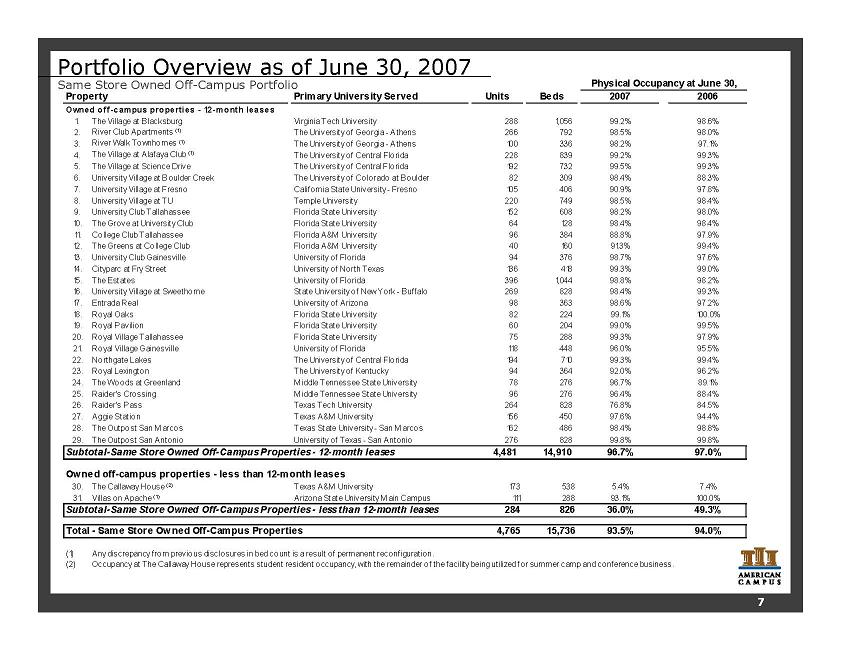
Portfolio Overview as of June 30, 2007 Same Store Owned Off-Campus Portfolio 7 Primary University Served Units Beds 2007 2006 1. The Village at Blacksburg Virginia Tech University 288 1,056 99.2% 98.6% 2. River Club Apartments (1) The University o f Georgia - A thens 266 792 98.5% 98.0% 3. River Walk Townhomes (1) The University o f Georgia - A thens 100 336 98.2% 97.1% 4. The Village at Alafaya Club (1) The University o f Central Florida 228 839 99.2% 99.3% 5. The Village at Science Drive The University o f Central Florida 192 732 99.5% 99.3% 6. University Village at Boulder Creek The University o f Colorado at Boulder 82 309 98.4% 88.3% 7. University Village at Fresno California State University - Fresno 105 406 90.9% 97.8% 8. University Village at TU Temple University 220 749 98.5% 98.4% 9. University Club Tallahassee Flo rida State University 152 608 98.2% 98.0% 10. The Grove at University Club Florida State University 64 128 98.4% 98.4% 11. College Club Tallahassee Flo rida A&M University 96 384 88.8% 97.9% 12. The Greens at College Club Florida A&M University 40 160 91.3% 99.4% 13. University Club Gainesville University of Florida 94 376 98.7% 97.6% 14. Cityparc at Fry Street University of North Texas 136 418 99.3% 99.0% 15. The Estates University of Florida 396 1,044 98.8% 98.2% 16. University Village at Sweethome State University o f New York - Buffalo 269 828 98.4% 99.3% 17. Entrada Real University of Arizona 98 363 98.6% 97.2% 18. Royal Oaks Florida State University 82 224 99.1% 100.0% 19. Royal Pavilion Florida State University 60 204 99.0% 99.5% 20. Royal Village Tallahassee Flo rida State University 75 288 99.3% 97.9% 21. Royal Village Gainesville University of Florida 118 448 96.0% 95.5% 22. Northgate Lakes The University o f Central Florida 194 710 99.3% 99.4% 23. Royal Lexington The University o f Kentucky 94 364 92.0% 96.2% 24. The Woods at Greenland Middle Tennessee State University 78 276 96.7% 89.1% 25. Raider's Crossing Middle Tennessee State University 96 276 96.4% 88.4% 26. Raider's Pass Texas Tech University 264 828 76.8% 84.5% 27. Aggie Station Texas A&M University 156 450 97.6% 94.4% 28. The Outpost San Marcos Texas State University - San M arcos 162 486 98.4% 98.8% 29. The Outpost San Antonio University of Texas - San Antonio 276 828 99.8% 99.8% 4,481 14,910 96.7% 97.0% Owned off-campus properties - less than 12-month leases 30. The Callaway House (2) Texas A&M University 173 538 5.4% 7.4% 31. Villas on Apache (1) Arizona State University M ain Campus 111 288 93.1% 100.0% Subtotal-Same Store Owned Off-Campus Properties - less than 12-month leases 284 826 36.0% 49.3% Total - Same Store Owned Off-Campus Properties 4,765 15,736 93.5% 94.0% (1) Any discrepancy from previous disclosures in bed count is a result of permanent reconfiguration. (2) Occupancy at The Callaway House represents student resident occupancy, with the remainder o f the facility being utilized for summer camp and conference business. Physical Occupancy at June 30, Property Subtotal-Same Store Owned Off-Campus Properties - 12-month leases Owned o ff-campus properties - 12-month leases
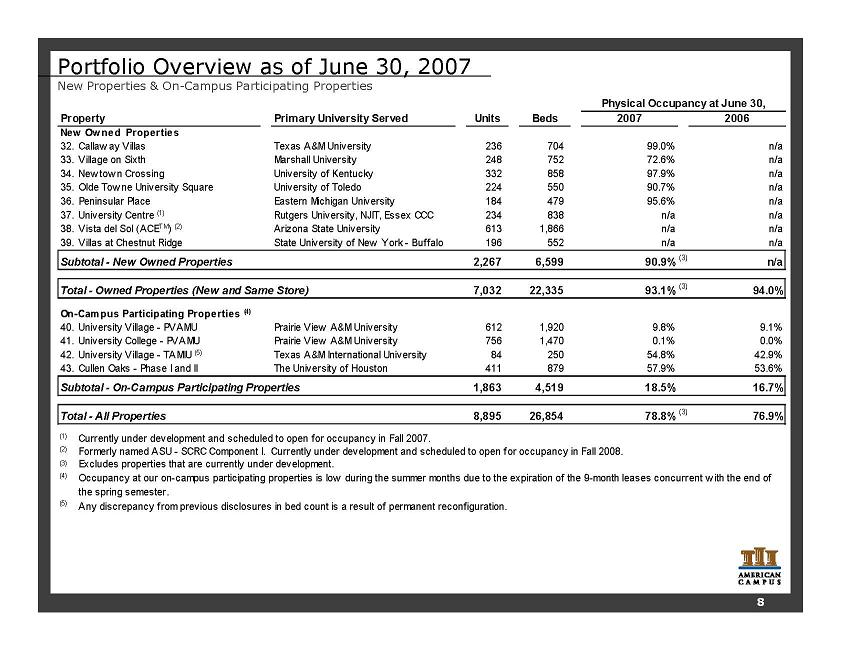
Portfolio Overview as of June 30, 2007 New Properties & On-Campus Participating Properties 8 Primary University Served Units Beds 2007 2006 32. Callaw ay Villas Texas A&M University 236 704 99.0% n/a 33. Village on Sixth Marshall University 248 752 72.6% n/a 34. New tow n Crossing University of Kentucky 332 858 97.9% n/a 35. Olde Tow ne University Square University of Toledo 224 550 90.7% n/a 36. Peninsular Place Eastern Michigan University 184 479 95.6% n/a 37. University Centre (1) Rutgers University, NJIT, Essex CCC 234 838 n/a n/a 38. Vista del Sol (ACETM) (2) Arizona State University 613 1,866 n/a n/a 39. Villas at Chestnut Ridge State University of New York - Buffalo 196 552 n/a n/a 2,267 6,599 90.9%(3) n/a 7,032 22,335 93.1%(3) 94.0% 40. University Village - PVAMU Prairie View A&M University 612 1,920 9.8% 9.1% 41. University College - PVAMU Prairie View A&M University 756 1,470 0.1% 0.0% 42. University Village - TAMIU (5) Texas A&M International University 84 250 54.8% 42.9% 43. Cullen Oaks - Phase I and II The University of Houston 411 879 57.9% 53.6% 1,863 4,519 18.5% 16.7% 8,895 26,854 78.8%(3) 76.9% (1) Currently under development and scheduled to open for occupancy in Fall 2007. (2) Formerly named ASU - SCRC Component I. Currently under development and scheduled to open for occupancy in Fall 2008. (3) Excludes properties that are currently under development. (4) (5) Any discrepancy from previous disclosures in bed count is a result of permanent reconfiguration. Physical Occupancy at June 30, Property Subtotal - New Owned Properties New Owned Properties Total - Owned Properties (New and Same Store) On-Campus Participating Properties (4) Subtotal - On-Campus Participating Properties Total - All Properties Occupancy at our on-campus participating properties is low during the summer months due to the expiration of the 9-month leases concurrent w ith the end of the spring semester.
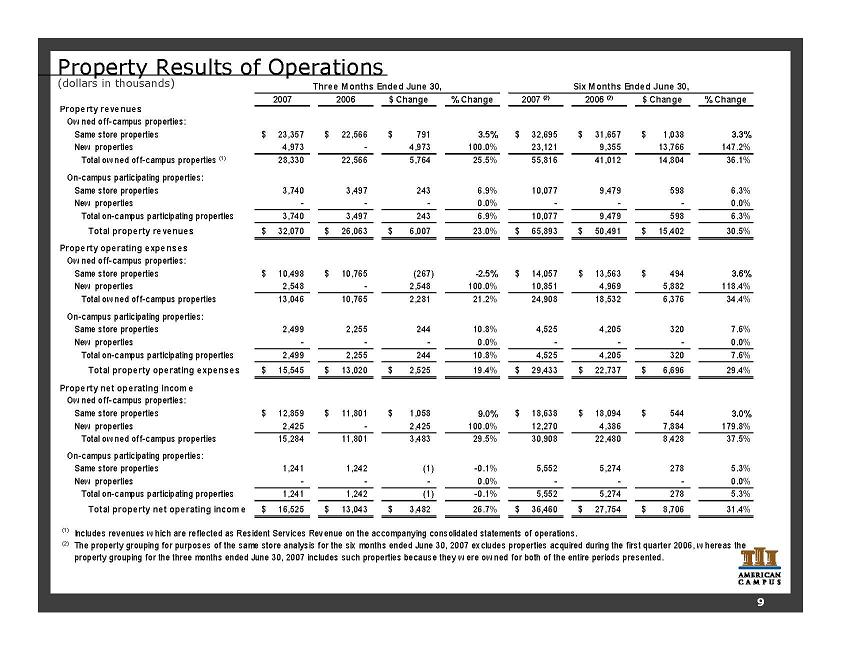
Property Results of Operations (dollars in thousands) 2007 2006 $ Change % Change 2007 (2) 2006 (2) $ Change % Change Property revenues Ow ned off-campus properties: Same store properties 23,357 $ 22,566 $ 791 $ 3.5% 32,695 $ 31,657 $ 1,038 $ 3.3% New properties 4,973 - 4,973 100.0% 23,121 9,355 13,766 147.2% Total ow ned off-campus properties (1) 28,330 22,566 5,764 25.5% 55,816 41,012 14,804 36.1% On-campus participating properties: Same store properties 3,740 3,497 243 6.9% 10,077 9,479 598 6.3% New properties - - - 0.0% - - - 0.0% Total on-campus participating properties 3,740 3,497 243 6.9% 10,077 9,479 598 6.3% Total property revenues 32,070 $ 26,063 $ 6,007 $ 23.0% 65,893 $ 50,491 $ 15,402 $ 30.5% Property operating expenses Ow ned off-campus properties: Same store properties 10,498 $ 10,765 $ (267) -2.5% 14,057 $ 13,563 $ 494 $ 3.6% New properties 2,548 - 2,548 100.0% 10,851 4,969 5,882 118.4% Total ow ned off-campus properties 13,046 10,765 2,281 21.2% 24,908 18,532 6,376 34.4% On-campus participating properties: Same store properties 2,499 2,255 244 10.8% 4,525 4,205 320 7.6% New properties - - - 0.0% - - - 0.0% Total on-campus participating properties 2,499 2,255 244 10.8% 4,525 4,205 320 7.6% Total property operating expenses 15,545 $ 13,020 $ 2,525 $ 19.4% 29,433 $ 22,737 $ 6,696 $ 29.4% Property net operating income Ow ned off-campus properties: Same store properties 12,859 $ 11,801 $ 1,058 $ 9.0% 18,638 $ 18,094 $ 544 $ 3.0% New properties 2,425 - 2,425 100.0% 12,270 4,386 7,884 179.8% Total ow ned off-campus properties 15,284 11,801 3,483 29.5% 30,908 22,480 8,428 37.5% On-campus participating properties: Same store properties 1,241 1,242 (1) -0.1% 5,552 5,274 278 5.3% New properties - - - 0.0% - - - 0.0% Total on-campus participating properties 1,241 1,242 (1) -0.1% 5,552 5,274 278 5.3% Total property net operating income 16,525 $ 13,043 $ 3,482 $ 26.7% 36,460 $ 27,754 $ 8,706 $ 31.4% (1) (2) Three Months Ended June 30, Six Months Ended June 30, Includes revenues w hich are reflected as Resident Services Revenue on the accompanying consolidated statements of operations. The property grouping for purposes of the same store analysis for the six months ended June 30, 2007 excludes properties acquired during the first quarter 2006, w hereas the property grouping for the three months ended June 30, 2007 includes such properties because they w ere ow ned for both of the entire periods presented. 9
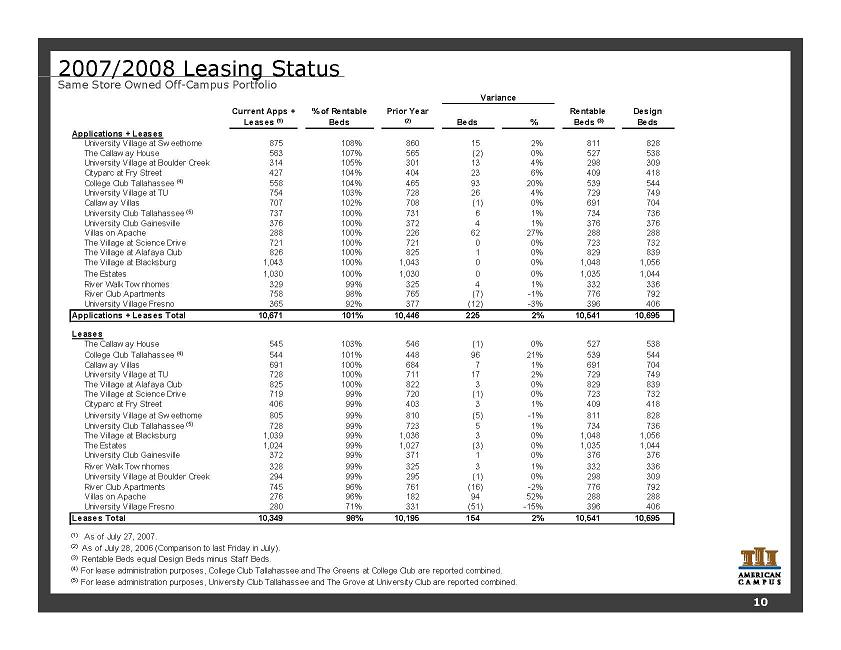
Current Apps + Leases (1) % of Rentable Beds Prior Year (2) Beds % Rentable Beds (3) Design Beds Applications + Leases University Village at Sw eethome 875 108% 860 15 2% 811 828 The Callaw ay House 563 107% 565 (2) 0% 527 538 University Village at Boulder Creek 314 105% 301 13 4% 298 309 Cityparc at Fry Street 427 104% 404 23 6% 409 418 College Club Tallahassee (4) 558 104% 465 93 20% 539 544 University Village at TU 754 103% 728 26 4% 729 749 Callaw ay Villas 707 102% 708 (1) 0% 691 704 University Club Tallahassee (5) 737 100% 731 6 1% 734 736 University Club Gainesville 376 100% 372 4 1% 376 376 Villas on Apache 288 100% 226 62 27% 288 288 The Village at Science Drive 721 100% 721 0 0% 723 732 The Village at Alafaya Club 826 100% 825 1 0% 829 839 The Village at Blacksburg 1,043 100% 1,043 0 0% 1,048 1,056 The Estates 1,030 100% 1,030 0 0% 1,035 1,044 River Walk Tow nhomes 329 99% 325 4 1% 332 336 River Club Apartments 758 98% 765 (7) -1% 776 792 University Village Fresno 365 92% 377 (12) -3% 396 406 Applications + Leases Total 10,671 101% 10,446 225 2% 10,541 10,695 Leases The Callaw ay House 545 103% 546 (1) 0% 527 538 College Club Tallahassee (4) 544 101% 448 96 21% 539 544 Callaw ay Villas 691 100% 684 7 1% 691 704 University Village at TU 728 100% 711 17 2% 729 749 The Village at Alafaya Club 825 100% 822 3 0% 829 839 The Village at Science Drive 719 99% 720 (1) 0% 723 732 Cityparc at Fry Street 406 99% 403 3 1% 409 418 University Village at Sw eethome 805 99% 810 (5) -1% 811 828 University Club Tallahassee (5) 728 99% 723 5 1% 734 736 The Village at Blacksburg 1,039 99% 1,036 3 0% 1,048 1,056 The Estates 1,024 99% 1,027 (3) 0% 1,035 1,044 University Club Gainesville 372 99% 371 1 0% 376 376 River Walk Tow nhomes 328 99% 325 3 1% 332 336 University Village at Boulder Creek 294 99% 295 (1) 0% 298 309 River Club Apartments 745 96% 761 (16) -2% 776 792 Villas on Apache 276 96% 182 94 52% 288 288 University Village Fresno 280 71% 331 (51) -15% 396 406 Leases Total 10,349 98% 10,195 154 2% 10,541 10,695 (1) As of July 27, 2007. (2) As of July 28, 2006 (Comparison to last Friday in July). (3) Rentable Beds equal Design Beds minus Staff Beds. (4) For lease administration purposes, College Club Tallahassee and The Greens at College Club are reported combined. (5) For lease administration purposes, University Club Tallahassee and The Grove at University Club are reported combined. Variance 2007/2008 Leasing Status Same Store Owned Off-Campus Portfolio 10

Current Apps + Leases ( 1) % o f R entable Beds P rior Year Beds % Rentable Beds ( 2) Design Beds Applications + Leases The Outpost San Antonio 834 101% 833 1 0% 828 828 Aggie Station 451 100% 460 (9) -2% 450 450 Entrada Real 363 100% 359 4 1% 363 363 Northgate Lakes 706 99% 706 0 0% 710 710 Raider's Pass 818 99% 547 271 50% 823 828 University Village Tallahassee (3) 709 99% 690 19 3% 716 716 The Woods at Greenland 273 99% 272 1 0% 276 276 Royal Village Gainesville 440 98% 433 7 2% 448 448 Raider's Crossing 271 98% 270 1 0% 276 276 The Outpost San M arcos 447 92% 480 (33) -7% 486 486 Royal Lexington 328 90% 305 23 8% 364 364 Applications + Leases Total 5,640 98% 5,355 285 5% 5,740 5,745 Leases Aggie Station 448 100% 442 6 1% 450 450 Entrada Real 361 99% 359 2 1% 363 363 Northgate Lakes 706 99% 706 0 0% 710 710 Raider's Pass 817 99% 519 298 57% 823 828 The Outpost San Antonio 818 99% 828 (10) -1% 828 828 The Woods at Greenland 272 99% 271 1 0% 276 276 Raider's Crossing 271 98% 268 3 1% 276 276 Royal Village Gainesville 439 98% 433 6 1% 448 448 University Village Tallahassee (3) 691 97% 677 14 2% 716 716 The Outpost San M arcos 429 88% 477 (48) -10% 486 486 Royal Lexington 317 87% 301 16 5% 364 364 Leases Total 5,569 97% 5,281 288 5% 5,740 5,745 (1) As of July 27, 2007. (2) Rentable Beds equals Design Beds minus Staff Beds. (3) Formerly known as Royal Tallahassee. For lease administration purposes, Royal Oaks, Royal Pavilion, and Royal Village are reported combined. Variance 2007/2008 Leasing Status 2006 Acquisitions 11
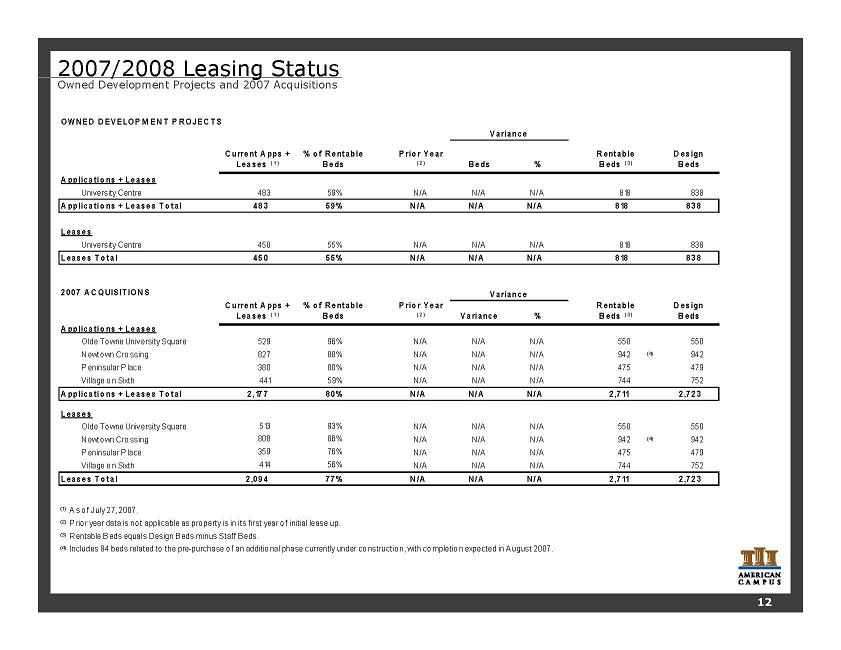
OWNED DEVELOPM ENT PROJECTS Current A pps + Leases ( 1) % o f Rentable Beds P rior Year ( 2) Beds % Rentable Beds ( 3) Design Beds Applications + Leases University Centre 483 59% N/A N/A N/A 818 838 Applications + Leases Total 483 59% N/A N/A N/A 818 838 Leases University Centre 450 55% N/A N/A N/A 818 838 Leases Total 450 55% N/A N/A N/A 818 838 2007 ACQUISITIONS Current A pps + Leases ( 1) % o f Rentable Beds P rior Year ( 2) Variance % Rentable Beds ( 3) Design Beds Applications + Leases Olde Towne University Square 529 96% N/A N/A N/A 550 550 Newtown Crossing 827 88% N/A N/A N/A 942 (4) 942 Peninsular P lace 380 80% N/A N/A N/A 475 479 Village on Sixth 441 59% N/A N/A N/A 744 752 Applications + Leases Total 2,177 80% N/A N/A N/A 2,711 2,723 Leases Olde Towne University Square 513 93% N/A N/A N/A 550 550 Newtown Crossing 808 86% N/A N/A N/A 942 (4) 942 Peninsular P lace 359 76% N/A N/A N/A 475 479 Village on Sixth 414 56% N/A N/A N/A 744 752 Leases Total 2,094 77% N/A N/A N/A 2,711 2,723 (1) A s of July 27, 2007. (2) P rior year data is not applicable as property is in its first year of initial lease up. (3) Rentable Beds equals Design Beds minus Staff Beds. (4) Includes 84 beds related to the pre-purchase of an additional phase currently under construction, with completion expected in August 2007. Variance Variance 2007/2008 Leasing Status Owned Development Projects and 2007 Acquisitions 12
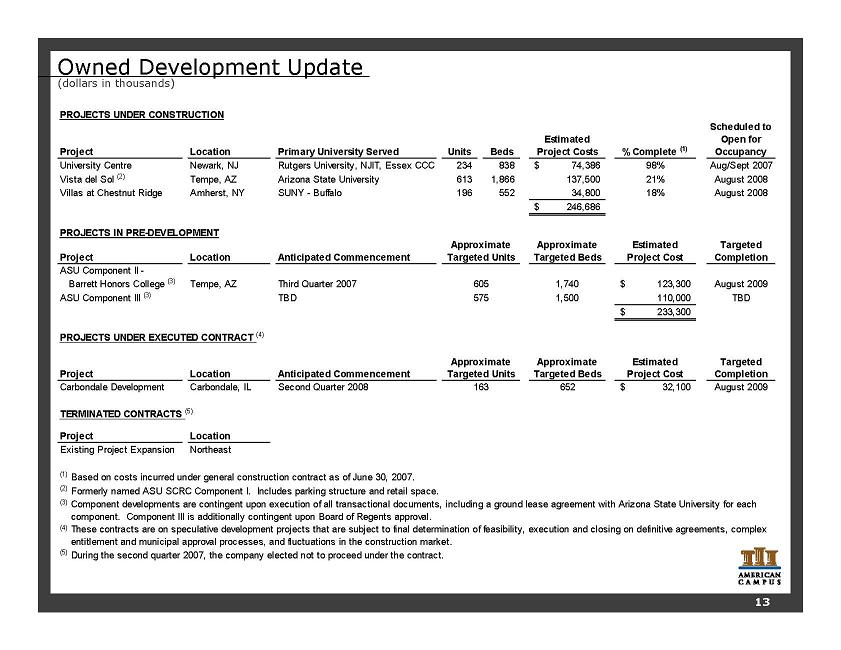
Owned Development Update (dollars in thousands) 13 PROJECTS UNDER CONSTRUCTION Location Primary University Served Units Beds Estimated Project Costs % Complete (1) Scheduled to Open for Occupancy University Centre Newark, NJ Rutgers University, NJIT, Essex CCC 234 838 74,386 $ 98% Aug/Sept 2007 Vista del Sol (2) Tempe, AZ Arizona State University 613 1,866 137,500 21% August 2008 Villas at Chestnut Ridge Amherst, NY SUNY - Buffalo 196 552 34,800 18% August 2008 246,686 $ PROJECTS IN PRE-DEVELOPMENT Location Anticipated Commencement Approximate Targeted Beds Estimated Project Cost Targeted Completion Tempe, AZ Third Quarter 2007 1,740 123,300 $ August 2009 ASU Component III (3) TBD 1,500 110,000 TBD 233,300 $ PROJECTS UNDER EXECUTED CONTRACT (4) Location Anticipated Commencement Approximate Targeted Beds Estimated Project Cost Targeted Completion Carbondale Development Carbondale, IL Second Quarter 2008 652 32,100 $ August 2009 TERMINATED CONTRACTS (5) Location Existing Project Expansion Northeast (1) (2) (3) (4) (5) During the second quarter 2007, the company elected not to proceed under the contract. These contracts are on speculative development projects that are subject to final determination of feasibility, execution and closing on definitive agreements, complex entitlement and municipal approval processes, and fluctuations in the construction market. 605 575 Based on costs incurred under general construction contract as of June 30, 2007. Project Approximate Targeted Units 163 Formerly named ASU SCRC Component I. Includes parking structure and retail space. Component developments are contingent upon execution of all transactional documents, including a ground lease agreement with Arizona State University for each component. Component III is additionally contingent upon Board of Regents approval. Project Project Project Approximate Targeted Units ASU Component II - Barrett Honors College (3)
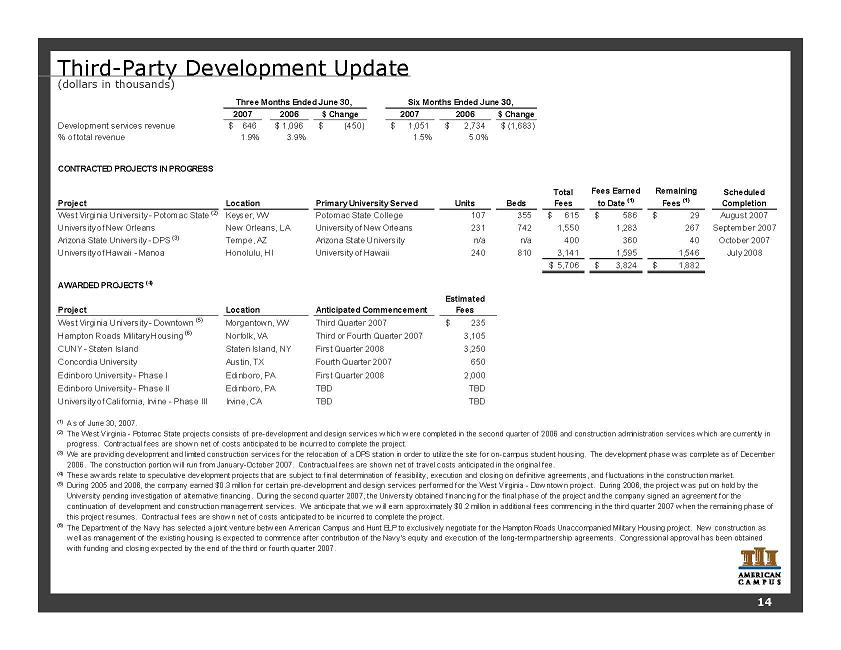
Third-Party Development Update (dollars in thousands) 2007 2006 $ Change 2007 2006 $ Change Development services revenue 646 $ 1,096 $ (450) $ 1,051 $ 2,734 $ (1,683) $ % of total revenue 1.9% 3.9% 1.5% 5.0% CONTRACTED PROJECTS IN PROGRESS Project Units Beds Total Fees Fees Earned to Date (1) Remaining Fees (1) Scheduled Completion West Virginia University - Potomac State (2) 107 355 615 $ 586 $ 29 $ August 2007 University of New Orleans 231 742 1,550 1,283 267 September 2007 Arizona State University - DPS (3) Tempe, AZ Arizona State University n/a n/a 400 360 40 October 2007 University of Hawaii - Manoa 240 810 3,141 1,595 1,546 July 2008 5,706 $ 3,824 $ 1,882 $ AWARDED PROJECTS (4) Project Estimated Fees West Virginia University - Downtown (5) Third Quarter 2007 235 $ Hampton Roads Military Housing (6) 3,105 CUNY - Staten Island Staten Island, NY First Quarter 2008 3,250 Concordia University Austin, TX Fourth Quarter 2007 650 Edinboro University - Phase I Edinboro, PA First Quarter 2008 2,000 Edinboro University - Phase II Edinboro, PA TBD TBD University of California, Irvine - Phase III Irvine, CA TBD TBD (1) (2) (3) (4) (5) (6) Morgantown, WV Keyser, WV Potomac State College Honolulu, HI Three Months Ended June 30, Location Primary University Served University of Hawaii Location Six Months Ended June 30, Anticipated Commencement New Orleans, LA University of New Orleans Third or Fourth Quarter 2007 As of June 30, 2007. The West Virginia - Potomac State projects consists of pre-development and design services w hich w ere completed in the second quarter of 2006 and construction administration services w hich are currently in progress. Contractual fees are show n net of costs anticipated to be incurred to complete the project. Norfolk, VA The Department of the Navy has selected a joint venture betw een American Campus and Hunt ELP to exclusively negotiate for the Hampton Roads Unaccompanied Military Housing project. New construction as w ell as management of the existing housing is expected to commence after contribution of the Navy's equity and execution of the long-term partnership agreements. Congressional approval has been obtained w ith funding and closing expected by the end of the third or fourth quarter 2007. We are providing development and limited construction services for the relocation of a DPS station in order to utilize the site for on-campus student housing. The development phase w as complete as of December 2006. The construction portion w ill run from January-October 2007. Contractual fees are show n net of travel costs anticipated in the original fee. These aw ards relate to speculative development projects that are subject to final determination of feasibility, execution and closing on definitive agreements, and fluctuations in the construction market. During 2005 and 2006, the company earned $0.3 million for certain pre-development and design services performed for the West Virginia - Dow ntow n project. During 2006, the project w as put on hold by the University pending investigation of alternative financing. During the second quarter 2007, the University obtained financing for the final phase of the project and the company signed an agreement for the continuation of development and construction management services. We anticipate that w e w ill earn approximately $0.2 million in additional fees commencing in the third quarter 2007 w hen the remaining phase of this project resumes. Contractual fees are show n net of costs anticipated to be incurred to complete the project. 14
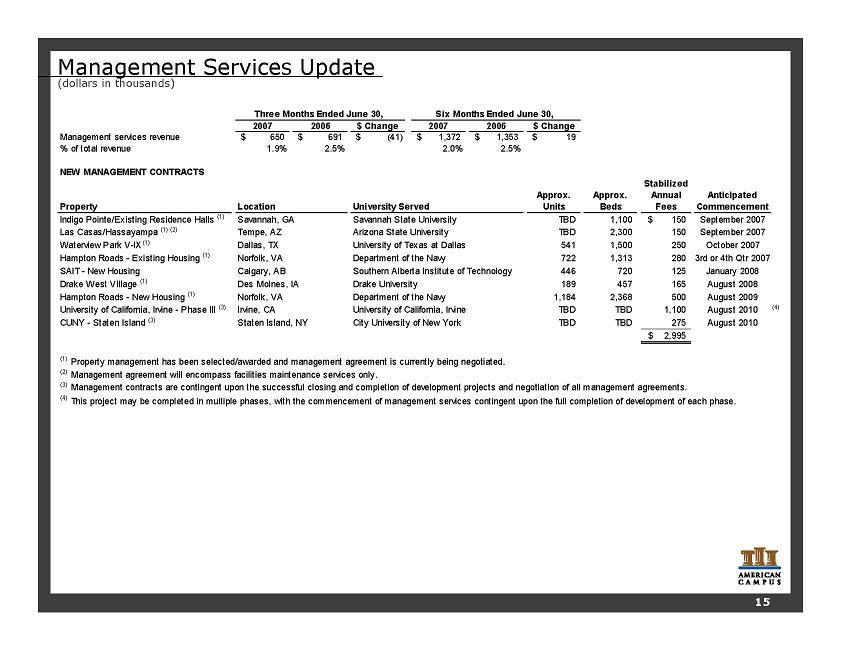
Management Services Update (dollars in thousands) 15 2007 2006 $ Change 2007 2006 $ Change Management services revenue 650 $ 691 $ (41) $ 1,372 $ 1,353 $ 19 $ % of total revenue 1.9% 2.5% 2.0% 2.5% NEW MANAGEMENT CONTRACTS Property Approx. Units Approx. Beds Stabilized Annual Fees Anticipated Commencement Indigo Pointe/Existing Residence Halls (1) Savannah State University TBD 1,100 150 $ September 2007 Las Casas/Hassayampa (1) (2) Arizona State University TBD 2,300 150 September 2007 Waterview Park V-IX (1) University of Texas at Dallas 541 1,500 250 October 2007 Department of the Navy 722 1,313 280 3rd or 4th Qtr 2007 SAIT - New Housing 446 720 125 January 2008 Drake West Village (1) Drake University 189 457 165 August 2008 Hampton Roads - New Housing (1) Department of the Navy 1,184 2,368 500 August 2009 University of California, Irvine - Phase III (3) Irvine, CA University of California, Irvine TBD TBD 1,100 August 2010 (4) CUNY - Staten Island (3) Staten Island, NY City University of New York TBD TBD 275 August 2010 2,995 $ (1) Property management has been selected/awarded and management agreement is currently being negotiated. (2) Management agreement will encompass facilities maintenance services only. (3) Management contracts are contingent upon the successful closing and completion of development projects and negotiation of all management agreements. (4) This project may be completed in multiple phases, with the commencement of management services contingent upon the full completion of development of each phase. Calgary, AB Southern Alberta Institute of Technology Savannah, GA Tempe, AZ Dallas, TX Hampton Roads - Existing Housing (1) Norfolk, VA Norfolk, VA Des Moines, IA Six Months Ended June 30, Three Months Ended June 30, Location University Served
Investor Information Executive Management William C. Bayless, Jr. Chief Executive Officer Brian B. Nickel Chief Financial Officer James C. Hopke Chief Investment Officer Greg A. Dow ell Chief of Operations Research Coverage Jonathan Litt / Craig Melcher Citigroup Equity Research (212) 816-0231 / (212) 816-1685 jonathan.litt@citigroup.com / craig.melcher@citigroup.com Louis Taylor / Christeen Kim Deutsche Bank - North America (212) 250-4912 / (212) 250-6771 louis.taylor@db.com / christeen.kim@db.com Craig Leupold / Andrew McCulloch Green Street Advisors (949) 940-8780 cleupold@greenstreetadvisors.com / amcculloch@greenstreetadvisors.com Anthony Paolone / Joseph Dazio J.P. Morgan Securities (212) 622-6682 / (212) 622-6416 anthony.paolone@jpmorgan.com / joseph.c.dazio@jpmorgan.com Jordan Sadler / Karin Ford KeyBanc Capital Markets (917) 368-2280 / (917) 368-2293 jsadler@keybanccm.com / kford@keybanccm.com Steve Sakw a / Bill Acheson Merrill Lynch (212) 449-0335 / (212) 449-1920 steve_sakw a@ml.com / w illiam_acheson@ml.com David Rodgers RBC Capital Markets (216) 378-7626 dave.rodgers@rbccm.com Thayne Needles Robert W. Baird & Co., Inc. (703) 821-5781 tneedles@rw baird.com Alexander Goldfarb / Heath Binder UBS Investment Research (212) 713 8602 / (212) 713 3226 alexander.goldfarb@ubs.com / heath.binder@ubs.com Investor Relations: Gina Cow art VP, Investor Relations and Corporate Marketing (512) 732-1041 805 Las Cimas Parkw ay, Suite 400 Austin, Texas 78746 Tel: (512) 732-1000; Fax: (512) 732-2450 American Campus Communities, Inc. is follow ed by the analysts listed above. Please note that any opinions, estimates or forecasts regarding American Campus Communities, Inc.'s performance made by such analysts are theirs alone and do not represent the opinions, forecasts or predictions of American Campus Communities, Inc. or its management. American Campus Communities, Inc. does not by its reference above or distribution imply its endorsement of or concurrence w ith such information, conclusions or recommendations. Additional Information Corporate Headquarters: American Campus Communities, Inc. 16
Forward Looking Statements This supplemental package contains forward-looking statements, which express the current beliefs and expectations of management. Except for historical information, the matters discussed in this supplemental package are forward-looking statements and can be identified by the use of the words “anticipate,” “believe,” “expect,” “intend,” “may,” “might,” “plan,” “estimate,” “project,” “should,” “will,” “result” and similar expressions. Such statements are based on current expectations and involve a number of known and unknown risks and uncertainties that could cause our future results, performance or achievements to differ significantly from the results, performance or achievements expressed or implied by such forward-looking statements. Our actual results could differ materially from those anticipated in these forward-looking statements as a result of various factors, including risks and uncertainties inherent in the national economy, the real estate industry in general, and in our specific markets; the effect of terrorism or the threat of terrorism; legislative or regulatory changes including changes to laws governing REITS; our dependence on key personnel whose continued service is not guaranteed; availability of qualified acquisition and development targets; availability of capital and financing; rising interest rates; rising insurance rates; impact of ad valorem and income taxation; changes in generally accepted accounting principals; and our continued ability to successfully lease and operate our properties. While we believe these forward-looking statements are based on reasonable assumptions, we can give no assurance that our expectations will be achieved. These forward-looking statements are made as of the date of this supplemental package, and we undertake no obligation to publicly update or revise any forward-looking statement, whether as a result of new information, future events or otherwise.