Exhibit 99.3
Supplemental Analyst Package Third Quarter 2007 Earnings Call October 31, 2007 AMERICAN CAMPUS
Table of Contents Financial Highlights1 Consolidated Balance Sheets 3 Consolidated Statements of Operations 4 Consolidated Statements of Funds from Operations 5 Property Results of Operations 6 Capital Structure 7 Portfolio Overview 8 Owned Development Update 10 Third-party Development Update 11 Management Services Update 12 Investor Information 13
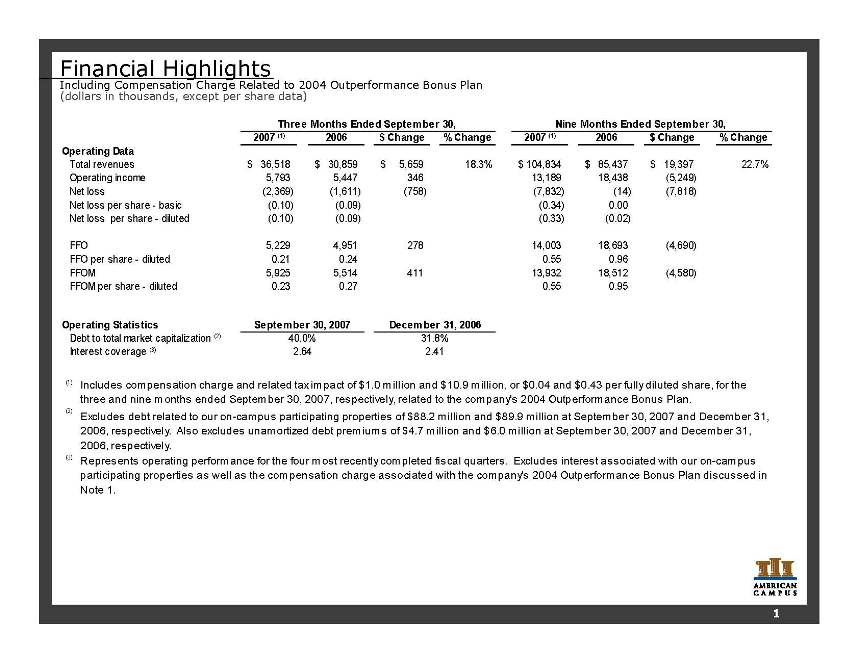
Financial Highlights Including Compensation Charge Related to 2004 Outperformance Bonus Plan (dollars in thousands, except per share data) 2007 (1) 2006 $ Change % Change 2007 (1) 2006 $ Change % Change $ 3 6,518 $ 30,859 $ 5 ,659 18.3% $ 1 04,834 $ 8 5,437 $ 19,397 22.7% 5,793 5,447 3 46 13,189 18,438 (5,249) (2,369) (1,611) (758) (7,832) (14) (7,818) Net loss per share - basic (0.10) (0.09) (0.34) 0.00 Net loss per share - diluted (0.10) (0.09) (0.33) (0.02) 5,229 4,951 2 78 14,003 18,693 (4,690) FFO per share - diluted 0.21 0.24 0.55 0.96 5,925 5,514 4 11 13,932 18,512 (4,580) FFOM per share - diluted 0.23 0.27 0.55 0.95 (2) Excludes debt related to our on-campus participating properties of $88.2 million and $89.9 million at September 30, 2007 and December 31, 2006, respectively. Also excludes unamortized debt premiums of $4.7 million and $6.0 million at September 30, 2007 and December 31, 2006, respectively. (3) Represents operating performance for the four most recently completed fiscal quarters. Excludes interest associated with our on-campus participating properties as well as the compensation charge associated with the company's 2004 Outperformance Bonus Plan discussed in Note 1. Interest coverage (3) 2.64 2.41 (1) Includes compensation charge and related tax impact of $1.0 million and $10.9 million, or $0.04 and $0.43 per fully diluted share, for the three and nine months ended September 30, 2007, respectively, related to the company's 2004 Outperformance Bonus Plan. Operating Statistics September 30, 2007 December 31, 2006 Debt to total market capitalization (2) 40.0% 31.8% Three Months Ended September 30, Nine Months Ended September 30, Operating Data Total revenues Operating income Net loss FFO FFOM 1
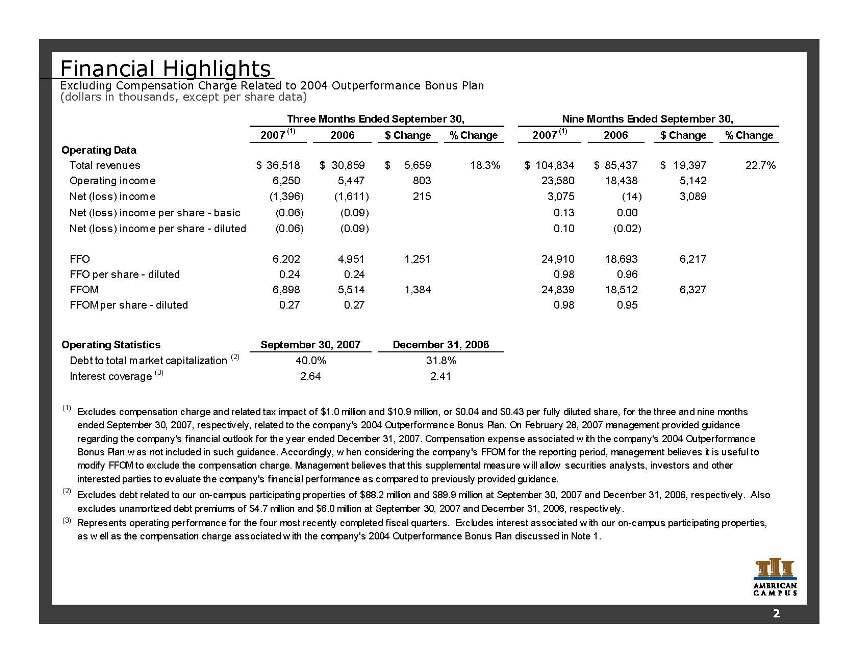
Financial Highlights Excluding Compensation Charge Related to 2004 Outperformance Bonus Plan (dollars in thousands, except per share data) 2007 (1) 2006 $ Change % Change 2007 (1) 2006 $ Change % Change $ 36,518 $ 30,859 $ 5 ,659 18.3% $ 104,834 $ 85,437 $ 19,397 22.7% 6,250 5,447 803 23,580 18,438 5,142 (1,396) (1,611) 215 3,075 (14) 3,089 Net (loss) income per share - basic (0.06) (0.09) 0.13 0.00 Net (loss) income per share - diluted (0.06) (0.09) 0.10 (0.02) 6,202 4,951 1,251 24,910 18,693 6,217 FFO per share - diluted 0.24 0.24 0.98 0.96 6,898 5,514 1,384 24,839 18,512 6,327 FFOM per share - diluted 0.27 0.27 0.98 0.95 Operating income Net (loss) income FFO FFOM Three Months Ended September 30, Operating Data Total revenues Nine Months Ended September 30, Operating Statistics September 30, 2007 December 31, 2006 Debt to total market capitalization (2) 40.0% 31.8% Interest coverage (3) 2.64 2.41 (1) Excludes compensation charge and related tax impact of $1.0 million and $10.9 million, or $0.04 and $0.43 per fully diluted share, for the three and nine months ended September 30, 2007, respectively, related to the company's 2004 Outperformance Bonus Plan. On February 28, 2007 management provided guidance regarding the company's financial outlook for the year ended December 31, 2007. Compensation expense associated w ith the company's 2004 Outperformance Bonus Plan w as not included in such guidance. Accordingly, w hen considering the company's FFOM for the reporting period, management believes it is useful to modify FFOM to exclude the compensation charge. Management believes that this supplemental measure w ill allow securities analysts, investors and other interested parties to evaluate the company's financial performance as compared to previously provided guidance. (2) Excludes debt related to our on-campus participating properties of $88.2 million and $89.9 million at September 30, 2007 and December 31, 2006, respectively. Also excludes unamortized debt premiums of $4.7 million and $6.0 million at September 30, 2007 and December 31, 2006, respectively. (3) Represents operating performance for the four most recently completed fiscal quarters. Excludes interest associated w ith our on-campus participating properties, as w ell as the compensation charge associated w ith the company's 2004 Outperformance Bonus Plan discussed in Note 1.2 2
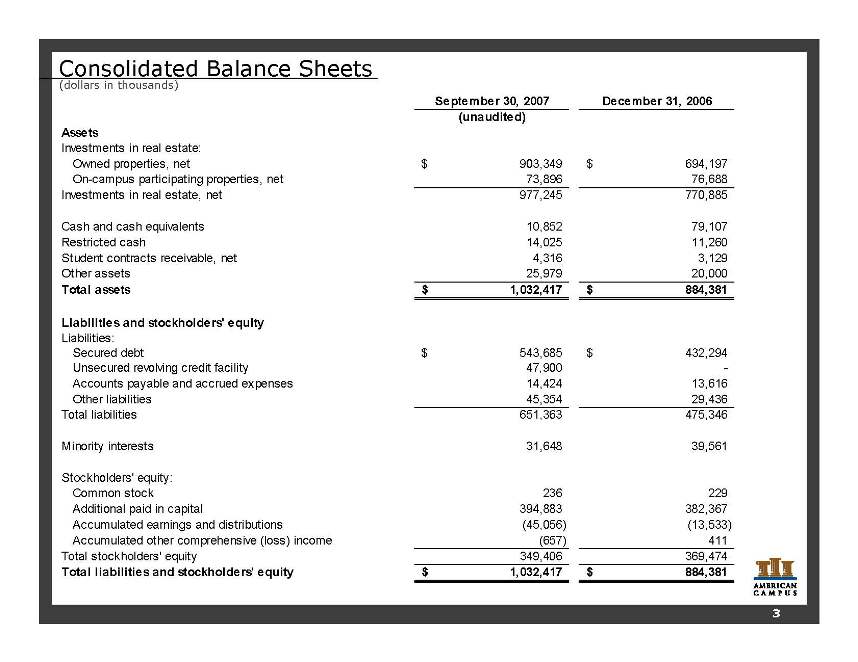
Consolidated Balance Sheets (dollars in thousands) 3 September 30, 2007 December 31, 2006 (unaudited) Assets Investments in real estate: Owned properties, net $ 9 03,349 $ 694,197 On-campus participating properties, net 73,896 76,688 Investments in real estate, net 977,245 770,885 Cash and cash equivalents 10,852 79,107 Restricted cash 14,025 11,260 Student contracts receivable, net 4,316 3,129 Other assets 25,979 20,000 Total assets $ 1 ,032,417 $ 8 84,381 Liabilities and stockholders' equity Liabilities: Secured debt $ 5 43,685 $ 432,294 Unsecured revolving credit facility 47,900 - Accounts payable and accrued expenses 14,424 13,616 Other liabilities 45,354 29,436 Total liabilities 651,363 475,346 Minority interests 31,648 39,561 Stockholders' equity: Common stock 236 229 Additional paid in capital 394,883 382,367 Accumulated earnings and distributions (45,056) (13,533) Accumulated other comprehensive (loss) income (657) 411 Total stockholders' equity 349,406 369,474 Total liabilities and stockholders' equity $ 1 ,032,417 $ 8 84,381 3
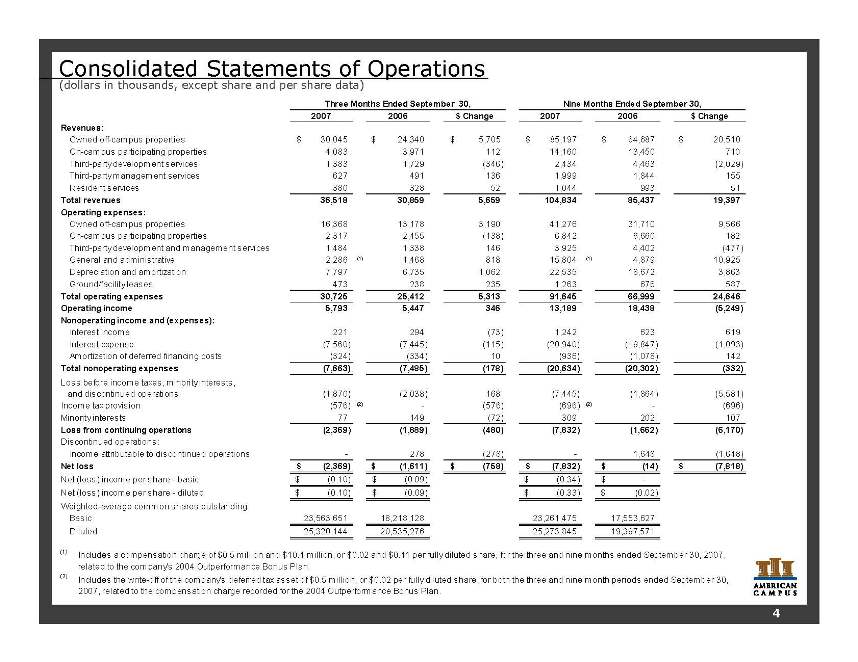
Consolidated Statements of Operations (dollars in thousands, except share and per share data) 2007 2006 $ Change 2007 2006 $ Change Revenues: Owned off-campus properties $ 3 0,045 $ 2 4,340 $ 5 ,705 $ 85,197 $ 64,687 $ 2 0,510 On-campus participating properties 4,083 3,971 112 14,160 13,450 7 10 Third-party development services 1,383 1,729 (346) 2,434 4,463 ( 2,029) Third-party management services 627 491 136 1,999 1,844 1 55 Resident services 380 328 52 1,044 993 5 1 Total revenues 36,518 30,859 5,659 104,834 85,437 19,397 Operating expenses: Owned off-campus properties 16,368 13,178 3,190 41,276 31,710 9 ,566 On-campus participating properties 2,317 2,455 (138) 6,842 6,660 1 82 Third-party development and management services 1,484 1,338 146 3,925 4,402 ( 477) General and administrative 2,286 (1) 1,468 818 15,804 (1) 4,879 1 0,925 Depreciation and amortization 7,797 6,735 1,062 22,535 18,672 3 ,863 Ground/facility leases 473 238 235 1,263 676 5 87 Total operating expenses 30,725 25,412 5,313 91,645 66,999 24,646 Operating income 5,793 5,447 346 13,189 18,438 (5,249) Nonoperating income and (expenses): Interest income 221 294 (73) 1,242 623 6 19 Interest expense (7,560) (7,445) (115) (20,940) (19,847) ( 1,093) Amortization of deferred financing costs (324) (334) 10 (936) (1,078) 1 42 Total nonoperating expenses (7,663) (7,485) (178) (20,634) (20,302) (332) (1,870) (2,038) 168 (7,445) (1,864) (5,581) Income tax provision ( 576) (2) - (576) (696) (2) - (696) Minority interests 77 149 (72) 309 202 1 07 Loss from continuing operations (2,369) (1,889) (480) (7,832) (1,662) (6,170) Discontinued operations: Income attributable to discontinued operations - 278 (278) - 1,648 (1,648) Net loss $ ( 2,369) $ ( 1,611) $ ( 758) $ (7,832) $ ( 14) $ (7,818) Net (loss) income per share - basic $ ( 0.10) $ (0.09) $ (0.34) $ - Net (loss) income per share - diluted $ ( 0.10) $ (0.09) $ (0.33) $ ( 0.02) Weighted-average common shares outstanding: Basic 23,563,651 18,218,128 23,261,475 17,553,627 Diluted 25,320,144 20,535,276 25,273,845 19,397,571 (1) (2) Includes the write-off of the company's deferred tax asset of $0.5 million, or $0.02 per fully diluted share, for both the three and nine month periods ended September 30, 2007, related to the compensation charge recorded for the 2004 Outperformance Bonus Plan. Three Months Ended September 30, Nine Months Ended September 30, Loss before income taxes, minority interests, and discontinued operations Includes a compensation charge of $0.5 million and $10.4 million, or $0.02 and $0.41 per fully diluted share, for the three and nine months ended September 30, 2007, related to the company's 2004 Outperformance Bonus Plan. 4
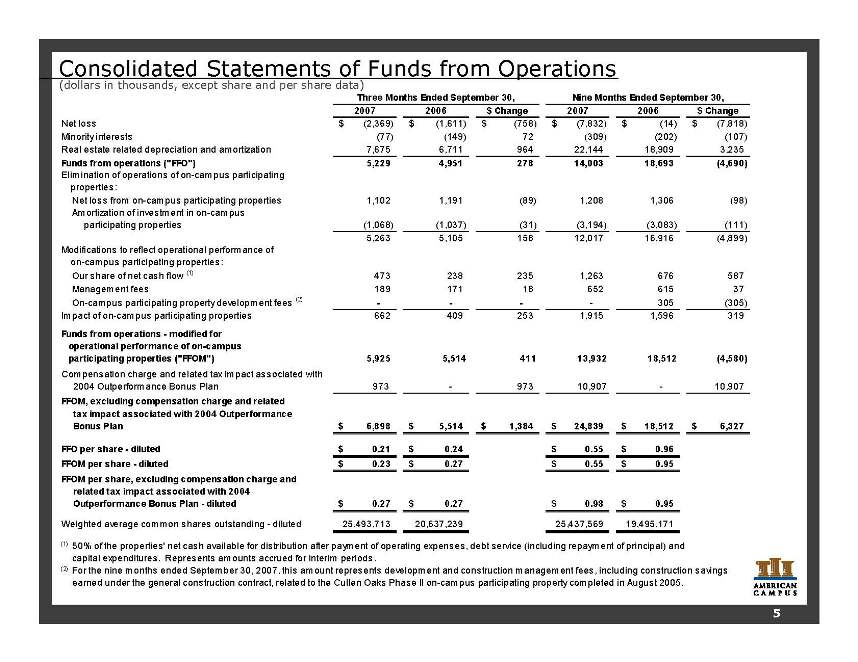
Consolidated Statements of Funds from Operations (dollars in thousands, except share and per share data) 2007 2006 $ Change 2007 2006 $ Change Net loss $ (2,369) $ (1,611) $ (758) $ (7,832) $ ( 14) $ (7,818) Minority interests (77) (149) 72 ( 309) ( 202) ( 107) Real estate related depreciation and amortization 7,675 6,711 964 22,144 18,909 3,235 Funds from operations ("FFO") 5,229 4,951 278 14,003 18,693 (4,690) Net loss from on-campus participating properties 1,102 1,191 (89) 1 ,208 1 ,306 (98) Amortization of investment in on-campus participating properties (1,068) (1,037) (31) (3,194) (3,083) ( 111) 5,263 5,105 158 12,017 16,916 (4,899) Our share of net cash flow (1) 473 238 235 1 ,263 676 587 Management fees 189 171 18 652 615 37 On-campus participating property development fees (2) - - - - 305 (305) Impact of on-campus participating properties 662 409 253 1 ,915 1 ,596 319 5 ,925 5,514 411 13,932 18,512 (4,580) 973 - 973 10,907 - 10,907 $ 6,898 $ 5,514 $ 1,384 $ 24,839 $ 18,512 $ 6,327 FFO per share - diluted $ 0.21 $ 0.24 $ 0 .55 $ 0.96 FFOM per share - diluted $ 0 .23 $ 0.27 $ 0 .55 $ 0.95 $ 0 .27 $ 0.27 $ 0 .98 $ 0.95 Weighted average common shares outstanding - diluted 25,493,713 20,637,239 25,437,569 19,495,171 (1) (2) Funds from operations - modified for operational performance of on-campus participating properties ("FFOM") 50% of the properties' net cash available for distribution after payment of operating expenses, debt service (including repayment of principal) and capital expenditures. Represents amounts accrued for interim periods. For the nine months ended September 30, 2007, this amount represents development and construction management fees, including construction savings earned under the general construction contract, related to the Cullen Oaks Phase II on-campus participating property completed in August 2005. Three Months Ended September 30, Nine Months Ended September 30, Elimination of operations of on-campus participating properties: Modifications to reflect operational performance of on-campus participating properties: Compensation charge and related tax impact associated with 2004 Outperformance Bonus Plan FFOM, excluding compensation charge and related tax impact associated with 2004 Outperformance Bonus Plan FFOM per share, excluding compensation charge and related tax impact associated with 2004 Outperformance Bonus Plan - diluted 5
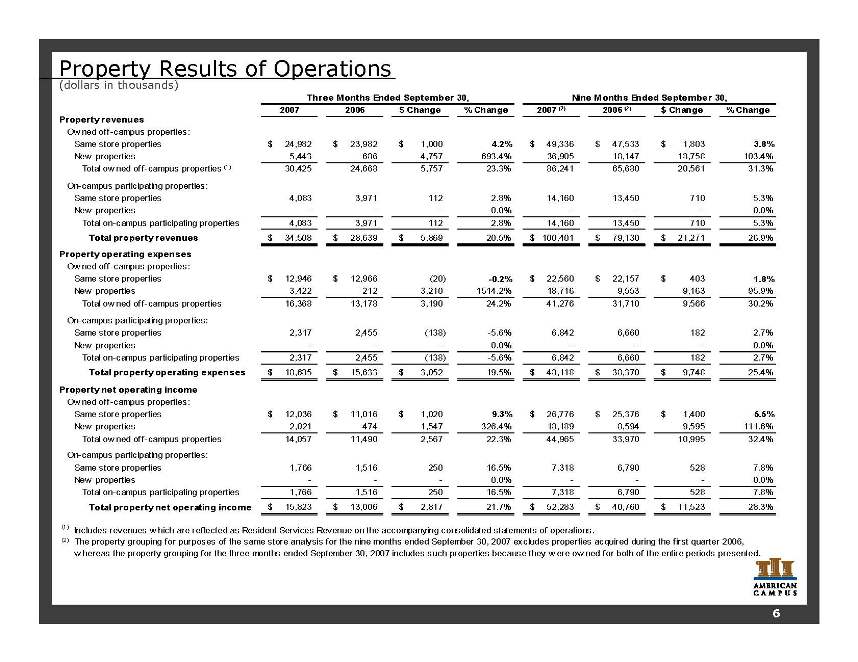
Property Results of Operations (dollars in thousands) 2007 2006 $ Change % Change 2007 (2) 2006 (2) $ Change % Change Property revenues Ow ned off-campus properties: Same store properties $ 2 4,982 $ 2 3,982 $ 1 ,000 4.2% $ 4 9,336 $ 4 7,533 $ 1 ,803 3.8% New properties 5 ,443 6 86 4,757 693.4% 36,905 18,147 18,758 103.4% Total ow ned off-campus properties (1) 3 0,425 24,668 5,757 23.3% 86,241 65,680 20,561 31.3% On-campus participating properties: Same store properties 4 ,083 3,971 112 2.8% 14,160 13,450 710 5.3% New properties - - - 0.0% - - - 0.0% Total on-campus participating properties 4 ,083 3,971 112 2.8% 14,160 13,450 710 5.3% Total property revenues $ 3 4,508 $ 2 8,639 $ 5 ,869 20.5% $ 100,401 $ 7 9,130 $ 21,271 26.9% Property operating expenses Ow ned off-campus properties: Same store properties $ 1 2,946 $ 1 2,966 (20) -0.2% $ 2 2,560 $ 2 2,157 $ 4 03 1.8% New properties 3 ,422 2 12 3,210 1514.2% 18,716 9 ,553 9,163 95.9% Total ow ned off-campus properties 1 6,368 13,178 3,190 24.2% 41,276 31,710 9,566 30.2% On-campus participating properties: Same store properties 2 ,317 2,455 (138) -5.6% 6,842 6,660 182 2.7% New properties - - - 0.0% - - - 0.0% Total on-campus participating properties 2 ,317 2,455 (138) -5.6% 6,842 6,660 182 2.7% Total property operating expenses $ 1 8,685 $ 1 5,633 $ 3 ,052 19.5% $ 48,118 $ 3 8,370 $ 9 ,748 25.4% Property net operating income Ow ned off-campus properties: Same store properties $ 1 2,036 $ 1 1,016 $ 1 ,020 9.3% $ 2 6,776 $ 2 5,376 $ 1 ,400 5.5% New properties 2 ,021 4 74 1,547 326.4% 18,189 8 ,594 9,595 111.6% Total ow ned off-campus properties 1 4,057 11,490 2,567 22.3% 44,965 33,970 10,995 32.4% On-campus participating properties: Same store properties 1 ,766 1,516 250 16.5% 7,318 6,790 528 7.8% New properties - - - 0.0% - - - 0.0% Total on-campus participating properties 1 ,766 1,516 250 16.5% 7,318 6,790 528 7.8% Total property net operating income $ 1 5,823 $ 1 3,006 $ 2 ,817 21.7% $ 52,283 $ 4 0,760 $ 11,523 28.3% (1) (2) Three Months Ended September 30, Nine Months Ended September 30, Includes revenues w hich are reflected as Resident Services Revenue on the accompanying consolidated statements of operations. The property grouping for purposes of the same store analysis for the nine months ended September 30, 2007 excludes properties acquired during the first quarter 2006, w hereas the property grouping for the three months ended September 30, 2007 includes such properties because they w ere ow ned for both of the entire periods presented. 6
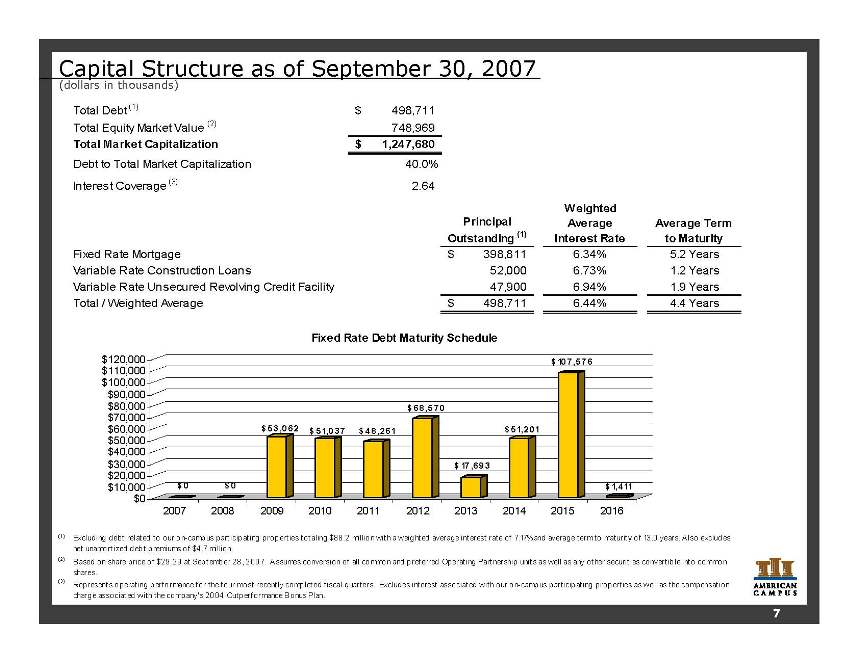
Capital Structure as of September 30, 2007 (dollars in thousands) Total Debt (1) $ 498,711 Total Equity Market Value (2) 748,969 Total Market Capitalization $ 1 ,247,680 Debt to Total Market Capitalization 40.0% Interest Coverage (3) 2.64 Principal Outstanding (1) Weighted Average Interest Rate Average Term to Maturity Fixed Rate Mortgage $ 3 98,811 6.34% 5.2 Years Variable Rate Construction Loans 52,000 6.73% 1.2 Years Variable Rate Unsecured Revolving Credit Facility 47,900 6.94% 1.9 Years Total / Weighted Average $ 4 98,711 6.44% 4.4 Years (1) (2) (3) Fixed Rate Debt Maturity Schedule Excluding debt related to our on-campus participating properties totaling $88.2 million with a weighted average interest rate of 7.17% and average term to maturity of 13.0 years. Also excludes net unamortized debt premiums of $4.7 million. Based on share price of $29.29 at September 28, 2007. Assumes conversion of all common and preferred Operating Partnership units as well as any other securities convertible into common shares. Represents operating performance for the four most recently completed fiscal quarters. Excludes interest associated with our on-campus participating properties as well as the compensation charge associated with the company's 2004 Outperformance Bonus Plan. $ 0 $ 0 $ 53,062 $ 51,037 $ 48,261 $ 68,570 $ 17,693 $ 51,201 $ 107,576 $ 1,411 $0 $10,000 $20,000 $30,000 $40,000 $50,000 $60,000 $70,000 $80,000 $90,000 $100,000 $110,000 $120,000 2007 2008 2009 2010 2011 2012 2013 2014 2015 2016 7
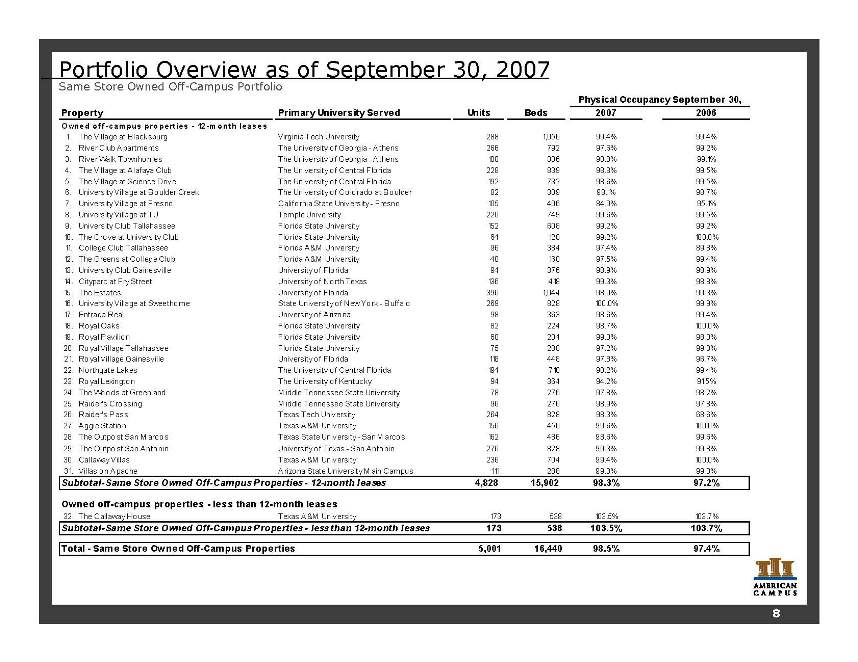
Portfolio Overview as of September 30, 2007 Same Store Owned Off-Campus Portfolio 8 Primary University Served Units Beds 2007 2006 1. The Village at Blacksburg Virginia Tech University 2 88 1,056 99.4% 99.4% 2. River Club Apartments The University of Georgia - Athens 2 66 7 92 97.6% 99.2% 3. River Walk Townhomes The University of Georgia - Athens 1 00 3 36 98.8% 99.1% 4. The Village at Alafaya Club The University of Central Florida 2 28 8 39 98.8% 99.5% 5. The Village at Science Drive The University of Central Florida 1 92 7 32 98.6% 99.5% 6. University Village at Boulder Creek The University of Colorado at Boulder 82 3 09 98.1% 98.7% 7. University Village at Fresno California State University - Fresno 1 05 4 06 84.0% 95.1% 8. University Village at TU Temple University 2 20 7 49 99.6% 99.5% 9. University Club Tallahassee Florida State University 1 52 6 08 99.2% 99.2% 10. The Grove at University Club Florida State University 64 1 28 99.2% 100.0% 11. College Club Tallahassee Florida A&M University 96 3 84 97.4% 89.8% 12. The Greens at College Club Florida A&M University 40 1 60 97.5% 99.4% 13. University Club Gainesville University of Florida 94 3 76 98.9% 98.9% 14. Cityparc at Fry Street University of North Texas 1 36 4 18 99.3% 98.8% 15. The Estates University of Florida 3 96 1,044 98.9% 99.3% 16. University Village at Sweethome State University of New York - Buffalo 2 69 8 28 100.0% 99.9% 17. Entrada Real University of Arizona 98 3 63 98.6% 99.4% 18. Royal Oaks Florida State University 82 2 24 98.7% 100.0% 19. Royal Pavilion Florida State University 60 2 04 99.0% 98.0% 20. Royal Village Tallahassee Florida State University 75 2 88 97.2% 99.3% 21. Royal Village Gainesville University of Florida 1 18 4 48 97.8% 96.7% 22. Northgate Lakes The University of Central Florida 1 94 7 10 98.2% 99.4% 23. Royal Lexington The University of Kentucky 94 3 64 94.2% 91.5% 24. The Woods at Greenland Middle Tennessee State University 78 2 76 97.8% 98.2% 25. Raider's Crossing Middle Tennessee State University 96 2 76 98.9% 97.8% 26. Raider's Pass Texas Tech University 2 64 8 28 98.3% 68.6% 27. Aggie Station Texas A&M University 1 56 4 50 99.6% 100.0% 28. The Outpost San M arcos Texas State University - San M arcos 1 62 4 86 98.6% 99.6% 29. The Outpost San Antonio University of Texas - San Antonio 2 76 8 28 99.3% 99.8% 30. Callaway Villas Texas A&M University 2 36 7 04 99.4% 100.0% 31. Villas on Apache Arizona State University Main Campus 1 11 288 99.3% 99.0% 4 ,828 15,902 98.3% 97.2% Owned off-campus properties - less than 12-month leases 32. The Callaway House Texas A&M University 173 538 103.5% 103.7% Subtotal-Same Store Owned Off-Campus Properties - less than 12-month leases 173 538 103.5% 103.7% Total - Same Store Owned Off-Campus Properties 5,001 16,440 98.5% 97.4% Physical Occupancy September 30, Property Subtotal-Same Store Owned Off-Campus Properties - 12-month leases Owned o ff-campus properties - 12-month leases 8
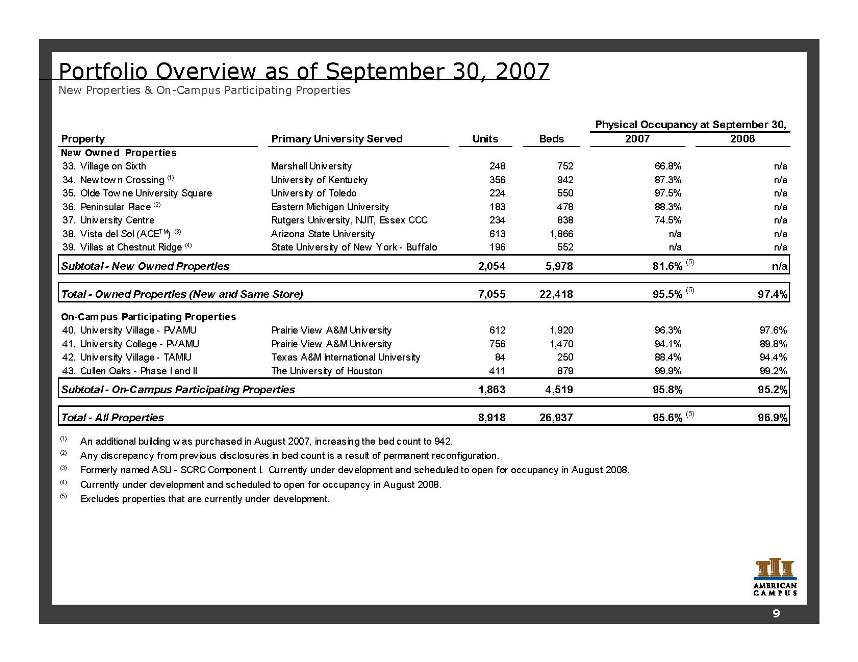
Portfolio Overview as of September 30, 2007 New Properties & On-Campus Participating Properties 9 Primary University Served Units Beds 2007 2006 33. Village on Sixth Marshall University 2 48 752 66.8% n/a 34. New tow n Crossing (1) University of Kentucky 3 56 942 87.3% n/a 35. Olde Tow ne University Square University of Toledo 2 24 550 97.5% n/a 36. Peninsular Place (2) Eastern Michigan University 1 83 478 88.3% n/a 37. University Centre Rutgers University, NJIT, Essex CCC 2 34 838 74.5% n/a 38. Vista del Sol (ACETM) (3) Arizona State University 6 13 1,866 n/a n/a 39. Villas at Chestnut Ridge (4) State University of New York - Buffalo 1 96 552 n/a n/a 2,054 5 ,978 81.6%(5) n/a 7,055 22,418 95.5% (5) 97.4% 40. University Village - PVAMU Prairie View A&M University 6 12 1,920 96.3% 97.6% 41. University College - PVAMU Prairie View A&M University 7 56 1,470 94.1% 89.8% 42. University Village - TAMIU Texas A&M International University 8 4 250 88.4% 94.4% 43. Cullen Oaks - Phase I and II The University of Houston 4 11 879 99.9% 99.2% 1,863 4 ,519 95.8% 95.2% 8,918 26,937 95.6% (5) 96.9% (1) An additional building w as purchased in August 2007, increasing the bed count to 942. (2) Any discrepancy from previous disclosures in bed count is a result of permanent reconfiguration. (3) Formerly named ASU - SCRC Component I. Currently under development and scheduled to open for occupancy in August 2008. (4) Currently under development and scheduled to open for occupancy in August 2008. (5) Excludes properties that are currently under development. Total - Owned Properties (New and Same Store) On-Campus Participating Properties Subtotal - On-Campus Participating Properties Physical Occupancy at September 30, Property Subtotal - New Owned Properties New Owned Properties Total - All Properties 9
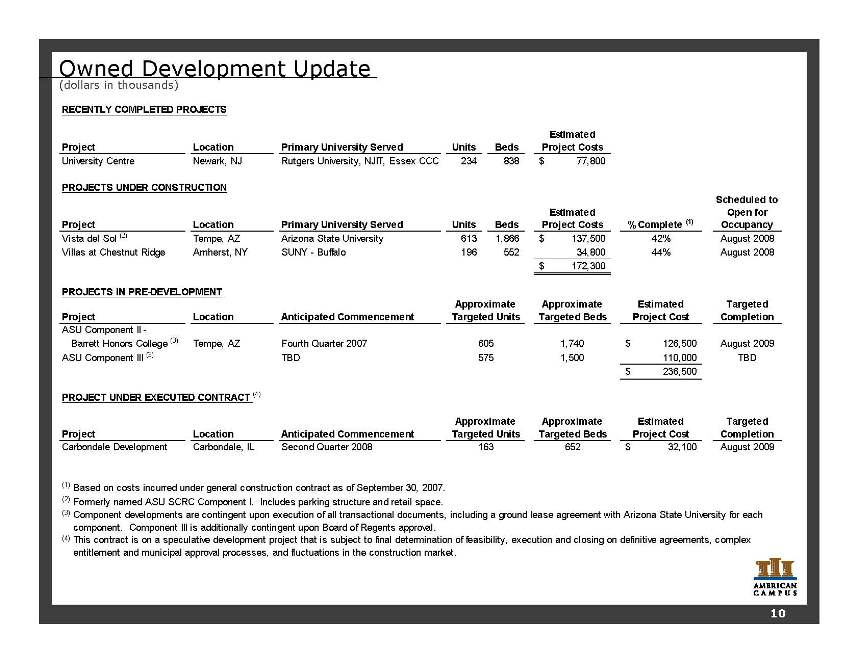
Owned Development Update (dollars in thousands) 10 RECENTLY COMPLETED PROJECTS Location Primary University Served Units Beds Estimated Project Costs University Centre Newark, NJ Rutgers University, NJIT, Essex CCC 2 34 838 $ 7 7,800 PROJECTS UNDER CONSTRUCTION Location Primary University Served Units Beds Estimated Project Costs % Complete (1) Scheduled to Open for Occupancy Vista del Sol (2) Tempe, AZ Arizona State University 6 13 1,866 $ 137,500 42% August 2008 Villas at Chestnut Ridge Amherst, NY SUNY - Buffalo 1 96 552 34,800 44% August 2008 $ 172,300 PROJECTS IN PRE-DEVELOPMENT Location Anticipated Commencement Approximate Targeted Beds Estimated Project Cost Targeted Completion Tempe, AZ Fourth Quarter 2007 1,740 $ 1 26,500 August 2009 ASU Component III (3) TBD 1,500 110,000 TBD $ 2 36,500 PROJECT UNDER EXECUTED CONTRACT (4) Location Anticipated Commencement Approximate Targeted Beds Estimated Project Cost Targeted Completion Carbondale Development Carbondale, IL Second Quarter 2008 652 $ 32,100 August 2009 (1) (2) (3) (4) Component developments are contingent upon execution of all transactional documents, including a ground lease agreement with Arizona State University for each component. Component III is additionally contingent upon Board of Regents approval. Project Project Approximate Targeted Units ASU Component II - Barrett Honors College (3) Project This contract is on a speculative development project that is subject to final determination of feasibility, execution and closing on definitive agreements, complex entitlement and municipal approval processes, and fluctuations in the construction market. 605 575 Based on costs incurred under general construction contract as of September 30, 2007. Project Approximate Targeted Units 163 Formerly named ASU SCRC Component I. Includes parking structure and retail space. 10
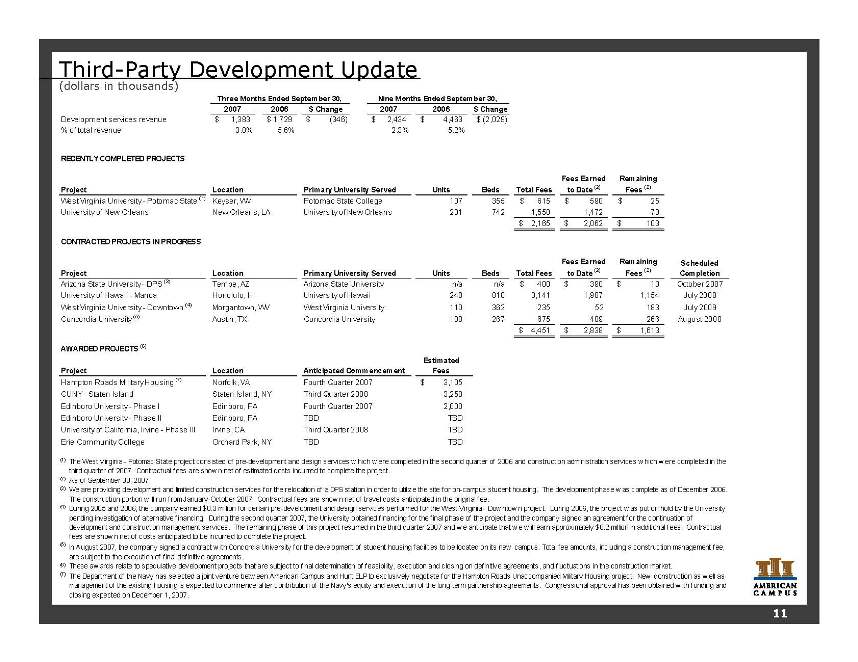
Third-Party Development Update (dollars in thousands) 2007 2006 $ Change 2007 2006 $ Change Development services revenue $ 1,383 $ 1,729 $ ( 346) $ 2,434 $ 4 ,463 $ (2,029) % of total revenue 3.8% 5.6% 2.3% 5.2% RECENTLY COMPLETED PROJECTS Project Units Beds Total Fees Fees Earned to Date (2) Remaining Fees (2) West Virginia University - Potomac State (1) 1 07 355 $ 615 $ 5 90 $ 2 5 University of New Orleans 2 31 742 1,550 1,472 7 8 $ 2 ,165 $ 2 ,062 $ 1 03 CONTRACTED PROJECTS IN PROGRESS Project Units Beds Total Fees Fees Earned to Date (2) Remaining Fees (2) Scheduled Completion Arizona State University - DPS (3) Tempe, AZ Arizona State University n/a n/a $ 4 00 $ 390 $ 10 October 2007 University of Hawaii - Manoa 2 40 810 3,141 1,987 1,154 July 2008 West Virginia University - Downtown (4) West Virginia University 1 10 362 2 35 52 183 July 2009 Concordia University (5) Austin, TX Concordia University 1 38 267 6 75 409 266 August 2008 $ 4 ,451 $ 2 ,838 $ 1 ,613 AWARDED PROJECTS (6) Project Estimated Fees Hampton Roads Military Housing (7) $ 3 ,105 CUNY - Staten Island Staten Island, NY Third Quarter 2008 3 ,250 Edinboro University - Phase I Edinboro, PA Fourth Quarter 2007 2 ,000 Edinboro University - Phase II Edinboro, PA TBD TBD University of California, Irvine - Phase III Irvine, CA Third Quarter 2008 TBD Erie Community College Orchard Park, NY TBD TBD (1) (2) (3) (4) (5) (6) (7) The Department of the Navy has selected a joint venture betw een American Campus and Hunt ELP to exclusively negotiate for the Hampton Roads Unaccompanied Military Housing project. New construction as w ell as management of the existing housing is expected to commence after contribution of the Navy's equity and execution of the long-term partnership agreements. Congressional approval has been obtained w ith funding and closing expected on December 1, 2007. We are providing development and limited construction services for the relocation of a DPS station in order to utilize the site for on-campus student housing. The development phase w as complete as of December 2006. The construction portion w ill run from January-October 2007. Contractual fees are show n net of travel costs anticipated in the original fee. These aw ards relate to speculative development projects that are subject to final determination of feasibility, execution and closing on definitive agreements, and fluctuations in the construction market. During 2005 and 2006, the company earned $0.3 million for certain pre-development and design services performed for the West Virginia - Dow ntow n project. During 2006, the project w as put on hold by the University pending investigation of alternative financing. During the second quarter 2007, the University obtained financing for the final phase of the project and the company signed an agreement for the continuation of development and construction management services. The remaining phase of this project resumed in the third quarter 2007 and w e anticipate that w e w ill earn approximately $0.2 million in additional fees. Contractual fees are show n net of costs anticipated to be incurred to complete the project. In August 2007, the company signed a contract w ith Concordia University for the development of student housing facilities to be located on its new campus. Total fee amounts, including a construction management fee, are subject to the execution of final definitive agreements. Fourth Quarter 2007 As of September 30, 2007. Primary University Served Keyser, WV Potomac State College Morgantown, WV Honolulu, HI Norfolk, VA The West Virginia - Potomac State project consisted of pre-development and design services w hich w ere completed in the second quarter of 2006 and construction administration services w hich w ere completed in the third quarter of 2007. Contractual fees are show n net of estimated costs incurred to complete the project. Three Months Ended September 30, Location Primary University Served University of Hawaii Location Nine Months Ended September 30, Anticipated Commencement New Orleans, LA University of New Orleans Location 11
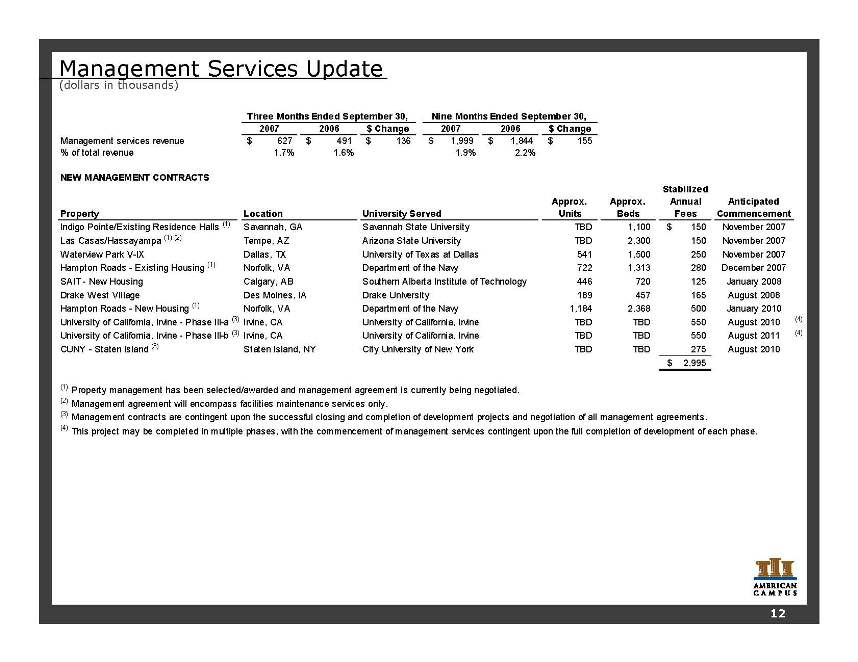
Management Services Update (dollars in thousands) 12 2007 2006 $ Change 2007 2006 $ Change Management services revenue $ 6 27 $ 491 $ 136 $ 1,999 $ 1,844 $ 155 % of total revenue 1.7% 1.6% 1.9% 2.2% NEW MANAGEMENT CONTRACTS Property Approx. Units Approx. Beds Stabilized Annual Fees Anticipated Commencement Indigo Pointe/Existing Residence Halls (1) Savannah State University TBD 1 ,100 $ 150 November 2007 Las Casas/Hassayampa (1) (2) Arizona State University TBD 2 ,300 1 50 November 2007 Waterview Park V-IX University of Texas at Dallas 5 41 1,500 2 50 November 2007 Department of the Navy 7 22 1,313 2 80 December 2007 SAIT - New Housing 4 46 720 125 January 2008 Drake West Village Drake University 1 89 457 165 August 2008 Hampton Roads - New Housing (1) Department of the Navy 1 ,184 2,368 5 00 January 2010 University of California, Irvine - Phase III-a (3) Irvine, CA University of California, Irvine TBD TBD 5 50 August 2010 (4) University of California, Irvine - Phase III-b (3) Irvine, CA University of California, Irvine TBD TBD 5 50 August 2011 (4) CUNY - Staten Island (3) Staten Island, NY City University of New York TBD TBD 275 August 2010 $ 2 ,995 (1) Property management has been selected/awarded and management agreement is currently being negotiated. (2) Management agreement will encompass facilities maintenance services only. (3) Management contracts are contingent upon the successful closing and completion of development projects and negotiation of all management agreements. (4) Three Months Ended September 30, Nine Months Ended September 30, Location University Served This project may be completed in multiple phases, with the commencement of management services contingent upon the full completion of development of each phase. Calgary, AB Southern Alberta Institute of Technology Savannah, GA Tempe, AZ Dallas, TX Hampton Roads - Existing Housing (1) Norfolk, VA Norfolk, VA Des Moines, IA 12

Investor Information Executive Management William C. Bayless, Jr. Chief Executive Officer Brian B. Nickel Chief Financial Officer James C. Hopke Chief Investment Officer Greg A. Dow ell Chief of Operations Research Coverage Jonathan Litt / Craig Melcher Citigroup Equity Research (212) 816-0231 / (212) 816-1685 jonathan.litt@citigroup.com / craig.melcher@citigroup.com Louis Taylor / Christeen Kim Deutsche Bank - North America (212) 250-4912 / (212) 250-6771 louis.taylor@db.com / christeen.kim@db.com Craig Leupold / Andrew McCulloch Green Street Advisors (949) 940-8780 cleupold@greenstreetadvisors.com / amcculloch@greenstreetadvisors.com Anthony Paolone / Joseph Dazio J.P. Morgan Securities (212) 622-6682 / (212) 622-6416 anthony.paolone@jpmorgan.com / joseph.c.dazio@jpmorgan.com Jordan Sadler / Karin Ford KeyBanc Capital Markets (917) 368-2280 / (917) 368-2293 jsadler@keybanccm.com / kford@keybanccm.com Steve Sakw a / Bill Acheson Merrill Lynch (212) 449-0335 / (212) 449-1920 steve_sakw a@ml.com / w illiam_acheson@ml.com Thayne Needles Robert W. Baird & Co., Inc. (703) 821-5781 tneedles@rw baird.com Alexander Goldfarb / Heath Binder UBS Investment Research (212) 713 8602 / (212) 713 3226 alexander.goldfarb@ubs.com / heath.binder@ubs.com Investor Relations: Gina Cow art VP, Investor Relations and Corporate Marketing (512) 732-1041 gcow art@studenthousing.com 805 Las Cimas Parkw ay, Suite 400 Austin, Texas 78746 Tel: (512) 732-1000; Fax: (512) 732-2450 w w w .americancampuscommunities.com American Campus Communities, Inc. is follow ed by the analysts listed above. Please note that any opinions, estimates or forecasts regarding American Campus Communities, Inc.'s performance made by such analysts are theirs alone and do not represent the opinions, forecasts or predictions of American Campus Communities, Inc. or its management. American Campus Communities, Inc. does not by its reference above or distribution imply its endorsement of or concurrence w ith such information, conclusions or recommendations. Additional Information Corporate Headquarters: American Campus Communities, Inc. 13
Forward Looking Statements This supplemental package contains forward-looking statements, which express the current beliefs and expectations of management. Except for historical information, the matters discussed in this supplemental package are forward-looking statements and can be identified by the use of the words “anticipate,” “believe,” “expect,” “intend,” “may,” “might,” “plan,” “estimate,” “project,” “should,” “will,” “result” and similar expressions. Such statements are based on current expectations and involve a number of known and unknown risks and uncertainties that could cause our future results, performance or achievements to differ significantly from the results, performance or achievements expressed or implied by such forward-looking statements. Our actual results could differ materially from those anticipated in these forward-looking statements as a result of various factors, including risks and uncertainties inherent in the national economy, the real estate industry in general, and in our specific markets; the effect of terrorism or the threat of terrorism; legislative or regulatory changes including changes to laws governing REITS; our dependence on key personnel whose continued service is not guaranteed; availability of qualified acquisition and development targets; availability of capital and financing; rising interest rates; rising insurance rates; impact of ad valorem and income taxation; changes in generally accepted accounting principals; and our continued ability to successfully lease and operate our properties. While we believe these forward-looking statements are based on reasonable assumptions, we can give no assurance that our expectations will be achieved. These forward-looking statements are made as of the date of this supplemental package, and we undertake no obligation to publicly update or revise any forward-looking statement, whether as a result of new information, future events or otherwise.