Exhibit 99.2
Supplemental Analyst Package First Quarter 2008 Earnings Call April 30, 2008
Table of Contents Financial Highlights 1 Consolidated Balance Sheets 2 Consolidated Statements of Operations 3 Consolidated Statements of Funds from Operations 4 Property Results of Operations 5 Capital Structure 6 Portfolio Overview 7 2008/2009 Leasing Status 9 First Quarter 2008 Acquisitions 12 Owned Development Update 13 Third-party Development Update 14 Management Services Update 15 Investor Information 16
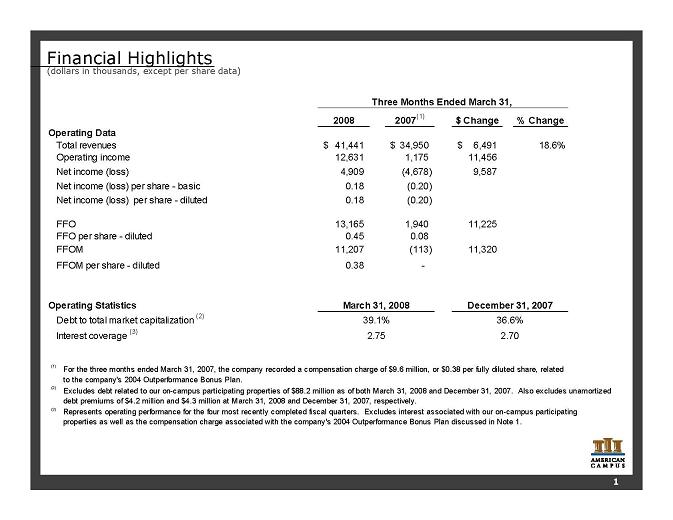
Financial Highlights (dollars in thousands, except per share data) 2008 2007(1) $ Change % Change 41,441 $ 34,950 $ 6,491 $ 18.6% 12,631 1,175 11,456 4,909 (4,678) 9,587 Net income (loss) per share - basic 0.18 (0.20) Net income (loss) per share - diluted 0.18 (0.20) 13,165 1,940 11,225 FFO per share - diluted 0.45 0.08 11,207 (113) 11,320 FFOM per share - diluted 0.38 - Net income (loss) FFO FFOM Three Months Ended March 31, Operating Data Total revenues Operating income Debt to total market capitalization (2) 39.1% 36.6% Operating Statistics March 31, 2008 December 31, 2007 Represents operating performance for the four most recently completed fiscal quarters. Excludes interest associated with our on-campus participating properties as well as the compensation charge associated with the company's 2004 Outperformance Bonus Plan discussed in Note 1. Interest coverage (3) 2.75 2.70 For the three months ended March 31, 2007, the company recorded a compensation charge of $9.6 million, or $0.38 per fully diluted share, related to the company's 2004 Outperformance Bonus Plan. (3) (1) (2) Excludes debt related to our on-campus participating properties of $88.2 million as of both March 31, 2008 and December 31, 2007. Also excludes unamortized debt premiums of $4.2 million and $4.3 million at March 31, 2008 and December 31, 2007, respectively. 1
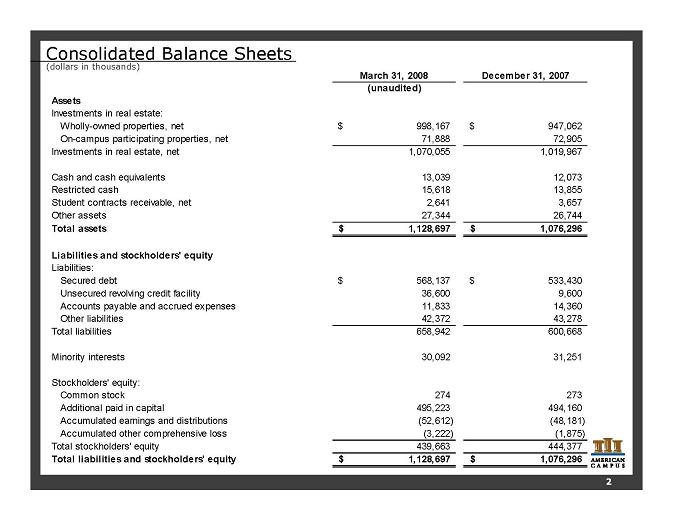
Consolidated Balance Sheets (dollars in thousands) 2 March 31, 2008 December 31, 2007 (unaudited) Assets Investments in real estate: Wholly-owned properties, net 998,167 $ 947,062 $ On-campus participating properties, net 71,888 72,905 Investments in real estate, net 1,070,055 1,019,967 Cash and cash equivalents 13,039 12,073 Restricted cash 15,618 13,855 Student contracts receivable, net 2,641 3,657 Other assets 27,344 26,744 Total assets 1,128,697 $ 1,076,296 $ Liabilities and stockholders' equity Liabilities: Secured debt 568,137 $ 533,430 $ Unsecured revolving credit facility 36,600 9,600 Accounts payable and accrued expenses 11,833 14,360 Other liabilities 42,372 43,278 Total liabilities 658,942 600,668 Minority interests 30,092 31,251 Stockholders' equity: Common stock 274 273 Additional paid in capital 495,223 494,160 Accumulated earnings and distributions (52,612) (48,181) Accumulated other comprehensive loss (3,222) (1,875) Total stockholders' equity 439,663 444,377 Total liabilities and stockholders' equity 1,128,697 $ 1,076,296 $
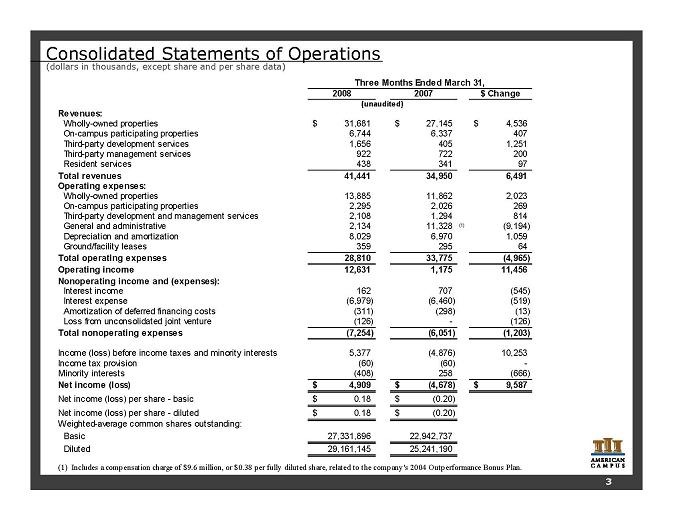
Consolidated Statements of Operations (dollars in thousands, except share and per share data) 2008 2007 $ Change Revenues: Wholly-owned properties 31,681 $ 27,145 $ 4,536 $ On-campus participating properties 6,744 6,337 407 Third-party development services 1,656 405 1,251 Third-party management services 922 722 200 Resident services 438 341 97 Total revenues 41,441 34,950 6,491 Operating expenses: Wholly-owned properties 13,885 11,862 2,023 On-campus participating properties 2,295 2,026 269 Third-party development and management services 2,108 1,294 814 General and administrative 2,134 11,328 (1) (9,194) Depreciation and amortization 8,029 6,970 1,059 Ground/facility leases 359 295 64 Total operating expenses 28,810 33,775 (4,965) Operating income 12,631 1,175 11,456 Nonoperating income and (expenses): Interest income 162 707 (545) Interest expense (6,979) (6,460) (519) Amortization of deferred financing costs (311) (298) (13) Loss from unconsolidated joint venture (126) - (126) Total nonoperating expenses (7,254) (6,051) (1,203) Income (loss) before income taxes and minority interests 5,377 (4,876) 10,253 Income tax provision (60) (60) - Minority interests (408) 258 (666) Net income (loss) 4,909 $ (4,678) $ 9,587 $ Net income (loss) per share - basic 0.18 $ (0.20) $ Net income (loss) per share - diluted 0.18 $ (0.20) $ Weighted-average common shares outstanding: Basic 27,331,896 22,942,737 Diluted 29,161,145 25,241,190 (1) Includes a compensation charge of $9.6 million, or $0.38 per fully diluted share, related to the company's 2004 Outperformance Bonus Plan. Three Months Ended March 31, (unaudited) 3
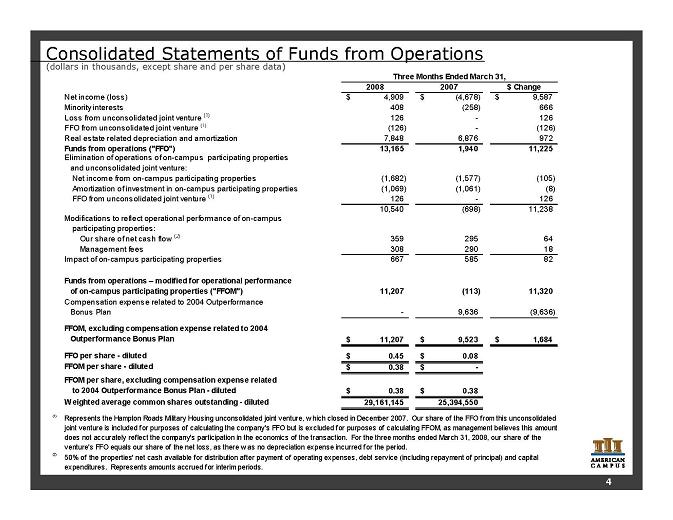
Consolidated Statements of Funds from Operations (dollars in thousands, except share and per share data) 2008 2007 $ Change Net income (loss) 4,909 $ (4,678) $ 9,587 $ Minority interests 408 (258) 666 Loss from unconsolidated joint venture (1) 126 - 126 FFO from unconsolidated joint venture (1) (126) - (126) Real estate related depreciation and amortization 7,848 6,876 972 Funds from operations ("FFO") 13,165 1,940 11,225 Elimination of operations of on-campus participating properties and unconsolidated joint venture: Net income from on-campus participating properties (1,682) (1,577) (105) Amortization of investment in on-campus participating properties (1,069) (1,061) (8) FFO from unconsolidated joint venture (1) 126 - 126 10,540 (698) 11,238 Modifications to reflect operational performance of on-campus participating properties: Our share of net cash flow (2) 359 295 64 Management fees 308 290 18 Impact of on-campus participating properties 667 585 82 Funds from operations – modified for operational performance of on-campus participating properties ("FFOM") 11,207 (113) 11,320 Compensation expense related to 2004 Outperformance Bonus Plan - 9,636 (9,636) FFOM, excluding compensation expense related to 2004 Outperformance Bonus Plan 11,207 $ 9,523 $ 1,684 $ FFO per share - diluted 0.45 $ 0.08 $ FFOM per share - diluted 0.38 $ - $ FFOM per share, excluding compensation expense related to 2004 Outperformance Bonus Plan - diluted 0.38 $ 0.38 $ Weighted average common shares outstanding - diluted 29,161,145 25,394,550 (1) (2) Three Months Ended March 31, Represents the Hampton Roads Military Housing unconsolidated joint venture, w hich closed in December 2007. Our share of the FFO from this unconsolidated joint venture is included for purposes of calculating the company's FFO but is excluded for purposes of calculating FFOM, as management believes this amount does not accurately reflect the company's participation in the economics of the transaction. For the three months ended March 31, 2008, our share of the venture's FFO equals our share of the net loss, as there w as no depreciation expense incurred for the period. 50% of the properties' net cash available for distribution after payment of operating expenses, debt service (including repayment of principal) and capital expenditures. Represents amounts accrued for interim periods. 4
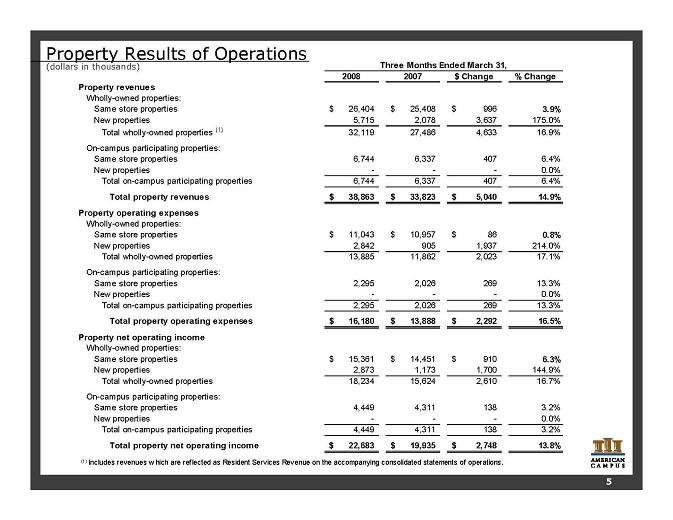
Property Results of Operations (dollars in thousands) 2008 2007 $ Change % Change Property revenues Wholly-owned properties: Same store properties 26,404 $ 25,408 $ 996 $ 3.9% New properties 5,715 2,078 3,637 175.0% Total wholly-owned properties (1) 32,119 27,486 4,633 16.9% On-campus participating properties: Same store properties 6,744 6,337 407 6.4% New properties - - - 0.0% Total on-campus participating properties 6,744 6,337 407 6.4% Total property revenues 38,863 $ 33,823 $ 5,040 $ 14.9% Property operating expenses Wholly-owned properties: Same store properties 11,043 $ 10,957 $ 86 $ 0.8% New properties 2,842 905 1,937 214.0% Total wholly-owned properties 13,885 11,862 2,023 17.1% On-campus participating properties: Same store properties 2,295 2,026 269 13.3% New properties - - - 0.0% Total on-campus participating properties 2,295 2,026 269 13.3% Total property operating expenses 16,180 $ 13,888 $ 2,292 $ 16.5% Property net operating income Wholly-owned properties: Same store properties 15,361 $ 14,451 $ 910 $ 6.3% New properties 2,873 1,173 1,700 144.9% Total wholly-owned properties 18,234 15,624 2,610 16.7% On-campus participating properties: Same store properties 4,449 4,311 138 3.2% New properties - - - 0.0% Total on-campus participating properties 4,449 4,311 138 3.2% Total property net operating income 22,683 $ 19,935 $ 2,748 $ 13.8% Three Months Ended March 31, (1) Includes revenues w hich are reflected as Resident Services Revenue on the accompanying consolidated statements of operations. 5
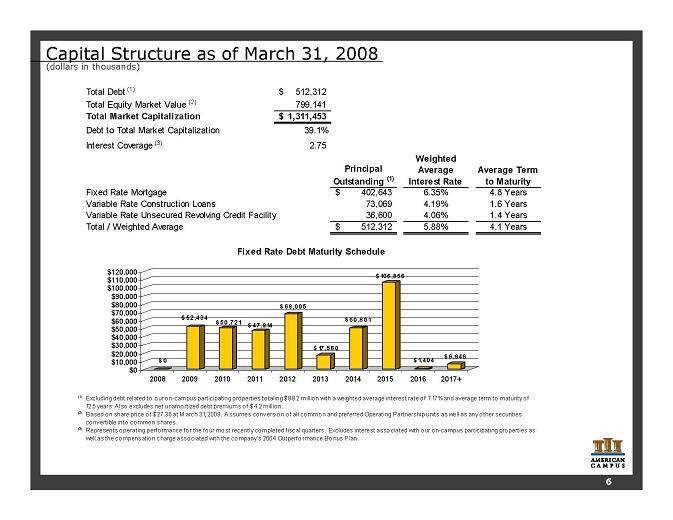
Capital Structure as of March 31, 2008 (dollars in thousands) Total Debt (1) 512,312 $ Total Equity Market Value (2) 799,141 Total Market Capitalization 1,311,453 $ Debt to Total Market Capitalization 39.1% Interest Coverage (3) 2.75 Principal Outstanding (1) Weighted Average Interest Rate Average Term to Maturity Fixed Rate Mortgage 402,643 $ 6.35% 4.8 Years Variable Rate Construction Loans 73,069 4.19% 1.6 Years Variable Rate Unsecured Revolving Credit Facility 36,600 4.06% 1.4 Years Total / Weighted Average 512,312 $ 5.88% 4.1 Years (1) (2) (3) Fixed Rate Debt Maturity Schedule Excluding debt related to our on-campus participating properties totaling $88.2 million with a weighted average interest rate of 7.17% and average term to maturity o f 12.5 years. Also excludes net unamortized debt premiums o f $4.2 millio n. Based on share price of $27.36 at M arch 31, 2008. Assumes conversion of all common and preferred Operating Partnership units as well as any o ther securities convertible into common shares. Represents operating performance for the four most recently completed fiscal quarters. Excludes interest associated with our on-campus participating properties as well as the compensation charge associated with the company's 2004 Outperformance Bonus Plan. $ 0 $ 52,434 $ 50,721 $ 47,914 $ 68,005 $ 17,560 $ 50,801 $ 106,856 $ 1,404 $ 6,948 $0 $10,000 $20,000 $30,000 $40,000 $50,000 $60,000 $70,000 $80,000 $90,000 $100,000 $110,000 $120,000 2008 2009 2010 2011 2012 2013 2014 2015 2016 2017+ 6
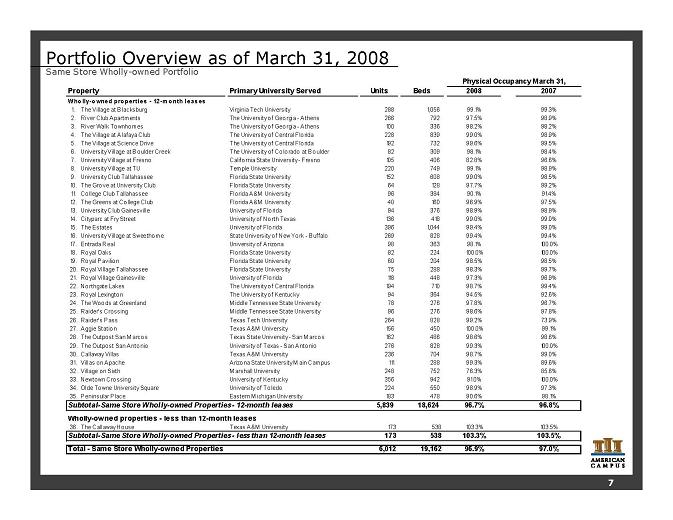
Portfolio Overview as of March 31, 2008 Same Store Wholly-owned Portfolio Primary University Served Units Beds 2008 2007 1. The Village at B lacksburg Virginia Tech University 288 1,056 99.1% 99.3% 2. River Club Apartments The University o f Georgia - Athens 266 792 97.5% 98.9% 3. River Walk Townhomes The University o f Georgia - Athens 100 336 98.2% 98.2% 4. The Village at A lafaya Club The University o f Central Florida 228 839 99.0% 98.9% 5. The Village at Science Drive The University o f Central Florida 192 732 99.6% 99.5% 6. University Village at Boulder Creek The University o f Colorado at Boulder 82 309 98.1% 98.4% 7. University Village at Fresno California State University - Fresno 105 406 82.8% 96.6% 8. University Village at TU Temple University 220 749 99.1% 98.9% 9. University Club Tallahassee Florida State University 152 608 99.0% 98.5% 10. The Grove at University Club Florida State University 64 128 97.7% 99.2% 11. College Club Tallahassee Florida A&M University 96 384 90.1% 91.4% 12. The Greens at College Club Florida A&M University 40 160 96.9% 97.5% 13. University Club Gainesville University of Florida 94 376 98.9% 98.9% 14. Cityparc at Fry Street University of North Texas 136 418 99.0% 99.0% 15. The Estates University of Florida 396 1,044 99.4% 99.0% 16. University Village at Sweethome State University of New York - Buffalo 269 828 99.4% 99.4% 17. Entrada Real University of Arizona 98 363 98.1% 100.0% 18. Royal Oaks Florida State University 82 224 100.0% 100.0% 19. Royal Pavilion Florida State University 60 204 98.5% 98.5% 20. Royal Village Tallahassee Florida State University 75 288 98.3% 99.7% 21. Royal Village Gainesville University of Florida 118 448 97.3% 96.9% 22. Northgate Lakes The University o f Central Florida 194 710 98.7% 99.4% 23. Royal Lexington The University o f Kentucky 94 364 94.5% 92.6% 24. The Woods at Greenland Middle Tennessee State University 78 276 97.8% 96.7% 25. Raider's Crossing Middle Tennessee State University 96 276 98.6% 97.8% 26. Raider's Pass Texas Tech University 264 828 99.2% 73.9% 27. Aggie Station Texas A&M University 156 450 100.0% 99.1% 28. The Outpost San M arcos Texas State University - San M arcos 162 486 98.6% 98.6% 29. The Outpost San Antonio University of Texas - San Antonio 276 828 99.3% 100.0% 30. Callaway Villas Texas A&M University 236 704 98.7% 99.0% 31. Villas on Apache Arizona State University M ain Campus 111 288 99.3% 89.6% 32. Village on Sixth Marshall University 248 752 76.3% 85.6% 33. Newtown Crossing University of Kentucky 356 942 91.0% 100.0% 34. Olde Towne University Square University of Toledo 224 550 98.9% 97.3% 35. Peninsular P lace Eastern M ichigan University 183 478 90.6% 98.1% 5,839 18,624 96.7% 96.8% Wholly-owned properties - less than 12-month leases 36. The Callaway House Texas A&M University 173 538 103.3% 103.5% Subtotal-Same Store Wholly-owned Properties - less than 12-month leases 173 538 103.3% 103.5% Total - Same Store Wholly-owned Properties 6,012 19,162 96.9% 97.0% Physical Occupancy March 31, Property Subtotal-Same Store Wholly-owned Properties - 12-month leases Wholly-owned properties - 12-month leases 7
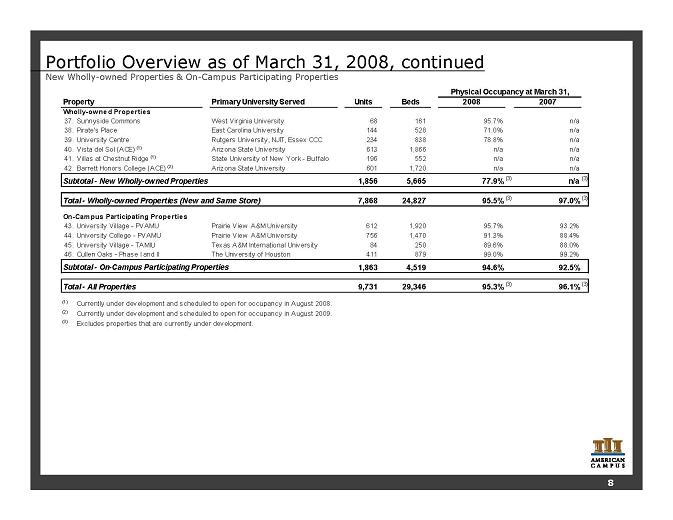
Portfolio Overview as of March 31, 2008, continued New Wholly-owned Properties & On-Campus Participating Properties Primary University Served Units Beds 2008 2007 37. Sunnyside Commons West Virginia University 68 161 95.7% n/a 38. Pirate's Place East Carolina University 144 528 71.0% n/a 39. University Centre Rutgers University, NJIT, Essex CCC 234 838 78.8% n/a 40. Vista del Sol (ACE) (1) Arizona State University 613 1,866 n/a n/a 41. Villas at Chestnut Ridge (1) State University of New York - Buffalo 196 552 n/a n/a 42. Barrett Honors College (ACE) (2) Arizona State University 601 1,720 n/a n/a 1,856 5,665 77.9%(3) n/a (3) 7,868 24,827 95.5%(3) 97.0%(3) 43. University Village - PVAMU Prairie View A&M University 612 1,920 95.7% 93.2% 44. University College - PVAMU Prairie View A&M University 756 1,470 91.3% 88.4% 45. University Village - TAMIU Texas A&M International University 84 250 89.6% 88.0% 46. Cullen Oaks - Phase I and II The University of Houston 411 879 99.0% 99.2% 1,863 4,519 94.6% 92.5% 9,731 29,346 95.3%(3) 96.1%(3) (1) Currently under development and scheduled to open for occupancy in August 2008. (2) Currently under development and scheduled to open for occupancy in August 2009. (3) Excludes properties that are currently under development. Total - All Properties Total - Wholly-owned Properties (New and Same Store) On-Campus Participating Properties Subtotal - On-Campus Participating Properties Physical Occupancy at March 31, Property Subtotal - New Wholly-owned Properties Wholly-owned Properties 8
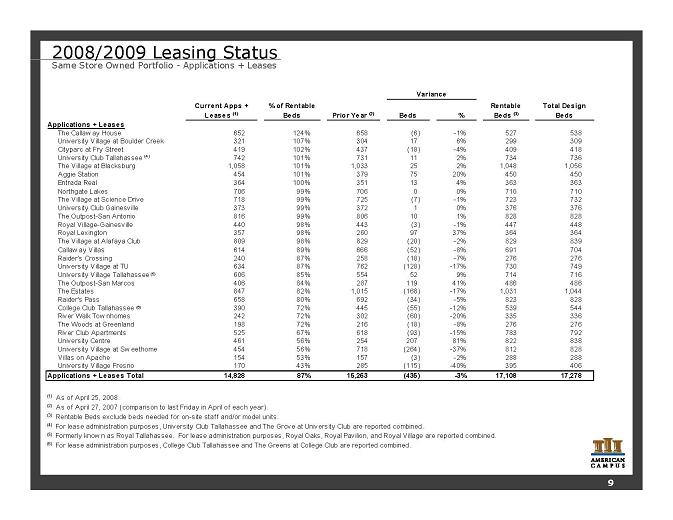
Current Apps + Leases (1) % of Rentable Beds Prior Year (2) Beds % Rentable Beds (3) Total Design Beds Applications + Leases The Callaw ay House 652 124% 658 (6) -1% 527 538 University Village at Boulder Creek 321 107% 304 17 6% 299 309 Cityparc at Fry Street 419 102% 437 (18) -4% 409 418 University Club Tallahassee (4) 742 101% 731 11 2% 734 736 The Village at Blacksburg 1,058 101% 1,033 25 2% 1,048 1,056 Aggie Station 454 101% 379 75 20% 450 450 Entrada Real 364 100% 351 13 4% 363 363 Northgate Lakes 706 99% 706 0 0% 710 710 The Village at Science Drive 718 99% 725 (7) -1% 723 732 University Club Gainesville 373 99% 372 1 0% 376 376 The Outpost-San Antonio 816 99% 806 10 1% 828 828 Royal Village-Gainesville 440 98% 443 (3) -1% 447 448 Royal Lexington 357 98% 260 97 37% 364 364 The Village at Alafaya Club 809 98% 829 (20) -2% 829 839 Callaw ay Villas 614 89% 666 (52) -8% 691 704 Raider's Crossing 240 87% 258 (18) -7% 276 276 University Village at TU 634 87% 762 (128) -17% 730 749 University Village Tallahassee (5) 606 85% 554 52 9% 714 716 The Outpost-San Marcos 406 84% 287 119 41% 486 486 The Estates 847 82% 1,015 (168) -17% 1,031 1,044 Raider's Pass 658 80% 692 (34) -5% 823 828 College Club Tallahassee (6) 390 72% 445 (55) -12% 539 544 River Walk Tow nhomes 242 72% 302 (60) -20% 335 336 The Woods at Greenland 198 72% 216 (18) -8% 276 276 River Club Apartments 525 67% 618 (93) -15% 783 792 University Centre 461 56% 254 207 81% 822 838 University Village at Sw eethome 454 56% 718 (264) -37% 812 828 Villas on Apache 154 53% 157 (3) -2% 288 288 University Village Fresno 170 43% 285 (115) -40% 395 406 Applications + Leases Total 14,828 87% 15,263 (435) -3% 17,108 17,278 (1) As of April 25, 2008. (2) As of April 27, 2007 (comparison to last Friday in April of each year). (3) Rentable Beds exclude beds needed for on-site staff and/or model units. (4) For lease administration purposes, University Club Tallahassee and The Grove at University Club are reported combined. (5) Formerly know n as Royal Tallahassee. For lease administration purposes, Royal Oaks, Royal Pavilion, and Royal Village are reported combined. (6) For lease administration purposes, College Club Tallahassee and The Greens at College Club are reported combined. Variance 2008/2009 Leasing Status Same Store Owned Portfolio - Applications + Leases 9
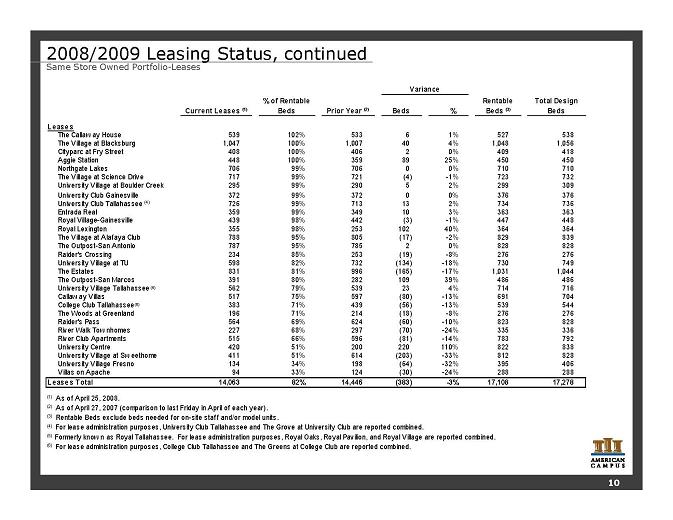
Current Leases (1) % of Rentable Beds Prior Year (2) Beds % Rentable Beds (3) Total Design Beds Leases The Callaw ay House 539 102% 533 6 1% 527 538 The Village at Blacksburg 1,047 100% 1,007 40 4% 1,048 1,056 Cityparc at Fry Street 408 100% 406 2 0% 409 418 Aggie Station 448 100% 359 89 25% 450 450 Northgate Lakes 706 99% 706 0 0% 710 710 The Village at Science Drive 717 99% 721 (4) -1% 723 732 University Village at Boulder Creek 295 99% 290 5 2% 299 309 University Club Gainesville 372 99% 372 0 0% 376 376 University Club Tallahassee (4) 726 99% 713 13 2% 734 736 Entrada Real 359 99% 349 10 3% 363 363 Royal Village-Gainesville 439 98% 442 (3) -1% 447 448 Royal Lexington 355 98% 253 102 40% 364 364 The Village at Alafaya Club 788 95% 805 (17) -2% 829 839 The Outpost-San Antonio 787 95% 785 2 0% 828 828 Raider's Crossing 234 85% 253 (19) -8% 276 276 University Village at TU 598 82% 732 (134) -18% 730 749 The Estates 831 81% 996 (165) -17% 1,031 1,044 The Outpost-San Marcos 391 80% 282 109 39% 486 486 University Village Tallahassee (5) 562 79% 539 23 4% 714 716 Callaw ay Villas 517 75% 597 (80) -13% 691 704 College Club Tallahassee (6) 383 71% 439 (56) -13% 539 544 The Woods at Greenland 196 71% 214 (18) -8% 276 276 Raider's Pass 564 69% 624 (60) -10% 823 828 River Walk Tow nhomes 227 68% 297 (70) -24% 335 336 River Club Apartments 515 66% 596 (81) -14% 783 792 University Centre 420 51% 200 220 110% 822 838 University Village at Sw eethome 411 51% 614 (203) -33% 812 828 University Village Fresno 134 34% 198 (64) -32% 395 406 Villas on Apache 94 33% 124 (30) -24% 288 288 Leases Total 14,063 82% 14,446 (383) -3% 17,108 17,278 (1) As of April 25, 2008. (2) As of April 27, 2007 (comparison to last Friday in April of each year). (3) Rentable Beds exclude beds needed for on-site staff and/or model units. (4) For lease administration purposes, University Club Tallahassee and The Grove at University Club are reported combined. (5) Formerly know n as Royal Tallahassee. For lease administration purposes, Royal Oaks, Royal Pavilion, and Royal Village are reported combined. (6) For lease administration purposes, College Club Tallahassee and The Greens at College Club are reported combined. Variance 2008/2009 Leasing Status, continued Same Store Owned Portfolio-Leases 10
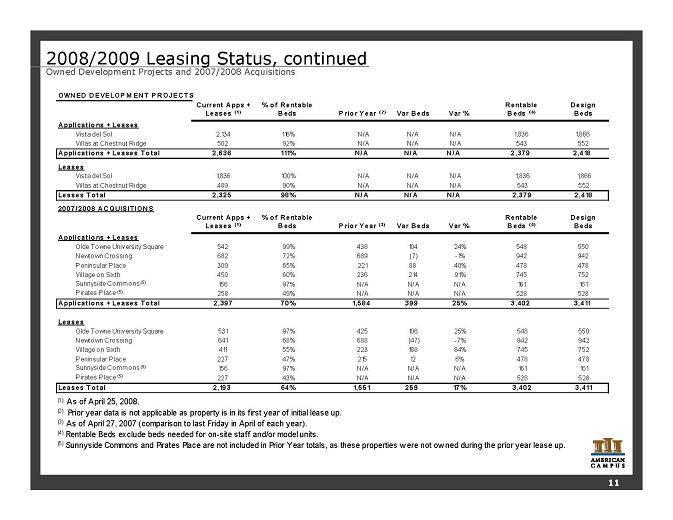
OWNED DEVELOPM ENT PROJECTS Current A pps + Leases ( 1) % o f Rentable Beds P rior Year ( 2) Var B eds Var % Rentable Beds ( 4) Design Beds Applications + Leases Vista del Sol 2,134 116% N/A N/A N/A 1,836 1,866 Villas at Chestnut Ridge 502 92% N/A N/A N/A 543 552 Applications + Leases Total 2,636 111% N/A N/A N/A 2,379 2,418 Leases Vista del Sol 1,836 100% N/A N/A N/A 1,836 1,866 Villas at Chestnut Ridge 489 90% N/A N/A N/A 543 552 Leases Total 2,325 98% N/A N/A N/A 2,379 2,418 2007/ 2008 ACQUISITIONS Current A pps + Leases ( 1) % o f Rentable Beds P rior Year ( 3) Var B eds Var % Rentable Beds ( 4) Design Beds Applications + Leases Olde Towne University Square 542 99% 438 104 24% 548 550 Newtown Crossing 682 72% 689 (7) -1% 942 942 Peninsular Place 309 65% 221 88 40% 478 478 Village on Sixth 450 60% 236 214 91% 745 752 Sunnyside Commons (5) 156 97% N/A N/A N/A 161 161 Pirates Place (5) 258 49% N/A N/A N/A 528 528 Applications + Leases Total 2,397 70% 1,584 399 25% 3,402 3,411 Leases Olde Towne University Square 531 97% 425 106 25% 548 550 Newtown Crossing 641 68% 688 (47) -7% 942 942 Village on Sixth 411 55% 223 188 84% 745 752 Peninsular Place 227 47% 215 12 6% 478 478 Sunnyside Commons (5) 156 97% N/A N/A N/A 161 161 Pirates Place (5) 227 43% N/A N/A N/A 528 528 Leases Total 2,193 64% 1,551 259 17% 3,402 3,411 (1) As of April 25, 2008. (2) Prior year data is not applicable as property is in its first year of initial lease up. (3) As of April 27, 2007 (comparison to last Friday in April of each year). (4) Rentable Beds exclude beds needed for on-site staff and/or model units. (5) Sunnyside Commons and Pirates Place are not included in Prior Year totals, as these properties w ere not ow ned during the prior year lease up. 2008/2009 Leasing Status, continued Owned Development Projects and 2007/2008 Acquisitions 11
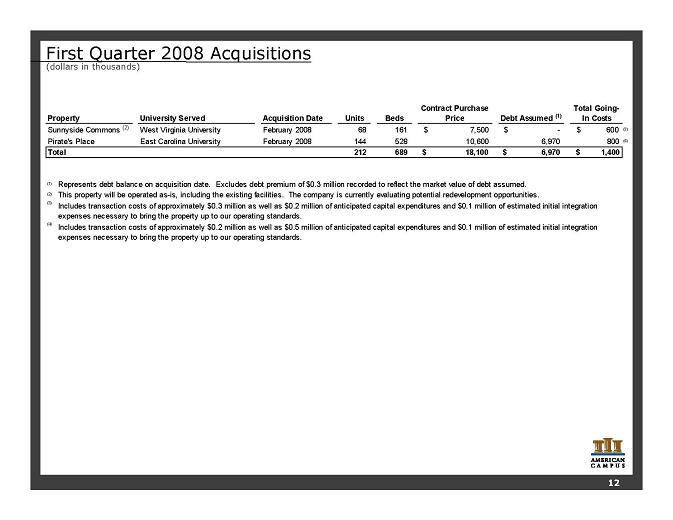
First Quarter 2008 Acquisitions (dollars in thousands) Property University Served Acquisition Date Units Beds Contract Purchase Price Debt Assumed (1) Total Going- In Costs Sunnyside Commons (2) West Virginia University February 2008 68 161 $ 7,500 - $ $ 600 (3) Pirate's Place East Carolina University February 2008 144 528 10,600 6,970 800 (4) Total 212 689 18,100 $ 6,970 $ $ 1,400 (1) (2) (3) (4) This property will be operated as-is, including the existing facilities. The company is currently evaluating potential redevelopment opportunities. Represents debt balance on acquisition date. Excludes debt premium of $0.3 million recorded to reflect the market value of debt assumed. Includes transaction costs of approximately $0.3 million as well as $0.2 million of anticipated capital expenditures and $0.1 million of estimated initial integration expenses necessary to bring the property up to our operating standards. Includes transaction costs of approximately $0.2 million as well as $0.5 million of anticipated capital expenditures and $0.1 million of estimated initial integration expenses necessary to bring the property up to our operating standards. 12
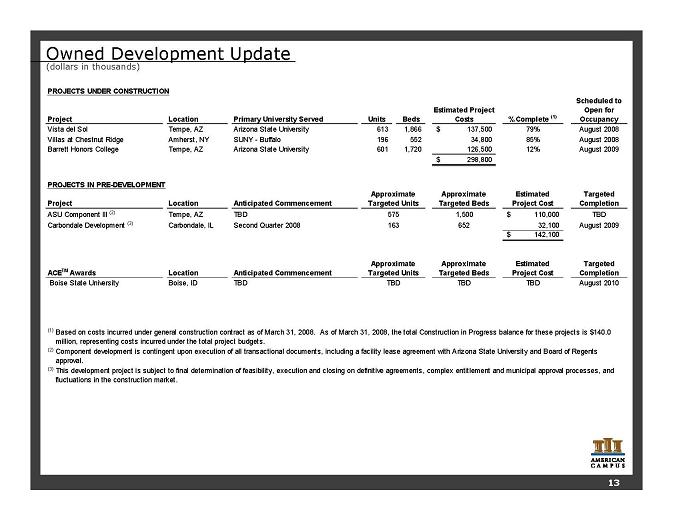
Owned Development Update (dollars in thousands) PROJECTS UNDER CONSTRUCTION Location Primary University Served Units Beds Estimated Project Costs % Complete (1) Scheduled to Open for Occupancy Vista del Sol Tempe, AZ Arizona State University 613 1,866 137,500 $ 79% August 2008 Villas at Chestnut Ridge Amherst, NY SUNY - Buffalo 196 552 34,800 85% August 2008 Tempe, AZ Arizona State University 601 1,720 126,500 12% August 2009 298,800 $ PROJECTS IN PRE-DEVELOPMENT Location Anticipated Commencement Approximate Targeted Beds Estimated Project Cost Targeted Completion ASU Component III (2) Tempe, AZ TBD 1,500 110,000 $ TBD Carbondale Development (3) Carbondale, IL Second Quarter 2008 652 32,100 August 2009 142,100 $ Location Anticipated Commencement Approximate Targeted Beds Estimated Project Cost Targeted Completion TBD TBD TBD August 2010 (1) (2) (3) ACETM Awards Boise, ID Approximate Targeted Units Based on costs incurred under general construction contract as of March 31, 2008. As of March 31, 2008, the total Construction in Progress balance for these projects is $140.0 million, representing costs incurred under the total project budgets. Component development is contingent upon execution of all transactional documents, including a facility lease agreement with Arizona State University and Board of Regents approval. This development project is subject to final determination of feasibility, execution and closing on definitive agreements, complex entitlement and municipal approval processes, and fluctuations in the construction market. Project Barrett Honors College 575 Project Approximate Targeted Units Boise State University TBD 163 13
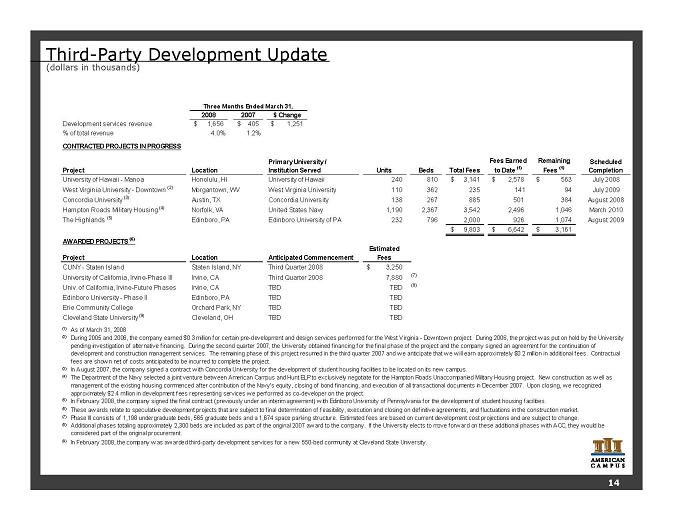
Third-Party Development Update (dollars in thousands) 2008 2007 $ Change Development services revenue 1,656 $ 405 $ 1,251 $ % of total revenue 4.0% 1.2% CONTRACTED PROJECTS IN PROGRESS Project Units Beds Total Fees Fees Earned to Date (1) Remaining Fees (1) Scheduled Completion University of Hawaii - Manoa 240 810 3,141 $ 2,578 $ 563 $ July 2008 West Virginia University - Downtown (2) West Virginia University 110 362 235 141 94 July 2009 Concordia University (3) Austin, TX Concordia University 138 267 885 501 384 August 2008 Hampton Roads Military Housing (4) 1,190 2,367 3,542 2,496 1,046 March 2010 The Highlands (5) Edinboro, PA Edinboro University of PA 232 796 2,000 926 1,074 August 2009 9,803 $ 6,642 $ 3,161 $ AWARDED PROJECTS (6) Project Estimated Fees CUNY - Staten Island Staten Island, NY Third Quarter 2008 3,250 $ University of California, Irvine-Phase III Irvine, CA Third Quarter 2008 7,880 (7) Univ. of California, Irvine-Future Phases Irvine, CA TBD TBD (8) Edinboro University - Phase II Edinboro, PA TBD TBD Erie Community College Orchard Park, NY TBD TBD Cleveland State University (9) Cleveland, OH TBD TBD (1) As of March 31, 2008 (2) (3) (4) (5) (6) (7) Phase III consists of 1,198 undergraduate beds, 565 graduate beds and a 1,674 space parking structure. Estimated fees are based on current development cost projections and are subject to change. (8) (9) In February 2008, the company w as aw arded third-party development services for a new 550-bed community at Cleveland State University. The Department of the Navy selected a joint venture betw een American Campus and Hunt ELP to exclusively negotiate for the Hampton Roads Unaccompanied Military Housing project. New construction as w ell as management of the existing housing commenced after contribution of the Navy's equity, closing of bond financing, and execution of all transactional documents in December 2007. Upon closing, w e recognized approximately $2.4 million in development fees representing services w e performed as co-developer on the project. These aw ards relate to speculative development projects that are subject to final determination of feasibility, execution and closing on definitive agreements, and fluctuations in the construction market. During 2005 and 2006, the company earned $0.3 million for certain pre-development and design services performed for the West Virginia - Dow ntow n project. During 2006, the project w as put on hold by the University pending investigation of alternative financing. During the second quarter 2007, the University obtained financing for the final phase of the project and the company signed an agreement for the continuation of development and construction management services. The remaining phase of this project resumed in the third quarter 2007 and w e anticipate that w e w ill earn approximately $0.2 million in additional fees. Contractual fees are show n net of costs anticipated to be incurred to complete the project. In August 2007, the company signed a contract w ith Concordia University for the development of student housing facilities to be located on its new campus. In February 2008, the company signed the final contract (previously under an interim agreement) w ith Edinboro University of Pennsylvania for the development of student housing facilities. United States Navy Morgantown, WV Honolulu, HI Norfolk, VA Additional phases totaling approximately 2,300 beds are included as part of the original 2007 aw ard to the company. If the University elects to move forw ard on these additional phases w ith ACC, they w ould be considered part of the original procurement. Three Months Ended March 31, Location Primary University / Institution Served University of Hawaii Location Anticipated Commencement 14
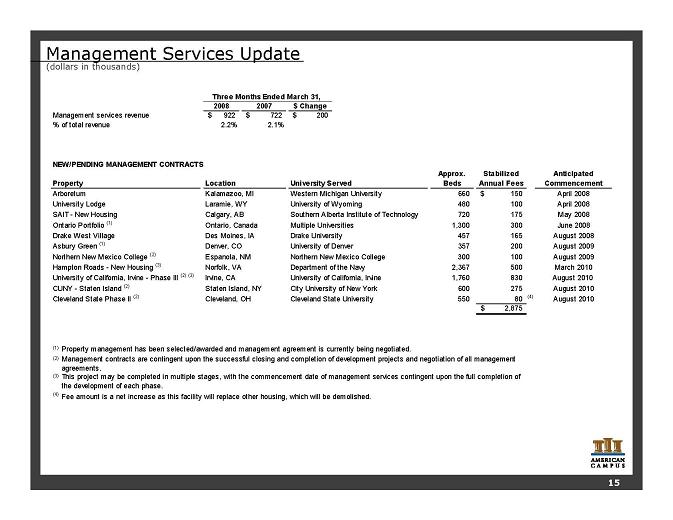
Management Services Update (dollars in thousands) 2008 2007 $ Change Management services revenue 922 $ 722 $ 200 $ % of total revenue 2.2% 2.1% NEW/PENDING MANAGEMENT CONTRACTS Property Approx. Beds Stabilized Annual Fees Anticipated Commencement Arboretum Kalamazoo, MI Western Michigan University 660 150 $ April 2008 University Lodge Laramie, WY University of Wyoming 480 100 April 2008 SAIT - New Housing Calgary, AB Southern Alberta Institute of Technology 720 175 May 2008 Ontario Portfolio (1) Ontario, Canada Multiple Universities 1,300 300 June 2008 Drake West Village Des Moines, IA Drake University 457 165 August 2008 Asbury Green (1) Denver, CO University of Denver 357 200 August 2009 Northern New Mexico College (2) Espanola, NM Northern New Mexico College 300 100 August 2009 Hampton Roads - New Housing (3) Norfolk, VA Department of the Navy 2,367 500 March 2010 University of California, Irvine - Phase III (2) (3) Irvine, CA University of California, Irvine 1,760 830 August 2010 CUNY - Staten Island (2) Staten Island, NY City University of New York 600 275 August 2010 Cleveland State Phase II (2) Cleveland, OH Cleveland State University 550 80 (4) August 2010 2,875 $ (1) (2) (3) (4) Fee amount is a net increase as this facility will replace other housing, which will be demolished. This project may be completed in multiple stages, with the commencement date of management services contingent upon the full completion of the development of each phase. Management contracts are contingent upon the successful closing and completion of development projects and negotiation of all management agreements. Three Months Ended March 31, Location University Served Property management has been selected/awarded and management agreement is currently being negotiated. 15
Investor Information Executive Management William C. Bayless, Jr. Chief Executive Officer Greg A. Dow ell Chief Operating Officer Jon Graf Chief Financial Officer James C. Hopke Executive Vice President, Project Management and Construction Brian Nickel Chief Investment Officer Research Coverage Craig Melcher / Michael Bilerman Citigroup Equity Research (212) 816-0231 / (212) 816-1383 craig.melcher@citigroup.com / bilerman.reits@citi.com Louis Taylor / Christeen Kim Deutsche Bank - North America (212) 250-4912 / (212) 250-6771 louis.taylor@db.com / christeen.kim@db.com Andrew McCulloch / Craig Leupold Green Street Advisors (949) 940-8780 amcculloch@greenstreetadvisors.com / cleupold@greentstreetadvisors.com Anthony Paolone / Joseph Dazio J.P. Morgan Securities (212) 622-6682 / (212) 622-6416 anthony.paolone@jpmorgan.com / joseph.c.dazio@jpmorgan.com Jordan Sadler / Karin Ford KeyBanc Capital Markets (917) 368-2280 / (917) 368-2293 jsadler@keybanccm.com / kford@keybanccm.com Steve Sakw a / David Bragg Merrill Lynch (212) 449-0335 / (212) 449-8922 steve_sakwa@ml.com / david_bragg@ml.com Paula Poskon Robert W. Baird & Co., Inc. (703) 821-5782 pposkon@rw baird.com Stephen Sw ett Keefe, Bruyette, & Woods (212) 887-3680 ssw ett@kbw.com Alexander Goldfarb / Andrew Ryu UBS Investment Research (212) 713 3998 / (212) 713 3226 alexander.goldfarb@ubs.com / andrew .ryu@ubs.com Investor Relations: Gina Cow art VP, Investor Relations and Corporate Marketing (512) 732-1041 gcow art@studenthousing.com 805 Las Cimas Parkw ay, Suite 400 Austin, Texas 78746 Tel: (512) 732-1000; Fax: (512) 732-2450 www .studenthousing.com American Campus Communities, Inc. is follow ed by the analysts listed above. Please note that any opinions, estimates or forecasts regarding American Campus Communities, Inc.'s performance made by such analysts are theirs alone and do not represent the opinions, forecasts or predictions of American Campus Communities, Inc. or its management. American Campus Communities, Inc. does not by its reference above or distribution imply its endorsement of or concurrence w ith such information, conclusions or recommendations. Additional Information Corporate Headquarters: American Campus Communities, Inc. 16
Forward Looking Statements This supplemental package contains forward-looking statements, which express the current beliefs and expectations of management. Except for historical information, the matters discussed in this supplemental package are forward-looking statements and can be identified by the use of the words "anticipate," "believe," "expect," "intend," "may," "might," "plan," "estimate," "project," "should," "will," "result" and similar expressions. Such statements are based on current expectations and involve a number of known and unknown risks and uncertainties that could cause our future results, performance or achievements to differ significantly from the results, performance or achievements expressed or implied by such forward-looking statements. Our actual results could differ materially from those anticipated in these forward-looking statements as a result of various factors, including risks and uncertainties related to the proposed transactions (including but not limited to (i) the occurrence of any effect, event, development or change that could give rise to the termination of the definitive agreements, (ii) the inability to complete the proposed transactions, including in the case of the merger, due to the failure of GMH’s shareholders to approve the merger, (iii) the failure of any party to satisfy the conditions to the closing of the transactions and (iv) the failure of ACC to obtain the necessary financing arrangements set forth in a commitment letter received in connection with the proposed merger), inherent in the national economy, the real estate industry in general, and in our specific markets; the effect of terrorism or the threat of terrorism; legislative or regulatory changes including changes to laws governing REITs; our dependence on key personnel whose continued service is not guaranteed; availability of qualified acquisition and development targets; availability of capital and financing; rising interest rates; rising insurance rates; impact of ad valorem and income taxation; changes in generally accepted accounting principals; and our continued ability to successfully lease and operate our properties. While we believe these forward-looking statements are based on reasonable assumptions, we can give no assurance that our expectations will be achieved. These forward-looking statements are made as of the date of this supplemental package, and we undertake no obligation to update publicly or revise any forward-looking statement, whether as a result of new information, future developments or otherwise. Additional Information about the Merger and Where to Find It This supplemental package does not constitute an offer of any securities for sale. In connection with the merger, American Campus Communities, Inc. (“ACC”) has filed with the SEC a registration statement on Form S-4, which includes a proxy statement/prospectus of GMH Communities Trust (“GMH”) and ACC and other relevant materials in connection with the proposed transactions. The proxy statement/prospectus will be mailed to GMH shareholders starting on April 30, 3008. Investors and security holders of ACC and GMH are urged to read the proxy statement/prospectus and the other relevant material when they become available because they will contain important information about ACC, GMH and the proposed transactions. The proxy statement/prospectus and other relevant materials (when they become available), and any and all documents filed by ACC or GMH with the SEC, may be obtained free of charge at the SEC’s web site at www.sec.gov. Investors and security holders may obtain free copies of the documents filed with the SEC by ACC by directing a written request to American Campus Communities, Inc., 805 Las Cimas Parkway, Suite 400, Austin, Texas 78746 Attention: Investor Relations. In addition, investors and security holders may obtain free copies of the documents filed with the SEC by GMH Communities by directing a written request to GMH Communities Trust, 10 Campus Boulevard, Newtown Square, Pennsylvania 19073, Attention: Investor Relations. INVESTORS AND SECURITY HOLDERS ARE URGED TO READ THE PROXY STATEMENT/PROSPECTUS AND THE OTHER RELEVANT MATERIALS WHEN THEY BECOME AVAILABLE BEFORE MAKING ANY VOTING OR INVESTMENT DECISION WITH RESPECT TO THE PROPOSED TRANSACTIONS. ACC, GMH and their respective executive officers, directors and trustees may be deemed to be participants in the solicitation of proxies from the security holders of GMH in connection with the merger. Information about those executive officers and directors of ACC and their ownership of ACC common stock is set forth in the proxy statement for ACC’s 2008 Annual Meeting of Stockholders, which was filed with the SEC on April 2, 2008. Information about the executive officers and trustees of GMH and their ownership of GMH common shares is set forth in the Annual Report on Form 10K/A of GMH, which was filed with the SEC on April 29, 2008. Investors and security holders may obtain additional information regarding the direct and indirect interests of ACC, GMH and their respective executive officers, directors and trustees in the merger by reading the proxy statement and prospectus regarding the merger when they become available.