Exhibit 99.2
Supplemental Analyst Package Third Quarter 2008 Earnings Call October 29, 2008
Table of Contents Financial Highlights 1 Consolidated Balance Sheets 2 Consolidated Statements of Operations 3 Consolidated Statements of Funds from Operations 4 Property Results of Operations 5 Capital Structure 6 Portfolio Overview 7 Owned Development Update 8 Third-party Development Update 9 Management Services Update 10 Investor Information 11
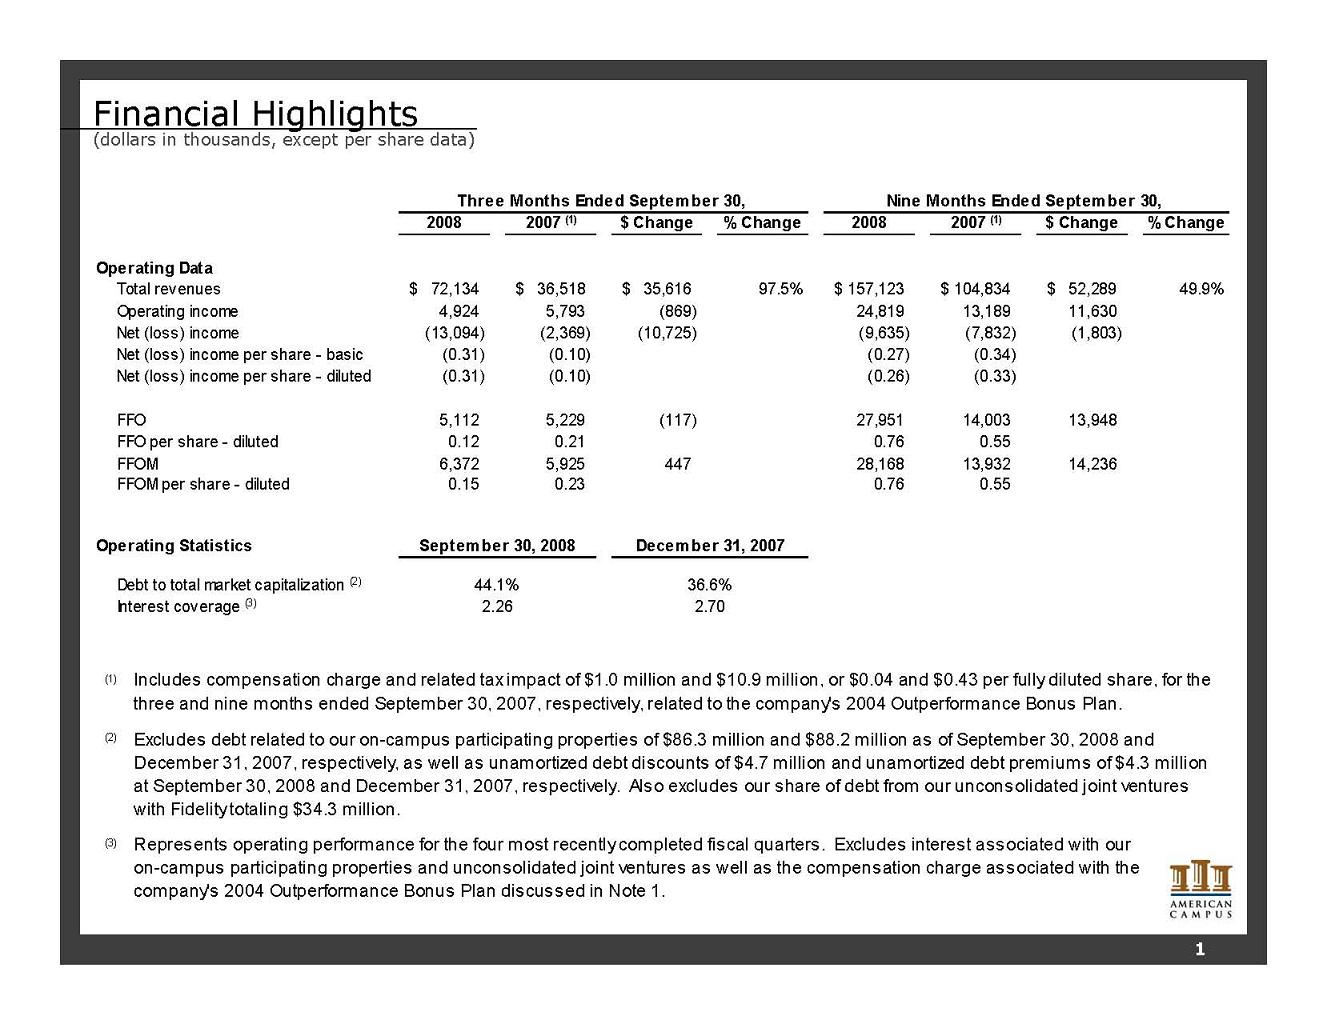
Financial Highlights (dollars in thousands, except per share data) 2008 2007 (1) $ Change % Change 2008 2007 (1) $ Change % Change 72,134 $ 36,518 $ 35,616 $ 97.5% 157,123 $ 104,834 $ 52,289 $ 49.9% 4,924 5,793 (869) 24,819 13,189 11,630 (13,094) (2,369) (10,725) (9,635) (7,832) (1,803) Net (loss) income per share - basic (0.31) (0.10) (0.27) (0.34) Net (loss) income per share - diluted (0.31) (0.10) (0.26) (0.33) 5,112 5,229 (117) 27,951 14,003 13,948 FFO per share - diluted 0.12 0.21 0.76 0.55 6,372 5,925 447 28,168 13,932 14,236 FFOM per share - diluted 0.15 0.23 0.76 0.55 December 31, 2007 Debt to total market capitalization (2) 44.1% 36.6% FFO FFOM Operating Statistics September 30, 2008 Nine Months Ended September 30, Three Months Ended September 30, Operating income Net (loss) income Operating Data Total revenues Represents operating performance for the four most recently completed fiscal quarters. Excludes interest associated with our on-campus participating properties and unconsolidated joint ventures as well as the compensation charge associated with the company's 2004 Outperformance Bonus Plan discussed in Note 1. 2.26 2.70 Interest coverage (3) (3) (1) (2) Includes compensation charge and related tax impact of $1.0 million and $10.9 million, or $0.04 and $0.43 per fully diluted share, for the three and nine months ended September 30, 2007, respectively, related to the company's 2004 Outperformance Bonus Plan. Excludes debt related to our on-campus participating properties of $86.3 million and $88.2 million as of September 30, 2008 and December 31, 2007, respectively, as well as unamortized debt discounts of $4.7 million and unamortized debt premiums of $4.3 million at September 30, 2008 and December 31, 2007, respectively. Also excludes our share of debt from our unconsolidated joint ventures with Fidelity totaling $34.3 million. 1
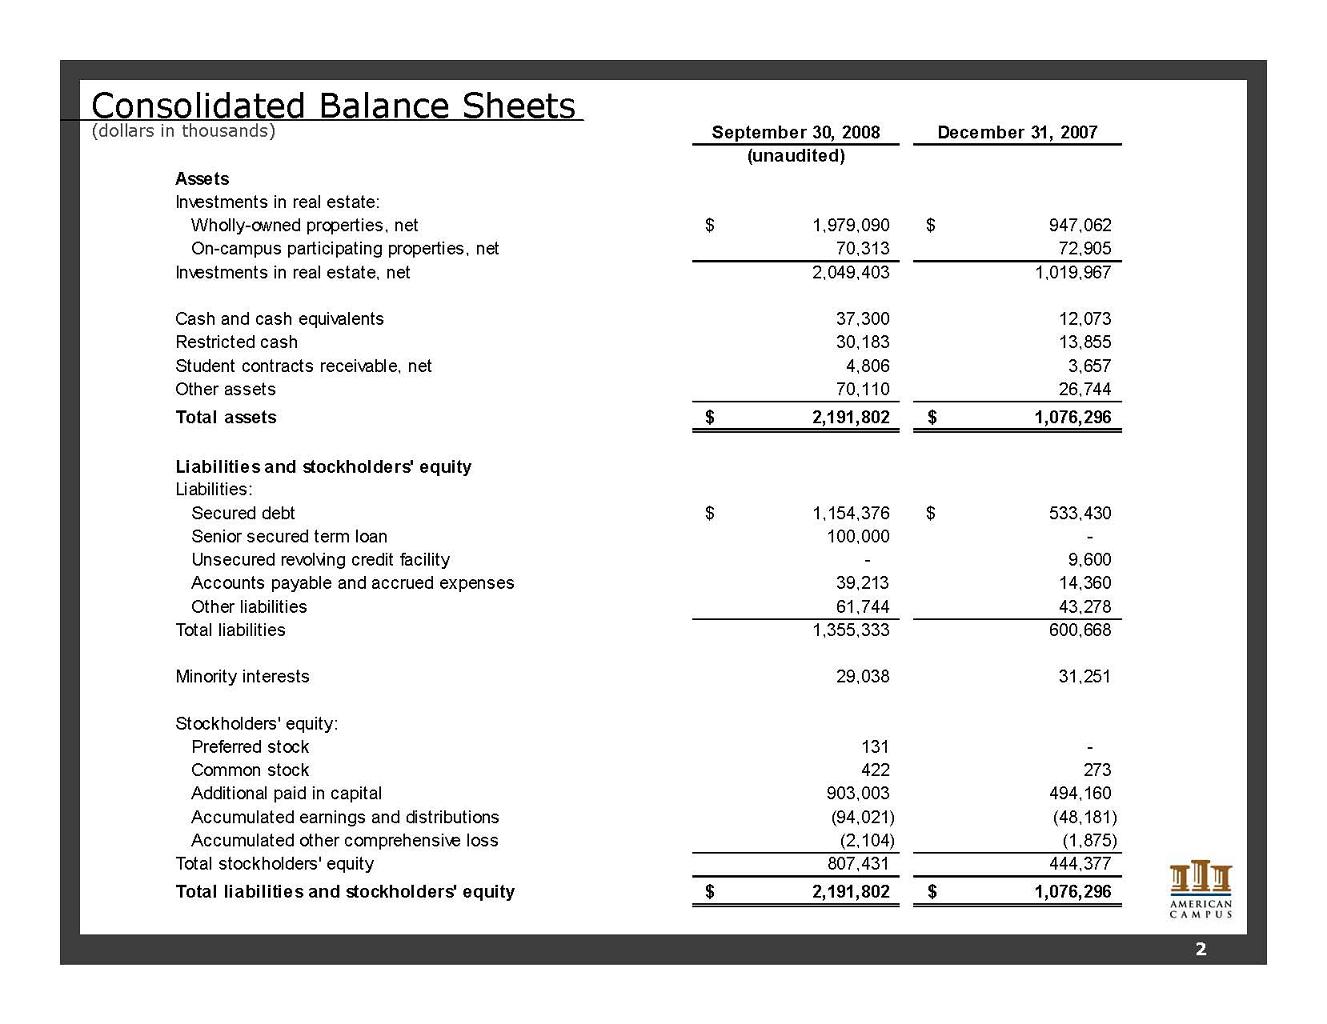
Consolidated Balance Sheets (dollars in thousands) 2 September 30, 2008 December 31, 2007 (unaudited) Assets Investments in real estate: Wholly-owned properties, net 1,979,090 $ 947,062 $ On-campus participating properties, net 70,313 72,905 Investments in real estate, net 2,049,403 1,019,967 Cash and cash equivalents 37,300 12,073 Restricted cash 30,183 13,855 Student contracts receivable, net 4,806 3,657 Other assets 70,110 26,744 Total assets 2,191,802 $ 1,076,296 $ Liabilities and stockholders' equity Liabilities: Secured debt 1,154,376 $ 533,430 $ Senior secured term loan 100,000 - Unsecured revolving credit facility - 9,600 Accounts payable and accrued expenses 39,213 14,360 Other liabilities 61,744 43,278 Total liabilities 1,355,333 600,668 Minority interests 29,038 31,251 Stockholders' equity: Preferred stock 131 - Common stock 422 273 Additional paid in capital 903,003 494,160 Accumulated earnings and distributions (94,021) (48,181) Accumulated other comprehensive loss (2,104) (1,875) Total stockholders' equity 807,431 444,377 Total liabilities and stockholders' equity 2,191,802 $ 1,076,296 $
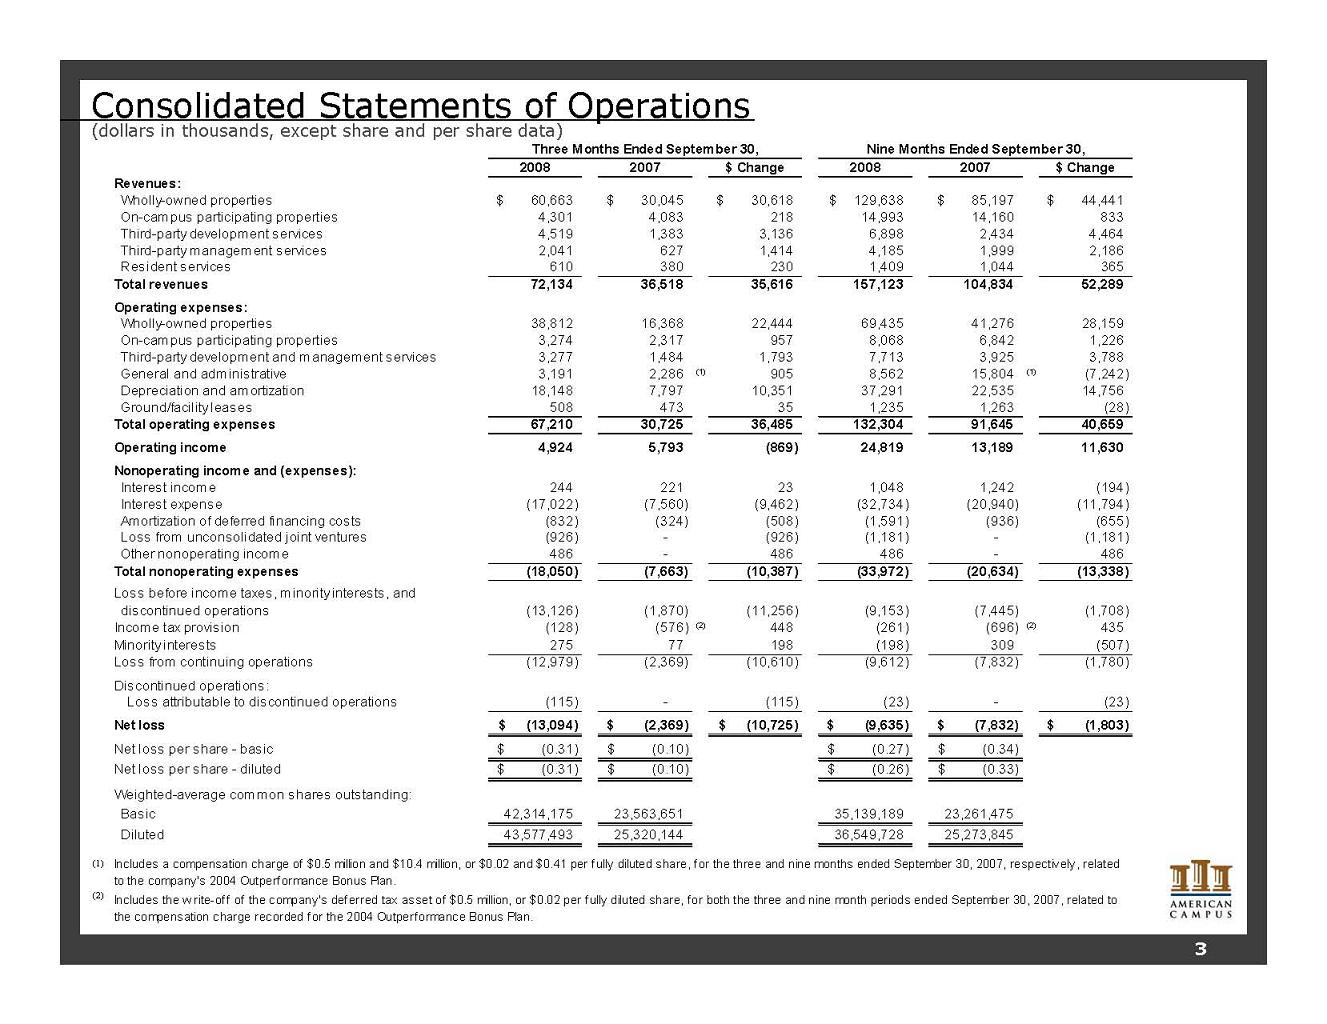
2008 2007 $ Change 2008 2007 $ Change Revenues: Wholly-owned properties 60,663 $ 30,045 $ 30,618 $ 129,638 $ 85,197 $ 44,441 $ On-campus participating properties 4,301 4,083 218 14,993 14,160 833 Third-party development services 4,519 1,383 3,136 6,898 2,434 4,464 Third-party management services 2,041 627 1,414 4,185 1,999 2,186 Resident services 610 380 230 1,409 1,044 365 Total revenues 72,134 36,518 35,616 157,123 104,834 52,289 Operating expenses: Wholly-owned properties 38,812 16,368 22,444 69,435 41,276 28,159 On-campus participating properties 3,274 2,317 957 8,068 6,842 1,226 Third-party development and management services 3,277 1,484 1,793 7,713 3,925 3,788 General and administrative 3,191 2,286 (1) 905 8,562 15,804 (1) (7,242) Depreciation and amortization 18,148 7,797 10,351 37,291 22,535 14,756 Ground/facility leases 508 473 35 1,235 1,263 (28) Total operating expenses 67,210 30,725 36,485 132,304 91,645 40,659 Operating income 4,924 5,793 (869) 24,819 13,189 11,630 Nonoperating income and (expenses): Interest income 244 221 23 1,048 1,242 (194) Interest expense (17,022) (7,560) (9,462) (32,734) (20,940) (11,794) Amortization of deferred financing costs (832) (324) (508) (1,591) (936) (655) Loss from unconsolidated joint ventures (926) - (926) (1,181) - (1,181) Other nonoperating income 486 - 486 486 - 486 Total nonoperating expenses (18,050) (7,663) (10,387) (33,972) (20,634) (13,338) (13,126) (1,870) (11,256) (9,153) (7,445) (1,708) Income tax provision (128) (576) (2) 448 (261) (696) (2) 435 Minority interests 275 77 198 (198) 309 (507) Loss from continuing operations (12,979) (2,369) (10,610) (9,612) (7,832) (1,780) Discontinued operations: Loss attributable to discontinued operations (115) - (115) (23) - (23) Net loss (13,094) $ (2,369) $ (10,725) $ (9,635) $ (7,832) $ (1,803) $ Net loss per share - basic (0.31) $ (0.10) $ (0.27) $ (0.34) $ Net loss per share - diluted (0.31) $ (0.10) $ (0.26) $ (0.33) $ Weighted-average common shares outstanding: Basic 42,314,175 23,563,651 35,139,189 23,261,475 Diluted 43,577,493 25,320,144 36,549,728 25,273,845 (1) (2) Includes the w rite-off of the company's deferred tax asset of $0.5 million, or $0.02 per fully diluted share, for both the three and nine month periods ended September 30, 2007, related to the compensation charge recorded for the 2004 Outperformance Bonus Plan. Three Months Ended September 30, Nine Months Ended September 30, Loss before income taxes, minority interests, and discontinued operations Includes a compensation charge of $0.5 million and $10.4 million, or $0.02 and $0.41 per fully diluted share, for the three and nine months ended September 30, 2007, respectively, related to the company's 2004 Outperformance Bonus Plan. Consolidated Statements of Operations (dollars in thousands, except share and per share data) 3
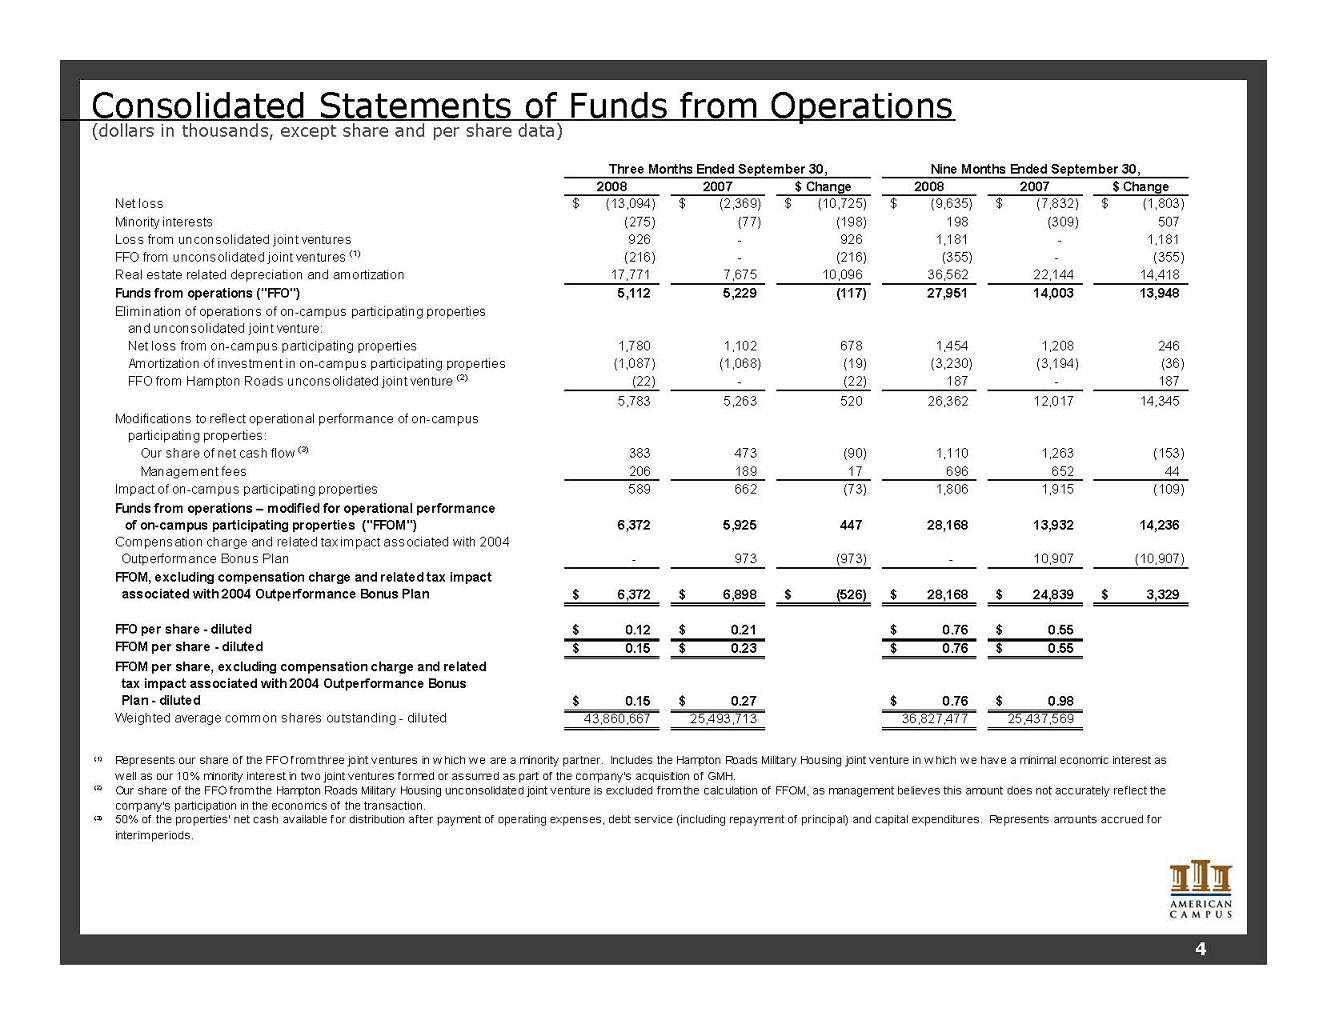
Consolidated Statements of Funds from Operations (dollars in thousands, except share and per share data) 2008 2007 $ Change 2008 2007 $ Change Net loss (13,094) $ (2,369) $ (10,725) $ (9,635) $ (7,832) $ (1,803) $ Minority interests (275) (77) (198) 198 (309) 507 Loss from unconsolidated joint ventures 926 - 926 1,181 - 1,181 FFO from unconsolidated joint ventures (1) (216) - (216) (355) - (355) Real estate related depreciation and amortization 17,771 7,675 10,096 36,562 22,144 14,418 Funds from operations ("FFO") 5,112 5,229 (117) 27,951 14,003 13,948 Elimination of operations of on-campus participating properties and unconsolidated joint venture: Net loss from on-campus participating properties 1,780 1,102 678 1,454 1,208 246 Amortization of investment in on-campus participating properties (1,087) (1,068) (19) (3,230) (3,194) (36) FFO from Hampton Roads unconsolidated joint venture (2) (22) - (22) 187 - 187 5,783 5,263 520 26,362 12,017 14,345 Modifications to reflect operational performance of on-campus participating properties: Our share of net cash flow (3) 383 473 (90) 1,110 1,263 (153) Management fees 206 189 17 696 652 44 Impact of on-campus participating properties 589 662 (73) 1,806 1,915 (109) Funds from operations – modified for operational performance of on-campus participating properties ("FFOM") 6,372 5,925 447 28,168 13,932 14,236 Compensation charge and related tax impact associated with 2004 Outperformance Bonus Plan - 973 (973) - 10,907 (10,907) FFOM, excluding compensation charge and related tax impact associated with 2004 Outperformance Bonus Plan 6,372 $ 6,898 $ (526) $ 28,168 $ 24,839 $ 3,329 $ FFO per share - diluted 0.12 $ 0.21 $ 0.76 $ 0.55 $ FFOM per share - diluted 0.15 $ 0.23 $ 0.76 $ 0.55 $ FFOM per share, excluding compensation charge and related tax impact associated with 2004 Outperformance Bonus Plan - diluted 0.15 $ 0.27 $ 0.76 $ 0.98 $ Weighted average common shares outstanding - diluted 43,860,667 25,493,713 36,827,477 25,437,569 (1) (2) (3) Three Months Ended September 30, Nine Months Ended September 30, Represents our share of the FFO from three joint ventures in w hich w e are a minority partner. Includes the Hampton Roads Military Housing joint venture in w hich w e have a minimal economic interest as w ell as our 10% minority interest in tw o joint ventures formed or assumed as part of the company's acquisition of GMH. 50% of the properties' net cash available for distribution after payment of operating expenses, debt service (including repayment of principal) and capital expenditures. Represents amounts accrued for interim periods. Our share of the FFO from the Hampton Roads Military Housing unconsolidated joint venture is excluded from the calculation of FFOM, as management believes this amount does not accurately reflect the company's participation in the economics of the transaction. 4
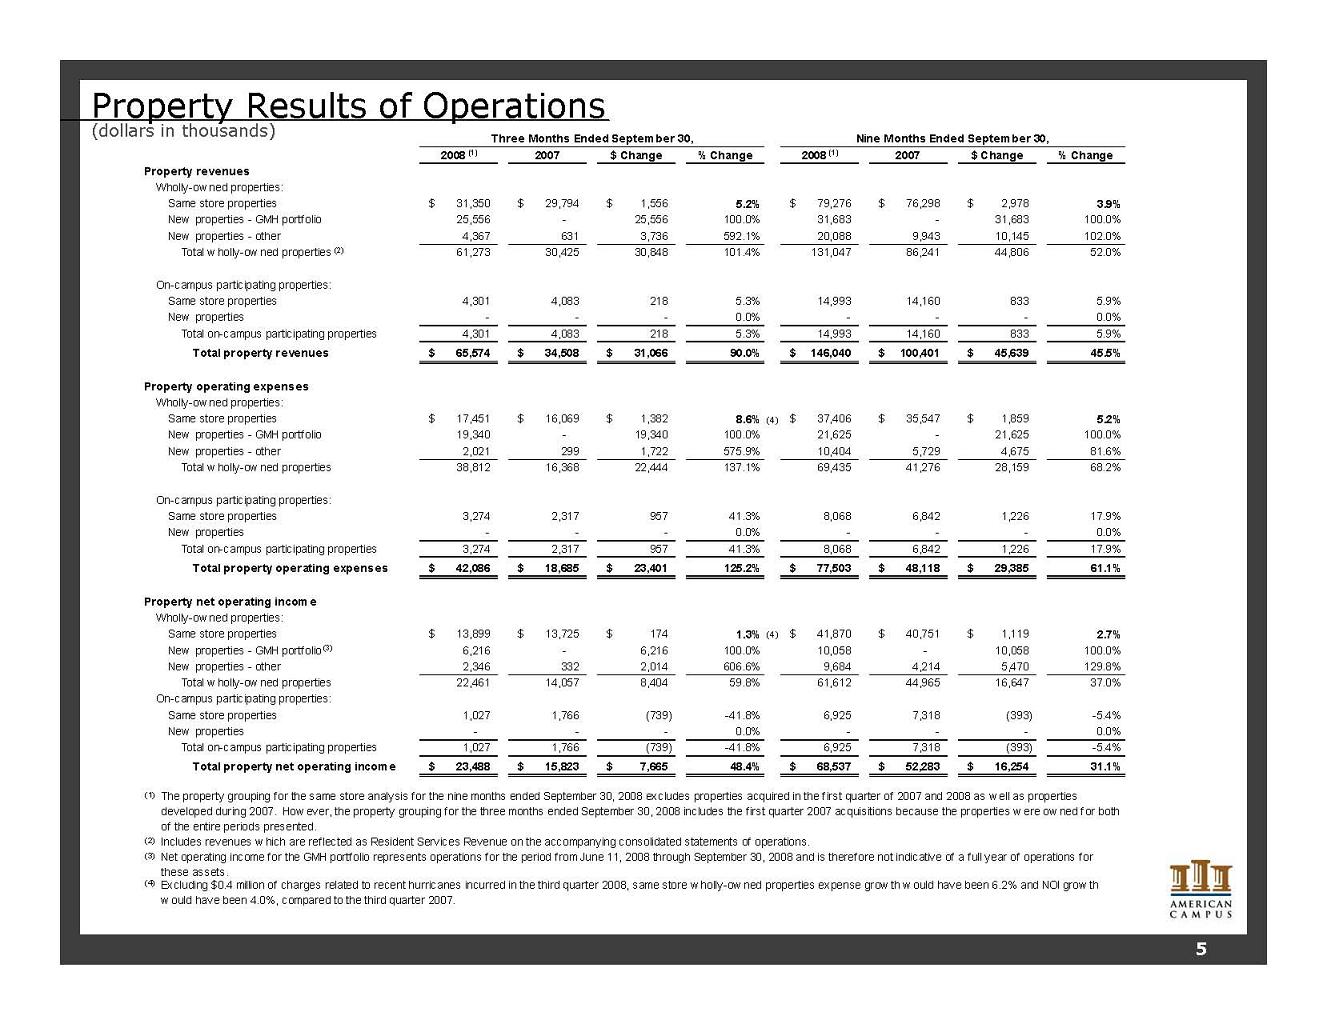
Property Results of Operations (dollars in thousands) 2008 (1) 2007 $ Change % Change 2008 (1) 2007 $ Change % Change Property revenues Wholly-ow ned properties: Same store properties 31,350 $ 29,794 $ 1,556 $ 5.2% 79,276 $ 76,298 $ 2,978 $ 3.9% New properties - GMH portfolio 25,556 - 25,556 100.0% 31,683 - 31,683 100.0% New properties - other 4,367 631 3,736 592.1% 20,088 9,943 10,145 102.0% Total w holly-ow ned properties (2) 61,273 30,425 30,848 101.4% 131,047 86,241 44,806 52.0% On-campus participating properties: Same store properties 4,301 4,083 218 5.3% 14,993 14,160 833 5.9% New properties - - - 0.0% - - - 0.0% Total on-campus participating properties 4,301 4,083 218 5.3% 14,993 14,160 833 5.9% Total property revenues 65,574 $ 34,508 $ 31,066 $ 90.0% 146,040 $ 100,401 $ 45,639 $ 45.5% Property operating expenses Wholly-ow ned properties: Same store properties 17,451 $ 16,069 $ 1,382 $ 8.6% (4) 37,406 $ 35,547 $ 1,859 $ 5.2% New properties - GMH portfolio 19,340 - 19,340 100.0% 21,625 - 21,625 100.0% New properties - other 2,021 299 1,722 575.9% 10,404 5,729 4,675 81.6% Total w holly-ow ned properties 38,812 16,368 22,444 137.1% 69,435 41,276 28,159 68.2% On-campus participating properties: Same store properties 3,274 2,317 957 41.3% 8,068 6,842 1,226 17.9% New properties - - - 0.0% - - - 0.0% Total on-campus participating properties 3,274 2,317 957 41.3% 8,068 6,842 1,226 17.9% Total property operating expenses 42,086 $ 18,685 $ 23,401 $ 125.2% 77,503 $ 48,118 $ 29,385 $ 61.1% Property net operating income Wholly-ow ned properties: Same store properties 13,899 $ 13,725 $ 174 $ 1.3% (4) 41,870 $ 40,751 $ 1,119 $ 2.7% New properties - GMH portfolio (3) 6,216 - 6,216 100.0% 10,058 - 10,058 100.0% New properties - other 2,346 332 2,014 606.6% 9,684 4,214 5,470 129.8% Total w holly-ow ned properties 22,461 14,057 8,404 59.8% 61,612 44,965 16,647 37.0% On-campus participating properties: Same store properties 1,027 1,766 (739) -41.8% 6,925 7,318 (393) -5.4% New properties - - - 0.0% - - - 0.0% Total on-campus participating properties 1,027 1,766 (739) -41.8% 6,925 7,318 (393) -5.4% Total property net operating income 23,488 $ 15,823 $ 7,665 $ 48.4% 68,537 $ 52,283 $ 16,254 $ 31.1% (1) (2) (3) (4) Excluding $0.4 million of charges related to recent hurricanes incurred in the third quarter 2008, same store w holly-ow ned properties expense grow th w ould have been 6.2% and NOI grow th w ould have been 4.0%, compared to the third quarter 2007. Net operating income for the GMH portfolio represents operations for the period from June 11, 2008 through September 30, 2008 and is therefore not indicative of a full year of operations for these assets. Three Months Ended September 30, Nine Months Ended September 30, Includes revenues w hich are reflected as Resident Services Revenue on the accompanying consolidated statements of operations. The property grouping for the same store analysis for the nine months ended September 30, 2008 excludes properties acquired in the first quarter of 2007 and 2008 as w ell as properties developed during 2007. How ever, the property grouping for the three months ended September 30, 2008 includes the first quarter 2007 acquisitions because the properties w ere ow ned for both of the entire periods presented. 5
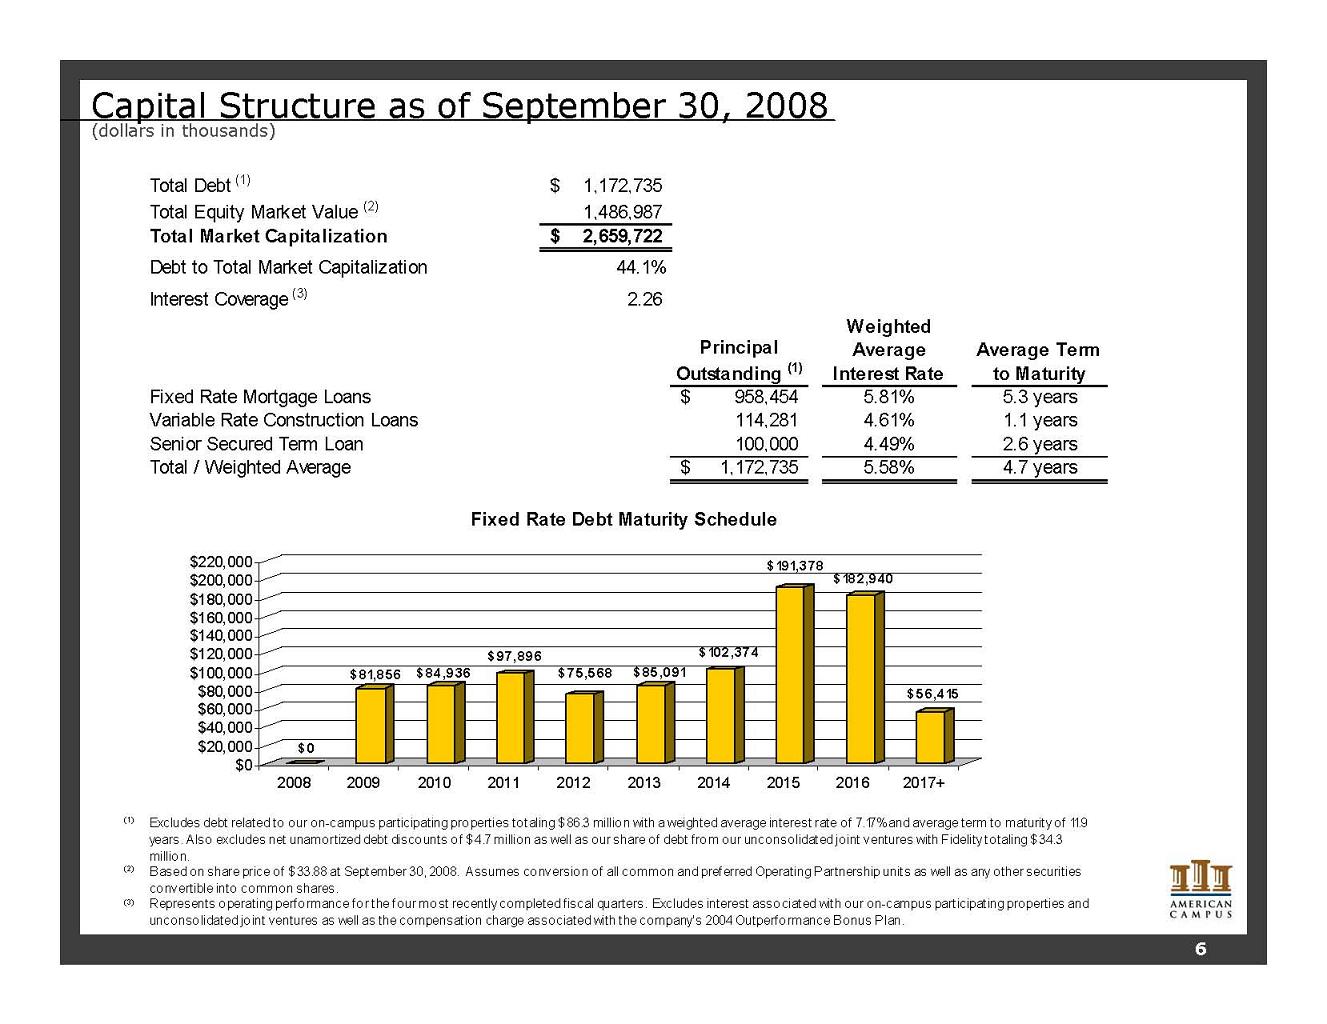
Capital Structure as of September 30, 2008 (dollars in thousands) Total Debt (1) 1,172,735 $ Total Equity Market Value (2) 1,486,987 Total Market Capitalization 2,659,722 $ Debt to Total Market Capitalization 44.1% Interest Coverage (3) 2.26 Principal Outstanding (1) Weighted Average Interest Rate Average Term to Maturity Fixed Rate Mortgage Loans 958,454 $ 5.81% 5.3 years Variable Rate Construction Loans 114,281 4.61% 1.1 years Senior Secured Term Loan 100,000 4.49% 2.6 years Total / Weighted Average 1,172,735 $ 5.58% 4.7 years (1) (2) (3) Fixed Rate Debt Maturity Schedule Excludes debt related to our on-campus participating properties totaling $86.3 million with a weighted average interest rate of 7.17% and average term to maturity of 11.9 years. A lso excludes net unamortized debt discounts of $4.7 million as well as our share of debt from our unconsolidated joint ventures with Fidelity totaling $34.3 million. Based on share price of $33.88 at September 30, 2008. Assumes conversion of all common and preferred Operating Partnership units as well as any other securities convertible into common shares. Represents operating performance for the four most recently completed fiscal quarters. Excludes interest associated with our o n-campus participating properties and unconsolidated joint ventures as well as the compensation charge associated with the company's 2004 Outperformance Bonus P lan. $ 0 $ 81,856 $ 84,936 $ 97,896 $ 75,568 $ 85,091 $ 102,374 $ 191,378 $ 182,940 $ 56,415 $0 $20,000 $40,000 $60,000 $80,000 $100,000 $120,000 $140,000 $160,000 $180,000 $200,000 $220,000 2008 2009 2010 2011 2012 2013 2014 2015 2016 2017+ 6
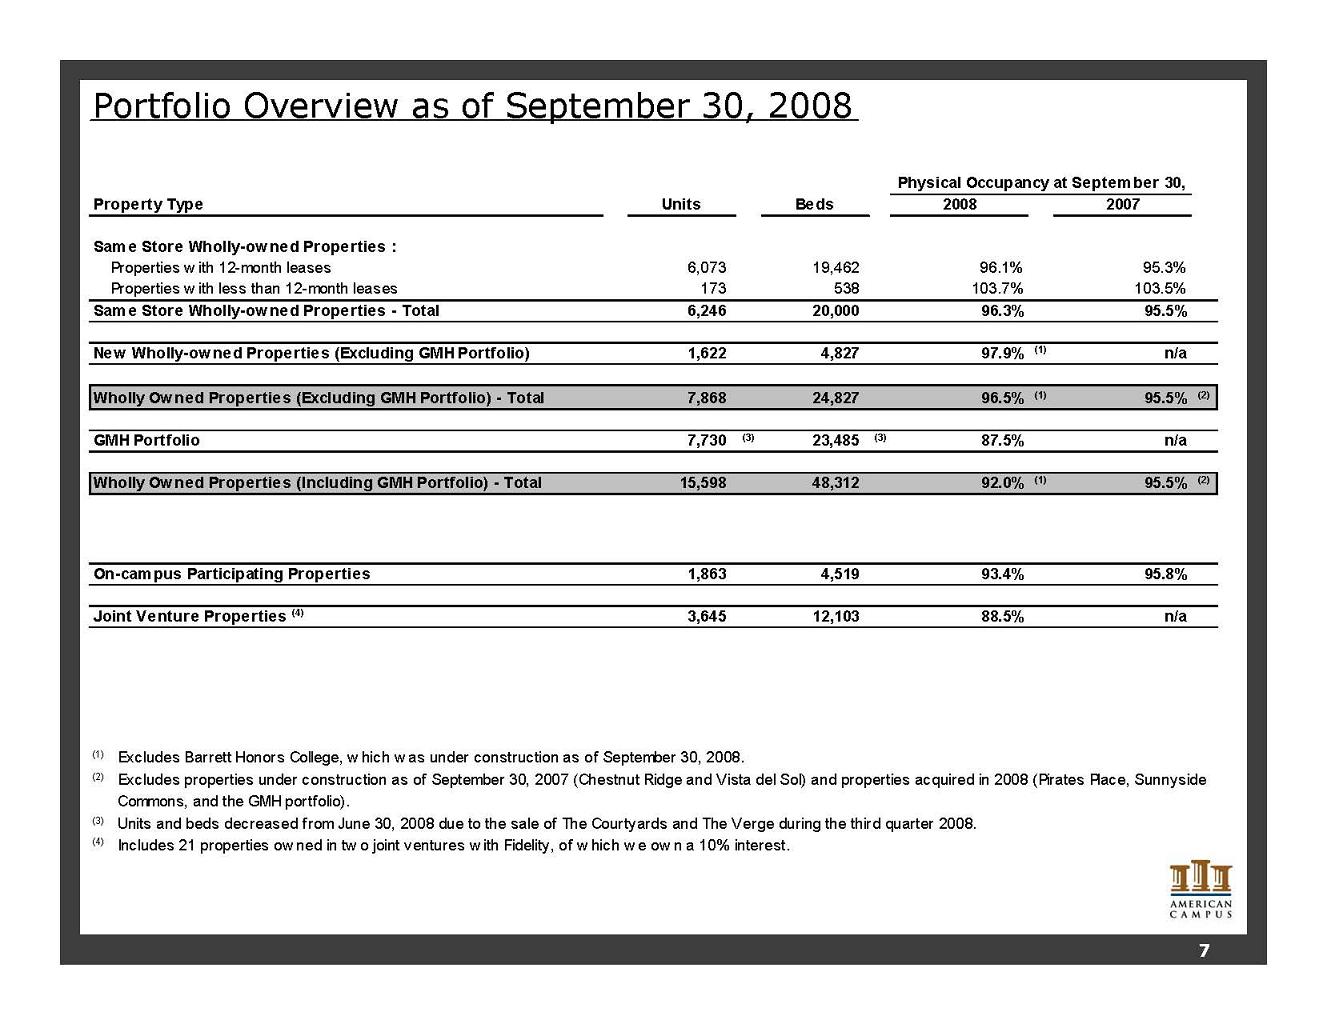
Portfolio Overview as of September 30, 2008 Units Beds 2008 2007 Same Store Wholly-owned Properties : Properties w ith 12-month leases 6,073 19,462 96.1% 95.3% Properties w ith less than 12-month leases 173 538 103.7% 103.5% Same Store Wholly-owned Properties - Total 6,246 20,000 96.3% 95.5% New Wholly-owned Properties (Excluding GMH Portfolio) 1,622 4,827 97.9% (1) n/a Wholly Owned Properties (Excluding GMH Portfolio) - Total 7,868 24,827 96.5% (1) 95.5% (2) GMH Portfolio 7,730 (3) 23,485 (3) 87.5% n/a Wholly Owned Properties (Including GMH Portfolio) - Total 15,598 48,312 92.0% (1) 95.5% (2) On-campus Participating Properties 1,863 4,519 93.4% 95.8% Joint Venture Properties (4) 3,645 12,103 88.5% n/a (1) (2) (3) (4) Includes 21 properties ow ned in tw o joint ventures w ith Fidelity, of w hich w e ow n a 10% interest. Physical Occupancy at September 30, Property Type Excludes properties under construction as of September 30, 2007 (Chestnut Ridge and Vista del Sol) and properties acquired in 2008 (Pirates Place, Sunnyside Commons, and the GMH portfolio). Excludes Barrett Honors College, w hich w as under construction as of September 30, 2008. Units and beds decreased from June 30, 2008 due to the sale of The Courtyards and The Verge during the third quarter 2008. 7
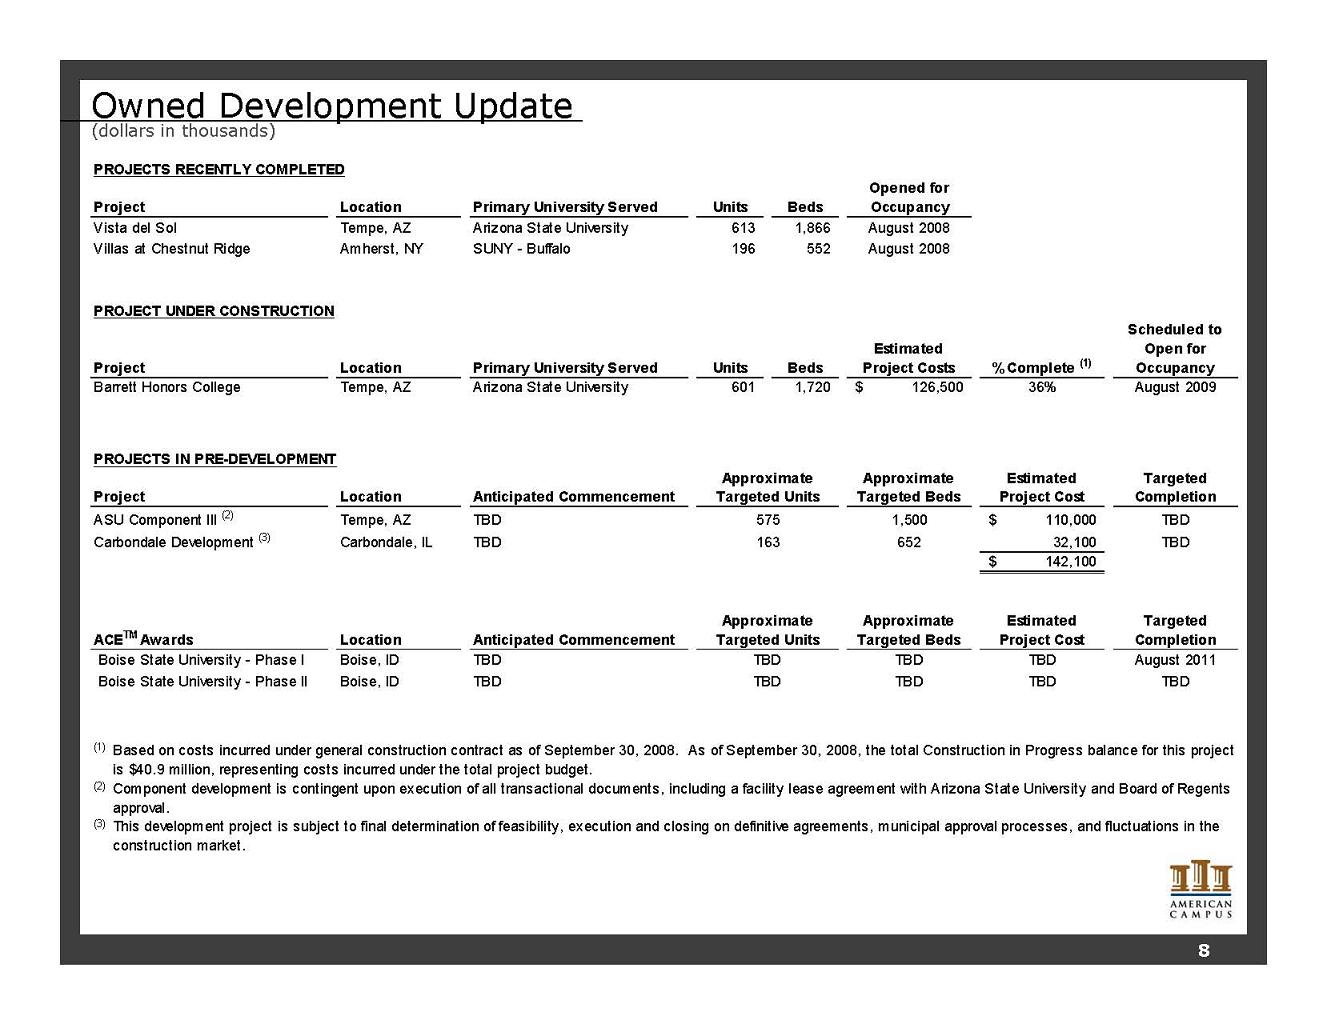
Owned Development Update (dollars in thousands) PROJECTS RECENTLY COMPLETED Location Primary University Served Units Beds Opened for Occupancy Vista del Sol Tempe, AZ Arizona State University 613 1,866 August 2008 Villas at Chestnut Ridge Amherst, NY SUNY - Buffalo 196 552 August 2008 PROJECT UNDER CONSTRUCTION Location Primary University Served Units Beds Estimated Project Costs % Complete (1) Scheduled to Open for Occupancy Tempe, AZ Arizona State University 601 1,720 126,500 $ 36% August 2009 PROJECTS IN PRE-DEVELOPMENT Location Anticipated Commencement Approximate Targeted Beds Estimated Project Cost Targeted Completion ASU Component III (2) Tempe, AZ TBD 1,500 110,000 $ TBD Carbondale Development (3) Carbondale, IL TBD 652 32,100 TBD 142,100 $ Location Anticipated Commencement Approximate Targeted Beds Estimated Project Cost Targeted Completion TBD TBD TBD August 2011 TBD TBD TBD TBD (1) (2) (3) Project 575 Project Approximate Targeted Units 163 Project Barrett Honors College Component development is contingent upon execution of all transactional documents, including a facility lease agreement with Arizona State University and Board of Regents approval. This development project is subject to final determination of feasibility, execution and closing on definitive agreements, municipal approval processes, and fluctuations in the construction market. ACETM Awards Boise, ID Approximate Targeted Units Based on costs incurred under general construction contract as of September 30, 2008. As of September 30, 2008, the total Construction in Progress balance for this project is $40.9 million, representing costs incurred under the total project budget. Boise State University - Phase I Boise, ID TBD Boise State University - Phase II TBD 8
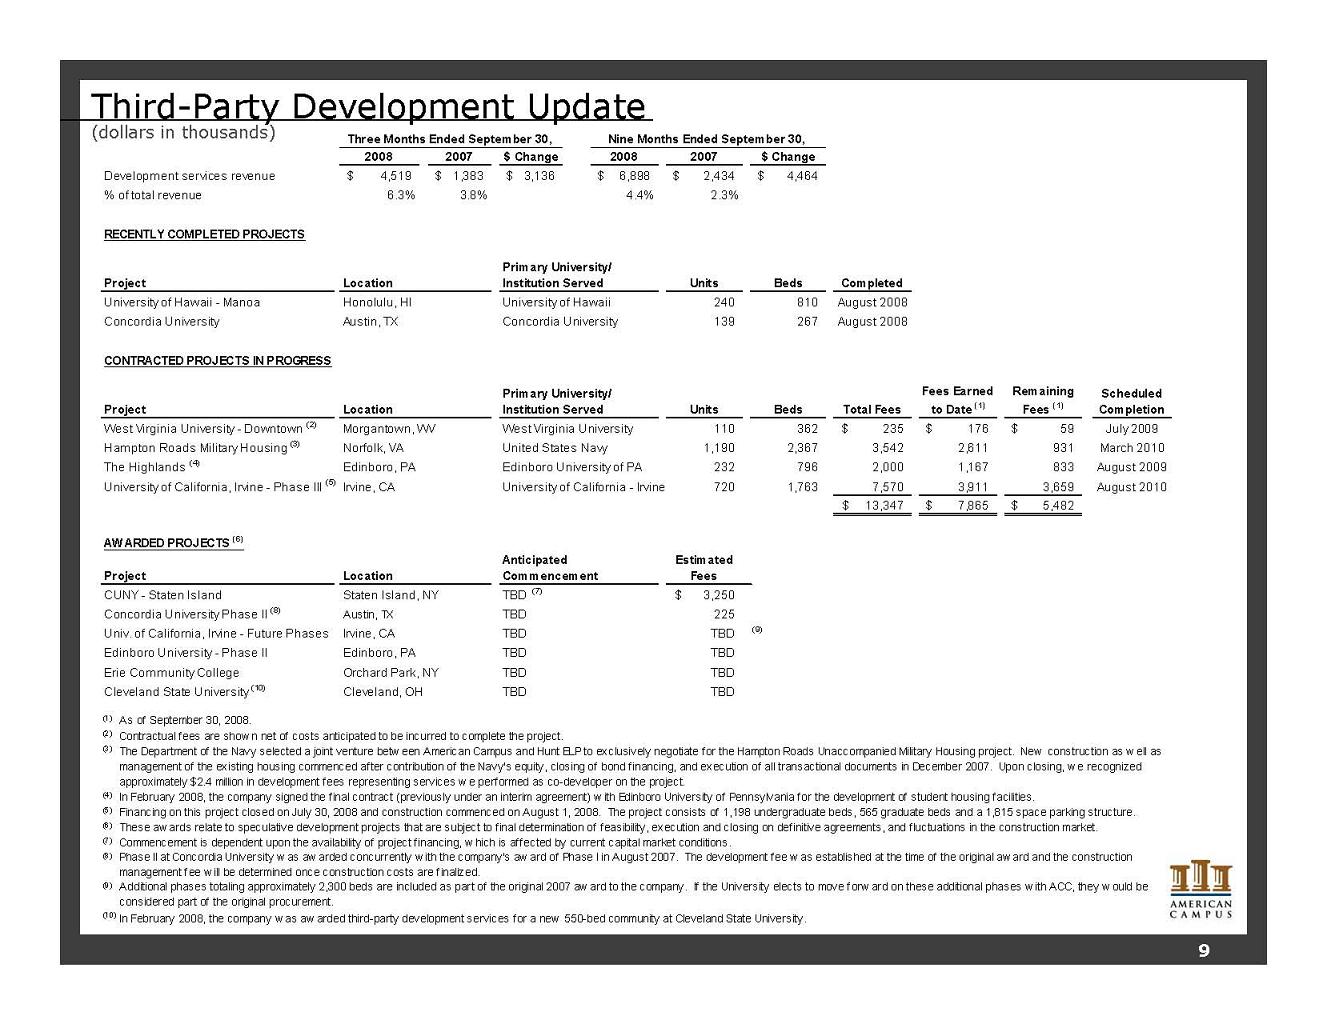
Third-Party Development Update (dollars in thousands) 2008 2007 $ Change 2008 2007 $ Change Development services revenue 4,519 $ 1,383 $ 3,136 $ 6,898 $ 2,434 $ 4,464 $ % of total revenue 6.3% 3.8% 4.4% 2.3% RECENTLY COMPLETED PROJECTS Project Units Beds Completed University of Hawaii - Manoa 240 810 August 2008 Concordia University Austin, TX Concordia University 139 267 August 2008 CONTRACTED PROJECTS IN PROGRESS Project Units Beds Total Fees Fees Earned to Date (1) Remaining Fees (1) Scheduled Completion West Virginia University - Downtown (2) West Virginia University 110 362 235 $ 176 $ 59 $ July 2009 Hampton Roads Military Housing (3) 1,190 2,367 3,542 2,611 931 March 2010 The Highlands (4) Edinboro, PA Edinboro University of PA 232 796 2,000 1,167 833 August 2009 University of California, Irvine - Phase III (5) Irvine, CA University of California - Irvine 720 1,763 7,570 3,911 3,659 August 2010 13,347 $ 7,865 $ 5,482 $ AWARDED PROJECTS (6) Project Estimated Fees CUNY - Staten Island Staten Island, NY TBD (7) 3,250 $ Concordia University Phase II (8) Austin, TX TBD 225 Univ. of California, Irvine - Future Phases Irvine, CA TBD TBD (9) Edinboro University - Phase II Edinboro, PA TBD TBD Erie Community College Orchard Park, NY TBD TBD Cleveland State University (10) Cleveland, OH TBD TBD (1) As of September 30, 2008. (2) Contractual fees are show n net of costs anticipated to be incurred to complete the project. (3) (4) (5) (6) (7) Commencement is dependent upon the availability of project financing, w hich is affected by current capital market conditions. (8) (9) (10) In February 2008, the company w as aw arded third-party development services for a new 550-bed community at Cleveland State University. United States Navy Phase II at Concordia University w as aw arded concurrently w ith the company's aw ard of Phase I in August 2007. The development fee w as established at the time of the original aw ard and the construction management fee w ill be determined once construction costs are finalized. Morgantown, WV Location The Department of the Navy selected a joint venture betw een American Campus and Hunt ELP to exclusively negotiate for the Hampton Roads Unaccompanied Military Housing project. New construction as w ell as management of the existing housing commenced after contribution of the Navy's equity, closing of bond financing, and execution of all transactional documents in December 2007. Upon closing, w e recognized approximately $2.4 million in development fees representing services w e performed as co-developer on the project. These aw ards relate to speculative development projects that are subject to final determination of feasibility, execution and closing on definitive agreements, and fluctuations in the construction market. Anticipated Commencement Norfolk, VA Financing on this project closed on July 30, 2008 and construction commenced on August 1, 2008. The project consists of 1,198 undergraduate beds, 565 graduate beds and a 1,815 space parking structure. In February 2008, the company signed the final contract (previously under an interim agreement) w ith Edinboro University of Pennsylvania for the development of student housing facilities. Additional phases totaling approximately 2,300 beds are included as part of the original 2007 aw ard to the company. If the University elects to move forw ard on these additional phases w ith ACC, they w ould be considered part of the original procurement. Nine Months Ended September 30, Three Months Ended September 30, Location Primary University/ Institution Served Location Primary University/ Institution Served Honolulu, HI University of Hawaii 9
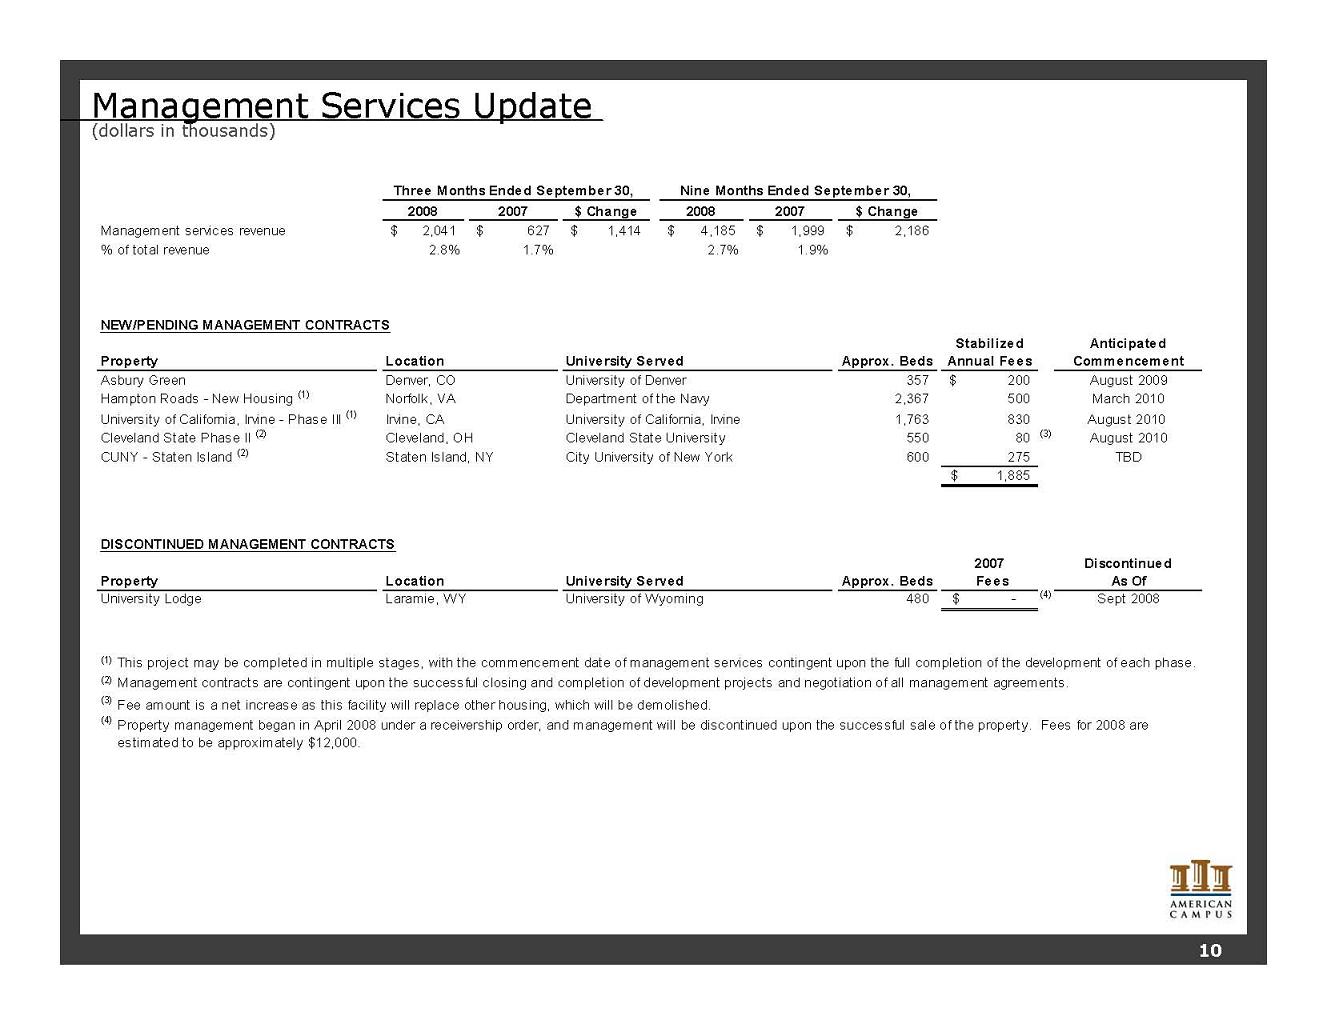
Management Services Update (dollars in thousands) 2008 2007 $ Change 2008 2007 $ Change Management services revenue 2,041 $ 627 $ 1,414 $ 4,185 $ 1,999 $ 2,186 $ % of total revenue 2.8% 1.7% 2.7% 1.9% NEW/PENDING MANAGEMENT CONTRACTS Property Approx. Beds Stabilized Annual Fees Anticipated Commencement Asbury Green Denver, CO University of Denver 357 200 $ August 2009 Hampton Roads - New Housing (1) Norfolk, VA Department of the Navy 2,367 500 March 2010 University of California, Irvine - Phase III (1) Irvine, CA University of California, Irvine 1,763 830 August 2010 Cleveland State Phase II (2) Cleveland, OH Cleveland State University 550 80 (3) August 2010 CUNY - Staten Island (2) Staten Island, NY City University of New York 600 275 TBD 1,885 $ DISCONTINUED MANAGEMENT CONTRACTS Property Approx. Beds 2007 Fees Discontinued As Of University Lodge Laramie, WY University of Wyoming 480 - $ (4) Sept 2008 (1) (2) (3) (4) Fee amount is a net increase as this facility will replace other housing, which will be demolished. Management contracts are contingent upon the successful closing and completion of development projects and negotiation of all management agreements. Property management began in April 2008 under a receivership order, and management will be discontinued upon the successful sale of the property. Fees for 2008 are estimated to be approximately $12,000. Location University Served This project may be completed in multiple stages, with the commencement date of management services contingent upon the full completion of the development of each phase. Three Months Ended September 30, Location University Served Nine Months Ended September 30, 10
Investor Information Executive Management William C. Bayless, Jr. Chief Executive Officer Brian Nickel Chief Investment Officer Greg A. Dow ell Chief Operating Officer Jon Graf Chief Financial Officer James C. Hopke Executive Vice President, Project Management and Construction Research Coverage David Toti / Michael Bilerman Citigroup Equity Research (212) 816-1909/ (212) 816-1383 david.toti@citi.com / michael.bilerman@citi.com Louis Taylor Deutsche Bank - North America (203) 863-2381 louis.taylor@db.com Andrew McCulloch / Craig Leupold Green Street Advisors (949) 640-8780 amcculloch@greenstreetadvisors.com / cleupold@greenstreetadvisors.com Anthony Paolone / Joseph Dazio J.P. Morgan Securities (212) 622-6682 / (212) 622-6416 anthony.paolone@jpmorgan.com / joseph.c.dazio@jpmorgan.com Stephen Sw ett Keefe, Bruyette, & Woods (212) 887-3680 ssw ett@kbw .com Jordan Sadler / Karin Ford KeyBanc Capital Markets (917) 368-2280 / (917) 368-2293 jsadler@keybanccm.com / kford@keybanccm.com Steve Sakw a / David Bragg Merrill Lynch (212) 449-0335 / (212) 449-8922 steve_sakw a@ml.com / david_bragg@ml.com Paula Poskon / Lindsey Yao Robert W. Baird & Co., Inc. (703) 821-5782 / (703) 918-7852 pposkon@rw baird.com / lyao@rw baird.com Michelle Ko / Andrew Ryu UBS Investment Research (212) 713-3893 / (212) 713-3998 michelle.ko@ubs.com / andrew .ryu@ubs.com Investor Relations: Gina Cow art VP, Investor Relations and Corporate Marketing (512) 732-1041 gcow art@studenthousing.com American Campus Communities, Inc. is follow ed by the analysts listed above. Please note that any opinions, estimates or forecasts regarding American Campus Communities, Inc.'s performance made by such analysts are theirs alone and do not represent the opinions, forecasts or predictions of American Campus Communities, Inc. or its management. American Campus Communities, Inc. does not by its reference above or distribution imply its endorsement of or concurrence w ith such information, conclusions or recommendations. Additional Information Corporate Headquarters: American Campus Communities, Inc. 805 Las Cimas Parkw ay, Suite 400 Austin, Texas 78746 Tel: (512) 732-1000; Fax: (512) 732-2450 w w w .studenthousing.com 11
Forward Looking Statements This supplemental package contains forward-looking statements, which express the current beliefs and expectations of management. Except for historical information, the matters discussed in this supplemental package are forward-looking statements and can be identified by the use of the words "anticipate," "believe," "expect," "intend," "may," "might," "plan," "estimate," "project," "should," "will," "result" and similar expressions. Such statements are based on current expectations and involve a number of known and unknown risks and uncertainties that could cause our future results, performance or achievements to differ significantly from the results, performance or achievements expressed or implied by such forwardlooking statements. Our actual results could differ materially from those anticipated in these forward-looking statements as a result of various factors, including risks and uncertainties; our abilities to successfully integrate the operations of GMH Communities Trust; inherent in the national economy, the real estate industry in general, and in our specific markets; the effect of terrorism or the threat of terrorism; legislative or regulatory changes including changes to laws governing REITs; our dependence on key personnel whose continued service is not guaranteed; availability of qualified acquisition and development targets; availability of capital and financing; rising interest rates; rising insurance rates; impact of ad valorem and income taxation; changes in generally accepted accounting principals; and our continued ability to successfully lease and operate our properties. While we believe these forward-looking statements are based on reasonable assumptions, we can give no assurance that our expectations will be achieved. These forward-looking statements are made as of the date of this supplemental package, and we undertake no obligation to update publicly or revise any forward-looking statement, whether as a result of new information, future developments or otherwise.