Exhibit 99.2
Supplemental Analyst Package Fourth Quarter 2008 Earnings Call February 18, 2009
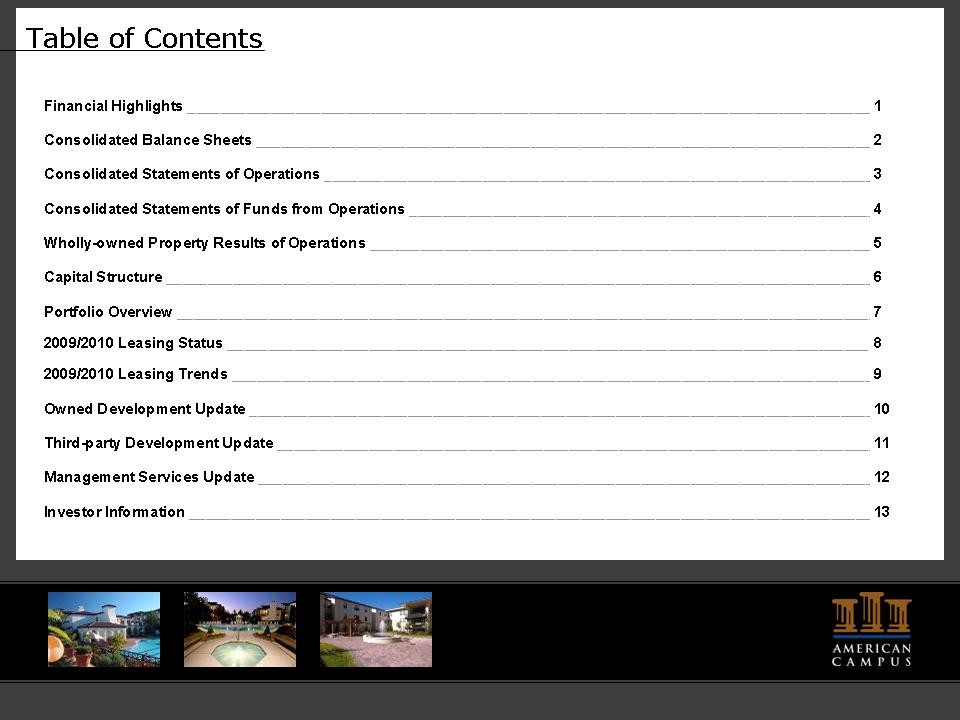
Table of Contents Financial Highlights 1 Consolidated Balance Sheets 2 Consolidated Statements of Operations 3 Consolidated Statements of Funds from Operations 4 Wholly-owned Property Results of Operations 5 Capital Structure 6 Portfolio Overview 7 2009/2010 Leasing Status 8 2009/2010 Leasing Trends 9 Owned Development Update 10 Third-party Development Update 11 Management Services Update 12 Investor Information 13
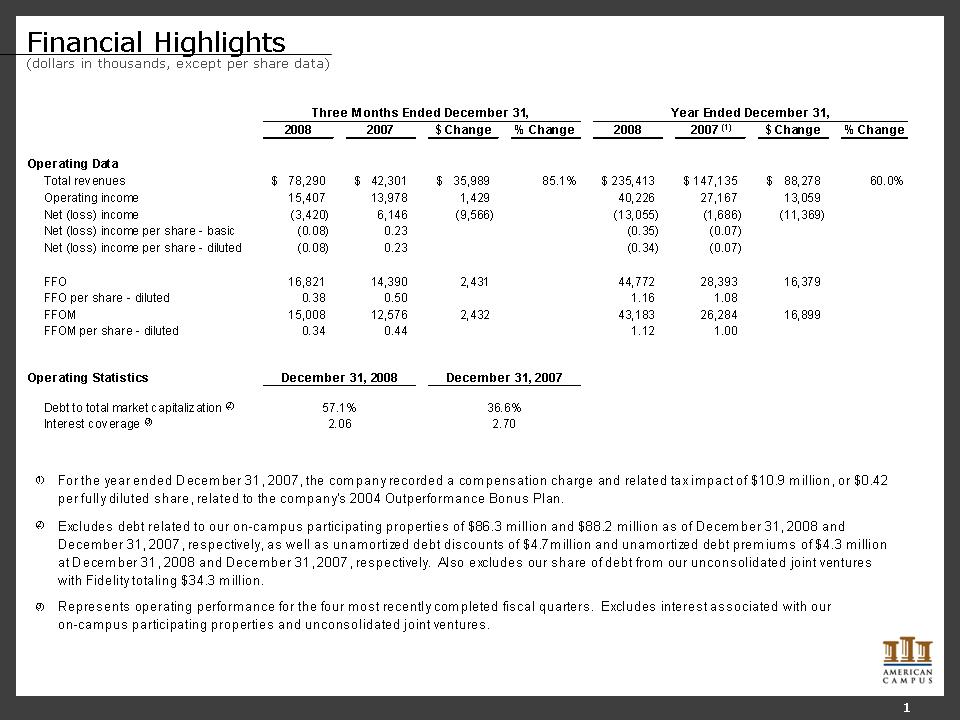
Financial Highlights (dollars in thousands, except per share data) 1 Three Months Ended December 31, Year Ended December 31, 2008 2007 $ Change % Change 2008 2007 (1) $ Change % Change Operating Data Total revenues $78,290 $42,301 $35,989 85.1% $235,413 $147,135 $88,278 60.0% Operating income 15,407 13,978 1,429 40,226 27,167 13,059 Net (loss) income (3,420) 6,146 (9,566) (13,055) (1,686) (11,369) Net (loss) income per share - basic (0.08) 0.23 (0.35) (0.07) Net (loss) income per share - diluted (0.08) 0.23 (0.34) (0.07) FFO 16,821 14,390 2,431 44,772 28,393 16,379 FFO per share - diluted 0.38 0.50 1.16 1.08 FFOM 15,008 12,576 2,432 43,183 26,284 16,899 FFOM per share - diluted 0.34 0.44 1.12 1.00 Operating Statistics December 31, 2008 December 31, 2007 Debt to total market capitalization (2) 57.1% 36.6% Interest coverage (3) 2.06 2.70 (1) For the year ended December 31, 2007, the company recorded a compensation charge and related tax impact of $10.9 million, or $0.42 per fully diluted share, related to the company's 2004 Outperformance Bonus Plan. (2) "Excludes debt related to our on-campus participating properties of $86.3 million and $88.2 million as of December 31, 2008 and December 31, 2007, respectively, as well as unamortized debt discounts of $4.7million and unamortized debt premiums of $4.3 million at December 31, 2008 and December 31, 2007, respectively. Also excludes our share of debt from our unconsolidated joint ventures with Fidelity totaling $34.3 million." (3) "Represents operating performance for the four most recently completed fiscal quarters. Excludes interest associated with our on-campus participating properties and unconsolidated joint ventures."
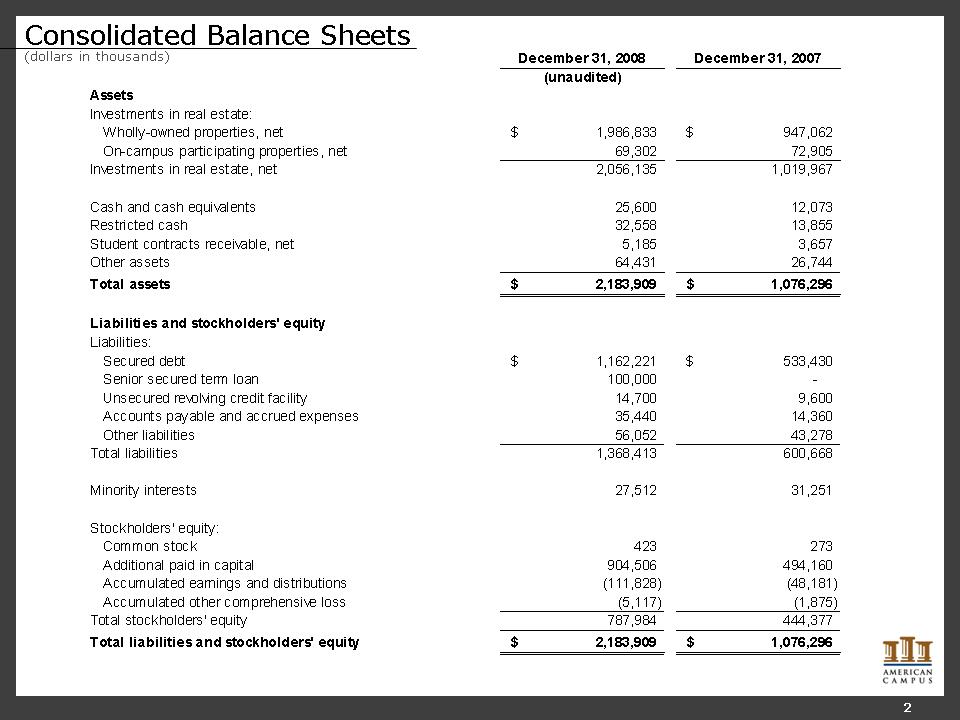
Consolidated Balance Sheets (dollars in thousands) 2 December 31, 2008 December 31, 2007 (unaudited) Wholly-owned properties, net $1,986,833 $947,062 On-campus participating properties, net 69,302 72,905 2,056,135 1,019,967 25,600 12,073 32,558 13,855 5,185 3,657 64,431 26,744 $2,183,909 $1,076,296 Secured debt $1,162,221 $533,430 Senior secured term loan 100,000 - Unsecured revolving credit facility 14,700 9,600 Accounts payable and accrued expenses 35,440 14,360 Other liabilities 56,052 43,278 1,368,413 600,668 27,512 31,251 Common stock 423 273 Additional paid in capital 904,506 494,160 Accumulated earnings and distributions (111,828) (48,181) Accumulated other comprehensive loss (5,117) (1,875) 787,984 444,377 $2,183,909 $1,076,296
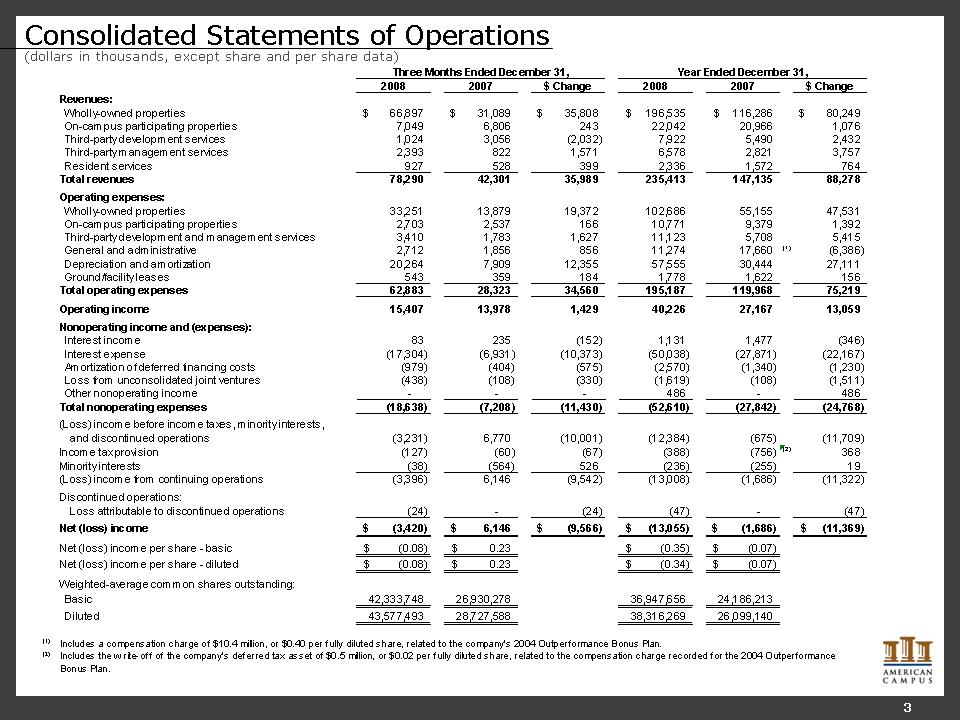
Consolidated Statements of Operations (dollars in thousands, except share and per share data) 3 Three Months Ended December 31, Year Ended December 31, 2008 2007 $ Change 2008 2007 $ Change Revenues: Wholly-owned properties $66,897 $31,089 $35,808 $196,535 $116,286 $80,249 On-campus participating properties 7,049 6,806 243 22,042 20,966 1,076 Third-party development services 1,024 3,056 (2,032) 7,922 5,490 2,432 Third-party management services 2,393 822 1,571 6,578 2,821 3,757 Resident services 927 528 399 2,336 1,572 764 Total revenues 78,290 42,301 35,989 235,413 147,135 88,278 Operating expenses: Wholly-owned properties 33,251 13,879 19,372 102,686 55,155 47,531 On-campus participating properties 2,703 2,537 166 10,771 9,379 1,392 Third-party development and management services 3,410 1,783 1,627 11,123 5,708 5,415 General and administrative 2,712 1,856 856 11,274 17,660 (1) (6,386) Depreciation and amortization 20,264 7,909 12,355 57,555 30,444 27,111 Ground/facility leases 543 359 184 1,778 1,622 156 Total operating expenses 62,883 28,323 34,560 195,187 119,968 75,219 Operating income 15,407 13,978 1,429 40,226 27,167 13,059 Nonoperating income and (expenses): Interest income 83 235 (152) 1,131 1,477 (346) Interest expense (17,304) (6,931) (10,373) (50,038) (27,871) (22,167) Amortization of deferred financing costs (979) (404) (575) (2,570) (1,340) (1,230) Loss from unconsolidated joint ventures (438) (108) (330) (1,619) (108) (1,511) Other nonoperating income - - - 486 - 486 Total nonoperating expenses (18,638) (7,208) (11,430) (52,610) (27,842) (24,768) "(Loss) income before income taxes, minority interests, and discontinued operations" (3,231) 6,770 (10,001) (12,384) (675) (11,709) Income tax provision (127) (60) (67) (388) (756) (2) 368 Minority interests (38) (564) 526 (236) (255) 19 (Loss) income from continuing operations (3,396) 6,146 (9,542) (13,008) (1,686) (11,322) Discontinued operations: Loss attributable to discontinued operations (24) - (24) (47) - (47) Net (loss) income $(3,420) $6,146 $(9,566) $(13,055) $(1,686) $(11,369) Net (loss) income per share - basic $(0.08) $0.23 $(0.35) $(0.07) Net (loss) income per share - diluted $(0.08) $0.23 $(0.34) $(0.07) Weighted-average common shares outstanding: Basic 42,333,748 26,930,278 36,947,656 24,186,213 Diluted 43,577,493 28,727,588 38,316,269 26,099,140 Includes a compensation charge of $10.4 million, or $0.40 per fully diluted share, related to the company's 2004 Outperformance Bonus Plan. Includes the write-off of the company's deferred tax asset of $0.5 million, or $0.02 per fully diluted share, related to the compensation charge recorded for the 2004 Outperformance Bonus Plan.
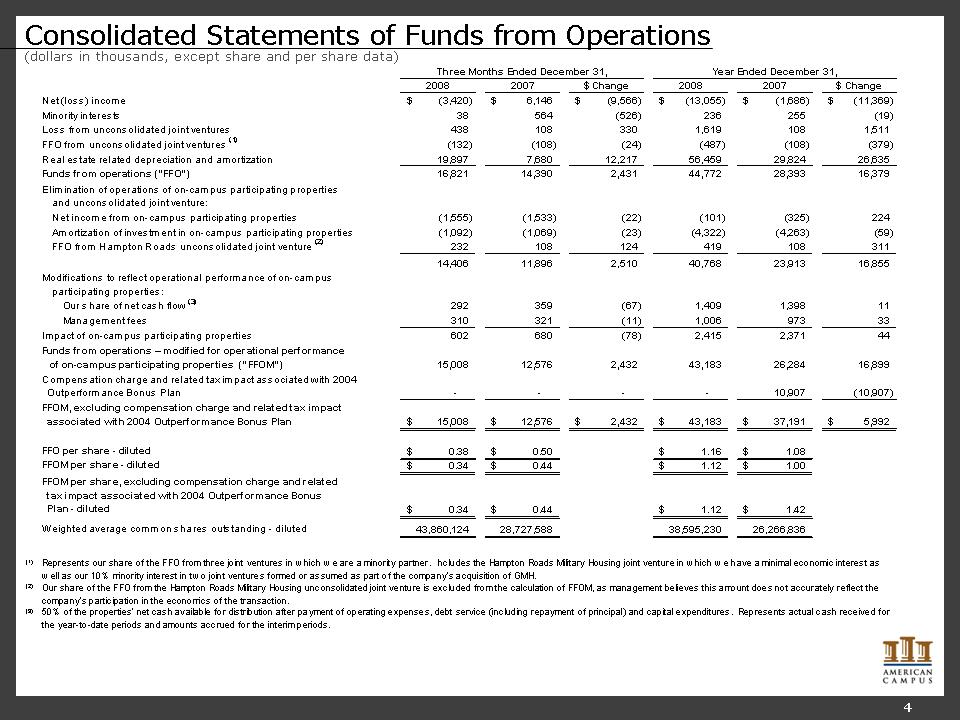
Consolidated Statements of Funds from Operations (dollars in thousands, except share and per share data) 4 Three Months Ended December 31, Year Ended December 31, 2008 2007 $ Change 2008 2007 $ Change Net (loss) income $(3,420) $6,146 $(9,566) $(13,055) $(1,686) $(11,369) Minority interests 38 564 (526) 236 255 (19) Loss from unconsolidated joint ventures 438 108 330 1,619 108 1,511 FFO from unconsolidated joint ventures (1) (132) (108) (24) (487) (108) (379) Real estate related depreciation and amortization 19,897 7,680 12,217 56,459 29,824 26,635 Funds from operations ("FFO") 16,821 14,390 2,431 44,772 28,393 16,379 "Elimination of operations of on-campus participating properties and unconsolidated joint venture:" Net income from on-campus participating properties (1,555) (1,533) (22) (101) (325) 224 Amortization of investment in on-campus participating properties (1,092) (1,069) (23) (4,322) (4,263) (59) FFO from Hampton Roads unconsolidated joint venture (2) 232 108 124 419 108 311 14,406 11,896 2,510 40,768 23,913 16,855 "Modifications to reflect operational performance of on-campus participating properties:" Our share of net cash flow (3) 292 359 (67) 1,409 1,398 11 Management fees 310 321 (11) 1,006 973 33 Impact of on-campus participating properties 602 680 (78) 2,415 2,371 44 "Funds from operations – modified for operational performance of on-campus participating properties (""FFOM"")" 15,008 12,576 2,432 43,183 26,284 16,899 "Compensation charge and related tax impact associated with 2004 Outperformance Bonus Plan " - - - - - 10,907 (10,907) "FFOM, excluding compensation charge and related tax impact associated with 2004 Outperformance Bonus Plan " $15,008 $12,576 $2,432 $43,183 $37,191 $5,992 FFO per share - diluted $0.38 $0.50 $1.16 $1.08 FFOM per share - diluted $0.34 $0.44 $1.12 $1.00 "FFOM per share, excluding compensation charge and related tax impact associated with 2004 Outperformance Bonus Plan - diluted" $0.34 $0.44 $1.12 $1.42 Weighted average common shares outstanding - diluted 43,860,124 28,727,588 38,595,230 26,266,836 (1) Represents our share of the FFO from three joint ventures in which we are a minority partner. Includes the Hampton Roads Military Housing joint venture in which we have a minimal economic interest as well as our 10% minority interest in two joint ventures formed or assumed as part of the company's acquisition of GMH. (2) Our share of the FFO from the Hampton Roads Military Housing unconsolidated joint venture is excluded from the calculation of FFOM, as management believes this amount does not accurately reflect the company's participation in the economics of the transaction. (3) 50% of the properties' net cash available for distribution after payment of operating expenses, debt service (including repayment of principal) and capital expenditures. Represents actual cash received for the year-to-date periods and amounts accrued for the interim periods.
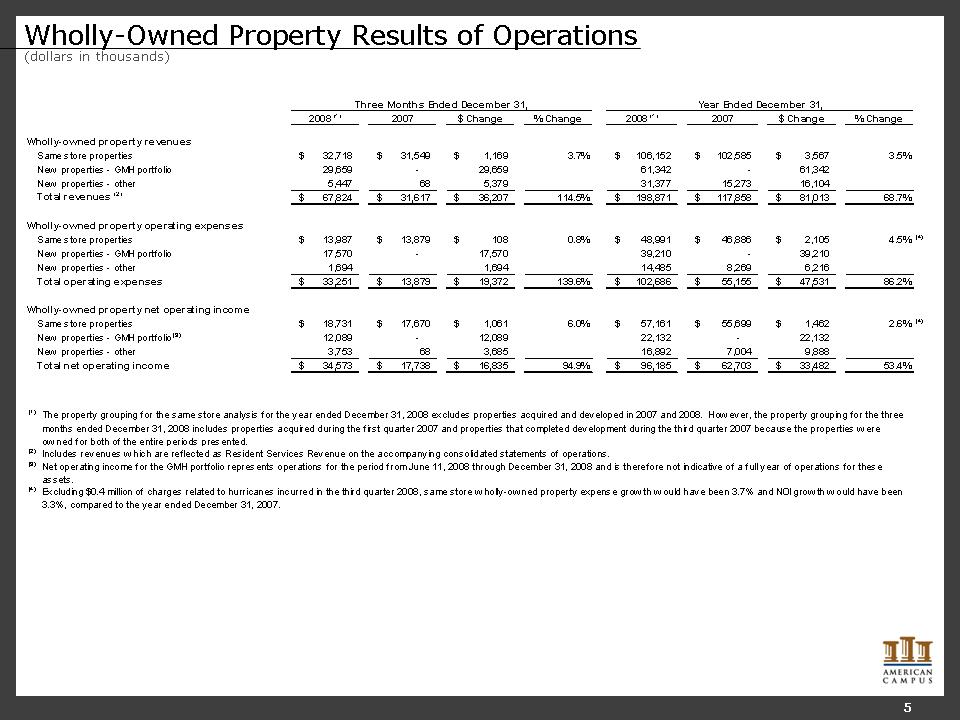
Wholly-Owned Property Results of Operations (dollars in thousands) 5 Three Months Ended December 31, Year Ended December 31, 2008 (1) 2007 $ Change % Change 2008 (1) 2007 $ Change % Change Wholly-owned property revenues Same store properties $32,718 $31,549 $1,169 3.7% $106,152 $102,585 $3,567 3.5% New properties - GMH portfolio 29,659 - 29,659 61,342 - 61,342 New properties - other 5,447 68 5,379 31,377 15,273 16,104 Total revenues (2) $67,824 $31,617 $36,207 114.5% $198,871 $117,858 $81,013 68.7% Wholly-owned property operating expenses Same store properties $13,987 $13,879 $108 0.8% $48,991 $46,886 $2,105 4.5% New properties - GMH portfolio 17,570 - 17,570 39,210 - 39,210 New properties - other 1,694 1,694 14,485 8,269 6,216 Total operating expenses $33,251 $13,879 $19,372 139.6% $102,686 $55,155 $47,531 86.2% Wholly-owned property net operating income Same store properties $18,731 $17,670 $1,061 6.0% $57,161 $55,699 $1,462 2.6% New properties - GMH portfolio (3) 12,089 - 12,089 22,132 - 22,132 New properties - other 3,753 68 3,685 16,892 7,004 9,888 Total net operating income $34,573 $17,738 $16,835 94.9% $96,185 $62,703 $33,482 53.4% (1) The property grouping for the same store analysis for the year ended December 31, 2008 excludes properties acquired and developed in 2007 and 2008. However, the property grouping for the three months ended December 31, 2008 includes properties acquired during the first quarter 2007 and properties that completed development during the third quarter 2007 because the properties were owned for both of the entire periods presented. (2) Includes revenues which are reflected as Resident Services Revenue on the accompanying consolidated statements of operations (3) Net operating income for the GMH portfolio represents operations for the period from June 11, 2008 through December 31, 2008 and is therefore not indicative of a full year of operations for these assets. (4) Excluding $0.4 million of charges related to hurricanes incurred in the third quarter 2008, same store wholly-owned property expense growth would have been 3.7% and NOI growth would have been 3.3%, compared to the year ended December 31, 2007.
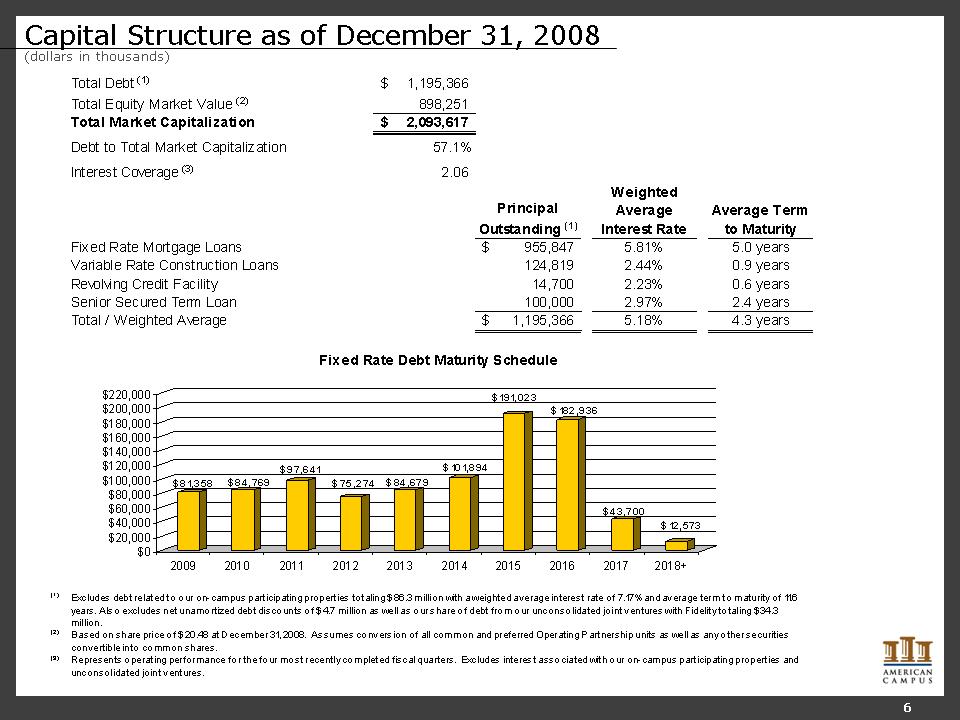
Capital Structure as of December 31, 2008 (dollars in thousands) 6 Total Debt (1) $1,195,366 Total Equity Market Value (2) 898,251 Total Market Capitalization $2,093,617 Debt to Total Market Capitalization 57.1% Interest Coverage (3) 2.06 Principal Outstanding (1) Weighted Average Interest Rate Average Term to Maturity Fixed Rate Mortgage Loans $955,847 5.81% 5.0 years Variable Rate Construction Loans 124,819 2.44% 0.9 years Revolving Credit Facility 14,700 2.23% 0.6 years Senior Secured Term Loan 100,000 2.97% 2.4 years Total / Weighted Average $1,195,366 5.18% 4.3 years Fixed Rate Debt Maturity Schedule (1) Excludes debt related to our on-campus participating properties totaling $86.3 million with a weighted average interest rate of 7.17% and average term to maturity of 11.6 years. Also excludes net unamortized debt discounts of $4.7 million as well as our share of debt from our unconsolidated joint ventures with Fidelity totaling $34.3 million. (2) Based on share price of $20.48 at December 31, 2008. Assumes conversion of all common and preferred Operating Partnership units as well as any other securities convertible into common shares. (3) Represents operating performance for the four most recently completed fiscal quarters. Excludes interest associated with our on-campus participating properties and unconsolidated joint ventures.
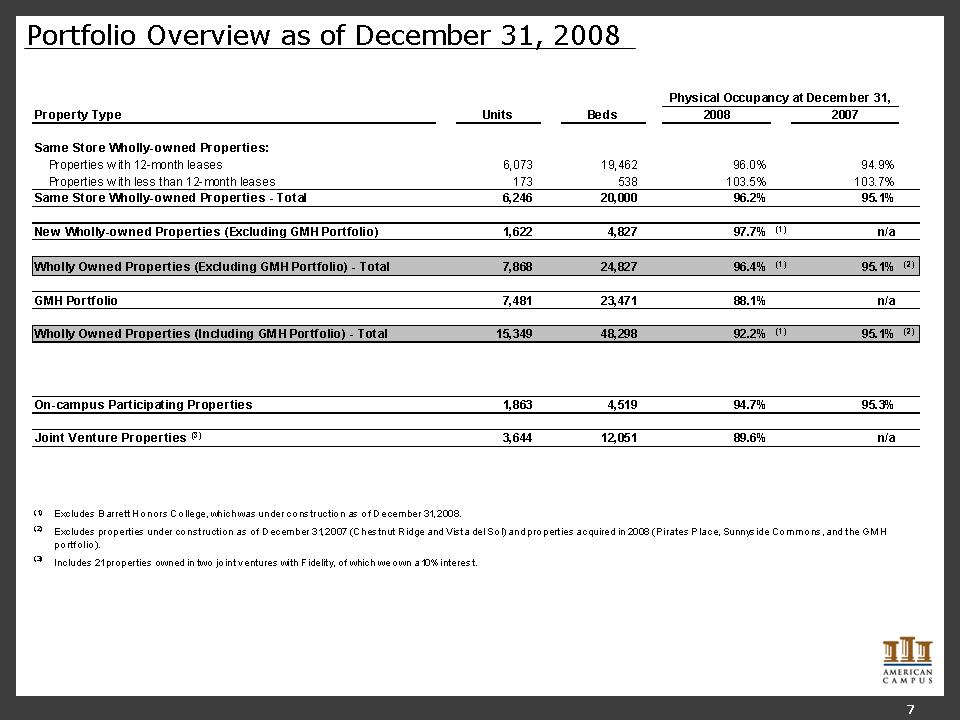
Portfolio Overview as of December 31, 2008 7 Physical Occupancy at December 31, Property Type Units Beds 2008 2007 Same Store Wholly-owned Properties: Properties with 12-month leases 6,073 19,462 96.0% 94.9% Properties with less than 12-month leases 173 538 103.5% 103.7% Same Store Wholly-owned Properties - Total 6,246 20,000 96.2% 95.1% New Wholly-owned Properties (Excluding GMH Portfolio) 1,622 4,827 97.7% (1) n/a Wholly Owned Properties (Excluding GMH Portfolio) - Total 7,868 24,827 96.4% (1) 95.1% (2) GMH Portfolio 7,481 23,471 88.1% n/a Wholly Owned Properties (Including GMH Portfolio) - Total 15,349 48,298 92.2% (1) 95.1% (2) On-campus Participating Properties 1,863 4,519 94.7% 95.3% Joint Venture Properties (3) 3,644 12,051 89.6% n/a (1) Excludes Barrett Honors College, which was under construction as of December 31, 2008. (2) Excludes properties under construction as of December 31, 2007 (Chestnut Ridge and Vista del Sol) and properties acquired in 2008 (Pirates Place, Sunnyside Commons, and the GMH portfolio). (3) Includes 21 properties owned in two joint ventures with Fidelity, of which we own a 10% interest.
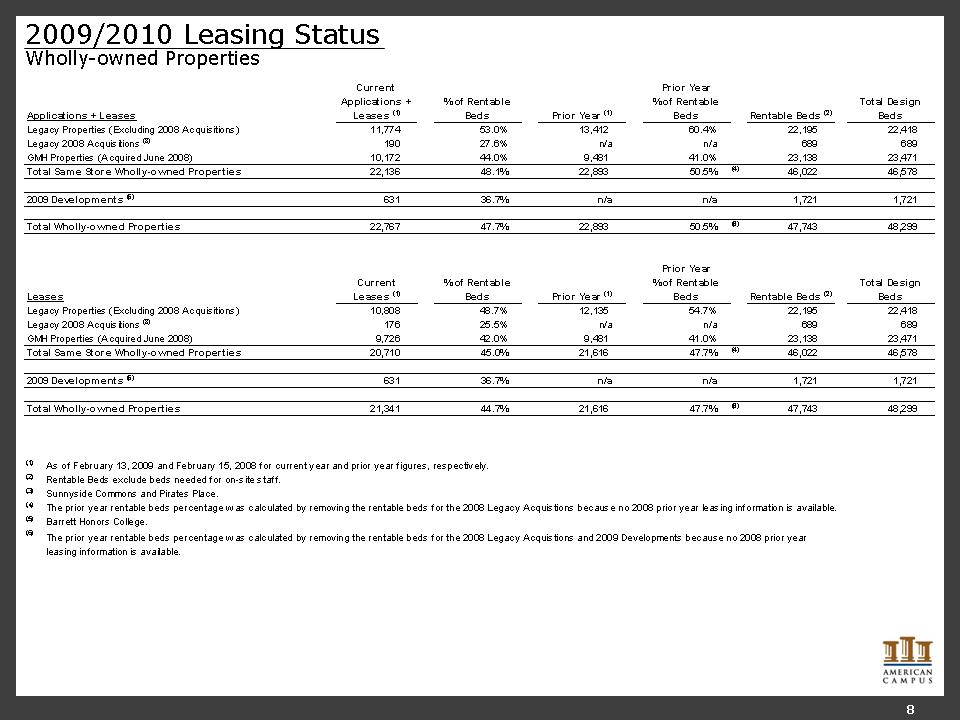
2009/2010 Leasing Status Wholly-owned Properties 8 Applications + Leases Current Applications + Leases (1) % of Rentable Beds Prior Year (1) "Prior Year % of Rentable Beds" Rentable Beds (2) Total Design Beds Legacy Properties (Excluding 2008 Acquisitions) 11,774 53.0% 13,412 60.4% 22,195 22,418 Legacy 2008 Acquisitions (3) 190 27.6% n/a n/a 689 689 GMH Properties (Acquired June 2008) 10,172 44.0% 9,481 41.0% 23,138 23,471 Total Same Store Wholly-owned Properties 22,136 48.1% 22,893 50.5% (4) 46,022 46,578 2009 Developments (5) 631 36.7% n/a n/a 1,721 1,721 Total Wholly-owned Properties 22,767 47.7% 22,893 50.5% (6) 47,743 48,299 Leases Current Leases (1) % of Rentable Beds Prior Year (1) "Prior Year % of Rentable Beds" Rentable Beds (2) Total Design Beds Legacy Properties (Excluding 2008 Acquisitions) 10,808 48.7% 12,135 54.7% 22,195 22,418 Legacy 2008 Acquisitions (3) 176 25.5% n/a n/a 689 689 GMH Properties (Acquired June 2008) 9,726 42.0% 9,481 41.0% 23,138 23,471 Total Same Store Wholly-owned Properties 20,710 45.0% 21,616 47.7% (4) 46,022 46,578 2009 Developments (5) 631 36.7% n/a n/a 1,721 1,721 Total Wholly-owned Properties 21,341 44.7% 21,616 47.7% (6) 47,743 48,299 (1) As of February 13, 2009 and February 15, 2008 for current year and prior year figures, respectively. (2) Rentable Beds exclude beds needed for on-site staff. (3) Sunnyside Commons and Pirates Place. (4) The prior year rentable beds percentage was calculated by removing the rentable beds for the 2008 Legacy Acquistions because no 2008 prior year leasing information is available. (5) Barrett Honors College. (6) The prior year rentable beds percentage was calculated by removing the rentable beds for the 2008 Legacy Acquistions and 2009 Developments because no 2008 prior year leasing information is available.

9 2009/2010 Leasing Trends Same Store Wholly-owned Properties Same Store Wholly-Owned Legacy Properties (Excluding 2008 Acquisitons) Total Same Store Wholly-Owned Properties GMH Properties
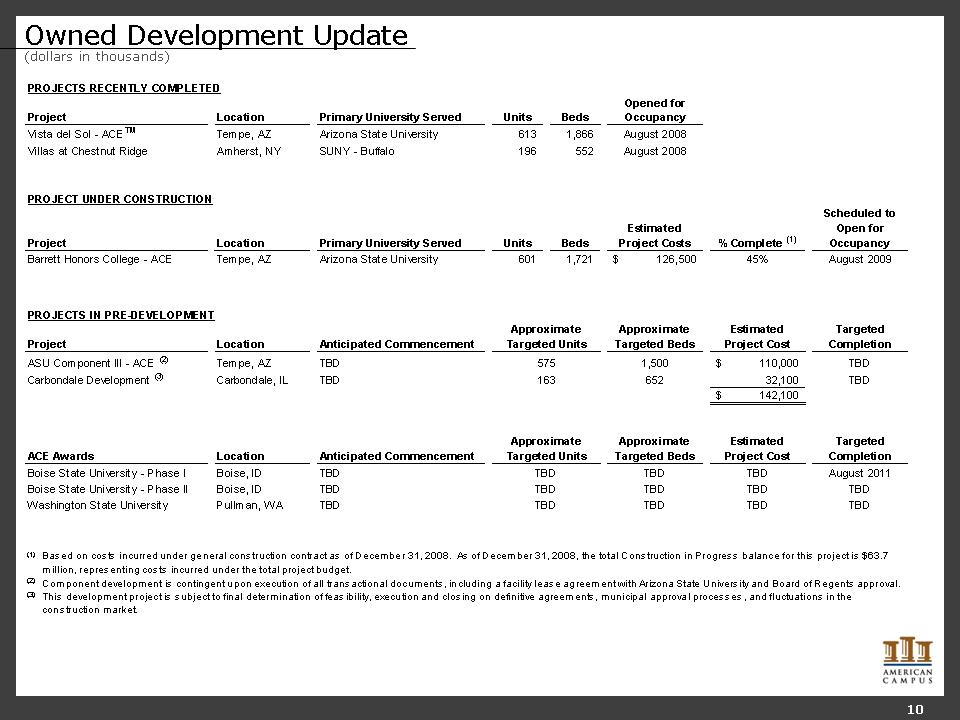
Owned Development Update (dollars in thousands) 10 PROJECTS RECENTLY COMPLETED Project Location Primary University Served Units Beds Opened for Occupancy Vista del Sol - ACETM Tempe, AZ Arizona State University 613 1,866 August 2008 Villas at Chestnut Ridge Amherst, NY SUNY - Buffalo 196 552 August 2008 PROJECT UNDER CONSTRUCTION Project Location Primary University Served Units Beds Estimated Project Costs % Complete (1) Scheduled to Open for Occupancy Barrett Honors College - ACE Tempe, AZ Arizona State University 601 1,721 $126,500 45% August 2009 PROJECTS IN PRE-DEVELOPMENT Project Location Anticipated Commencement Approximate Targeted Units Approximate Targeted Beds Estimated Project Cost Targeted Completion ASU Component III - ACE (2) Tempe, AZ TBD 575 1,500 $110,000 TBD Carbondale Development (3) Carbondale, IL TBD 163 652 32,100 TBD $142,100 ACE Awards Location Anticipated Commencement Approximate Targeted Units Approximate Targeted Beds Estimated Project Cost Targeted Completion Boise State University - Phase I Boise, ID TBD TBD TBD TBD August 2011 Boise State University - Phase II Boise, ID TBD TBD TBD TBD TBD Washington State University Pullman, WA TBD TBD TBD TBD TBD (1) Based on costs incurred under general construction contract as of December 31, 2008. As of December 31, 2008, the total Construction in Progress balance for this project is $63.7 million, representing costs incurred under the total project budget. (2) Component development is contingent upon execution of all transactional documents, including a facility lease agreement with Arizona State University and Board of Regents approval. (3) This development project is subject to final determination of feasibility, execution and closing on definitive agreements, municipal approval processes, and fluctuations in the construction market.
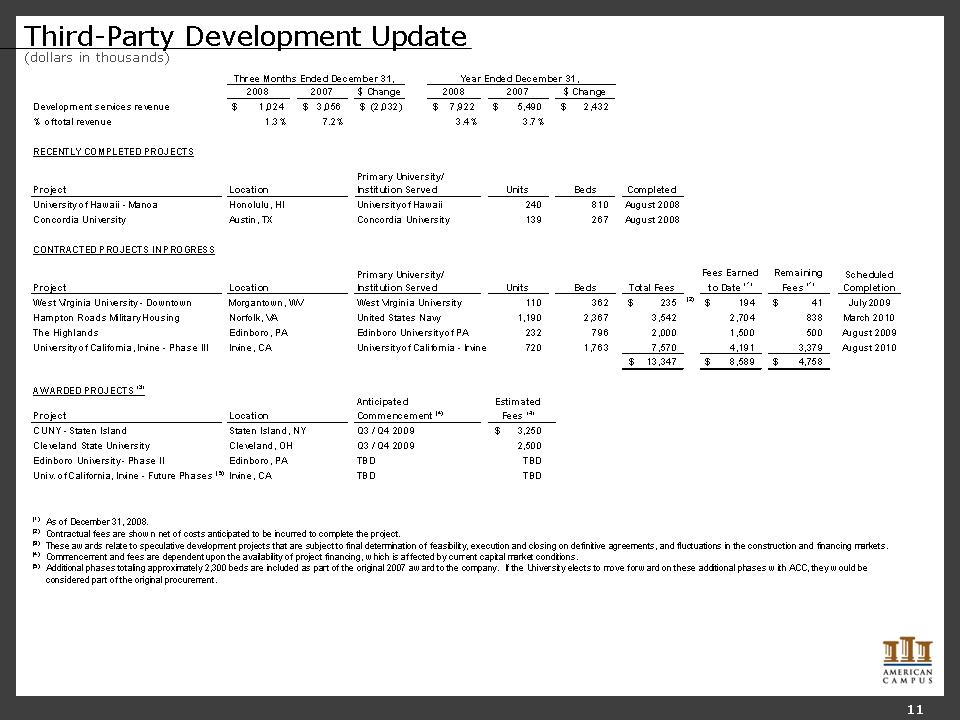
Third-Party Development Update (dollars in thousands) 11 Three Months Ended December 31, Year Ended December 31, 2008 2007 $ Change 2008 2007 $ Change Development services revenue $1,024 $3,056 $(2,032) $7,922 $5,490 $2,432 % of total revenue 1.3% 7.2% 3.4% 3.7% RECENTLY COMPLETED PROJECTS Project Location Primary University/ Institution Served Units Beds Completed University of Hawaii - Manoa Honolulu, HI University of Hawaii 240 810 August 2008 Concordia University Austin, TX Concordia University 139 267 August 2008 CONTRACTED PROJECTS IN PROGRESS Project Location Primary University/ Institution Served Units Beds Total Fees Fees Earned to Date (1) Remaining Fees (1) Scheduled Completion West Virginia University - Downtown Morgantown, WV West Virginia University 110 362 362 $235 (2) $194 $41 July 2009 Hampton Roads Military Housing Norfolk, VA United States Navy 1,190 2,367 3,542 2,704 838 March 2010 The Highlands Edinboro, PA Edinboro University of PA 232 796 2,000 1,500 500 August 2009 University of California, Irvine - Phase III Irvine, CA University of California - Irvine 720 1,763 7,570 4,191 3,379 August 2010 $13,347 $8,589 $4,758 AWARDED PROJECTS (3) Project Location Anticipated Commencement (4) Estimated Fees (4) CUNY - Staten Island Staten Island, NY Q3 / Q4 2009 $3,250 Cleveland State University Cleveland, OH Q3 / Q4 2009 2,500 Edinboro University - Phase II Edinboro, PA TBD TBD Univ. of California, Irvine - Future Phases (5) Irvine, CA TBD TBD (1) As of December 31, 2008. (2) Contractual fees are shown net of costs anticipated to be incurred to complete the project. (3) These awards relate to speculative development projects that are subject to final determination of feasibility, execution and closing on definitive agreements, and fluctuations in the construction and financing markets. (4) Commencement and fees are dependent upon the availability of project financing, which is affected by current capital market conditions. (5) Additional phases totaling approximately 2,300 beds are included as part of the original 2007 award to the company. If the University elects to move forward on these additional phases with ACC, they would be considered part of the original procurement.
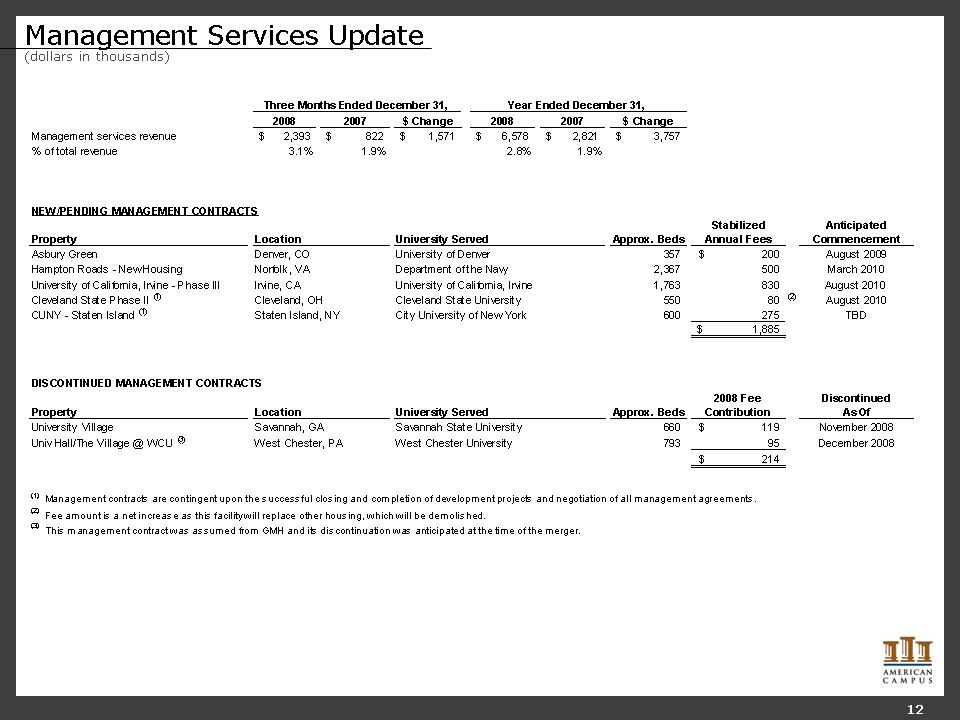
Management Services Update (dollars in thousands) 12 Three Months Ended December 31, Year Ended December 31, 2008 2007 $ Change 2008 2007 $ Change Management services revenue $2,393 $822 $1,571 $6,578 $2,821 $3,757 % of total revenue 3.1% 1.9% 2.8% 1.9% NEW/PENDING MANAGEMENT CONTRACTS Property Location University Served Approx. Beds Stabilized Annual Fees Anticipated Commencement Asbury Green Denver, CO University of Denver 357 $200 August 2009 Hampton Roads - New Housing Norfolk, VA Department of the Navy 2,367 500 March 2010 University of California, Irvine - Phase III Irvine, CA University of California, Irvine 1,763 830 August 2010 Cleveland State Phase II (1) Cleveland, OH Cleveland State University 550 80 (2) August 2010 CUNY - Staten Island (1) Staten Island, NY City University of New York 600 275 TBD $1,885 DISCONTINUED MANAGEMENT CONTRACTS Property Location University Served Approx. Beds 2008 Fee Contribution "Discontinued As Of" University Village Savannah, GA Savannah State University 660 $119 November 2008 Univ Hall/The Village @ WCU (3) West Chester, PA West Chester University 793 95 December 2008 $214 (1) Management contracts are contingent upon the successful closing and completion of development projects and negotiation of all management agreements. (2) Fee amount is a net increase as this facility will replace other housing, which will be demolished. (3) This management contract was assumed from GMH and its discontinuation was anticipated at the time of the merger.
Investor Information 13 Executive Management William C. Bayless, Jr. Chief Executive Officer Brian Nickel Chief Investment Officer Greg A. Dowell Chief Operating Officer Jon Graf Chief Financial Officer Research Coverage David Toti / Michael Bilerman Citigroup Equity Research (212) 816-1909/ (212) 816-1383 david.toti@citi.com / michael.bilerman@citi.com Louis Taylor Deutsche Bank - North America (203) 863-2381 louis.taylor@db.com Andrew McCulloch / Craig Leupold Green Street Advisors (949) 640-8780 amcculloch@greenstreetadvisors.com / cleupold@greenstreetadvisors.com Anthony Paolone / Joseph Dazio J.P. Morgan Securities (212) 622-6682 / (212) 622-6416 anthony.paolone@jpmorgan.com / joseph.c.dazio@jpmorgan.com Stephen Swett Keefe, Bruyette, & Woods (212) 887-3680 sswett@kbw.com Jordan Sadler / Karin Ford KeyBanc Capital Markets (917) 368-2280 / (917) 368-2293 jsadler@keybanccm.com / kford@keybanccm.com Steve Sakwa / David Bragg Merrill Lynch (212) 449-0335 / (212) 449-8922 steve_sakwa@ml.com / david_bragg@ml.com Paula Poskon / Lindsey Yao Robert W. Baird & Co., Inc. (703) 821-5782 / (703) 918-7852 pposkon@rwbaird.com / lyao@rwbaird.com Michelle Ko / Andrew Ryu UBS Investment Research (212) 713-3893 / (212) 713-3998 michelle.ko@ubs.com / andrew.ryu@ubs.com American Campus Communities, Inc. is followed by the analysts listed above. Please note that any opinions, estimates or forecasts regarding American Campus Communities, Inc.'s performance made by such analysts are theirs alone and do not represent the opinions, forecasts or predictions of American Campus Communities, Inc. or its management. American Campus Communities, Inc. does not by its reference above or distribution imply its endorsement of or concurrence with such information, conclusions or recommendations. Additional Information Corporate Headquarters: American Campus Communities, Inc. Investor Relations: 805 Las Cimas Parkway, Suite 400 Gina Cowart Austin, Texas 78746 VP, Investor Relations and Corporate Marketing Tel: (512) 732-1000; Fax: (512) 732-2450 (512) 732-1041 www.studenthousing.com gcowart@studenthousing.com
Forward Looking Statements This supplemental package contains forward-looking statements, which express the current beliefs and expectations of management. Except for historical information, the matters discussed in this news release are forward-looking statements and can be identified by the use of the words "anticipate," "believe," "expect," "intend," "may," "might," "plan," "estimate," "project," "should," "will," "result" and similar expressions. Such statements are based on current expectations and involve a number of known and unknown risks and uncertainties that could cause our future results, performance or achievements to differ significantly from the results, performance or achievements expressed or implied by such forward-looking statements. Our actual results could differ materially from those anticipated in these forward-looking statements as a result of various factors, including risks and uncertainties related to our ability to successfully integrate the operations of GMH Communities Trust; the national economy, the real estate industry in general, and in our specific markets; legislative or regulatory changes including changes to laws governing REITS; our dependence on key personnel whose continued service is not guaranteed; availability of qualified acquisition and development targets; availability of capital and financing; rising interest rates; rising insurance rates; impact of ad valorem and income taxation; changes in generally accepted accounting principles; and our continued ability to successfully lease and operate our properties. While we believe these forward-looking statements are based on reasonable assumptions, we can give no assurance that our expectations will be achieved. These forward-looking statements are made as of the date of this news release, and we undertake no obligation to update publicly or revise any forward-looking statement, whether as a result of new information, future developments or otherwise.