American Campus Communities Investor Presentation June 2009
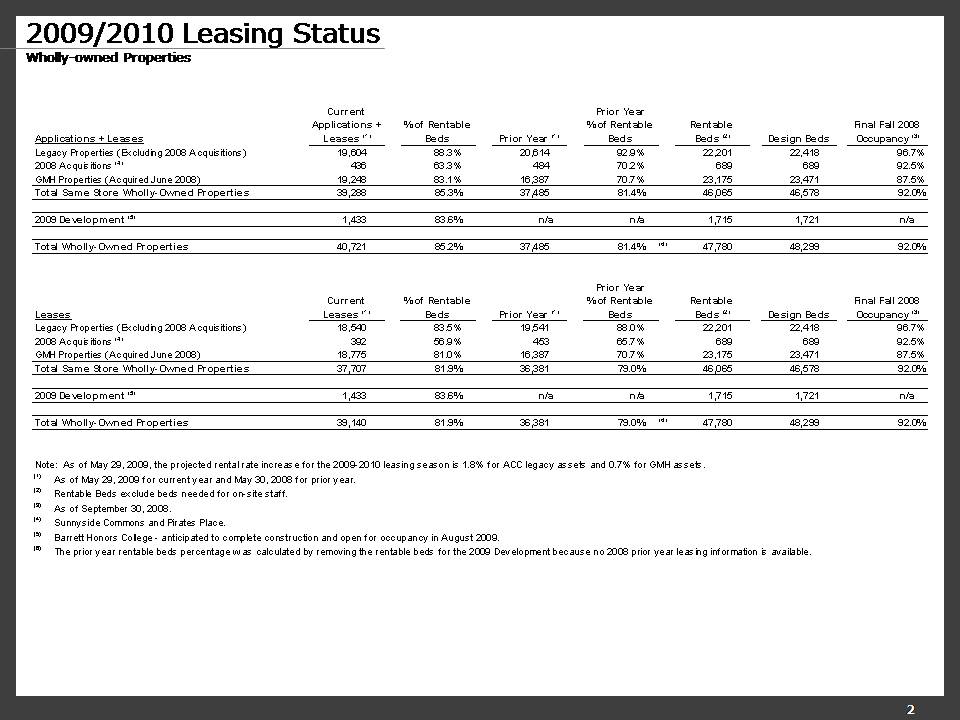
Applications + Leases Current Applications + Leases (1) % of Rentable Beds Prior Year (1) "Prior Year % of Rentable Beds" Rentable Beds (2) Design Beds Final Fall 2008 Occupancy (3) Legacy Properties (Excluding 2008 Acquisitions) 19,604 88.3% 20,614 92.9% 22,201 22,418 96.7% 2008 Acquisitions (4) 436 63.3% 484 70.2% 689 689 92.5% GMH Properties (Acquired June 2008) 19,248 83.1% 16,387 70.7% 23,175 23,471 87.5% Total Same Store Wholly-Owned Properties 39,288 85.3% 37,485 81.4% 46,065 46,578 92.0% 2009 Development (5) 1,433 83.6% n/a n/a 1,715 1,721 n/a Total Wholly-Owned Properties 40,721 85.2% 37,485 81.4% (6) 47,780 48,299 92.0% Leases Current Leases (1) % of Rentable Beds Prior Year (1) "Prior Year % of Rentable Beds" Rentable Beds (2) Design Beds Final Fall 2008 Occupancy (3) Legacy Properties (Excluding 2008 Acquisitions) 18,540 83.5% 19,541 88.0% 22,201 22,418 96.7% 2008 Acquisitions (4) 392 56.9% 453 65.7% 689 689 92.5% GMH Properties (Acquired June 2008) 18,775 81.0% 16,387 70.7% 23,175 23,471 87.5% Total Same Store Wholly-Owned Properties 37,707 81.9% 36,381 79.0% 46,065 46,578 92.0% 2009 Development (5) 1,433 83.6% n/a n/a 1,715 1,721 n/a Total Wholly-Owned Properties 39,140 81.9% 36,381 79.0% (6) 47,780 48,299 92.0% Note: As of May 29, 2009, the projected rental rate increase for the 2009-2010 leasing season is 1.8% for ACC legacy assets and 0.7% for GMH assets. (1) As of May 29, 2009 for current year and May 30, 2008 for prior year. (2) Rentable Beds exclude beds needed for on-site staff. (3) As of September 30, 2008. (4) Sunnyside Commons and Pirates Place. (5) Barrett Honors College - anticipated to complete construction and open for occupancy in August 2009. (6) The prior year rentable beds percentage was calculated by removing the rentable beds for the 2009 Development because no 2008 prior
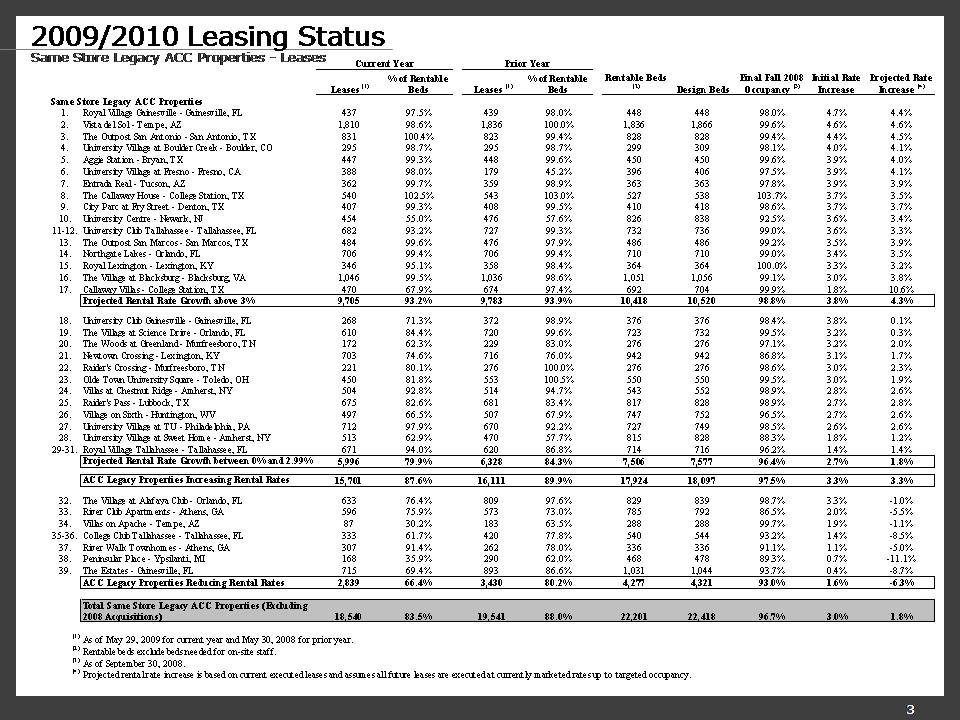
2009/2010 Leasing Status Same Store Legacy ACC Properties - Leases Current Year Prior Year Rentable Beds (2) Design Beds Final Fall 2008 Occupancy (3) Initial Rate Increase Projected Rate Increase (4) Leases (1) % of Rentable Beds Leases (1) % of Rentable Beds Same Store Legacy ACC Properties 1. Royal Village Gainesville - Gainesville, FL 437 97.5% 439 98.0% 448 448 98.0% 4.7% 4.4% 2. Vista del Sol - Tempe, AZ 1,810 98.6% 1,836 100.0% 1,836 1,866 99.6% 4.6% 4.6% 3. The Outpost San Antonio - San Antonio, TX 831 100.4% 823 99.4% 828 828 99.4% 4.4% 4.5% 4. University Village at Boulder Creek - Boulder, CO 295 98.7% 295 98.7% 299 309 98.1% 4.0% 4.1% 5. Aggie Station - Bryan, TX 447 99.3% 448 99.6% 450 450 99.6% 3.9% 4.0% 6. University Village at Fresno - Fresno, CA 388 98.0% 179 45.2% 396 406 97.5% 3.9% 4.1% 7. Entrada Real - Tucson, AZ 362 99.7% 359 98.9% 363 363 97.8% 3.9% 3.9% 8. The Callaway House - College Station, TX 540 102.5% 543 103.0% 527 538 103.7% 3.7% 3.5% 9. City Parc at Fry Street - Denton, TX 407 99.3% 408 99.5% 410 418 98.6% 3.7% 3.7% 10. University Centre - Newark, NJ 454 55.0% 476 57.6% 826 838 92.5% 3.6% 3.4% 11-12. University Club Tallahassee - Tallahassee, FL 682 93.2% 727 99.3% 732 736 99.0% 3.6% 3.3% 13. The Outpost San Marcos - San Marcos, TX 484 99.6% 476 97.9% 486 486 99.2% 3.5% 3.9% 14. Northgate Lakes - Orlando, FL 706 99.4% 706 99.4% 710 710 99.0% 3.4% 3.5% 15. Royal Lexington - Lexington, KY 346 95.1% 358 98.4% 364 364 100.0% 3.3% 3.2% 16. The Village at Blacksburg - Blacksburg, VA 1,046 99.5% 1,036 98.6% 1,051 1,056 99.1% 3.0% 3.8% 17. Callaway Villas - College Station, TX 470 67.9% 674 97.4% 692 704 99.9% 1.8% 10.6% Projected Rental Rate Growth above 3% 9,705 93.2% 9,783 93.9% 10,418 10,520 98.8% 3.8% 4.3% 18. University Club Gainesville - Gainesville, FL 268 71.3% 372 98.9% 376 376 98.4% 3.8% 0.1% 19. The Village at Science Drive - Orlando, FL 610 84.4% 720 99.6% 723 732 99.5% 3.2% 0.3% 20. The Woods at Greenland - Murfreesboro, TN 172 62.3% 229 83.0% 276 276 97.1% 3.2% 2.0% 21. Newtown Crossing - Lexington, KY 703 74.6% 716 76.0% 942 942 86.8% 3.1% 1.7% 22. Raider's Crossing - Murfreesboro, TN 221 80.1% 276 100.0% 276 276 98.6% 3.0% 2.3% 23. Olde Town University Square - Toledo, OH 450 81.8% 553 100.5% 550 550 99.5% 3.0% 1.9% 24. Villas at Chestnut Ridge - Amherst, NY 504 92.8% 514 94.7% 543 552 98.9% 2.8% 2.6% 25. Raider's Pass - Lubbock, TX 675 82.6% 681 83.4% 817 828 98.9% 2.7% 2.8% 26. Village on Sixth - Huntington, WV 497 66.5% 507 67.9% 747 752 96.5% 2.7% 2.6% 27. University Village at TU - Philadelphia, PA 712 97.9% 670 92.2% 727 749 98.5% 2.6% 2.6% 28. University Village at Sweet Home - Amherst, NY 513 62.9% 470 57.7% 815 828 88.3% 1.8% 1.2% 29-31. Royal Village Tallahassee - Tallahassee, FL 671 94.0% 620 86.8% 714 716 96.2% 1.4% 1.4% Projected Rental Rate Growth between 0% and 2.99% 5,996 79.9% 6,328 84.3% 7,506 7,577 96.4% 2.7% 1.8% ACC Legacy Properties Increasing Rental Rates 15,701 87.6% 16,111 89.9% 17,924 18,097 97.5% 3.3% 3.3% 32. The Village at Alafaya Club - Orlando, FL 633 76.4% 809 97.6% 829 839 98.7% 3.3% -1.0% 33. River Club Apartments - Athens, GA 596 75.9% 573 73.0% 785 792 86.5% 2.0% -5.5% 34. Villas on Apache - Tempe, AZ 87 30.2% 183 63.5% 288 288 99.7% 1.9% -1.1% 35-36. College Club Tallahassee - Tallahassee, FL 333 61.7% 420 77.8% 540 544 93.2% 1.4% -8.5% 37. River Walk Townhomes - Athens, GA 307 91.4% 262 78.0% 336 336 91.1% 1.1% -5.0% 38. Peninsular Place - Ypsilanti, MI 168 35.9% 290 62.0% 468 478 89.3% 0.7% -11.1% 39. The Estates - Gainesville, FL 715 69.4% 893 86.6% 1,031 1,044 93.7% 0.4% -8.7% ACC Legacy Properties Reducing Rental Rates 2,839 66.4% 3,430 80.2% 4,277 4,321 93.0% 1.6% -6.3% Total Same Store Legacy ACC Properties (Excluding 2008 Acquisitions) 18,540 83.5% 19,541 88.0% 22,201 22,418 96.7% 3.0% 1.8% (1) As of May 29, 2009 for current year and May 30, 2008 for prior year. (2) Rentable beds exclude beds needed for on-site staff. (3) As of September 30, 2008. (4) Projected rental rate increase is based on current executed leases and assumes all future leases are executed at currently marketed rates up to targeted occupancy.
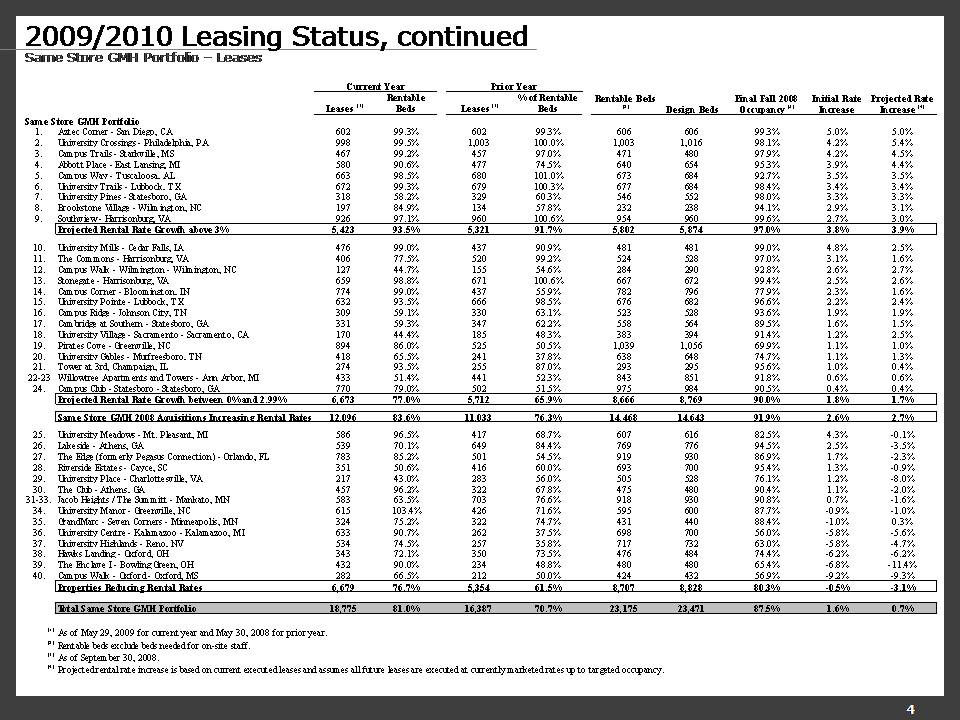
2009/2010 Leasing Status, continued Same Store GMH Portfolio – Leases Current Year Prior Year Rentable Beds (2) Design Beds Final Fall 2008 Occupancy (3) Initial Rate Increase Projected Rate Increase (4) Leases (1) % of Rentable Beds Leases (1) % of Rentable Beds Same Store GMH Portfolio 1. Aztec Corner - San Diego, CA 602 99.3% 602 99.3% 606 606 99.3% 5.0% 5.0% 2. University Crossings - Philadelphia, PA 998 99.5% 1,003 100.0% 1,003 1,016 98.1% 4.2% 5.4% 3. Campus Trails - Starkville, MS 467 99.2% 457 97.0% 471 480 97.9% 4.2% 4.5% 4. Abbott Place - East Lansing, MI 580 90.6% 477 74.5% 640 654 95.3% 3.9% 4.4% 5. Campus Way - Tuscaloosa, AL 663 98.5% 680 101.0% 673 684 92.7% 3.5% 3.5% 6. University Trails - Lubbock, TX 672 99.3% 679 100.3% 677 684 98.4% 3.4% 3.4% 7. University Pines - Statesboro, GA 318 58.2% 329 60.3% 546 552 98.0% 3.3% 3.3% 8. Brookstone Village - Wilmington, NC 197 84.9% 134 57.8% 232 238 94.1% 2.9% 3.1% 9. Southview - Harrisonburg, VA 926 97.1% 960 100.6% 954 960 99.6% 2.7% 3.0% Projected Rental Rate Growth above 3% 5,423 93.5% 5,321 91.7% 5,802 5,874 97.0% 3.8% 3.9% 10. University Mills - Cedar Falls, IA 476 99.0% 437 90.9% 481 481 99.0% 4.8% 2.5% 11. The Commons - Harrisonburg, VA 406 77.5% 520 99.2% 524 528 97.0% 3.1% 1.6% 12. Campus Walk - Wilmington - Wilmington, NC 127 44.7% 155 54.6% 284 290 92.8% 2.6% 2.7% 13. Stonegate - Harrisonburg, VA 659 98.8% 671 100.6% 667 672 99.4% 2.5% 2.6% 14. Campus Corner - Bloomington, IN 774 99.0% 437 55.9% 782 796 77.9% 2.3% 1.6% 15. University Pointe - Lubbock, TX 632 93.5% 666 98.5% 676 682 96.6% 2.2% 2.4% 16. Campus Ridge - Johnson City, TN 309 59.1% 330 63.1% 523 528 93.6% 1.9% 1.9% 17. Cambridge at Southern - Statesboro, GA 331 59.3% 347 62.2% 558 564 89.5% 1.6% 1.5% 18. University Village - Sacramento - Sacramento, CA 170 44.4% 185 48.3% 383 394 91.4% 1.2% 2.5% 19. Pirates Cove - Greenville, NC 894 86.0% 525 50.5% 1,039 1,056 69.9% 1.1% 1.0% 20. University Gables - Murfreesboro, TN 418 65.5% 241 37.8% 638 648 74.7% 1.1% 1.3% 21. Tower at 3rd, Champaign, IL 274 93.5% 255 87.0% 293 295 95.6% 1.0% 0.4% 22-23 Willowtree Apartments and Towers - Ann Arbor, MI 433 51.4% 441 52.3% 843 851 91.8% 0.6% 0.6% 24. Campus Club - Statesboro - Statesboro, GA 770 79.0% 502 51.5% 975 984 90.5% 0.4% 0.4% Projected Rental Rate Growth between 0% and 2.99% 6,673 77.0% 5,712 65.9% 8,666 8,769 90.0% 1.8% 1.7% Same Store GMH 2008 Aquisitions Increasing Rental Rates 12,096 83.6% 11,033 76.3% 14,468 14,643 91.9% 2.6% 2.7% 25. University Meadows - Mt. Pleasant, MI 586 96.5% 417 68.7% 607 616 82.5% 4.3% -0.1% 26. Lakeside - Athens, GA 539 70.1% 649 84.4% 769 776 94.5% 2.5% -3.5% 27. The Edge (formerly Pegasus Connection) - Orlando, FL 783 85.2% 501 54.5% 919 930 86.9% 1.7% -2.3% 28. Riverside Estates - Cayce, SC 351 50.6% 416 60.0% 693 700 95.4% 1.3% -0.9% 29. University Place - Charlottesville, VA 217 43.0% 283 56.0% 505 528 76.1% 1.2% -8.0% 30. The Club - Athens, GA 457 96.2% 322 67.8% 475 480 90.4% 1.1% -2.0% 31-33. Jacob Heights / The Summitt - Mankato, MN 583 63.5% 703 76.6% 918 930 90.8% 0.7% -1.6% 34. University Manor - Greenville, NC 615 103.4% 426 71.6% 595 600 87.7% -0.9% -1.0% 35. GrandMarc - Seven Corners - Minneapolis, MN 324 75.2% 322 74.7% 431 440 88.4% -1.0% 0.3% 36. University Centre - Kalamazoo - Kalamazoo, MI 633 90.7% 262 37.5% 698 700 56.0% -5.8% -5.6% 37. University Highlands - Reno, NV 534 74.5% 257 35.8% 717 732 63.0% -5.8% -4.7% 38. Hawks Landing - Oxford, OH 343 72.1% 350 73.5% 476 484 74.4% -6.2% -6.2% 39. The Enclave I - Bowling Green, OH 432 90.0% 234 48.8% 480 480 65.4% -6.8% -11.4% 40. Campus Walk - Oxford - Oxford, MS 282 66.5% 212 50.0% 424 432 56.9% -9.2% -9.3% Properties Reducing Rental Rates 6,679 76.7% 5,354 61.5% 8,707 8,828 80.3% -0.5% -3.1% Total Same Store GMH Portfolio 18,775 81.0% 16,387 70.7% 23,175 23,471 87.5% 1.6% 0.7% (1) As of May 29, 2009 for current year and May 30, 2008 for prior year. (2) Rentable beds exclude beds needed for on-site staff. (3) As of September 30, 2008. (4) Projected rental rate increase is based on current executed leases and assumes all future leases are executed at currently marketed rates up to targeted occupancy.
Forward Looking Statements This presentation contains forward-looking statements, which express the current beliefs and expectations of management. Except for historical information, the matters discussed in this presentation are forward-looking statements and can be identified by the use of the words “anticipate,” “believe,” “expect,” “intend,” “may,” “might,” “plan,” “estimate,” “project,” “should,” “will,” “result” and similar expressions. Such statements are based on current expectations and involve a number of known and unknown risks and uncertainties that could cause future results, performance or achievements to differ significantly from the results, performance or achievements expressed or implied by such forward-looking statements. Actual results could differ materially from those anticipated in these forward-looking statements as a result of various factors, including risks and uncertainties related to our ability to successfully integrate the operations of GMH Communities Trust, the national economy, the real estate industry in general, and in our specific markets; the effect of terrorism or the threat of terrorism; legislative or regulatory changes including changes to laws governing REITs; dependence on key personnel whose continued service is not guaranteed; availability of qualified acquisition and development targets; availability of capital and financing; rising interest rates; rising insurance rates; impact of ad valorem and income taxation; changes in generally accepted accounting principles; and continued ability to successfully lease and operate the properties. While management believes these forward-looking statements are based on reasonable assumptions, there can be no assurance that such expectations will be achieved. These forward-looking statements are made as of the date of this presentation, and management undertakes no obligation to update publicly or revise any forward-looking statement, whether as a result of new information, future developments or otherwise.