Exhibit 99.2
 Supplemental Analyst Package First Quarter 2010 Earnings Call April 28, 2010
Table of Contents Financial Highlights 1Consolidated Balance Sheets 2Consolidated Statements of Operations 3 Consolidated Statements of Funds from Operations 4 Wholly-owned Property Results of Operations 5 Seasonality of Operations 6 Capital Structure 7 Portfolio Overview 8 2010/2011 Leasing Status - Summary 9 2010/2011 Leasing Status - By Property 10 Owned Development Update 13 Third-party Development Update 14 Management Services Update 15Investor Information 16
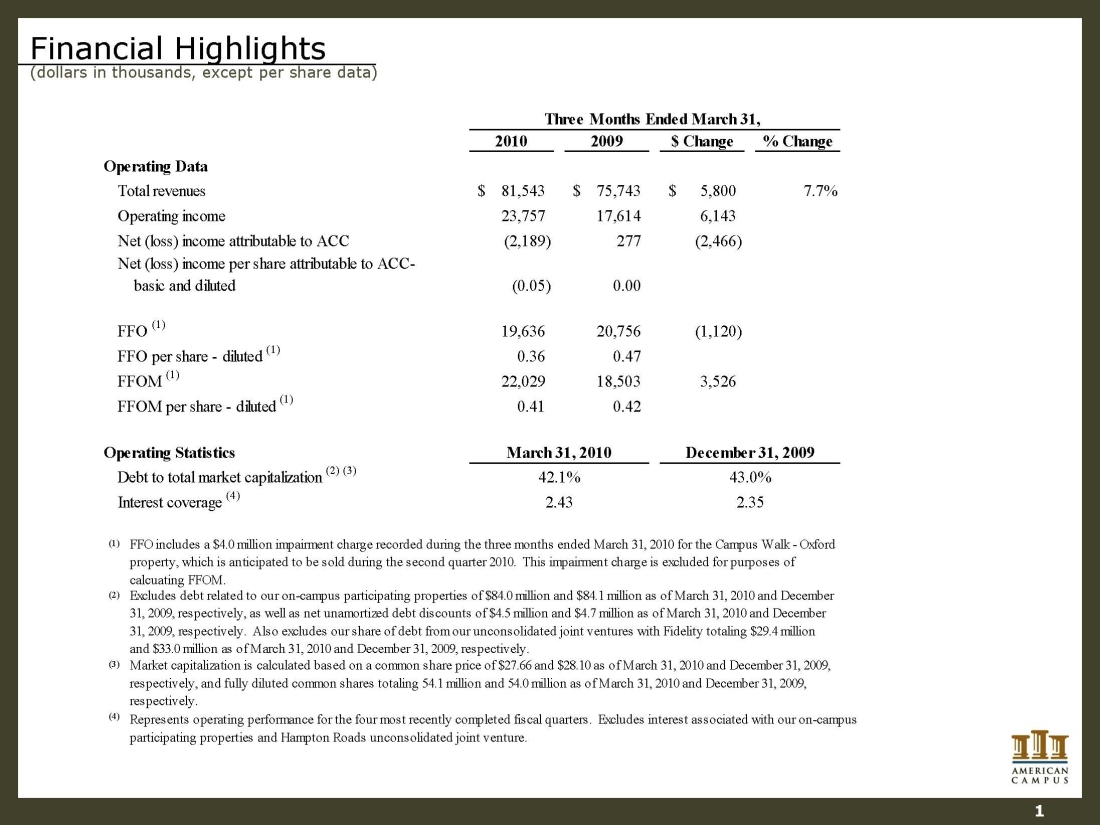
Financial Highlights (dollars in thousands, except per share data) 20102009$ Change% Change81,543$ 75,743$ 5,800$ 7.7% 23,75717,6146,143 (2,189)277(2,466) (0.05) 0.0019,63620,756(1,120) FFO per share - diluted (1)0.360.4722,02918,5033,526 FFOM per share - diluted (1)0.410.42(3)Market capitalization is calculated based on a common share price of $27.66 and $28.10 as of March 31, 2010 and December 31, 2009, respectively, and fully diluted common shares totaling 54.1 million and 54.0 million as of March 31, 2010 and December 31, 2009, respectively. 2.3543.0% Interest coverage (4) Operating incomeFFOM (1) Three Months Ended March 31, March 31, 2010December 31, 2009FFO (1) Total revenuesNet (loss) income attributable to ACCOperating DataOperating Statisti cs(4) (2) Represents operating performance for the four most recently completed fiscal quarters. Excludes interest associated with our on-campus participating properties and Hampton Roads unconsolidated joint venture. Debt to total market capitalization (2) (3)42.1% Net (loss) income per share attributable to ACC- basic and dilutedExcludes debt related to our on-campus participating properties of $84.0million and $84.1 million as of March 31, 2010 and December 31, 2009, respectively, as well as net unamortized debt discounts of $4.5 million and $4.7 million as of March 31, 2010 and December 31, 2009, respectively. Also excludes our share of debt from our unconsolidated joint ventures with Fidelity totaling $29.4 million and $33.0 million as of March 31, 2010 and December 31, 2009, respectively. 2.43(1)FFO includes a $4.0 million impairment charge recorded during the three months ended March 31, 2010 for the Campus Walk - Oxford property, which is anticipated to be sold during the second quarter 2010. This impairment charge is excluded for purposes of calcuating FFOM. 1
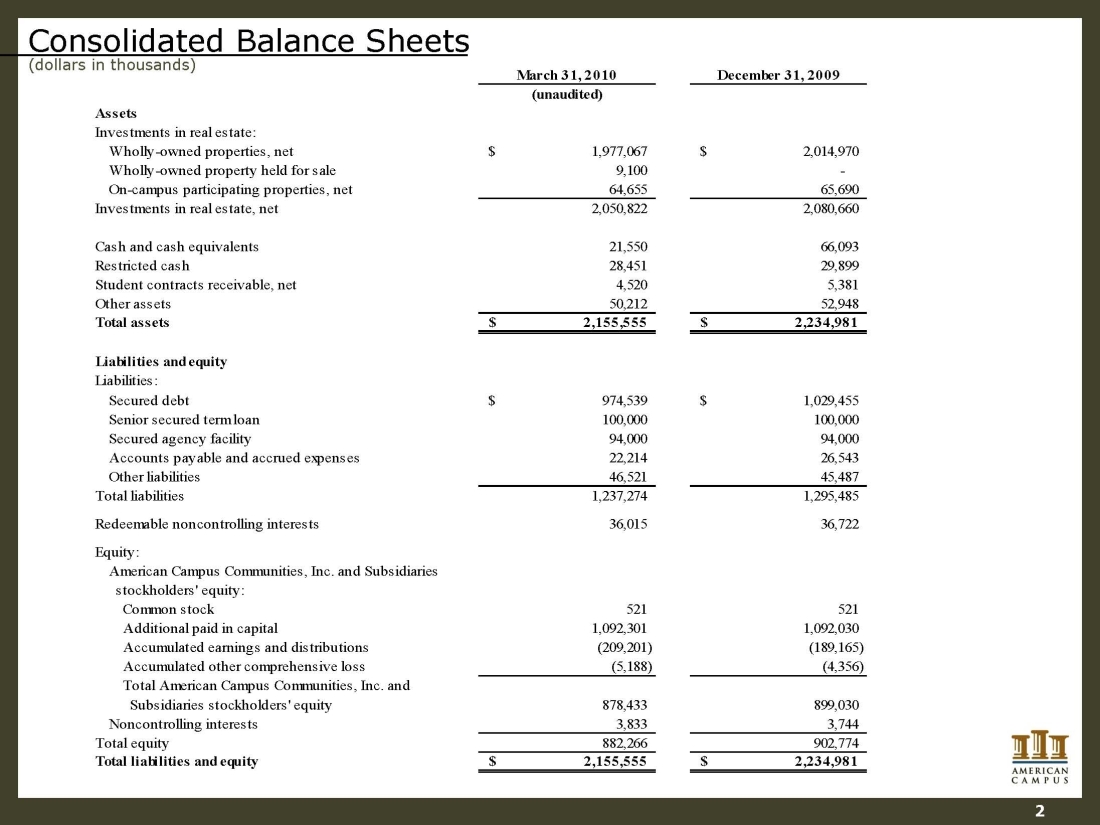
Consolidated Balance Sheets (dollars in thousands) 2 March 31, 2010December 31, 2009(unaudited) AssetsInvestments in real estate: Wholly-owned properties, net1,977,067$ 2,014,970$ Wholly-owned property held for sale9,100 - On-campus participating properties, net64,65565,690Investments in real estate, net2,050,8222,080,660Cash and cash equivalents21,55066,093Restricted cash 28,45129,899Student contracts receivable, net4,5205,381Other assets50,21252,948Total assets2,155,555$ 2,234,981$ Liabilities and equityLiabilities: Secured debt974,539$ 1,029,455$ Senior secured term loan100,000 100,000 Secured agency facility94,000 94,000 Accounts payable and accrued expenses22,21426,543Other liabilities46,52145,487Total liabilities1,237,2741,295,485Redeemable non controlling interests36,01536,722Equity: American Campus Communities, Inc. and Subsidiaries stockholders' equity: Common stock521521Additional paid in capital1,092,3011,092,030Accumulated earnings and distributions(209,201)(189,165) Accumulated other comprehensive loss(5,188)(4,356) 878,433899,030Noncontrolling interests3,8333,744Total equity882,266902,774Total liabilities and equity2,155,555$ 2,234,981$ Total American Campus Communities, Inc. and Subsidiaries stockholders' equity
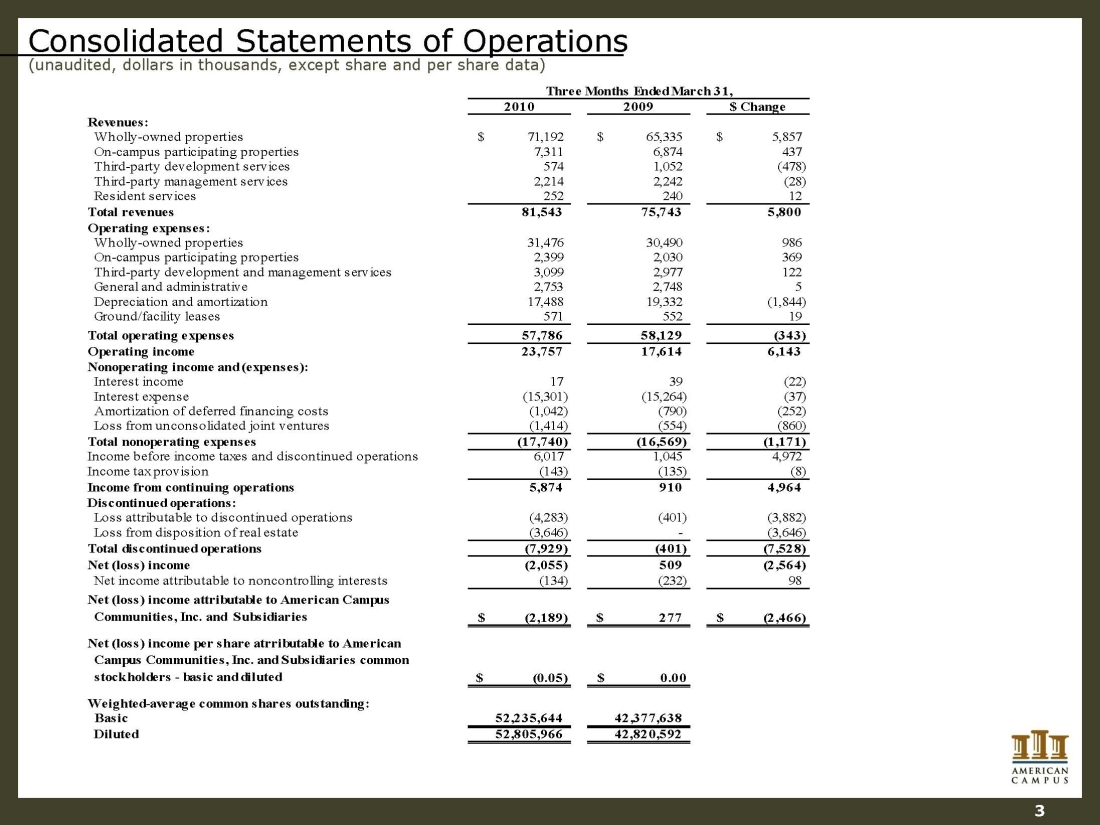
20102009$ ChangeRevenues: Wholly-owned properties71,192$ 65,335$ 5,857$ On-campus participating properties7,3116,874437 Third-party development services5741,052(478) Third-party management services2,2142,242(28) Resident services25224012 Total revenues81,54375,7435,800Operating expenses: Wholly-owned properties31,47630,490986 On-campus participating properties2,3992,030369 Third-party development and management services3,0992,977122 General and administrative2,7532,7485 Depreciation and amortization17,48819,332(1,844) Ground/facility leases57155219 Total operating expenses57,78658,129(343) Operating income 23,75717,6146,143Nonoperating income and (expenses): Interest income1 739(22) Interest expense(15,301)(15,264)(37) Amortization of deferred financing costs(1,042)(790)(252) Loss from unconsolidated joint ventures(1,414)(554)(860) Total nonoperating expenses(17,740)(16,569)(1,171) Income before income taxes and discontinued operations6,0171,0454,972Income tax provision(143) (135) (8) Income from continuing operations5,8749104,964 Discontinued operations: Loss attributable to discontinued operations(4,283)(401)(3,882) Loss from disposition of real estate(3,646) - (3,646) Total discontinued operations(7,929)(401)(7,528) Net (loss) income(2,055)509(2,564) Net income attributable to noncontrolling interests(134) (232) 98 Net (loss) income attributable to American Campus Communities, Inc. and Subsidiaries(2,189)$ 277$ (2,466)$ Net (loss) income per share atrributable to American Campus Communities, Inc. and Subsidiaries common ; stockholders - basic and diluted(0.05)$ $ 0.00Weighted-average common shares outstanding: Basic52,235,644 42,377,638 Diluted52,805,96642,820,592Three Months Ended March 31, Consolidated Statements of Operations (unaudited, dollars in thousands, except share and per share data) 3
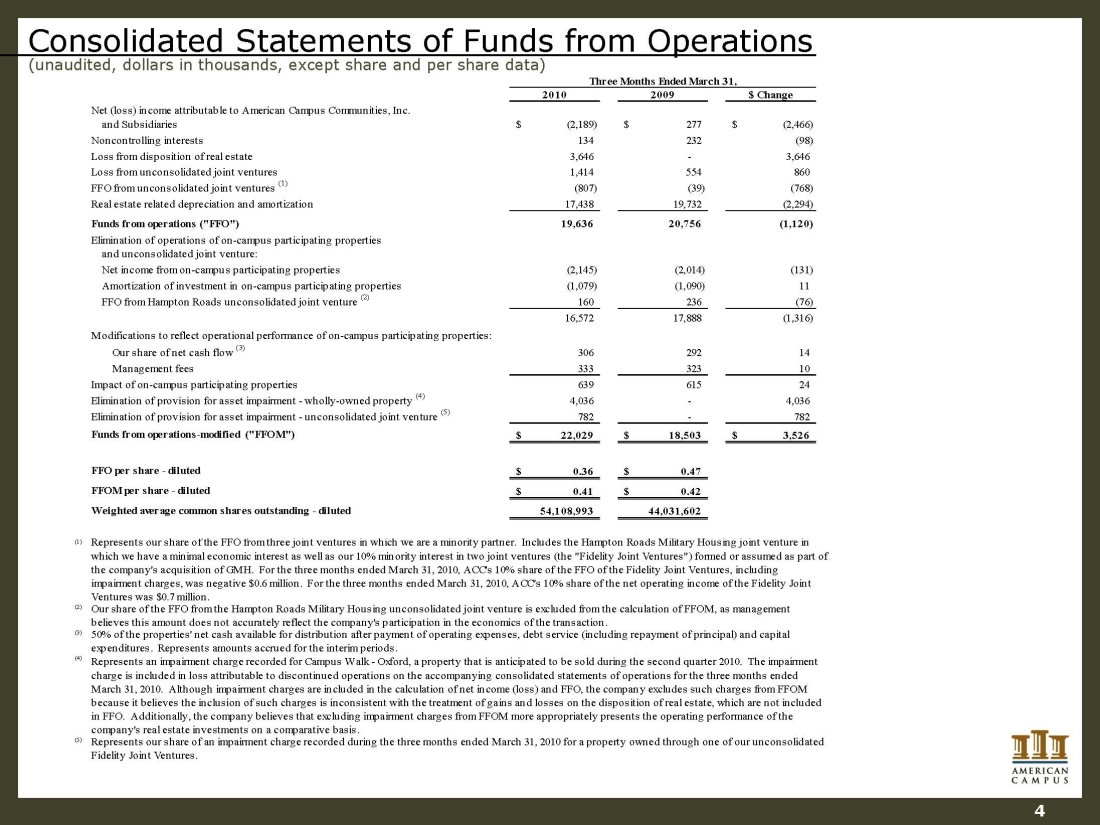
Consolidated Statements of Funds from Operations (unaudited, dollars in thousands, except share and per share data) 20102009$ ChangeNet (loss) income attributable to American Campus Communities, Inc. and Subsidiaries(2,189)$ 277$ (2,466)$ Noncontrolling interests134 232 (98) Loss from disposition of real estate3,646 - 3,646 Loss from unconsolidated joint ventures 1,414 554 860 FFO from unconsolidated joint ventures (1)(807) (39) (768) Real estate related depreciation and amortization17,438 19,732 (2,294) Funds from operations ("FFO")19,636 20,756 (1,120) Elimination of operations of on-campus participating properties and unconsolidated joint venture: Net income from on-campus participating properties(2,145) (2,014) (131) &# 160;Amortization of investment in on-campus participating properties(1,079) (1,090) 11 FFO from Hampton Roads unconsolidated joint venture (2)160 236 (76) 16,572 17,888 (1,316) Modifications to reflect operational performance of on-campus participating properties: Our share of net cash flow (3)306 292 14 Management fees333 323 10 Impact of on-campus participating properties639 615 24 Elimination of provision for asset impairment - wholly-owned property (4)4,036 - 4,036 Elimination of provision for asset impairment - unconsolidated joint venture (5)782 - 782 Funds from operations-modified ("FFOM")22,029$ 18,503$ 3,526$ FFO per share - diluted0.36$ 0.47$ FFOM per share - diluted0.41$ 0.42$ Weighted average common shares outstanding - diluted54,108,993 44,031,602 (1) (2) (3) (4) (5) Represents our share of the FFO from three joint ventures in which we are a minority partner. Includ es the Hampton Roads Military Housing joint venture in which we have a minimal economic interest as well as our 10% minority interest in two joint ventures (the "Fidelity Joint Ventures") formed or assumed as part of the company's acquisition of GMH. For the three months ended March 31, 2010, ACC's 10% share of the FFO of the Fidelity Joint Ventures, including impairment charges, was negative $0.6 million. For the three months ended March 31, 2010, ACC's 10% share of the net operating income of the Fidelity Joint Ventures was $0.7 million. Our share of the FFO from the Hampton Roads Military Housing unconsolidated joint venture is excluded from the calculation of FFOM, as management believes this amount does not accurately reflect the company's participation in the economics of the transaction. 50% of the properties' net cash available for distribution after payment of operating expenses, debt service (including repayment of principal) and cap ital expenditures. Represents amounts accrued for the interim periods. Three Months Ended March 31, Represents an impairment charge recorded for Campus Walk - Oxford, a property that is anticipated to be sold during the second quarter 2010. The impairment charge is included in loss attributable to discontinued operations on the accompanying consolidated statements of operations for the three months ended March 31, 2010. Although impairment charges are included in the calculation of net income (loss) and FFO, the company excludes such charges from FFOM because it believes the inclusion of such charges is inconsistent with the treatment of gains and losses on the disposition of real estate, which are not included in FFO. Additionally, the company believes that excluding impairment charges from FFOM more appropriately presents the operating performance of the company's real estate investments on a comparative basis. Represents our shar e of an impairment charge recorded during the three months ended March 31, 2010 for a property owned through one of our unconsolidated Fidelity Joint Ventures. 4
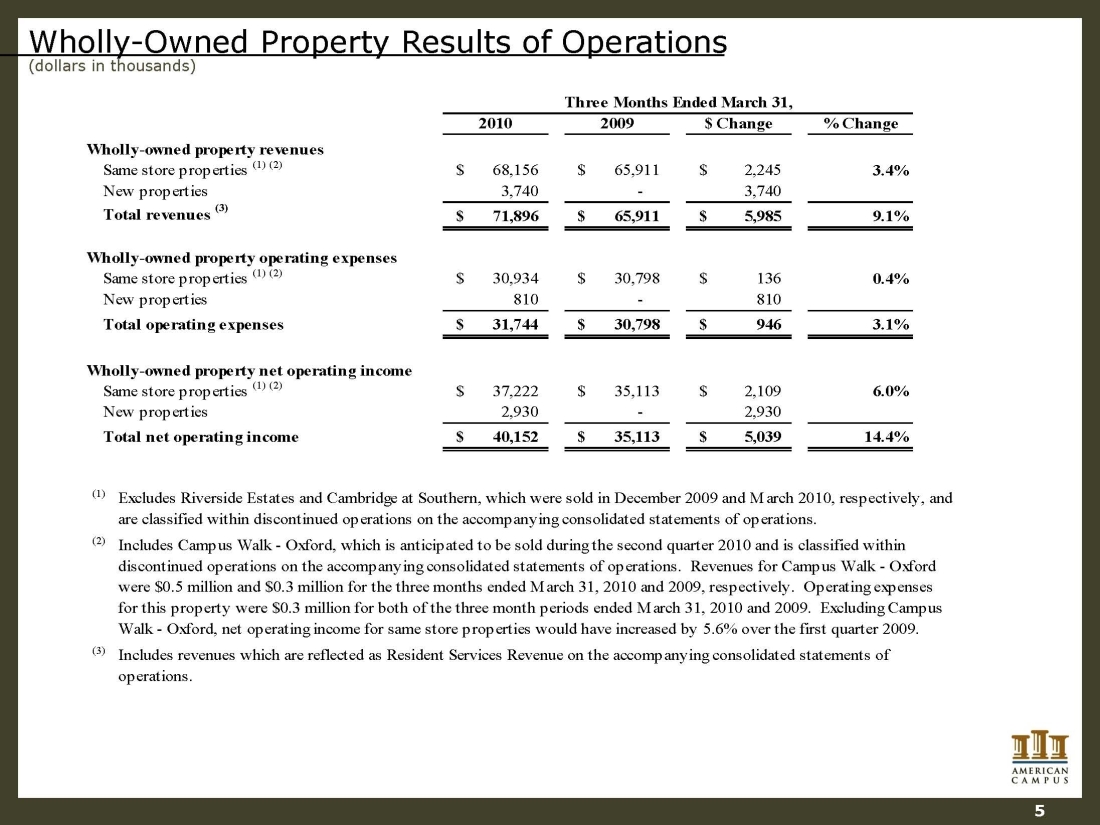
Wholly-Owned Property Results of Operations (dollars in thousands) 5 20102009$ Change% ChangeWholly-owned property revenuesSame store properties (1) (2)68,156$ 65,911$ 2,245$ 3.4% New properties3,740 - 3,740 Total revenues (3)71,896$ 65,911$ 5,985$ 9.1% Wholly-owned property operating expensesSame store properties (1) (2)30,934$ 30,798$ 136$ 0.4% New properties810 - 810 Total operating expenses31,744$ 30,798$ 946$ 3.1% Wholly-owned property net operating incomeSame store properties (1) (2)37,222$ 35,113$ 2,109$ 6.0% New properties2,930 - 2,930 Total net operating income40,152$ 35,113$ 5,039$ 14.4% (1) (2) (3) Three Months Ended March 31, Includes revenues which are reflected as Resident Services Revenue on the accompanying consolidated statements of operations. Excludes R iverside Estates and Cambridge at Southern, which were sold in December 2009 and March 2010, respectively, and are classified within discontinued operations on the accompanying consolidated statements of operations. Includes Campus Walk - Oxford, which is anticipated to be sold during the second quarter 2010 and is classified within discontinued operations on the accompanying consolidated statements of operations. Revenues for Campus Walk - Oxford were $0.5 million and $0.3 million for the three months ended March 31, 2010 and 2009, respectively. Operating expenses for this property were $0.3 million for both of the three month periods ended March 31, 2010 and 2009. Excluding Campus Walk - Oxford, net operating income for same store properties would have increased by 5.6% over the first quarter 2009.
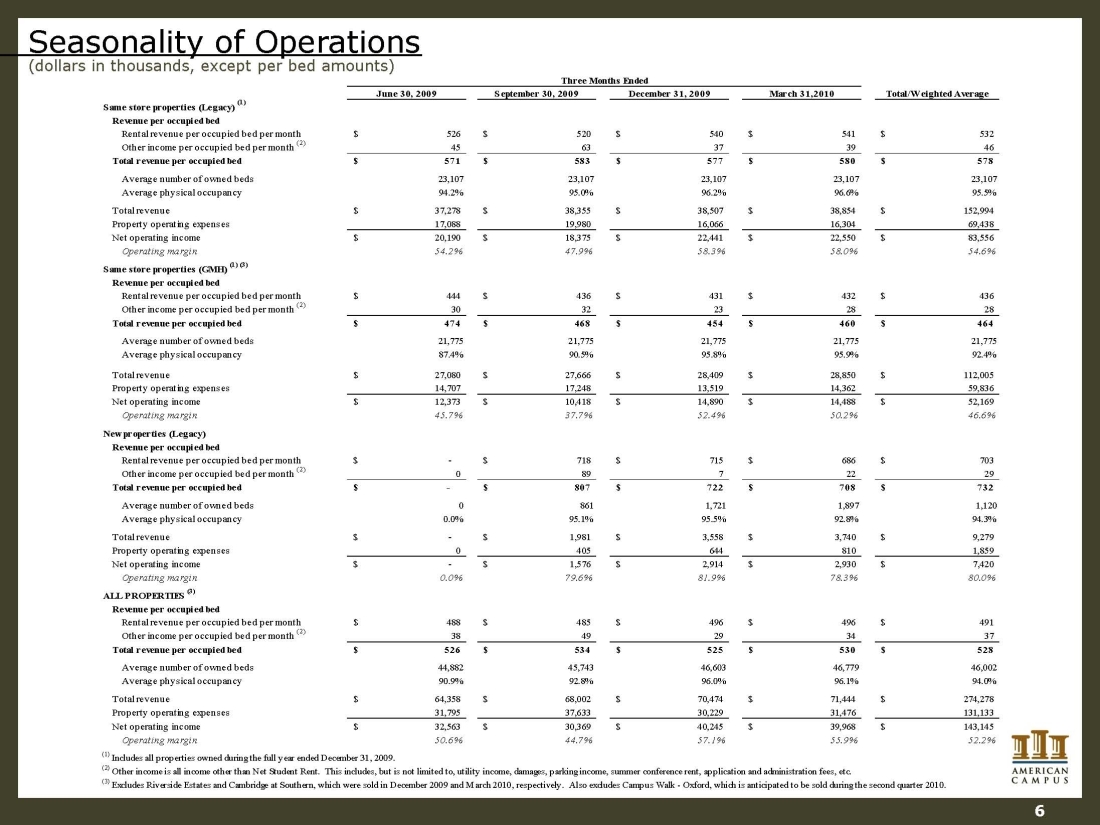
Seasonality of Operations (dollars in thousands, except per bed amounts) 6 June 30, 2009September 30, 2009December 31, 2009March 31,2010Total/Weighted AverageSame store properties (Legacy) (1) Revenue per occupied bedRental revenue per occupied bed per month526$ 520$ 540$ 541$ 532$ Other income per occupied bed per month (2)4563373946Total revenue per occupied bed571$ 583$ 577$ 580$ 578$ Average number of owned beds23,10723,10723,10723,10723,107Average physical occupancy94.2%95.0%96.2%96.6%95.5% Total revenue37,278$ 38,355$ 38,507$ 38,854$ 152,994$ Property operating expenses17,08819,98016,06616,30469,438Net operating income20,190$ 18,375$ 22,441$ 22,550$ 83,556$ Operating margin54.2%47.9%58.3%58.0%54.6% Same store properties (GMH) (1) (3) Revenue per occupied bedRental revenue per occupied bed per month444$ 436$ 431$ 432$ 436$ Other income per occupied bed per month (2)3032232828Total revenue per occupied bed474$ 468$ 454$ 460$ 464$ Average number of owned beds21,77521,77521,77521,77521,775Average physical occupancy87.4%90.5%95.8%95.9%92.4% Total revenue27,080$ 27,666$ 28,409$ 28,850$ 112,005$ Property operating expenses14,70717,24813,51914,36259,836Net operating income12,373$ 10,418$ 14,890$ 14,488$ 52,169$ Operating margin45.7%37.7%52.4%50.2%46.6% New properties (Legacy) Revenue per occupied bedRental revenue per occupied bed per month-$ 718$ 715$ 686$ 703$ Other income per occupied bed per month (2)08972229Total revenue per occupied bed-$ 807$ 722$ 708$ 732$ Average number of owned beds08611,7211,8971,120Average physical occupancy0.0%95.1%95.5%92.8%94.3% Total revenue-$ 1,981$ 3,558$ 3,740$ 9,279$ Property operating expenses04056448101,859Net operating income-$ 1,576$ 2,914$ 2,930$ 7,420$ Operat ing margin0.0%79.6%81.9%78.3%80.0% ALL PROPERTIES (3) Revenue per occupied bedRental revenue per occupied bed per month488$ 485$ 496$ 496$ 491$ Other income per occupied bed per month (2)3849293437Total revenue per occupied bed526$ 534$ 525$ 530$ 528$ Average number of owned beds44,88245,74346,60346,77946,002Average physical occupancy90.9%92.8%96.0%96.1%94.0% Total revenue64,358$ 68,002$ 70,474$ 71,444$ 274,278$ Property operating expenses31,79537,63330,22931,476131,133Net operating income32,563$ 30,369$ 40,245$ 39,968$ 143,145$ Operating margin50.6%44.7%57.1%55.9%52.2% (1) Includes all properties owned during the full year ended December 31, 2009. (2) Other income is all income other than Net Student Rent. This includes, but is not limited to, utility income, damages, parking income, summer conference rent, application and administration fees, etc. (3) Excludes Riverside Estates and Cambridge at Southern, which were sold in December 2009 and March 2010, respective ly. Also excludes Campus Walk - Oxford, which is anticipated to be sold during the second quarter 2010. Three Months Ended
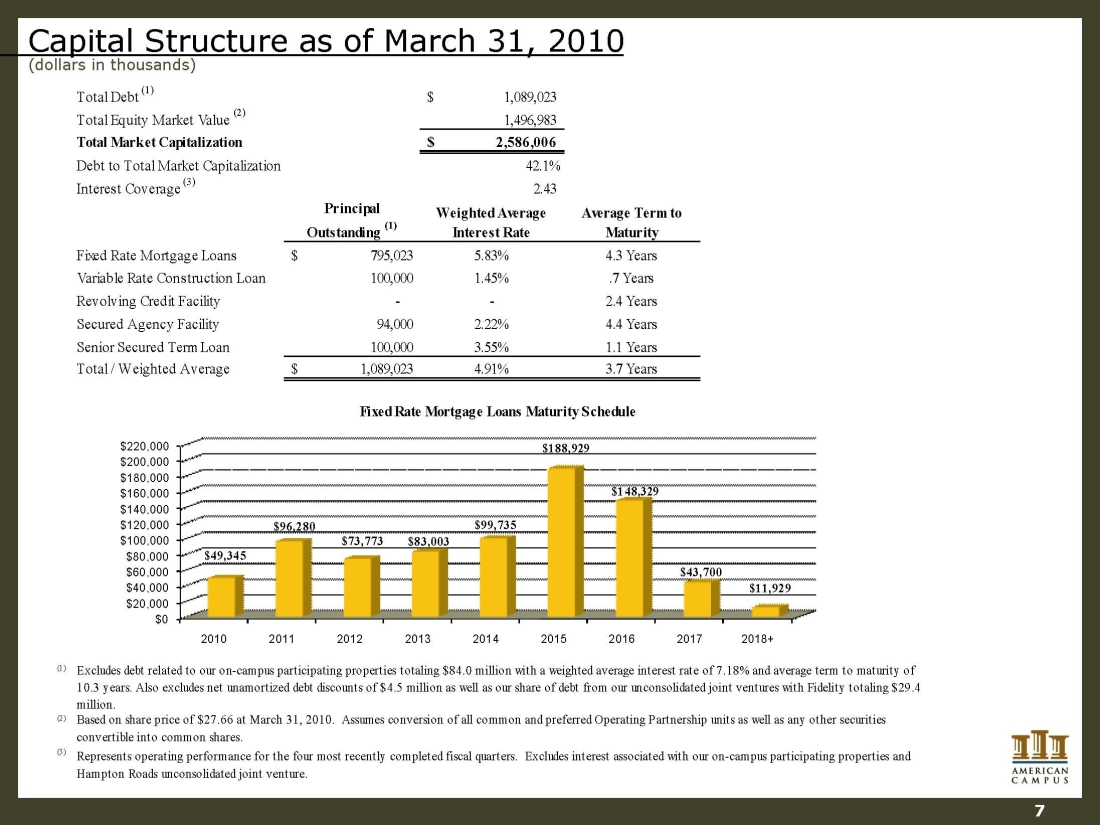
Capital Structure as of March 31, 2010 (dollars in thousands) Total Debt (1)1,089,023$ Total Equity Market Value (2)1,496,983 Total Market Capitalization2,586,006$ Debt to Total Market Capitalization42.1% Interest Coverage (3)2.43 Principal Outstanding (1) Weighted Average Interest RateAverage Term to MaturityFixed Rate Mortgage Loans795,023$ 5.83%4.3 YearsVariable Rate Construction Loan100,000 1.45%.7 YearsRevolving Credit Facility - -2.4 YearsSecured Agency Facility 94,000 2.22%4.4 YearsSenior Secured Term Loan 100,000 3.55%1.1 YearsTotal / Weighted Average1,089,023$ 4.91%3.7 Years(1) (2) (3) Fixed Rate Mortgage Loans Maturity Schedule Excludes debt related to our on-campus participating properties totaling $84.0 million with a weighted average interest rate of 7.18% and average term to maturity of 10.3 years. Also excludes net unamortized debt discounts of $4.5 million as well as our share of debt from our unconsolidated joint ventures with Fidelity totaling $29.4 million. Based on share price of $27.66 at March 31, 2010. Assumes conversion of all common and preferred Operating Partnership units as well as any other securities convertible into common shares. Represents operating performance for the four most recently completed fiscal quarters. Excludes interest associated with our on-campus participating properties and Hampton Roads unconsolidated joint venture. $0$20,000$40,000$60,000$80,000$100,000$120,000$140,000$160,000$180,000$200,000$220,000201020112012201320142015201620172018+ $49,345 $96,280 $73,773 $83,003 $99,735 $188,929 $148,329 $43,700 $11,929 7
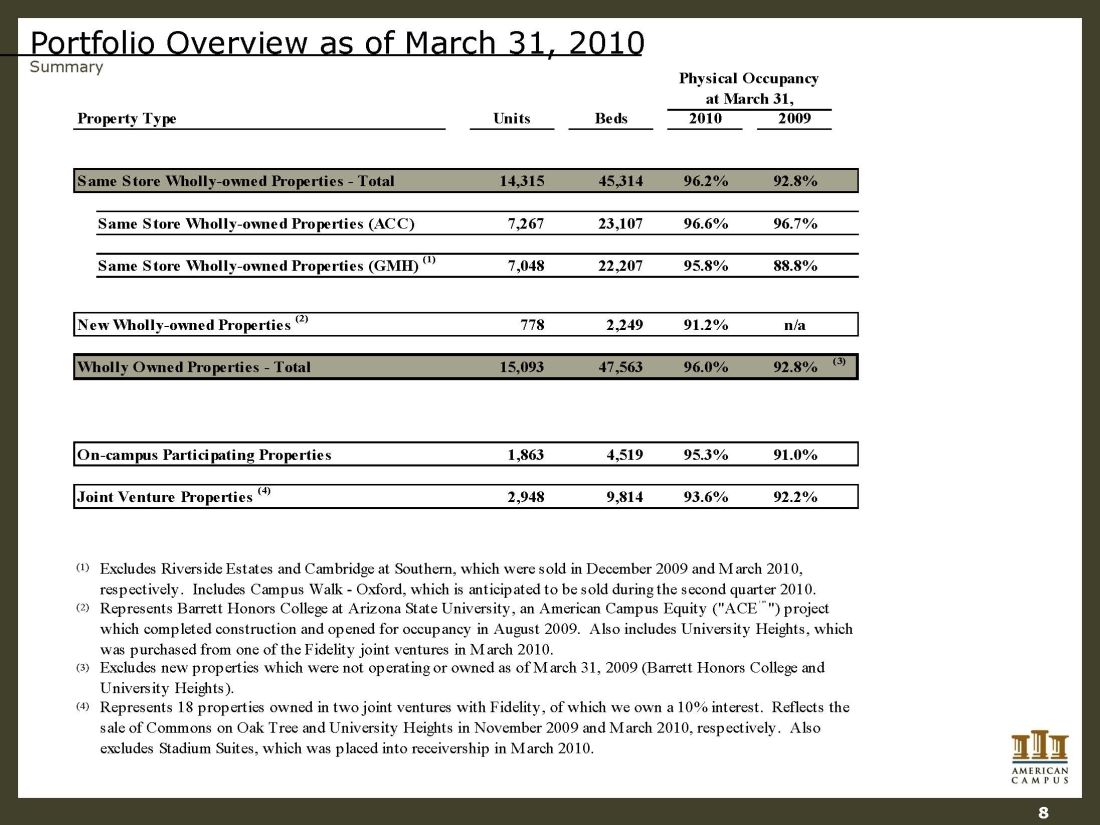
Portfolio Overview as of March 31, 2010 Summary UnitsBeds20102009Same Store Wholly-owned Properties - Total14,315 45,314 96.2%92.8% Same Store Wholly-owned Properties (ACC)7,267 23,107 96.6%96.7% Same Store Wholly-owned Properties (GMH) (1)7,048 22,207 95.8%88.8% New Wholly-owned Properties (2)778 2,249 91.2%n/aWholly Owned Properties - Total15,093 47,563 96.0%92.8%(3) On-campus Participating Properties1,863 4,519 95.3%91.0% Joint Venture Properties (4)2,948 9,814 93.6%92.2% (1) (2) (3) (4) Represents Barrett Honors College at Arizona State University, an American Campus Equity ("ACE™") project which completed construction and opened for occupancy in August 2009. Also includes University Heights, which was purchased from one of the Fidelity joint ventures in March 2 010. Physical Occupancy at March 31, Property TypeRepresents 18 properties owned in two joint ventures with Fidelity, of which we own a 10% interest. Reflects the sale of Commons on Oak Tree and University Heights in November 2009 and March 2010, respectively. Also excludes Stadium Suites, which was placed into receivership in March 2010. Excludes Riverside Estates and Cambridge at Southern, which were sold in December 2009 and March 2010, respectively. Includes Campus Walk - Oxford, which is anticipated to be sold during the second quarter 2010. Excludes new properties which were not operating or owned as of March 31, 2009 (Barrett Honors College and University Heights). 8
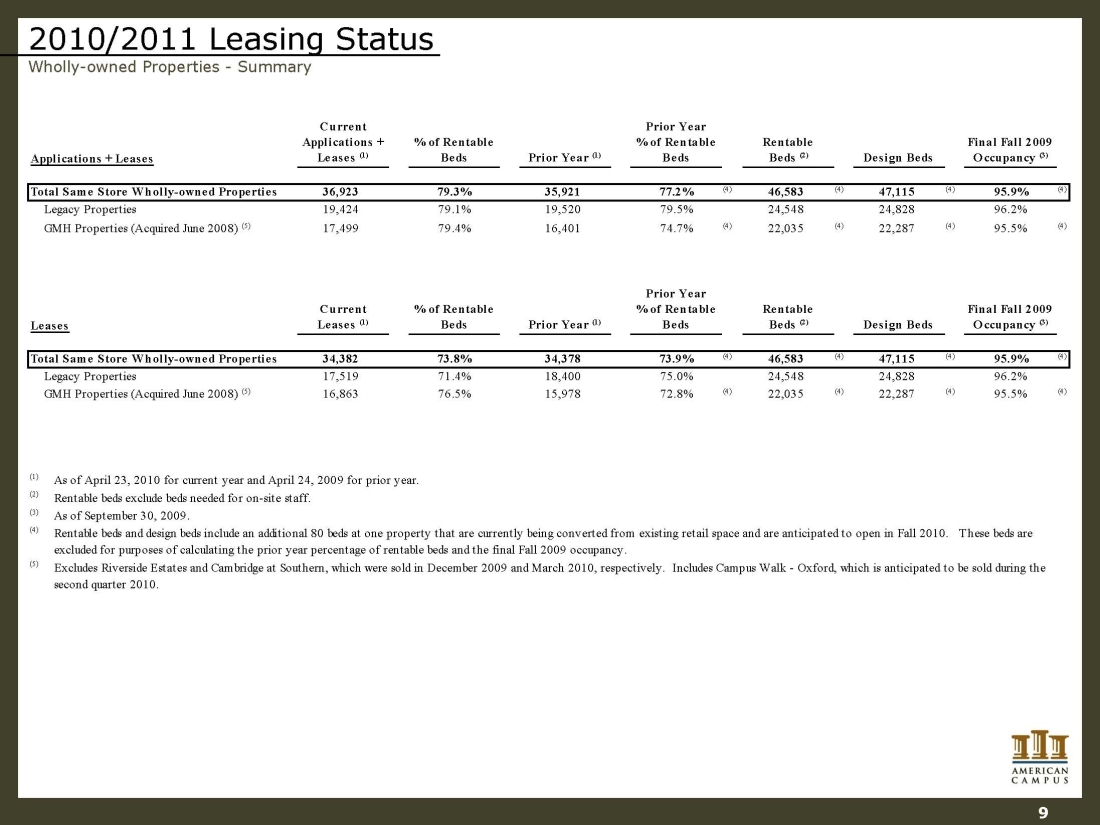
2010/2011 Leasing Status Wholly-owned Properties -Summary 9 Applications + LeasesCurrent Applications + Leases (1) % of Rentable BedsPrior Year (1) Prior Year % of Rentable BedsRentable Beds (2)Design BedsFinal Fall 2009 Occupancy (3) Total Same Store Wholly-owned Properties36,92379.3%35,92177.2%(4)46,583(4)47,115(4)95.9%(4) Legacy Properties 19,42479.1%19,52079.5%24,54824,82896.2% GMH Properties (Acquired June 2008) (5)17,49979.4%16,40174.7%(4)22,035(4)22,287(4)95.5%(4) LeasesCurrent Leases (1) % of Rentable BedsPrior Year (1) Prior Year % of Rentable BedsRentable Beds (2)Design BedsFinal Fall 2009 Occupancy (3) Total Same Store Wholly-owned Properties34,38273.8%34,37873.9%(4)46,583(4 )47,115(4)95.9%(4) Legacy Properties 17,51971.4%18,40075.0%24,54824,82896.2% GMH Properties (Acquired June 2008) (5)16,86376.5%15,97872.8%(4)22,035(4)22,287(4)95.5%(4) (1)As of April 23, 2010 for current year and April 24, 2009 for prior year. (2)Rentable beds exclude beds needed for on-site staff. (3)As of September 30, 2009. (4) (5) Rentable beds and design beds include an additional 80 beds at one property that are currently being converted from existing retail space and are anticipated to open in Fall 2010. These beds are excluded for purposes of calculating the prior year percentage of rentable beds and the final Fall 2009 occupancy. Excludes Riverside Estates and Cambridge at Southern, which were sold in December 2009 and March 2010, respectively. Includes Campus Walk - Oxford, which is anticipated to be sold during the second quarter 2010.
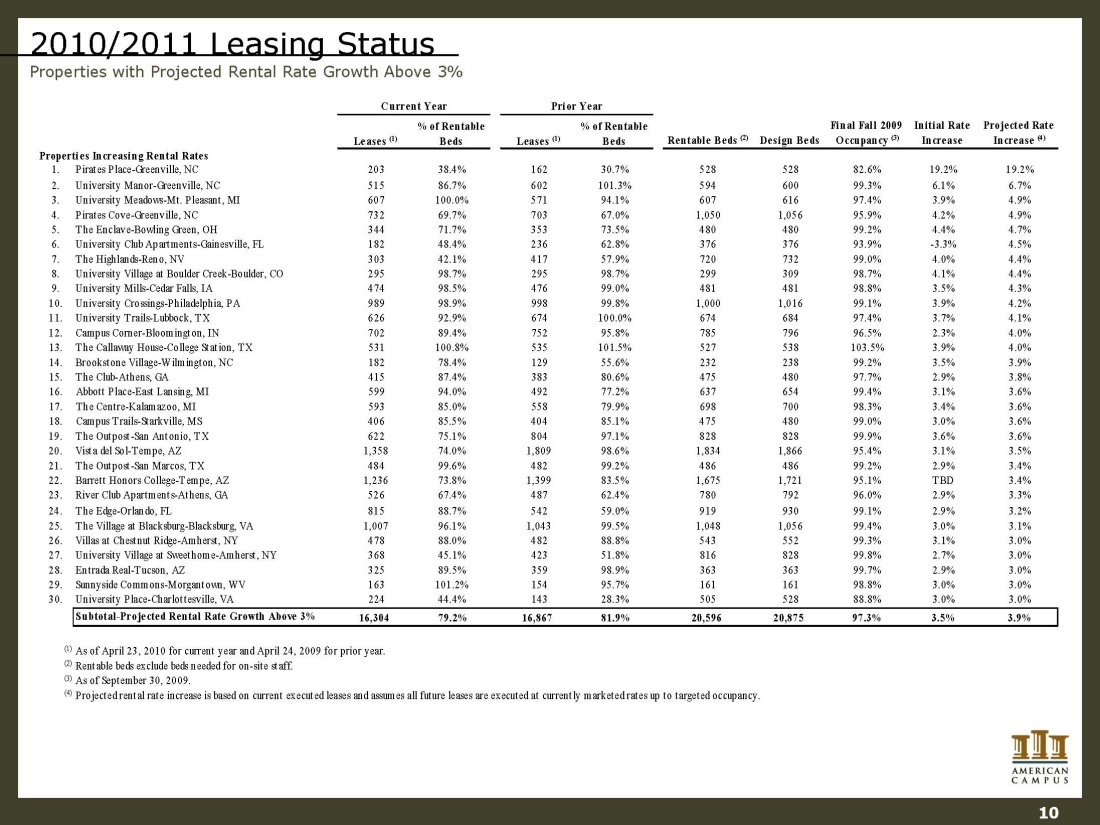
Leases (1) % of Rentable BedsLeases (1) % of Rentable BedsProperties Increasing Rental Rates1.Pirates Place-Greenville, NC20338.4%16230.7%52852882.6%19.2%19.2% 2.University Manor-Greenville, NC51586.7%602101.3%59460099.3%6.1%6.7% 3.University Meadows-Mt. Pleasant, MI607100.0%57194.1%60761697.4%3.9%4.9% 4.Pirates Cove-Greenville, NC73269.7%70367.0%1,0501,05695.9%4.2%4.9% 5.The Enclave-Bowling Green, OH34471.7%35373.5%48048099.2%4.4%4.7% 6.University Club Apartments-Gainesville, FL18248.4%23662.8%37637693.9%-3.3%4.5% 7.The Highlands-Reno, NV30342.1%41757.9%72073299.0%4.0%4.4% 8.University Village at Boulder Creek-Boulder, CO29598.7%29598.7%29930998.7%4.1%4.4% 9.University Mills-Cedar Falls, IA47498.5%47699.0%48148198.8%3.5%4.3% 10.University Crossings-Philadelphia, PA98998.9%99899.8%1,0001,01699.1%3 .9%4.2% 11.University Trails-Lubbock, TX62692.9%674100.0%67468497.4%3.7%4.1% 12.Campus Corner-Bloomington, IN70289.4%75295.8%78579696.5%2.3%4.0% 13.The Callaway House-College Station, TX531100.8%535101.5%527538103.5%3.9%4.0% 14.Brookstone Village-Wilmington, NC18278.4%12955.6%23223899.2%3.5%3.9% 15.The Club-Athens, GA41587.4%38380.6%47548097.7%2.9%3.8% 16.Abbott Place-East Lansing, MI59994.0%49277.2%63765499.4%3.1%3.6% 17.The Centre-Kalamazoo, MI59385.0%55879.9%69870098.3%3.4%3.6% 18.Campus Trails-Starkville, MS40685.5%40485.1%47548099.0%3.0%3.6% 19.The Outpost-San Antonio, TX62275.1%80497.1%82882899.9%3.6%3.6% 20.Vista del Sol-Tempe, AZ1,35874.0%1,80998.6%1,8341,86695.4%3.1%3.5% 21.The Outpost-San Marcos, TX48499.6%48299.2%48648699.2%2.9%3.4% 22.Barrett Honors College-Tempe, AZ1,23673.8%1,39983.5%1,6751,72195.1%TBD3.4% 23.River Club Apartments-Athens, GA52667.4%48762.4%78079296.0%2.9%3.3% 24.The Edge-Orlando, FL81588.7%54259.0%91993099.1%2.9%3.2% 25.The Village at Blacksburg-Blacksburg, VA1,00796.1%1,04399. 5%1,0481,05699.4%3.0%3.1% 26.Villas at Chestnut Ridge-Amherst, NY47888.0%48288.8%54355299.3%3.1%3.0% 27.University Village at Sweethome-Amherst, NY36845.1%42351.8%81682899.8%2.7%3.0% 28.Entrada Real-Tucson, AZ32589.5%35998.9%36336399.7%2.9%3.0% 29.Sunnyside Commons-Morgantown, WV163101.2%15495.7%16116198.8%3.0%3.0% 30.University Place-Charlottesville, VA22444.4%14328.3%50552888.8%3.0%3.0% Subtotal-Projected Rental Rate Growth Above 3%16,30479.2%16,86781.9%20,59620,87597.3%3.5%3.9% (1)As of April 23, 2010 for current year and April 24, 2009 for prior year. (2)Rentable beds exclude beds needed for on-site staff. (3)As of September 30, 2009. (4)Projected rental rate increase is based on current executed leases and assumes all future leases are executed at currently marketed rates up to targeted occupancy. Initial Rate IncreaseProjected Rate Increase (4) Current YearDesign BedsFinal Fall 2009 Occupancy (3)Rentable Beds (2) Prior Year 10 2010/2011 Leasing Status Properties with Pr ojected Rental Rate Growth Above 3%
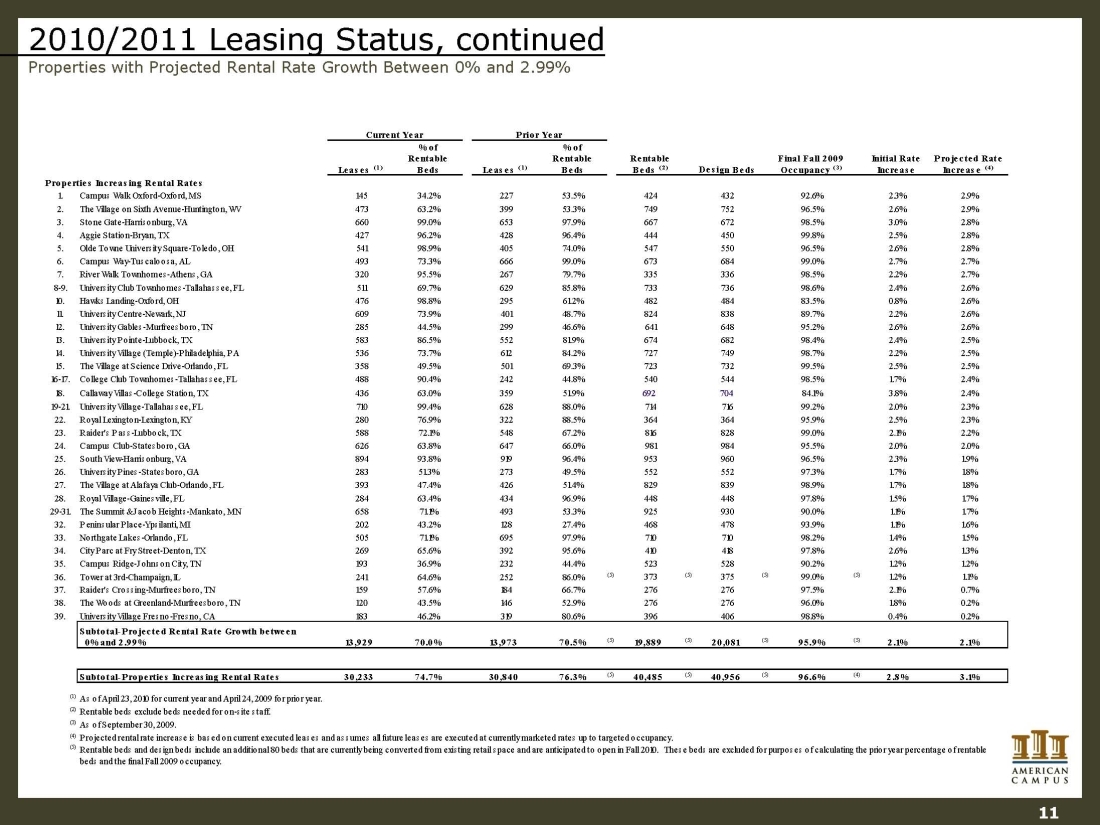
2010/2011 Leasing Status, continued Properties with Projected Rental Rate Growth Between 0% and 2.99% 11 Leases (1) % of Rentable BedsLeases (1) % of Rentable BedsProperties Increasing Rental Rates1.Campus Walk Oxford-Oxford, MS14534.2%22753.5%42443292.6%2.3%2.9% 2.The Village on Sixth Avenue-Huntington, WV47363.2%39953.3%74975296.5%2.6%2.9% 3.Stone Gate-Harrisonburg, VA66099.0%65397.9%66767298.5%3.0%2.8% 4.Aggie Station-Bryan, TX42796.2%42896.4%44445099.8%2.5%2.8% 5.Olde Towne University Square-Toledo, OH54198.9%40574.0%54755096.5%2.6%2.8% 6.Campus Way-Tuscaloosa, AL49373.3%66699.0%67368499.0%2.7%2.7% 7.River Walk Townhomes-Athens, GA32095.5%26779.7%33533698.5%2.2%2.7% 8-9.University Club Townhomes-Tallahassee, FL51169.7%62985.8%73373698.6%2.4%2.6% 10.Hawks Landing-Oxford, OH47698. 8%29561.2%48248483.5%0.8%2.6% 11.University Centre-Newark, NJ60973.9%40148.7%82483889.7%2.2%2.6% 12.University Gables-Murfreesboro, TN28544.5%29946.6%64164895.2%2.6%2.6% 13.University Pointe-Lubbock, TX58386.5%55281.9%67468298.4%2.4%2.5% 14.University Village (Temple)-Philadelphia, PA53673.7%61284.2%72774998.7%2.2%2.5% 15.The Village at Science Drive-Orlando, FL35849.5%50169.3%72373299.5%2.5%2.5% 16-17.College Club Townhomes-Tallahassee, FL48890.4%24244.8%54054498.5%1.7%2.4% 18.Callaway Villas-College Station, TX43663.0%35951.9%69270484.1%3.8%2.4% 19-21.University Village-Tallahassee, FL71099.4%62888.0%71471699.2%2.0%2.3% 22.Royal Lexington-Lexington, KY28076.9%32288.5%36436495.9%2.5%2.3% 23.Raider's Pass-Lubbock, TX58872.1%54867.2%81682899.0%2.1%2.2% 24.Campus Club-Statesboro, GA62663.8%64766.0%98198495.5%2.0%2.0% 25.South View-Harrisonburg, VA89493.8%91996.4%95396096.5%2.3%1.9% 26.University Pines-Statesboro, GA28351.3%27349.5%55255297.3%1.7%1.8% 27.The Village at Alafaya Club-Orlando, FL39347.4%42651.4%82 983998.9%1.7%1.8% 28.Royal Village-Gainesville, FL28463.4%43496.9%44844897.8%1.5%1.7% 29-31.The Summit & Jacob Heights-Mankato, MN65871.1%49353.3%92593090.0%1.1%1.7% 32.Peninsular Place-Ypsilanti, MI20243.2%12827.4%46847893.9%1.1%1.6% 33.Northgate Lakes-Orlando, FL50571.1%69597.9%71071098.2%1.4%1.5% 34.City Parc at Fry Street-Denton, TX26965.6%39295.6%41041897.8%2.6%1.3% 35.Campus Ridge-Johnson City, TN19336.9%23244.4%52352890.2%1.2%1.2% 36.Tower at 3rd-Champaign, IL24164.6%25286.0%(5)373(5)375(5)99.0%(5)1.2%1.1% 37.Raider's Crossing-Murfreesboro, TN15957.6%18466.7%27627697.5%2.1%0.7% 38.The Woods at Greenland-Murfreesboro, TN12043.5%14652.9%27627696.0%1.8%0.2% 39.University Village Fresno-Fresno, CA18346.2%31980.6%39640698.8%0.4%0.2% Subtotal-Projected Rental Rate Growth between 0% and 2.99%13,92970.0%13,97370.5%(5)19,889(5)20,081(5)95.9%(5)2.1%2.1% Subtotal-Properties Increasing Rental Rates30,23374.7%30,84076.3%(5)40,485(5)40,956(5)96.6%(4)2.8%3.1% (1)As of April 23, 2010 for current year a nd April 24, 2009 for prior year. (2)Rentable beds exclude beds needed for on-site staff. (3)As of September 30, 2009. (4)Projected rental rate increase is based on current executed leases and assumes all future leases are executed at currently marketed rates up to targeted occupancy. (5)Rentable beds and design beds include an additional 80 beds that are currently being converted from existing retail space and are anticipated to open in Fall 2010. These beds are excluded for purposes of calculating the prior year percentage of rentable beds and the final Fall 2009 occupancy. Initial Rate IncreaseProjected Rate Increase (4) Current YearDesign BedsFinal Fall 2009 Occupancy (3) Rentable Beds (2) Prior Year
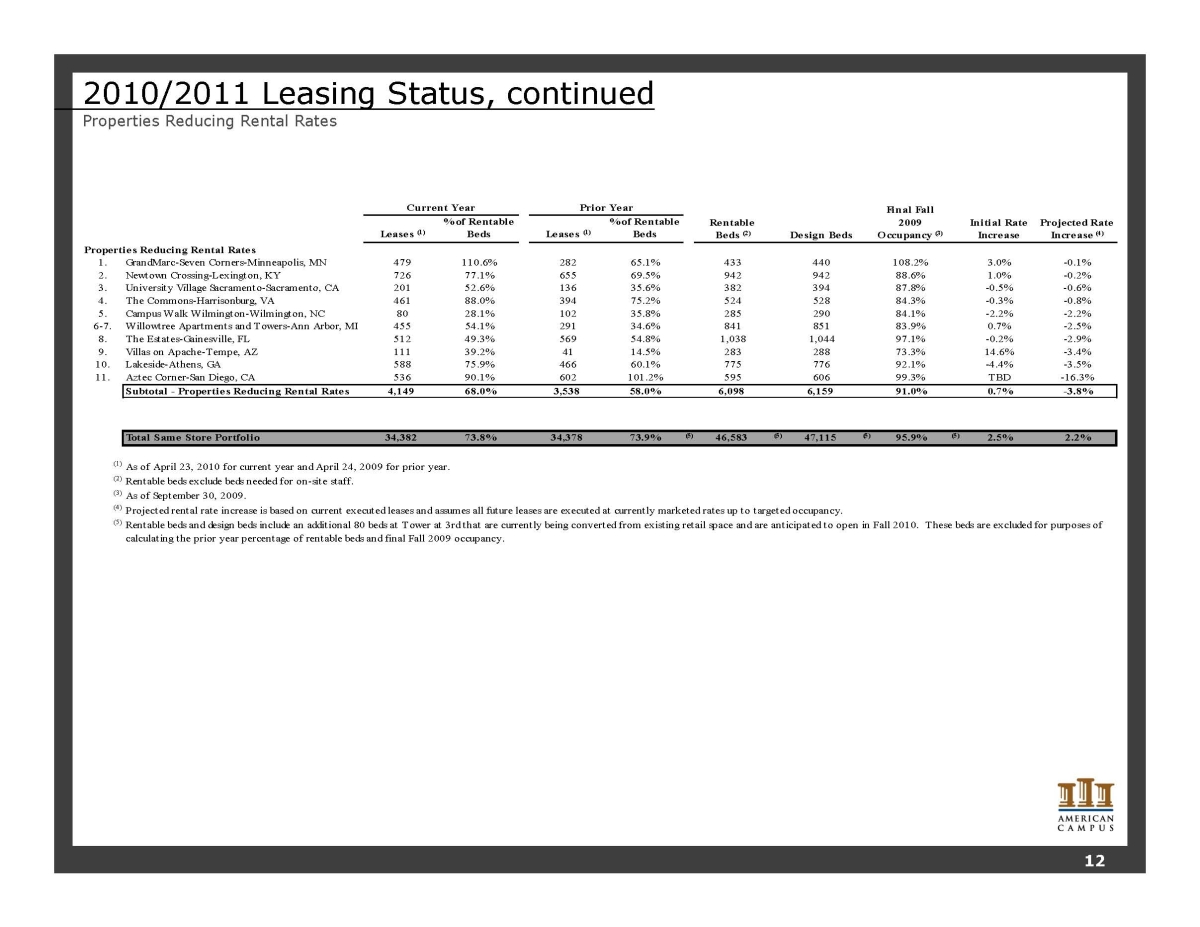
2010/2011 Leasing Status, continued Properties Reducing Rental Rates Leases (1) % of Rentable BedsLeases (1) % of Rentable BedsProperties Reducing Rental Rates1.GrandMarc-Seven Corners-Minneapolis, MN479110.6%28265.1%433440108.2%3.0%-0.1% 2.Newtown Crossing-Lexington, KY72677.1%65569.5%94294288.6%1.0%-0.2% 3.University Village Sacramento-Sacramento, CA20152.6%13635.6%38239487.8%-0.5%-0.6% 4.The Commons-Harrisonburg, VA46188.0%39475.2%52452884.3%-0.3%-0.8% 5.Campus Walk Wilmington-Wilmington, NC8028.1%10235.8%28529084.1%-2.2%-2.2% 6-7.Willowtree Apartments and Towers-Ann Arbor, MI45554.1%29134.6%84185183.9%0.7%-2.5% 8.The Estates-Gainesville, FL51249.3%56954.8%1,0381,04497.1%-0.2%-2.9% 9.Villas on Apache-Tempe, AZ11139.2%4114.5%28328873.3%14.6%-3.4% 10.Lakeside-Athens, GA58875.9%46660.1%77577692.1%-4.4%-3 .5% 11.Aztec Corner-San Diego, CA53690.1%602101.2%59560699.3%TBD-16.3% Subtotal - Properties Reducing Rental Rates4,14968.0%3,53858.0%6,0986,15991.0%70.0%-3.8% Total Same Store Portfolio34,38273.8%34,37873.9%(5)46,583(5)47,115(5)95.9%(5)2.5%2.2% (1)As of April 23, 2010 for current year and April 24, 2009 for prior year. (2)Rentable beds exclude beds needed for on-site staff. (3)As of September 30, 2009. (4)Projected rental rate increase is based on current executed leases and assumes all future leases are executed at currently marketed rates up to targeted occupancy. (5)Rentable beds and design beds include an additional 80 beds at Tower at 3rd that are currently being converted from existing retail space and are anticipated to open in Fall 2010. These beds are excluded for purposes of calculating the prior year percentage of rentable beds and final Fall 2009 occupancy. Current YearPrior YearInitial Rate IncreaseProjected Rate Increase (4) Final Fall 2009 � 0;Occupancy (3) Rentable Beds (2)Design Beds 12
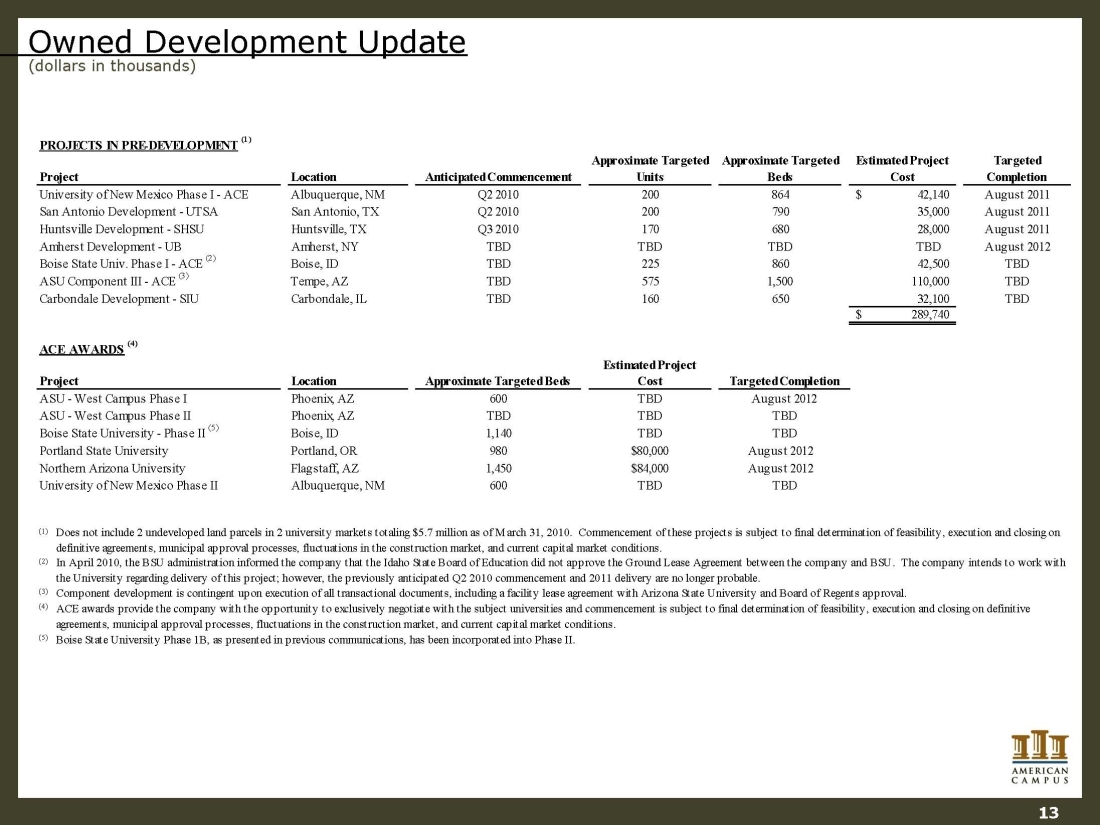
Owned Development Update (dollars in thousands) PROJECTS IN PRE-DEVELOPMENT (1) LocationAnticipated CommencementApproximate Targeted BedsEstimated Project CostTargeted CompletionUniversity of New Mexico Phase I - ACEAlbuquerque, NMQ2 201086442,140$ August 2011San Antonio Development - UTSASan Antonio, TXQ2 201079035,000 August 2011Huntsville Development - SHSUHuntsville, TXQ3 201068028,000 August 2011Amherst Development - UBAmherst, NYTBDTBD TBDAugust 2012TBD86042,500 TBDASU Component III - ACE (3)Tempe, AZTBD1,500110,000 TBDCarbondale Development - SIUCarbondale, ILTBD65032,100 TBD289,740$ ACE AWARDS (4) ProjectLocationApproximate Targeted BedsASU - West Campus Phase IPhoenix, AZ600ASU - West Campus Phase IIPhoenix, AZTBD1,140Portland State UniversityPortland, OR980Augus t 2012Northern Arizona UniversityFlagstaff, AZ1,450August 2012University of New Mexico Phase IIAlbuquerque, NM600(1) (2) (3) (4) (5) 575Does not include 2 undeveloped land parcels in 2 university markets totaling $5.7 million as of March 31, 2010. Commencement of these projects is subject to final determination of feasibility, execution and closing on definitive agreements, municipal approval processes, fluctuations in the construction market, and current capital market conditions. Boise State University - Phase II (5)Boise, IDTBDTBDApproximate Targeted UnitsBoise State Univ. Phase I - ACE (2)Boise, ID225Project200Boise State University Phase 1B, as presented in previous communications, has been incorporated into Phase II. 160Estimated Project CostTBDTargeted CompletionTBDTBDAugust 2012TBDACE awards provide the company with the opportunity to exclusively negotiate with the subject universities and commencement is subject to final determination of feasibility, execution and closing on definitive agreements, municipal approval processes, fluctuations in the construction market, and current capital market conditions. 200170$80,000Component development is contingent upon execution of all transactional documents, including a facility lease agreement with Arizona State University and Board of Regents approval. $84,000In April 2010, the BSU administration informed the company that the Idaho State Board of Education did not approve the Ground Lease Agreement between the company and BSU. The company intends to work with the University regarding delivery of this project; however, the previously anticipated Q2 2010 commencement and 2011 delivery are no longer probable. TBDTBD 13
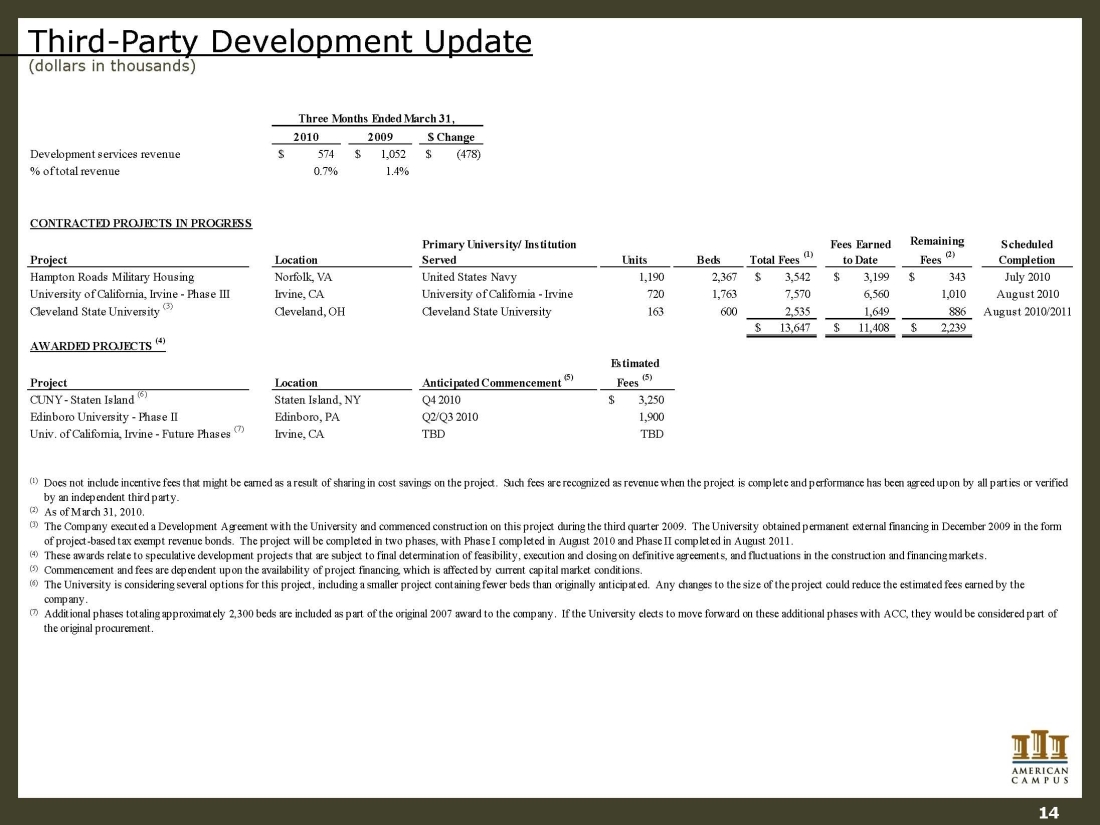
Third-Party Development Update (dollars in thousands) 14 20102009$ ChangeDevelopment services revenue574$ 1,052$ (478)$ % of total revenue0.7%1.4% CONTRACTED PROJECTS IN PROGRESSProjectUnitsBedsTotal Fees (1) Fees Earned to Date Remaining Fees (2) Scheduled CompletionHampton Roads Military Housing 1,190 2,367 3,542$ 3,199$ 343$ July 2010University of California, Irvine - Phase III Irvine, CAUniversity of California - Irvine720 1,763 7,570 6,560 1,010 August 2010Cleveland State University (3)Cleveland, OHCleveland State University163 600 2,535 1,649 886 August 2010/201113,647$ 11,408$ 2,239$ AWARDED PROJECTS (4) ProjectEstimated Fees (5) CUNY - Staten Island (6)Staten Island, NY3,250$ Edinboro University - Phase IIEdinboro, PAQ2/Q3 20101,90 0 Univ. of California, Irvine - Future Phases (7)Irvine, CATBDTBD(1) (2) As of March 31, 2010. (3) (4) (5) Commencement and fees are dependent upon the availability of project financing, which is affected by current capital market conditions. (6) (7) The Company executed a Development Agreement with the University and commenced construction on this project during the third quarter 2009. The University obtained permanent external financing in December 2009 in the form of project-based tax exempt revenue bonds. The project will be completed in two phases, with Phase I completed in August 2010 and Phase II completed in August 2011. Q4 2010The University is considering several options for this project, including a smaller project containing fewer beds than originally anticipated. Any changes to the size of the project could reduce the estimated fees earned by the company. Additional phases totaling approximately 2,300 beds are included as part of the original 2007 award to the company. If the University elects to move forward on these additional phases with ACC, they would be considered part of the original procurement. Three Months Ended March 31, LocationPrimary University/ Institution ServedThese awards relate to speculative development projects that are subject to final determination of feasibility, execution and closing on definitive agreements, and fluctuations in the construction and financing markets. Anticipated Commencement (5) Norfolk, VAUnited States NavyDoes not include incentive fees that might be earned as a result of sharing in cost savings on the project. Such fees are recognized as revenue when the project is complete and performance has been agreed upon by all parties or verified by an independent third party. Location
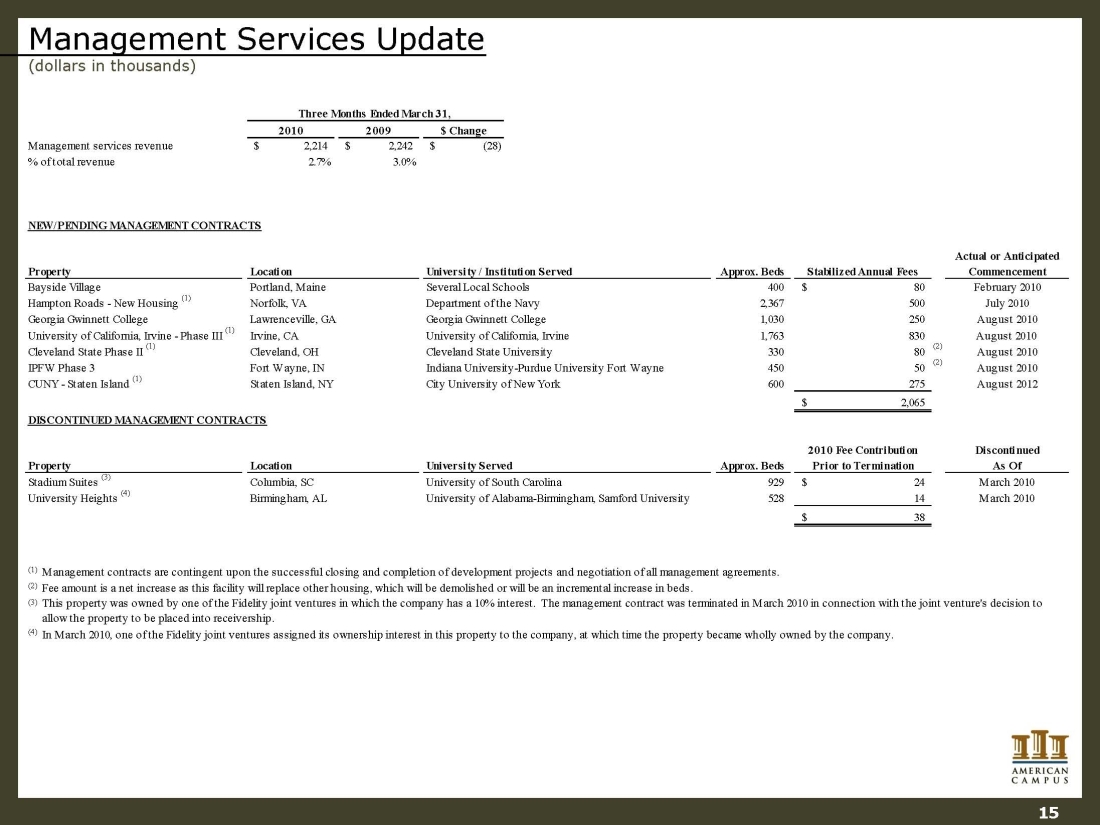
Management Services Update (dollars in thousands) 20102009$ ChangeManagement services revenue2,214$ 2,242$ (28)$ % of total revenue2.7%3.0% NEW/PENDING MANAGEMENT CONTRACTSPropertyApprox. BedsStabilized Annual FeesActual or Anticipated CommencementBayside Village Portland, MaineSeveral Local Schools400 80$ February 2010Hampton Roads - New Housing (1)Norfolk, VADepartment of the Navy2,367 500 July 2010Georgia Gwinnett CollegeLawrenceville, GAGeorgia Gwinnett College1,030 250 August 2010University of California, Irvine - Phase III (1)Irvine, CAUniversity of California, Irvine1,763 830 August 2010 Cleveland State Phase II (1)Cleveland, OHCleveland State University330 80 (2)August 2010IPFW Phase 3Fort Wayne, INIndiana University-Purdue University Fort Wayne450 50 (2)August 2010CUNY - Staten Island (1)Staten Island, NYCity University of New York600 275 August 20122,065$ DISCONTINUED MANAGEMENT CONTRACTSPropertyApprox. Beds2010 Fee Contribution Prior to TerminationDiscontinuedAs OfStadium Suites (3)Columbia, SCUniversity of South Carolina929 24$ March 2010University Heights (4)Birmingham, AL528 14 March 201038$ (1) (2) (3) (4) In March 2010, one of the Fidelity joint ventures assigned its ownership interest in this property to the company, at which time the property became wholly owned by the company. This property was owned by one of the Fidelity joint ventures in which the company has a 10% interest. The management contract was terminated in March 2010 in connection with the joint venture's decision to allow the property to be placed into receivership. University ServedUniversity of Alabama-Birmingham, Samford UniversityManagement contracts are contingent upon the successful closing and completion of development p rojects and negotiation of all management agreements. Fee amount is a net increase as this facility will replace other housing, which will be demolished or will be an incremental increase in beds. Three Months Ended March 31, LocationUniversity / Institution ServedLocation 15
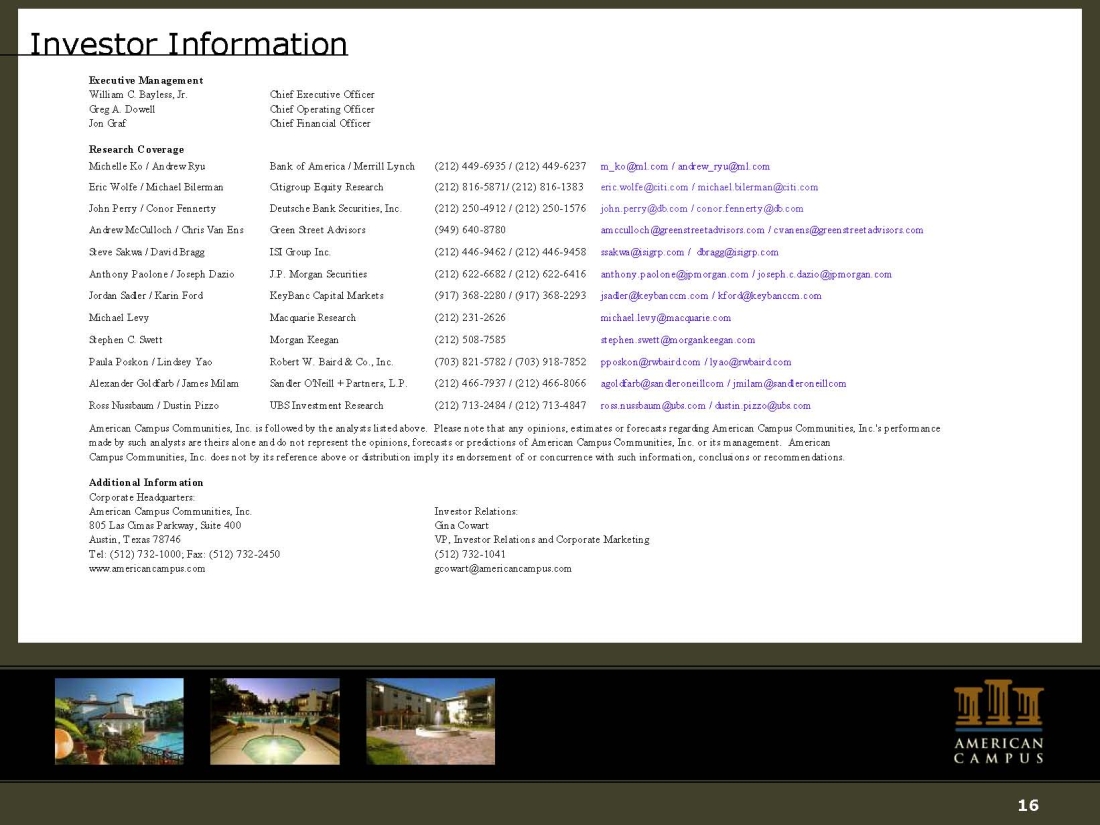
Investor Information Executive ManagementWilliam C. Bayless, Jr.Chief Executive OfficerGreg A. DowellChief Operating OfficerJon GrafChief Financial OfficerResearch CoverageMichelle Ko / Andrew RyuBank of America / Merrill Lynch(212) 449-6935 / (212) 449-6237m_ko@ml.com / andrew_ryu@ml.comEric Wolfe / Michael BilermanCitigroup Equity Research (212) 816-5871/ (212) 816-1383eric.wolfe@citi.com / michael.bilerman@citi.comJohn Perry / Conor FennertyDeutsche Bank Securities, Inc.(212) 250-4912 / (212) 250-1576john.perry@db.com / conor.fennerty@db.comAndrew McCulloch / Chris Van EnsGreen Street Advisors(949) 640-8780amcculloch@greenstreetadvisors.com / cvanens@greenstreetadvisors.comSteve Sakwa / David BraggISI Group Inc.(212) 446-9462 / (212) 446-9458ssakwa@isigrp.com / dbragg@isigrp.comAnthony Paolone / Joseph DazioJ.P. Morgan Sec urities(212) 622-6682 / (212) 622-6416anthony.paolone@jpmorgan.com / joseph.c.dazio@jpmorgan.comJordan Sadler / Karin FordKeyBanc Capital Markets(917) 368-2280 / (917) 368-2293jsadler@keybanccm.com / kford@keybanccm.comMichael Levy Macquarie Research (212) 231-2626 michael.levy@macquarie.com Stephen C. SwettMorgan Keegan(212) 508-7585stephen.swett@morgankeegan.comPaula Poskon / Lindsey YaoRobert W. Baird & Co., Inc.(703) 821-5782 / (703) 918-7852pposkon@rwbaird.com / lyao@rwbaird.comAlexander Goldfarb / James MilamSandler O'Neill + Partners, L.P.(212) 466-7937 / (212) 466-8066agoldfarb@sandleroneillcom / jmilam@sandleroneillcomRoss Nussbaum / Dustin PizzoUBS Investment Research(212) 713-2484 / (212) 713-4847ross.nussbaum@ubs.com / dustin.pizzo@ubs.comInvestor Relations: Gina CowartVP, Investor Relations and Corporate Marketing(512) 732-1041gcowart@americancampus.com 805 Las Cimas Parkway, Suite 400Austin, Texas 78746Tel: (512) 732-1000; Fax: (512) 732-2450www.americancampus.comAmeri can Campus Communities, Inc. is followed by the analysts listed above. Please note that any opinions, estimates or forecasts regarding American Campus Communities, Inc.'s performance made by such analysts are theirs alone and do not represent the opinions, forecasts or predictions of American Campus Communities, Inc. or its management. American Campus Communities, Inc. does not by its reference above or distribution imply its endorsement of or concurrence with such information, conclusions or recommendations. Additional InformationCorporate Headquarters: American Campus Communities, Inc. 16
Forward Looking Statements In addition to historical information, this supplemental package contains forward-looking statements under the federal securities law. These statements are based on current expectations, estimates and projections about the industry and markets in which American Campus operates, management's beliefs, and assumptions made by management. Forward-looking statements are not guarantees of future performance and involve certain risks and uncertainties, which are difficult to predict.