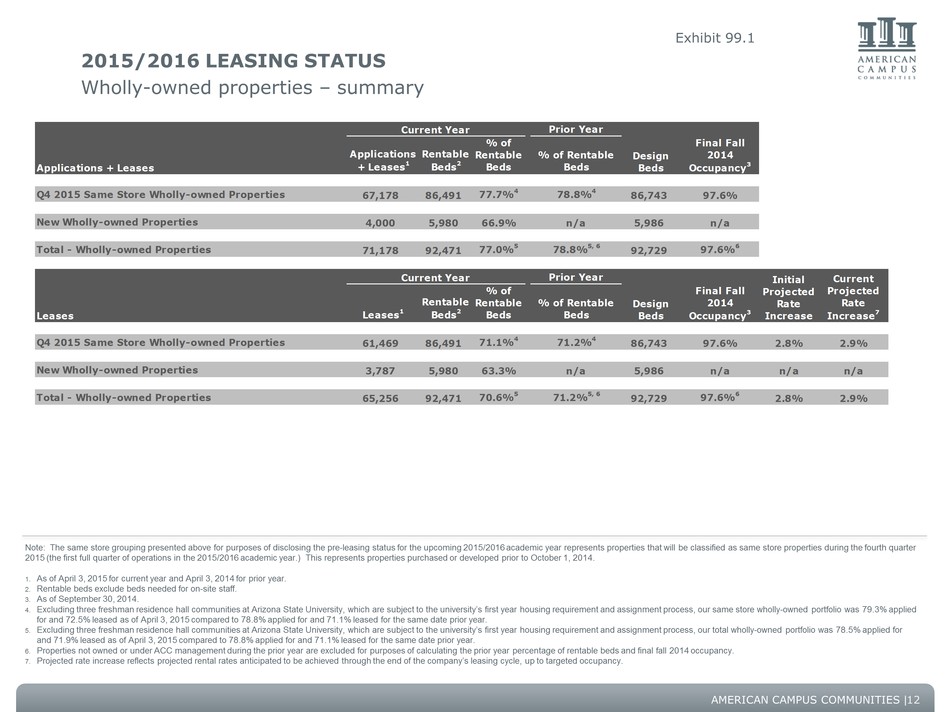
AMERICAN CAMPUS COMMUNITIES | 2015/2016 LEASING STATUS Wholly-owned properties – summary 12 Prior YearApplications + LeasesApplications + Leases1Rentable Beds2% of Rentable Beds% of Rentable BedsQ4 2015 Same Store Wholly-owned Properties 67,178 86,491 77.7% 4 78.8%4 86,743 97.6% New Wholly-owned Properties 4,0005,980 66.9% n/a 5,986 n/a Total - Wholly-owned Properties 71,1789 2,471 77.0%5 78.8%5, 6 92,729 97.6%6 Prior Year Leases Leases1Rentable Beds 2% of Rentable Beds % of Rentable Beds Q4 2015 Same Store Wholly-owned Properties 61,469 86,491 71.1%4 71.2%4 86,743 97.6% 2.8% 2.9% New Wholly-owned Properties 3,7875,980 63.3% n/a 5,986 n/a n/a n/a Total - Wholly-owned Properties 65,256 92,471 70.6%5 71.2%5, 6 92,729 97.6%6 2.8% 2.9% Current Projected Rate Increase7 Current Year Design Beds Final Fall 2014 Occupancy 3Current Year Design Beds Final Fall 2014 Occupancy 3 Initial Projected Rate Increase Note: The same store grouping presented above for purposes of disclosing the pre-leasing status for the upcoming 2015/2016 academic year represents properties that will be classified as same store properties during the fourth quarter 2015 (the first full quarter of operations in the 2015/2016 academic year.) This represents properties purchased or developed prior to October 1, 2014. As of April 3, 2015 for current year and April 3, 2014 for prior year. Rentable beds exclude beds needed for on-site staff. As of September 30, 2014. Excluding three freshman residence hall communities at Arizona State University, which are subject to the university’s first year housing requirement and assignment process, our same store wholly-owned portfolio was 79.3% applied for and 72.5% leased as of April 3, 2015 compared to 78.8% applied for and 71.1% leased for the same date prior year. Excluding three freshman residence hall communities at Arizona State University, which are subject to the university’s first year housing requirement and assignment process, our total wholly-owned portfolio was 78.5% applied for and 71.9% leased as of April 3, 2015 compared to 78.8% applied for and 71.1% leased for the same date prior year. Properties not owned or under ACC management during the prior year are excluded for purposes of calculating the prior year percentage of rentable beds and final fall 2014 occupancy. Projected rate increase reflects projected rental rates anticipated to be achieved through the end of the company’s leasing cycle, up to targeted occupancy. Exhibit 99.1