T-Mobile US Q3 2013
Disclaimer This presentation contains “forward-looking” statements within the meaning of the U.S. federal securities laws. For those statements, we claim the protection of the safe harbor for forward-looking statements contained in the Private Securities Litigation Reform Act of 1995. Any statements made herein that are not statements of historical fact, including statements about T-Mobile US, Inc.'s plans, outlook, beliefs, opinions, projections, guidance, strategy, integration of MetroPCS, expected network modernization and other advancements, are forward-looking statements. Generally, forward-looking statements may be identified by words such as "anticipate," "expect," "suggests," "plan," “project,” "believe," "intend," "estimates," "targets," "views," "may," "will," "forecast," and other similar expressions. The forward-looking statements speak only as of the date made, are based on current assumptions and expectations, and involve a number of risks and uncertainties. Important factors that could affect future results and cause those results to differ materially from those expressed in the forward-looking statements include, among others, the following: our ability to compete in the highly competitive U.S. wireless telecommunications industry; adverse conditions in the U.S. and international economies and markets; significant capital commitments and the capital expenditures required to effect our business plan; our ability to adapt to future changes in technology, enhance existing offerings, and introduce new offerings to address customers' changing demands; changes in legal and regulatory requirements, including any change or increase in restrictions on our ability to operate our network; our ability to successfully maintain and improve our network, and the possibility of incurring additional costs in doing so; major equipment failures; severe weather conditions or other force majeure events; and other risks described in our filings with the Securities and Exchange Commission, including those described in our Quarterly Report on Form 10-Q filed with the Securities and Exchange Commission on August 8, 2013. You should not place undue reliance on these forward-looking statements. We do not undertake to update forward-looking statements, whether as a result of new information, future events or otherwise, except as required by law. As required by SEC rules, we have provided a reconciliation of the non-GAAP financial measures included in this presentation to the most directly comparable GAAP measures in materials on our website at http://investor.t-mobile.com. 2
Agenda Financial results Operating highlights and key initiatives Q&A Braxton Carter, CFO John Legere, President and CEO 3
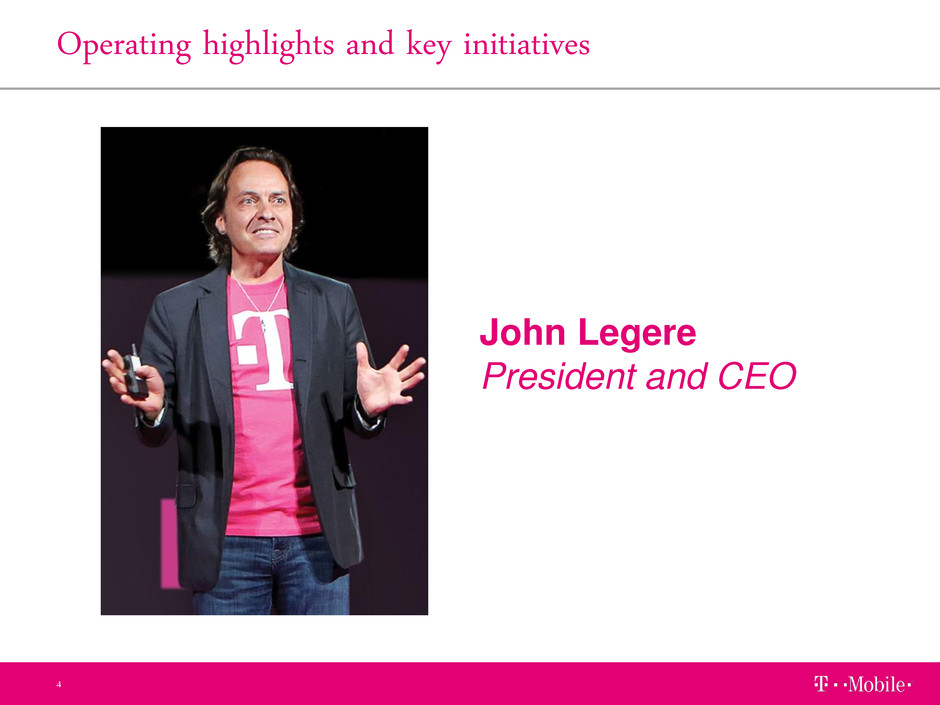
Operating highlights and key initiatives John Legere President and CEO 4
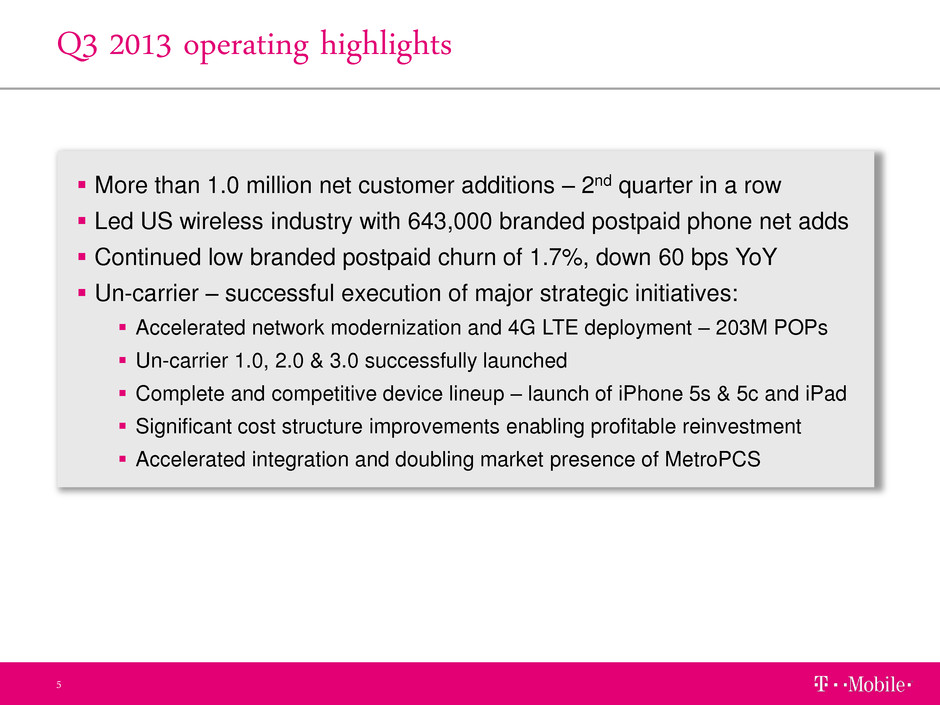
Q3 2013 operating highlights 5 More than 1.0 million net customer additions – 2nd quarter in a row Led US wireless industry with 643,000 branded postpaid phone net adds Continued low branded postpaid churn of 1.7%, down 60 bps YoY Un-carrier – successful execution of major strategic initiatives: Accelerated network modernization and 4G LTE deployment – 203M POPs Un-carrier 1.0, 2.0 & 3.0 successfully launched Complete and competitive device lineup – launch of iPhone 5s & 5c and iPad Significant cost structure improvements enabling profitable reinvestment Accelerated integration and doubling market presence of MetroPCS
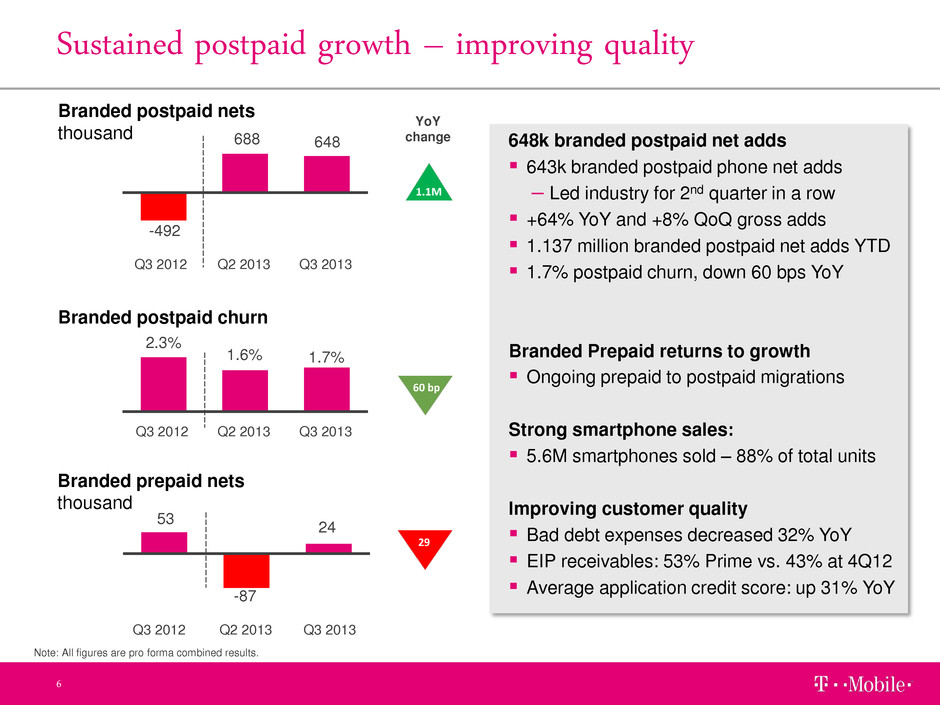
Sustained postpaid growth – improving quality 6 -492 688 648 Q3 2013 Q2 2013 Q3 2012 Branded postpaid nets thousand 648k branded postpaid net adds 643k branded postpaid phone net adds – Led industry for 2nd quarter in a row +64% YoY and +8% QoQ gross adds 1.137 million branded postpaid net adds YTD 1.7% postpaid churn, down 60 bps YoY Branded Prepaid returns to growth Ongoing prepaid to postpaid migrations Strong smartphone sales: 5.6M smartphones sold – 88% of total units Improving customer quality Bad debt expenses decreased 32% YoY EIP receivables: 53% Prime vs. 43% at 4Q12 Average application credit score: up 31% YoY 2.3% 1.6% 1.7% Q3 2012 Q3 2013 Q2 2013 Branded postpaid churn 53 -87 24 Q3 2013 Q2 2013 Q3 2012 Branded prepaid nets thousand YoY change 60 bp 29 Note: All figures are pro forma combined results.
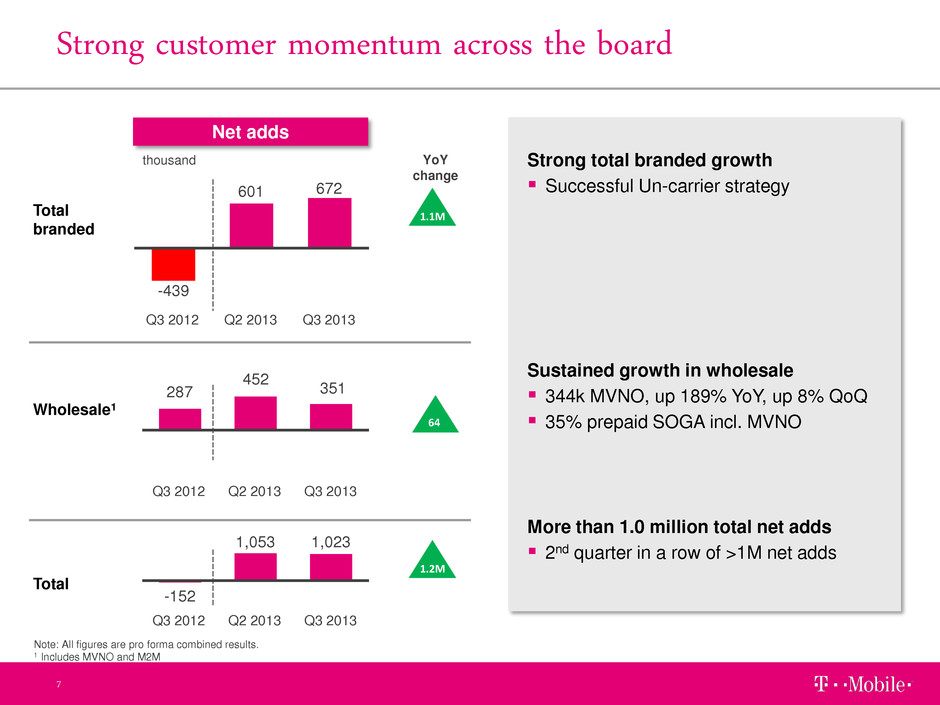
Net adds Strong customer momentum across the board 7 -439 601 672 Q3 2013 Q2 2013 Q3 2012 Total branded Wholesale1 Total 287 452 351 Q3 2013 Q2 2013 Q3 2012 thousand Strong total branded growth Successful Un-carrier strategy Sustained growth in wholesale 344k MVNO, up 189% YoY, up 8% QoQ 35% prepaid SOGA incl. MVNO More than 1.0 million total net adds 2nd quarter in a row of >1M net adds -152 1,053 1,023 Q3 2012 Q2 2013 Q3 2013 Note: All figures are pro forma combined results. 1 Includes MVNO and M2M YoY change 1.1M 1.2M 64
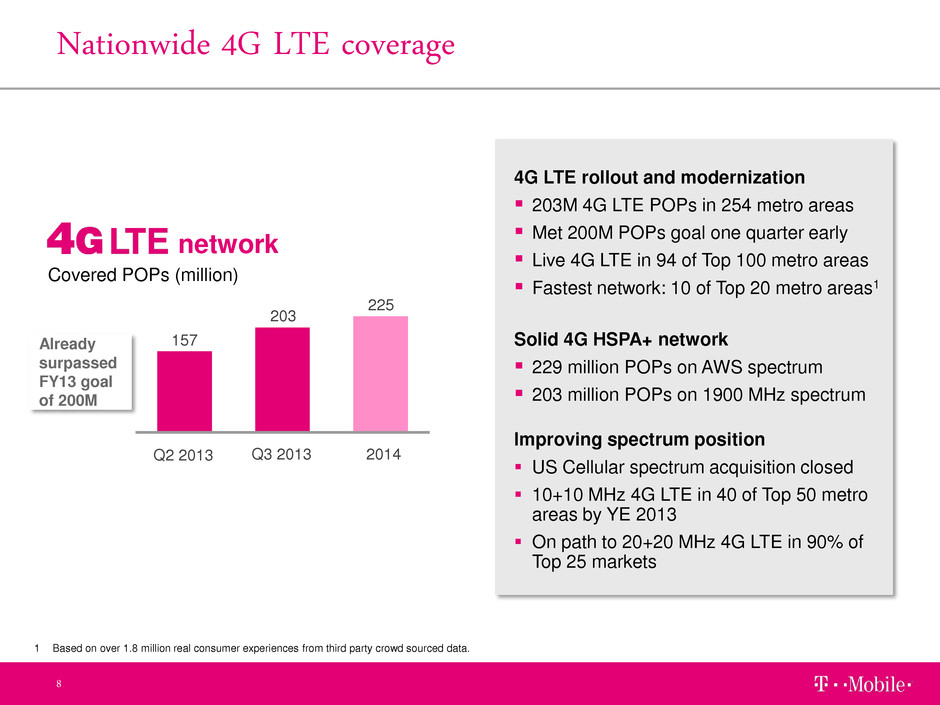
Nationwide 4G LTE coverage 8 4G LTE rollout and modernization 203M 4G LTE POPs in 254 metro areas Met 200M POPs goal one quarter early Live 4G LTE in 94 of Top 100 metro areas Fastest network: 10 of Top 20 metro areas1 Solid 4G HSPA+ network 229 million POPs on AWS spectrum 203 million POPs on 1900 MHz spectrum Improving spectrum position US Cellular spectrum acquisition closed 10+10 MHz 4G LTE in 40 of Top 50 metro areas by YE 2013 On path to 20+20 MHz 4G LTE in 90% of Top 25 markets 157 203 225 Q2 2013 Q3 2013 2014 Covered POPs (million) Already surpassed FY13 goal of 200M network 1 Based on over 1.8 million real consumer experiences from third party crowd sourced data.
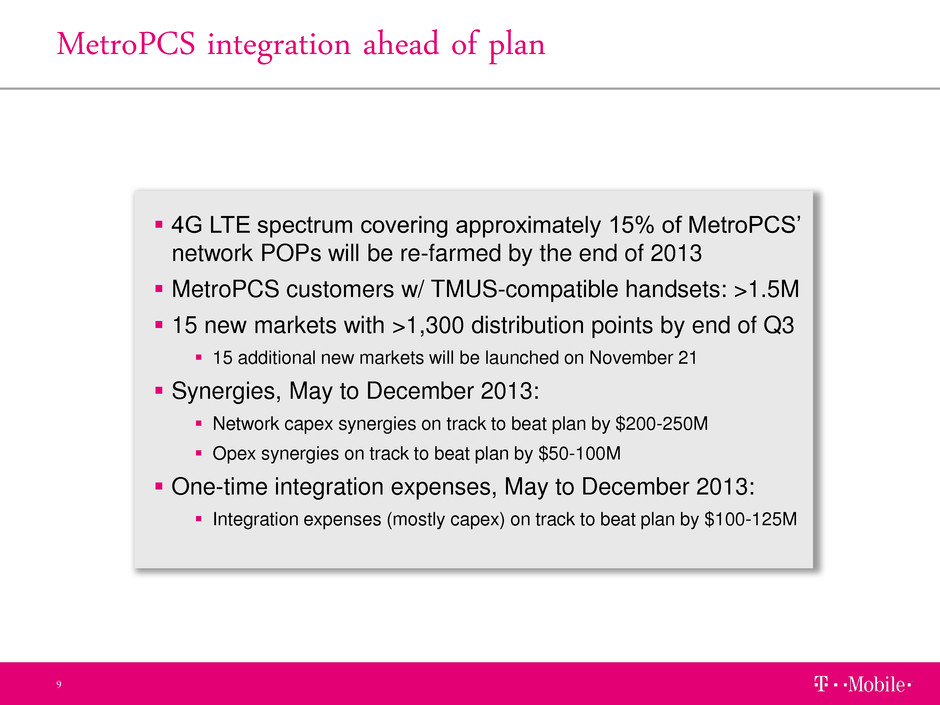
MetroPCS integration ahead of plan 9 4G LTE spectrum covering approximately 15% of MetroPCS’ network POPs will be re-farmed by the end of 2013 MetroPCS customers w/ TMUS-compatible handsets: >1.5M 15 new markets with >1,300 distribution points by end of Q3 15 additional new markets will be launched on November 21 Synergies, May to December 2013: Network capex synergies on track to beat plan by $200-250M Opex synergies on track to beat plan by $50-100M One-time integration expenses, May to December 2013: Integration expenses (mostly capex) on track to beat plan by $100-125M
Financial results 10 Braxton Carter CFO
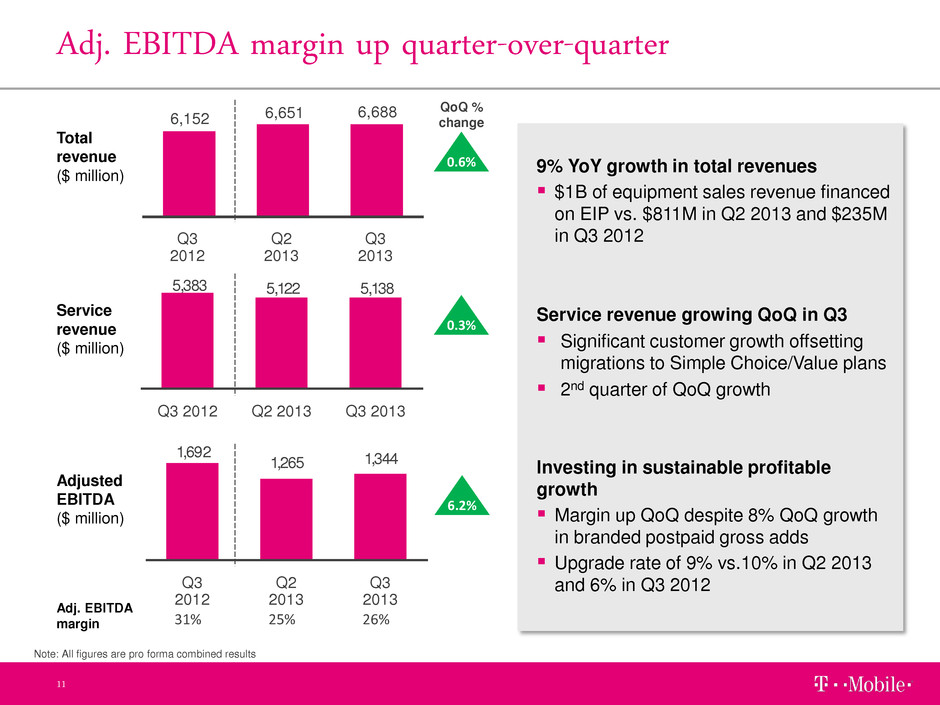
Note: All figures are pro forma combined results 5,1385,1225,383 Q3 2013 Q2 2013 Q3 2012 Adj. EBITDA margin up quarter-over-quarter 11 Total revenue ($ million) Service revenue ($ million) Adjusted EBITDA ($ million) 31% 25% 26% Adj. EBITDA margin 9% YoY growth in total revenues $1B of equipment sales revenue financed on EIP vs. $811M in Q2 2013 and $235M in Q3 201 Service revenue growing QoQ in Q3 Significant customer growth offsetting migrations to Simple Choice/Value plans 2nd quarter of QoQ growth Investing in sustainable profitable growth Margin up QoQ despite 8% QoQ growth in branded postpaid gross adds Upgrade rate of 9% vs.10% in Q2 2013 and 6% in Q3 2012 6,152 6,651 6,688 Q3 2013 Q2 2013 Q3 2012 1,3441,265 1,692 Q3 2013 Q2 2013 Q3 2012 QoQ % change 0.6% 0.3% 6.2%
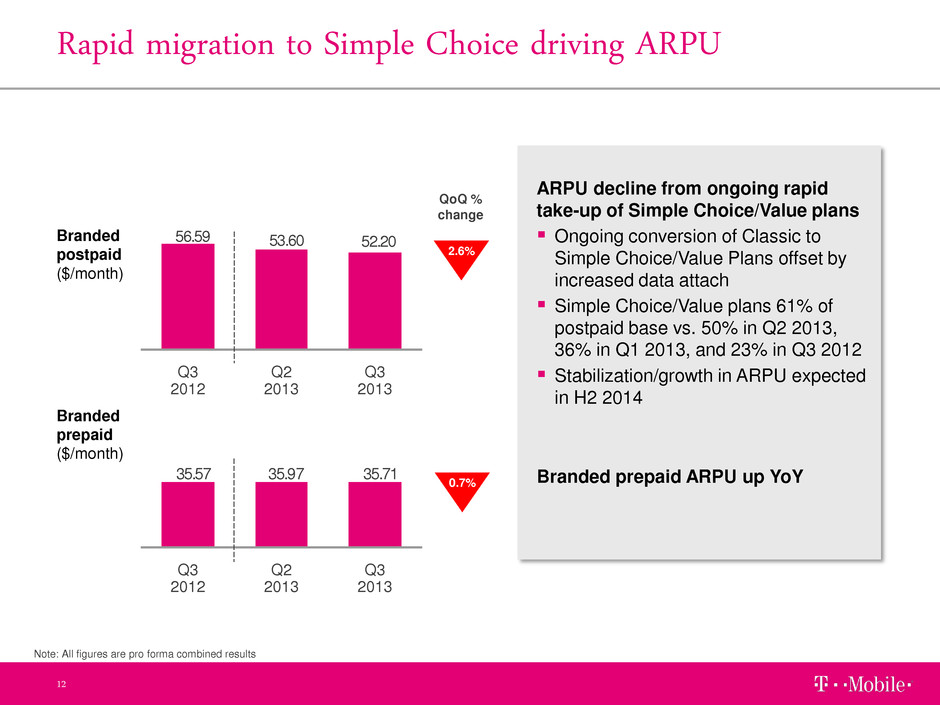
Rapid migration to Simple Choice driving ARPU 12 ARPU decline from ongoing rapid take-up of Simple Choice/Value plans Ongoing conversion of Classic to Simple Choice/Value Plans offset by increased data attach Simple Choice/Value plans 61% of postpaid base vs. 50% in Q2 2013, 36% in Q1 2013, and 23% in Q3 2012 Stabilization/growth in ARPU expected in H2 2014 Branded prepaid ARPU up YoY Branded postpaid ($/month) Branded prepaid ($/month) QoQ % change 2.6% 35.7135.9735.57 Q3 2013 Q3 2012 Q2 2013 52.2053.6056.59 Q3 2013 Q3 2012 Q2 2013 Note: All figures are pro forma combined results 0.7%
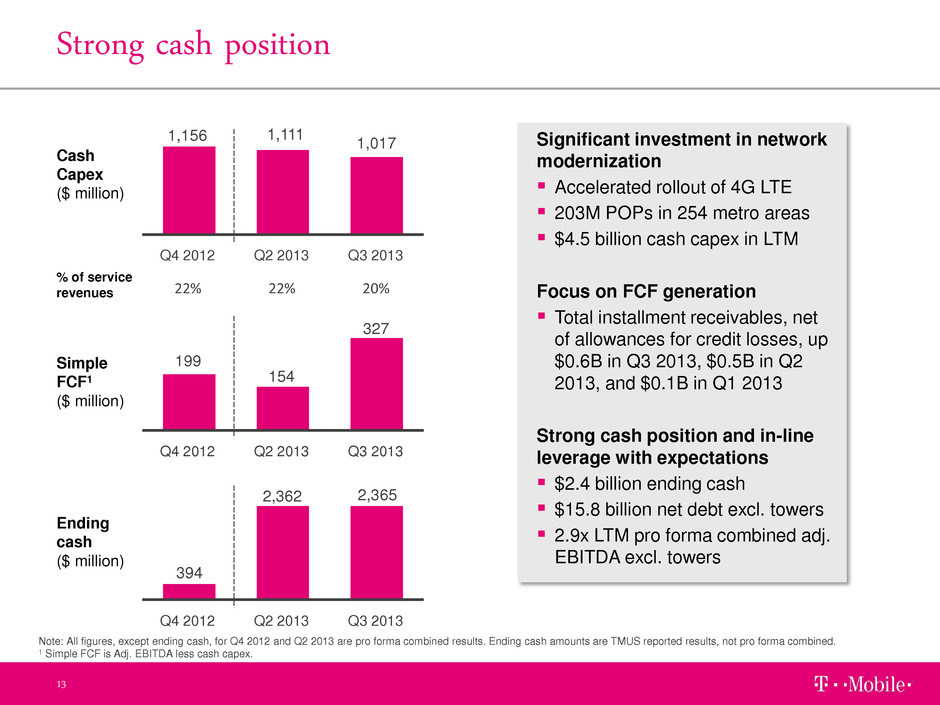
394 2,362 2,365 Q3 2013 Q2 2013 Q4 2012 Strong cash position 13 Cash Capex ($ million) Ending cash ($ million) Simple FCF1 ($ million) Significant investment in network modernization Accelerated rollout of 4G LTE 203M POPs in 254 metro areas $4.5 billion cash capex in LTM Focus on FCF generation Total installment receivables, net of allowances for credit losses, up $0.6B in Q3 2013, $0.5B in Q2 2013, and $0.1B in Q1 2013 Strong cash position and in-line leverage with expectations $2.4 billion ending cash $15.8 billion net debt excl. towers 2.9x LTM pro forma combined adj. EBITDA excl. towers 1,156 1,111 1,017 Q4 2012 Q2 2013 Q3 2013 199 154 327 Q3 2013 Q2 2013 Q4 2012 Note: All figures, except ending cash, for Q4 2012 and Q2 2013 are pro forma combined results. Ending cash amounts are TMUS reported results, not pro forma combined. 1 Simple FCF is Adj. EBITDA less cash capex. 22% 22% 20% % of service revenues

Guidance for 2013 14 2013 Outlook Guidance Adjusted EBITDA pro forma combined ($ billion)1 Cash capex pro forma combined ($ billion)1 Branded postpaid net adds (million) 5.2 – 5.4 4.2 – 4.4 1.6 – 1.8 Penetration of Simple Choice/Value plans in branded postpaid base 65% – 75% 1 Pro forma combined includes MetroPCS results for the full year. reaffirmed reaffirmed increased from 1.0 – 1.2 increased from 60%–70%
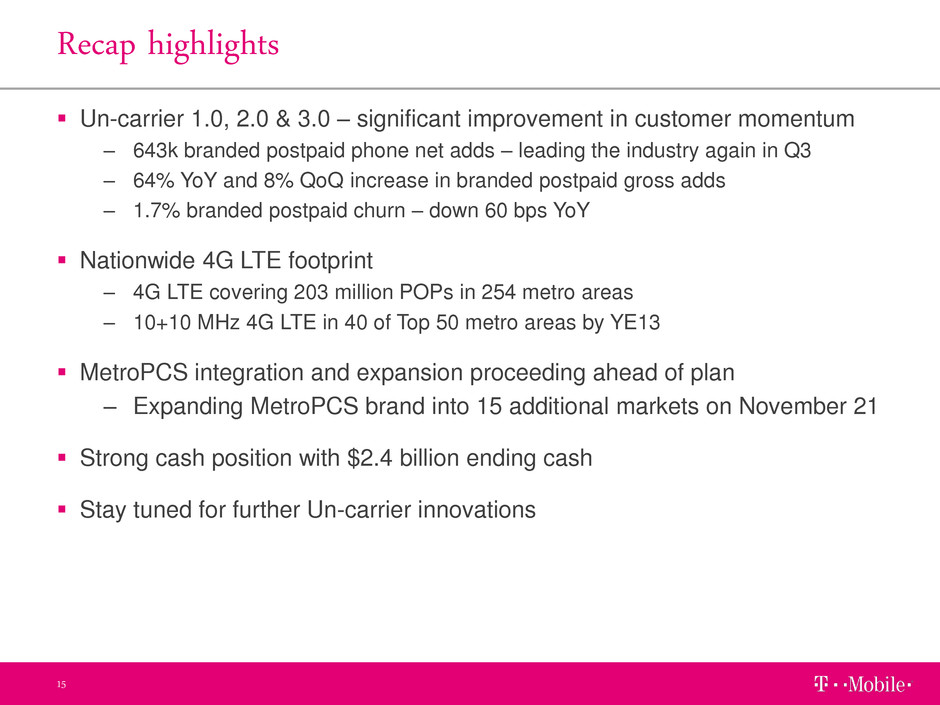
Recap highlights 15 Un-carrier 1.0, 2.0 & 3.0 – significant improvement in customer momentum – 643k branded postpaid phone net adds – leading the industry again in Q3 – 64% YoY and 8% QoQ increase in branded postpaid gross adds – 1.7% branded postpaid churn – down 60 bps YoY Nationwide 4G LTE footprint – 4G LTE covering 203 million POPs in 254 metro areas – 10+10 MHz 4G LTE in 40 of Top 50 metro areas by YE13 MetroPCS integration and expansion proceeding ahead of plan – Expanding MetroPCS brand into 15 additional markets on November 21 Strong cash position with $2.4 billion ending cash Stay tuned for further Un-carrier innovations


