T-Mobile US Q4 and Full Year 2013
Disclaimer This presentation contains “forward-looking” statements within the meaning of the U.S. federal securities laws. For those statements, we claim the protection of the safe harbor for forward-looking statements contained in the Private Securities Litigation Reform Act of 1995. Any statements made herein that are not statements of historical fact, including statements about T-Mobile US, Inc.'s plans, outlook, beliefs, opinions, projections, guidance, strategy, integration of MetroPCS, expected network modernization and other advancements, are forward-looking statements. Generally, forward-looking statements may be identified by words such as "anticipate," "expect," "suggests," "plan," “project,” "believe," "intend," "estimates," "targets," "views," "may," "will," "forecast," and other similar expressions. The forward-looking statements speak only as of the date made, are based on current assumptions and expectations, and involve a number of risks and uncertainties. Important factors that could affect future results and cause those results to differ materially from those expressed in the forward-looking statements include, among others, the following: our ability to compete in the highly competitive U.S. wireless telecommunications industry; adverse conditions in the U.S. and international economies and markets; significant capital commitments and the capital expenditures required to effect our business plan; our ability to adapt to future changes in technology, enhance existing offerings, and introduce new offerings to address customers' changing demands; changes in legal and regulatory requirements, including any change or increase in restrictions on our ability to operate our network; our ability to successfully maintain and improve our network, and the possibility of incurring additional costs in doing so; major equipment failures; severe weather conditions or other force majeure events; and other risks described in our filings with the Securities and Exchange Commission, including those described in our Annual Report on Form 10-K filed with the Securities and Exchange Commission on February 25, 2014. You should not place undue reliance on these forward-looking statements. We do not undertake to update forward-looking statements, whether as a result of new information, future events or otherwise, except as required by law. As required by SEC rules, we have provided a reconciliation of the non-GAAP financial measures included in this presentation to the most directly comparable GAAP measures in materials on our website at http://investor.t- mobile.com. 2
Agenda Financial Results Operating Highlights and Key Initiatives Q&A Braxton Carter, CFO John Legere, President and CEO 3 TMUS Management Team
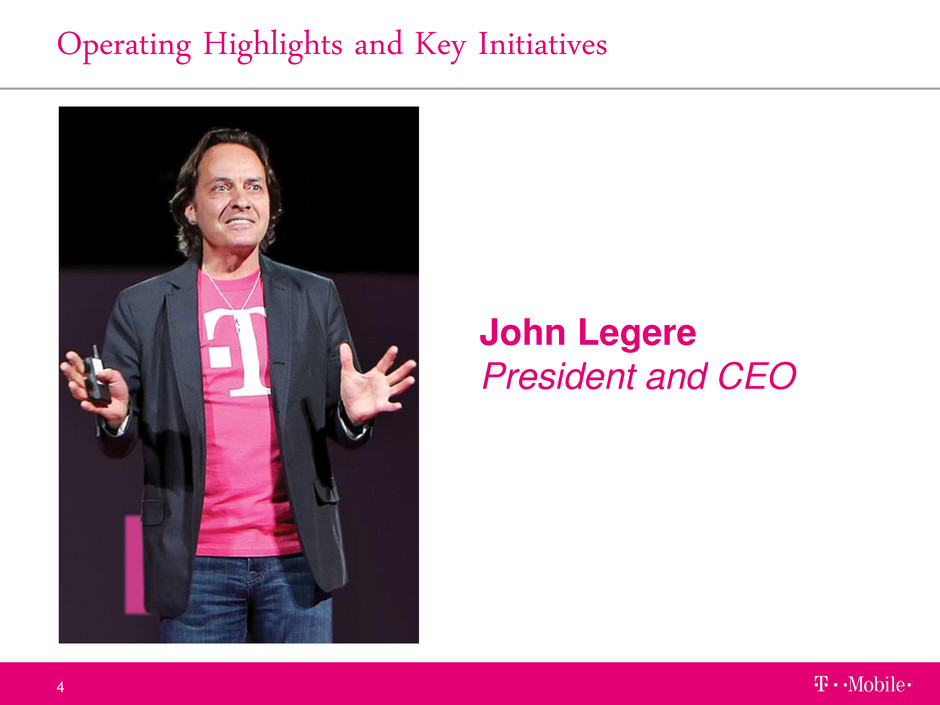
Operating Highlights and Key Initiatives John Legere President and CEO 4
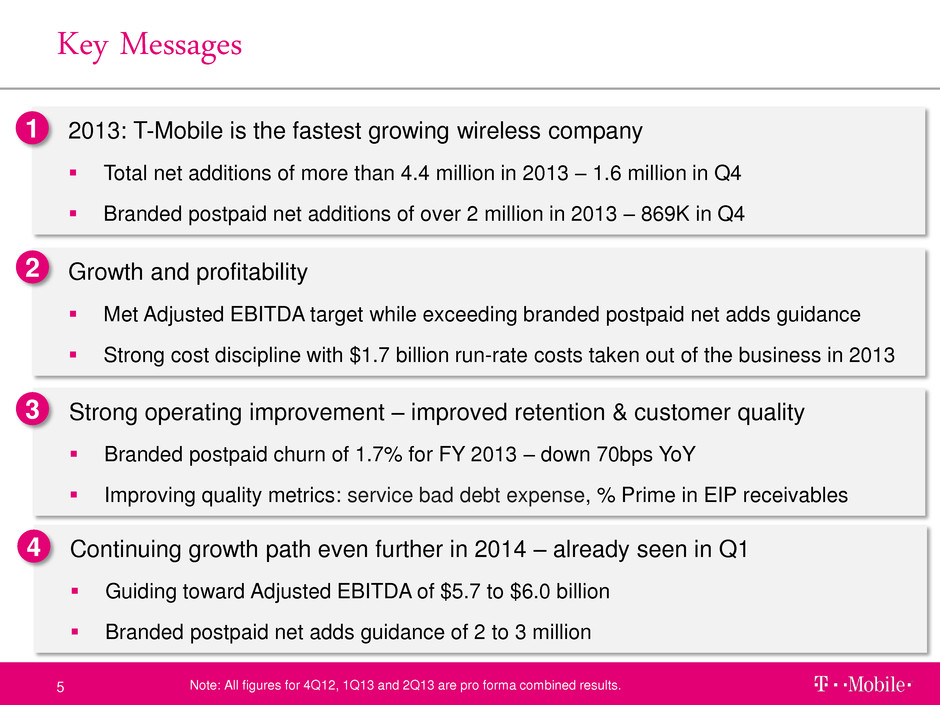
Growth and profitability Met Adjusted EBITDA target while exceeding branded postpaid net adds guidance Strong cost discipline with $1.7 billion run-rate costs taken out of the business in 2013 Key Messages 5 2013: T-Mobile is the fastest growing wireless company Total net additions of more than 4.4 million in 2013 – 1.6 million in Q4 Branded postpaid net additions of over 2 million in 2013 – 869K in Q4 1 Strong operating improvement – improved retention & customer quality Branded postpaid churn of 1.7% for FY 2013 – down 70bps YoY Improving quality metrics: service bad debt expense, % Prime in EIP receivables 2 3 Continuing growth path even further in 2014 – already seen in Q1 Guiding toward Adjusted EBITDA of $5.7 to $6.0 billion Branded postpaid net adds guidance of 2 to 3 million 4 Note: All figures for 4Q12, 1Q13 and 2Q13 are pro forma combined results.

UN-CARRIER 1.0 – SIMPLE CHOICE MARCH 26 Transformational Year of Growth as Un-carrier APPLE iPHONE LAUNCHED APRIL12 CLOSED METROPCS DEAL – TMUS LISTED ON NYSE APRIL 30 / MAY 1 UN-CARRIER 2.0 – JUMP! AND SIMPLE CHOICE FOR FAMILY JULY 10 UN-CARRIER 3.0, PART I – SIMPLE GLOBAL OCT 9 ANNOUNCED VERIZON A-BLOCK TRANSACTION JAN 6 UN-CARRIER 4.0 – CONTRACT FREEDOM JAN 8 FASTEST NATIONWIDE 4G LTE NETWORK JAN 8 UN-CARRIER 3.0, PART II – TABLETS UN-LEASHED OCT 23 Path to Growth 6
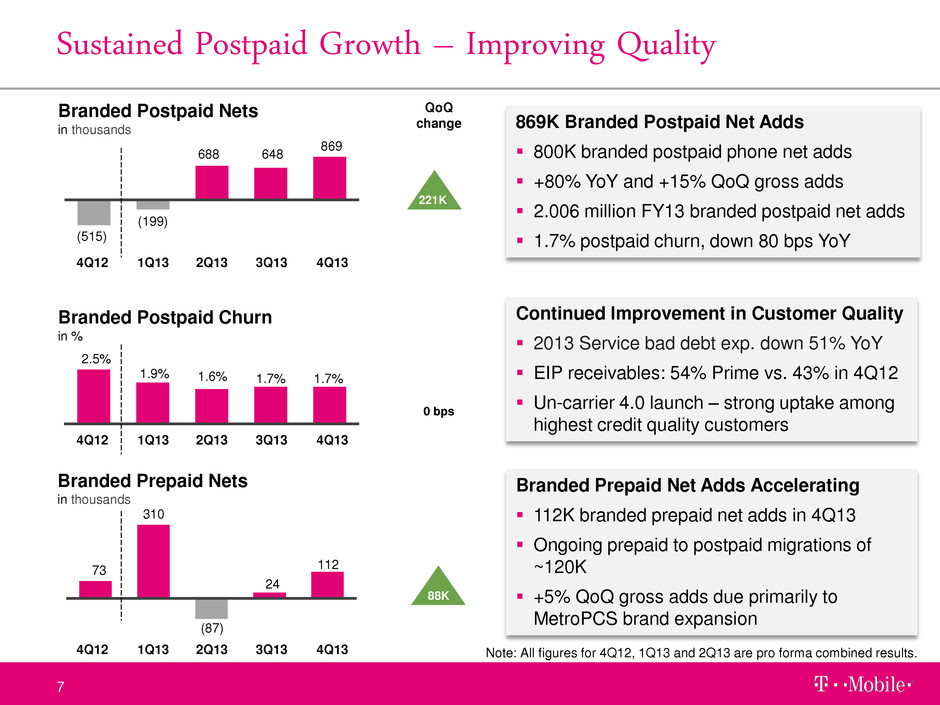
Continued Improvement in Customer Quality 2013 Service bad debt exp. down 51% YoY EIP receivables: 54% Prime vs. 43% in 4Q12 Un-carrier 4.0 launch – strong uptake among highest credit quality customers Branded Prepaid Net Adds Accelerating 112K branded prepaid net adds in 4Q13 Ongoing prepaid to postpaid migrations of ~120K +5% QoQ gross adds due primarily to MetroPCS brand expansion 869K Branded Postpaid Net Adds 800K branded postpaid phone net adds +80% YoY and +15% QoQ gross adds 2.006 million FY13 branded postpaid net adds 1.7% postpaid churn, down 80 bps YoY 4Q12 1Q13 2Q13 3Q13 4Q13 Sustained Postpaid Growth – Improving Quality 7 (515) (199) 688 648 869 Branded Postpaid Nets in thousands 2.5% 1.9% 1.6% 1.7% 1.7% Branded Postpaid Churn in % 73 24 112 Branded Prepaid Nets in thousands QoQ change 0 bps 4Q12 1Q13 2Q13 3Q13 4Q13 221K 4Q12 1Q13 2Q13 3Q13 4Q13 310 88K (87) Note: All figures for 4Q12, 1Q13 and 2Q13 are pro forma combined results.
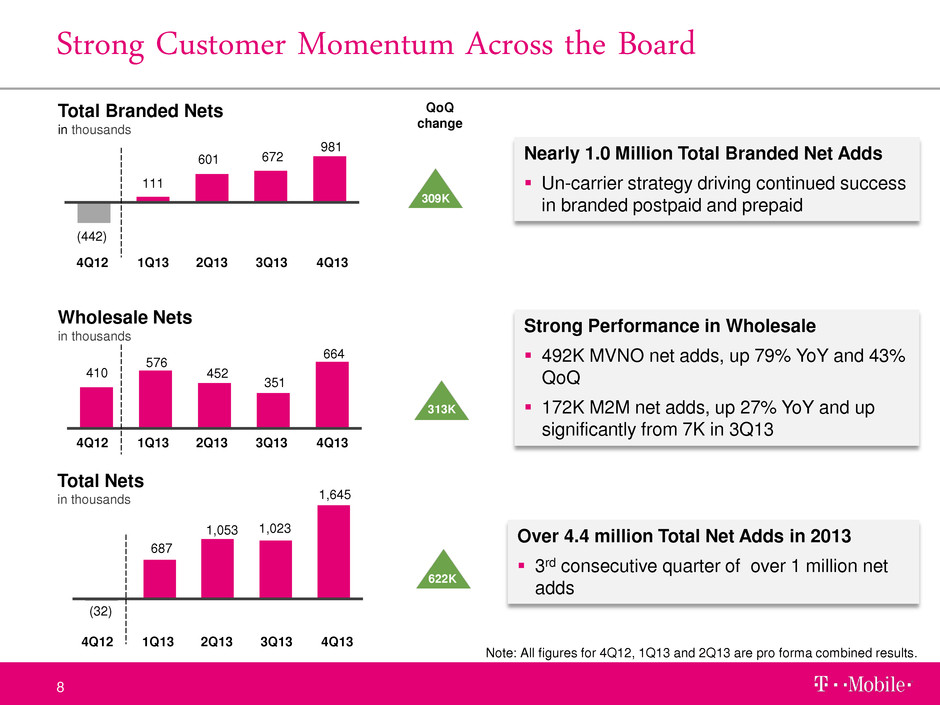
Over 4.4 million Total Net Adds in 2013 3rd consecutive quarter of over 1 million net adds (32) 410 576 452 351 664 Nearly 1.0 Million Total Branded Net Adds Un-carrier strategy driving continued success in branded postpaid and prepaid 4Q12 1Q13 2Q13 3Q13 4Q13 Strong Customer Momentum Across the Board 8 (442) 111 601 672 981 Total Branded Nets in thousands Wholesale Nets in thousands 687 1,053 1,023 Total Nets in thousands QoQ change 313K 4Q12 1Q13 2Q13 3Q13 4Q13 309K 4Q12 1Q13 2Q13 3Q13 4Q13 622K Strong Performance in Wholesale 492K MVNO net adds, up 79% YoY and 43% QoQ 172K M2M net adds, up 27% YoY and up significantly from 7K in 3Q13 1,645 Note: All figures for 4Q12, 1Q13 and 2Q13 are pro forma combined results.

1 According to our independent analysis of the NetMetrics reports provided by Speedtest.net. Strategic 700 A-Block Transaction Announced 158M POPs covered including existing Boston license 9 of Top 10 and 21 of Top 30 metro areas 70% of existing TMUS customer base Deployment planned to start in 2014 after closing Rapid Expansion of 4G LTE 209M 4G LTE POPs in 273 metro areas Live 4G LTE in 95 of Top 100 metro areas 250M+ POPs targeted in 2014 Fastest 4G LTE Network in the United States 9 700MHz A-Block License Areas 4G LTE Covered POPs (M) 209 2012 2013 2014 250+ 0 Fastest 4G LTE Network in the US1 10+10MHz 4G LTE in 43 of Top 50 metro areas Live 20+20MHz 4G LTE in Dallas Continued planned rollout of 20+20MHz 4G LTE in 2014
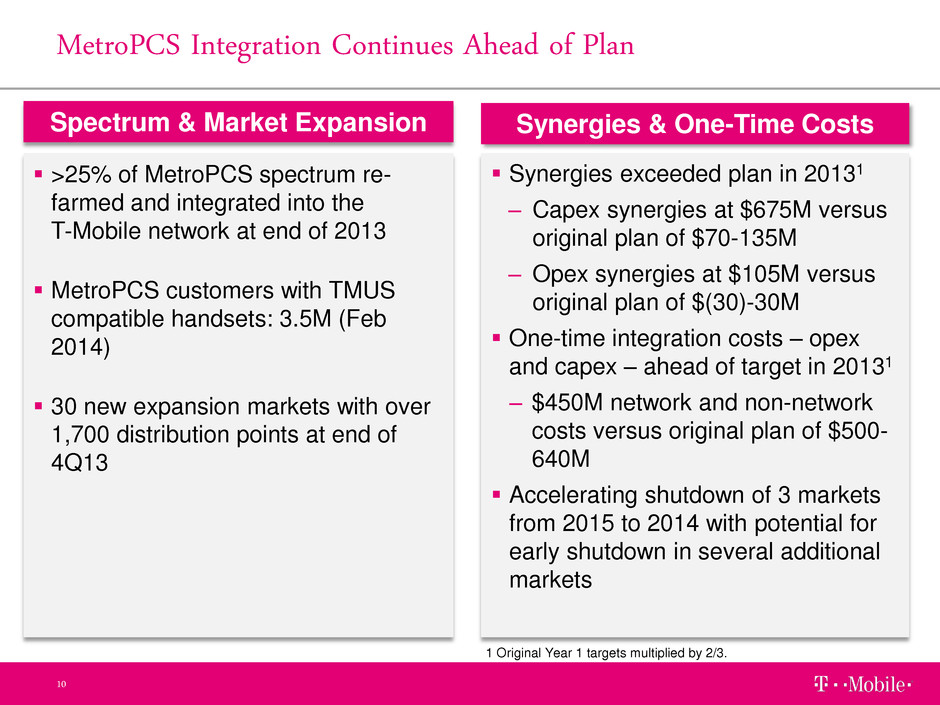
Synergies exceeded plan in 20131 – Capex synergies at $675M versus original plan of $70-135M – Opex synergies at $105M versus original plan of $(30)-30M One-time integration costs – opex and capex – ahead of target in 20131 ‒ $450M network and non-network costs versus original plan of $500- 640M Accelerating shutdown of 3 markets from 2015 to 2014 with potential for early shutdown in several additional markets >25% of MetroPCS spectrum re- farmed and integrated into the T-Mobile network at end of 2013 MetroPCS customers with TMUS compatible handsets: 3.5M (Feb 2014) 30 new expansion markets with over 1,700 distribution points at end of 4Q13 MetroPCS Integration Continues Ahead of Plan 10 Spectrum & Market Expansion Synergies & One-Time Costs 1 Original Year 1 targets multiplied by 2/3.

Financial Results 11 Braxton Carter CFO
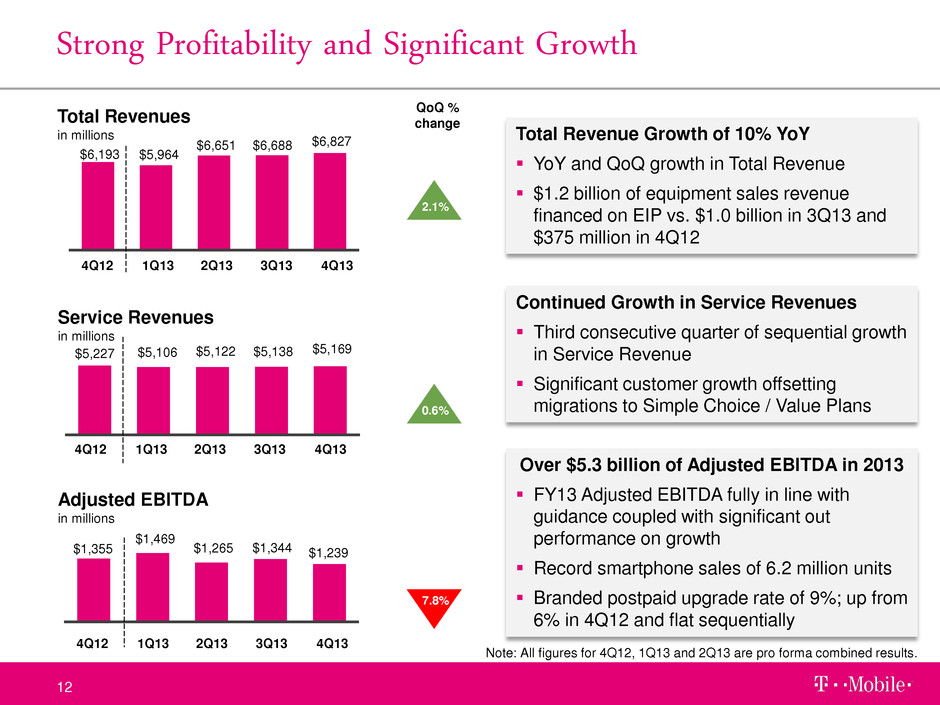
Over $5.3 billion of Adjusted EBITDA in 2013 FY13 Adjusted EBITDA fully in line with guidance coupled with significant out performance on growth Record smartphone sales of 6.2 million units Branded postpaid upgrade rate of 9%; up from 6% in 4Q12 and flat sequentially Total Revenue Growth of 10% YoY YoY and QoQ growth in Total Revenue $1.2 billion of equipment sales revenue financed on EIP vs. $1.0 billion in 3Q13 and $375 million in 4Q12 $5,106 $5,122 $5,138 $5,169 4Q12 1Q13 2Q13 3Q13 4Q13 Strong Profitability and Significant Growth 12 Service Revenues in millions $6,193 $5,964 Total Revenues in millions 4Q12 1Q13 2Q13 3Q13 4Q13 2.1% Continued Growth in Service Revenues Third consecutive quarter of sequential growth in Service Revenue Significant customer growth offsetting migrations to Simple Choice / Value Plans $6,651 $6,688 $6,827 QoQ % change $1,355 $1,469 $1,265 $1,344 $1,239 Adjusted EBITDA in millions 4Q12 1Q13 2Q13 3Q13 4Q13 7.8% 0.6% $5,227 Note: All figures for 4Q12, 1Q13 and 2Q13 are pro forma combined results.
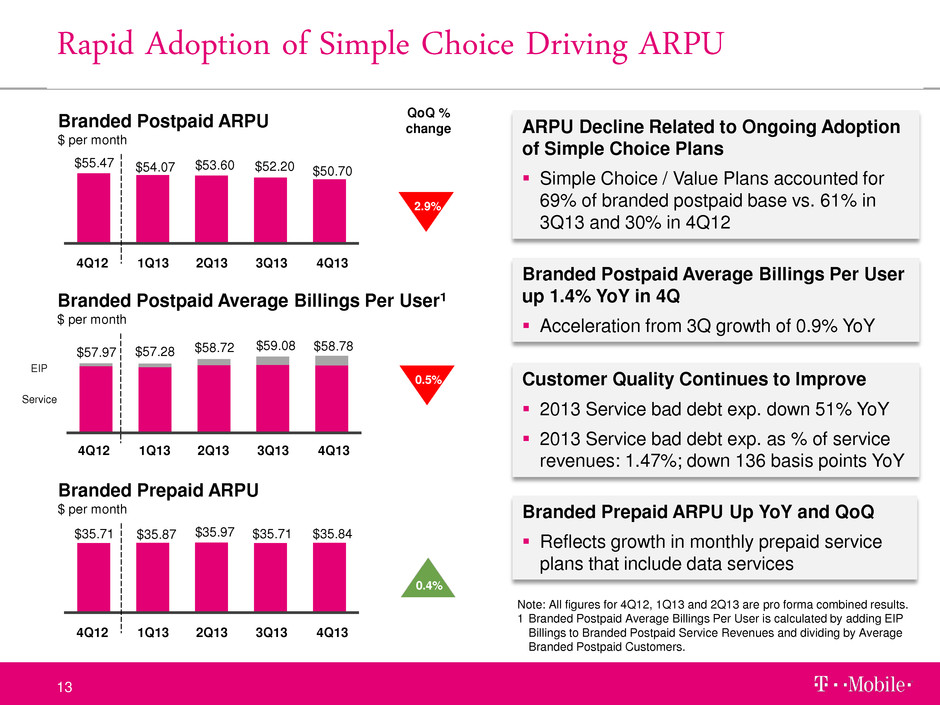
Customer Quality Continues to Improve 2013 Service bad debt exp. down 51% YoY 2013 Service bad debt exp. as % of service revenues: 1.47%; down 136 basis points YoY Rapid Adoption of Simple Choice Driving ARPU 13 $55.47 $54.07 $53.60 $52.20 $50.70 Branded Postpaid ARPU $ per month QoQ % change 4Q12 1Q13 2Q13 3Q13 4Q13 10% 2.9% $35.71 $35.87 $35.97 $35.71 $35.84 Branded Prepaid ARPU $ per month 4Q12 1Q13 2Q13 3Q13 4Q13 0.4% Branded Prepaid ARPU Up YoY and QoQ Reflects growth in monthly prepaid service plans that include data services $57.97 $57.28 $58.72 $59.08 $58.78 Branded Postpaid Average Billings Per User1 $ per month 4Q12 1Q13 2Q13 3Q13 4Q13 0.5% EIP Note: All figures for 4Q12, 1Q13 and 2Q13 are pro forma combined results. 1 Branded Postpaid Average Billings Per User is calculated by adding EIP Billings to Branded Postpaid Service Revenues and dividing by Average Branded Postpaid Customers. ARPU Decline Related to Ongoing Adoption of Simple Choice Plans Simple Choice / Value Plans accounted for 69% of branded postpaid base vs. 61% in 3Q13 and 30% in 4Q12 Branded Postpaid Average Billings Per User up 1.4% YoY in 4Q Acceleration from 3Q growth of 0.9% YoY Service
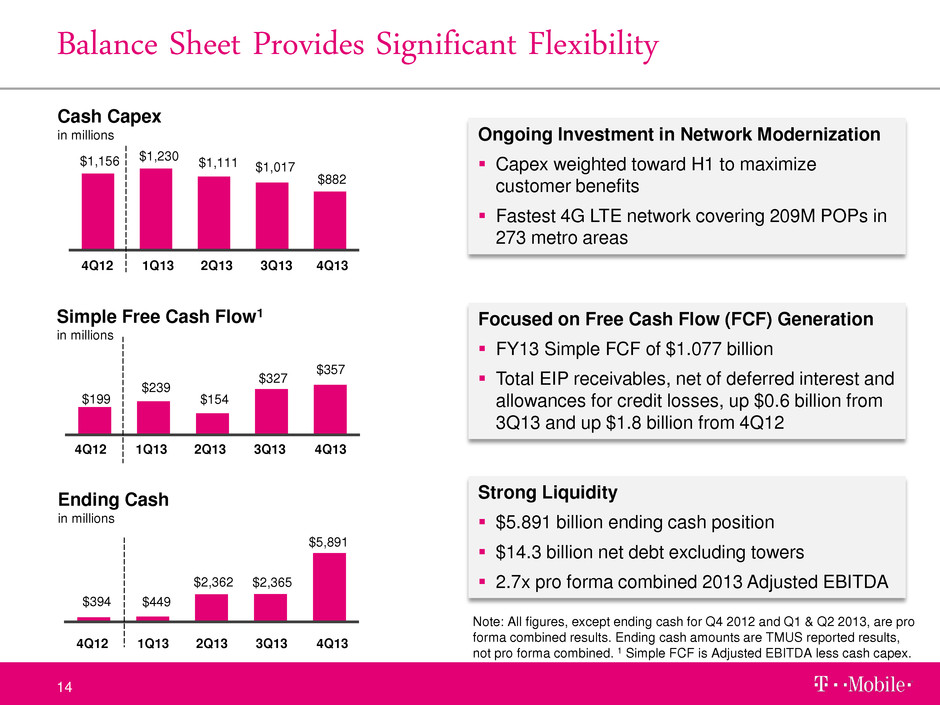
Ongoing Investment in Network Modernization Capex weighted toward H1 to maximize customer benefits Fastest 4G LTE network covering 209M POPs in 273 metro areas $199 $239 $154 $327 $357 4Q12 1Q13 2Q13 3Q13 4Q13 Balance Sheet Provides Significant Flexibility 14 Simple Free Cash Flow1 in millions $1,156 $1,230 $1,111 $1,017 $882 Cash Capex in millions 4Q12 1Q13 2Q13 3Q13 4Q13 $394 $449 $2,362 $2,365 $5,891 Ending Cash in millions 4Q12 1Q13 2Q13 3Q13 4Q13 Focused on Free Cash Flow (FCF) Generation FY13 Simple FCF of $1.077 billion Total EIP receivables, net of deferred interest and allowances for credit losses, up $0.6 billion from 3Q13 and up $1.8 billion from 4Q12 Strong Liquidity $5.891 billion ending cash position $14.3 billion net debt excluding towers 2.7x pro forma combined 2013 Adjusted EBITDA Note: All figures, except ending cash for Q4 2012 and Q1 & Q2 2013, are pro forma combined results. Ending cash amounts are TMUS reported results, not pro forma combined. 1 Simple FCF is Adjusted EBITDA less cash capex.
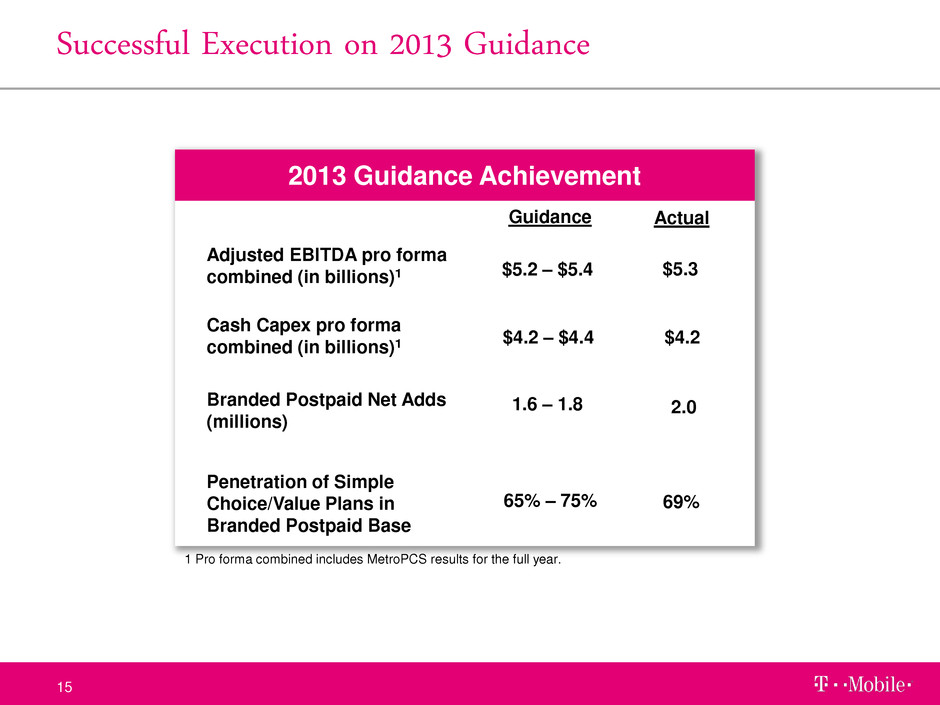
Successful Execution on 2013 Guidance 15 2013 Guidance Achievement Adjusted EBITDA pro forma combined (in billions)1 Cash Capex pro forma combined (in billions)1 Branded Postpaid Net Adds (millions) $5.2 – $5.4 $4.2 – $4.4 1.6 – 1.8 Penetration of Simple Choice/Value Plans in Branded Postpaid Base 65% – 75% 1 Pro forma combined includes MetroPCS results for the full year. $5.3 $4.2 2.0 69% Guidance Actual
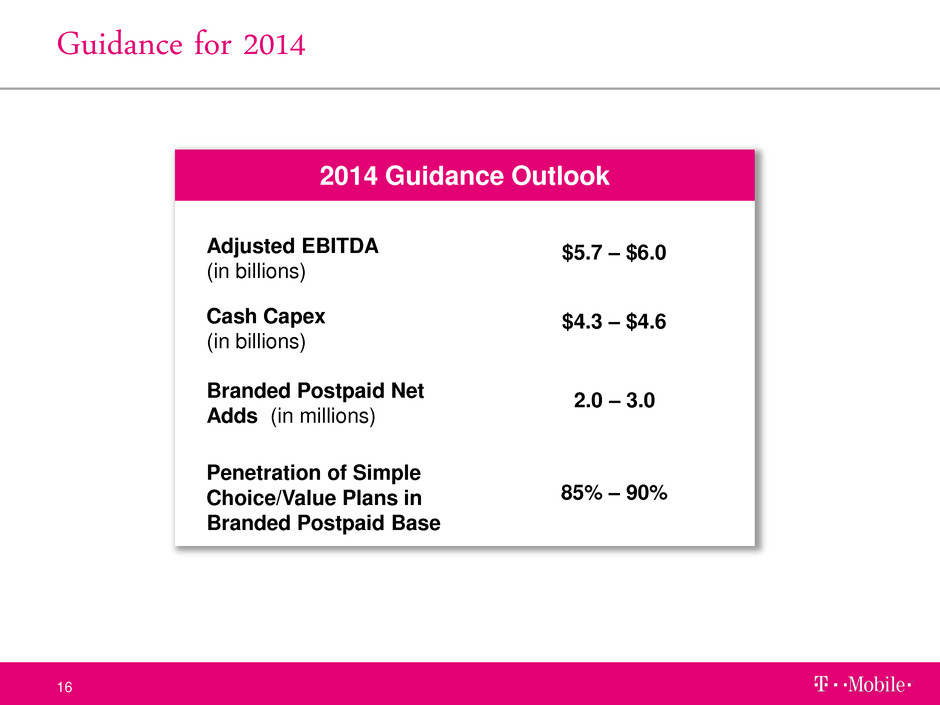
Guidance for 2014 16 2014 Guidance Outlook Adjusted EBITDA (in billions) Cash Capex (in billions) Branded Postpaid Net Adds (in millions) $5.7 – $6.0 $4.3 – $4.6 2.0 – 3.0 Penetration of Simple Choice/Value Plans in Branded Postpaid Base 85% – 90%

Growth and profitability Met Adjusted EBITDA target while exceeding branded postpaid net adds guidance Strong cost discipline with $1.7 billion run-rate costs taken out of the business in 2013 Key Messages 17 2013: T-Mobile is the fastest growing wireless company Total net additions of more than 4.4 million in 2013 – 1.6 million in Q4 Branded postpaid net additions of over 2 million in 2013 – 869K in Q4 1 Strong operating improvement – improved retention & customer quality Branded postpaid churn of 1.7% for FY 2013 – down 70bps YoY Improving quality metrics: service bad debt expense, % Prime in EIP receivables 2 3 Continuing growth path even further in 2014 – already seen in Q1 Guiding toward Adjusted EBITDA of $5.7 to $6.0 billion Branded postpaid net adds guidance of 2 to 3 million 4 Note: All figures for 4Q12, 1Q13 and 2Q13 are pro forma combined results.
T-Mobile US Q4 and Full Year 2013


