EXHIBIT 99.2

1
2
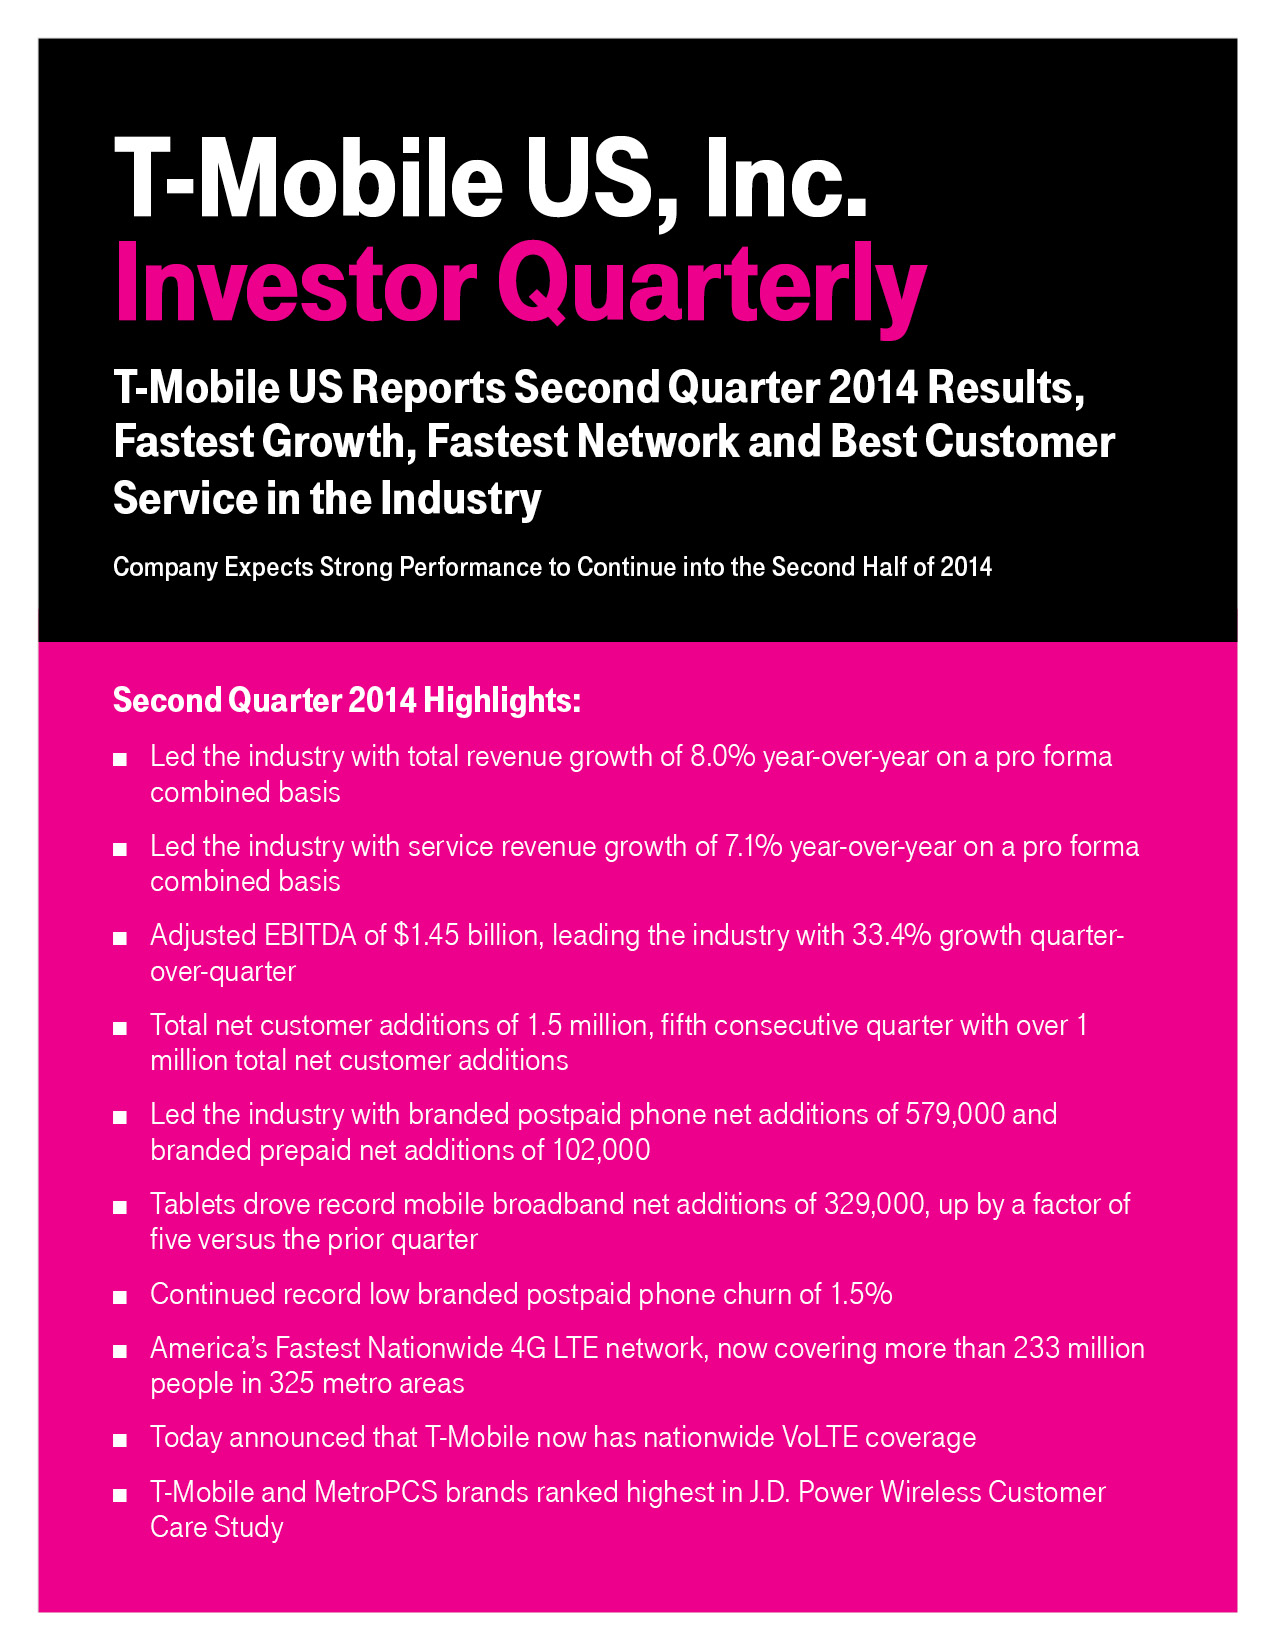
T-Mobile US, Inc.'s (NYSE: TMUS) results for the second quarter of 2014 were highlighted by 1.470 million total net customer additions which included 908,000 branded postpaid net customer additions. For the fifth consecutive quarter, total net customer additions were over one million, demonstrating strong customer response to T-Mobile's Un-carrier value proposition. Total customers at the end of the second quarter of 2014 were 50.5 million, exceeding the 50 million milestone for the first time. Branded postpaid phone churn was 1.5%, remaining stable both sequentially and year-over-year. Total service revenues of $5.5 billion in the second quarter of 2014 grew 7.1% year-over-year on a pro forma combined basis, the fastest growth among the national wireless carriers. Adjusted EBITDA for the second quarter of 2014 was $1.451 billion, up 29% from the second quarter of 2013.
Branded Customers
3
| ▪ | Branded postpaid net customer additions were 908,000 in the second quarter of 2014, compared to 1,323,000 net customer additions in the first quarter of 2014 and 688,000 net customer additions in the second quarter of 2013. |
| ▪ | Branded postpaid phone net customer additions were 579,000 in the second quarter of 2014, compared to 1,256,000 in the first quarter of 2014, and 685,000 in the second quarter of 2013. Sequentially, the decrease was primarily due to a reduction in the number of customers taking the Un-carrier 4.0 ("Contract Freedom") offer, which was launched in January 2014. Year-over-year, the decrease was primarily due to higher deactivations as described in the branded postpaid phone churn section below. |
| ▪ | In the second quarter of 2014 more than 300,000 branded postpaid customers joined T-Mobile and upgraded their handset in response to Contract Freedom. Approximately 875,000 customers have taken advantage of this Un-carrier initiative since the launch in January 2014. |
| ▪ | Branded postpaid mobile broadband net customer additions were 329,000 in the second quarter of 2014, up significantly from 67,000 in the first quarter of 2014, and 3,000 in the second quarter of 2013. The sequential and year-over-year increases were the result of the positive customer response to "Operation Tablet Freedom" launched in April 2014, which provides customers with a Simple Choice voice plan with up to 1.2 GB of free 4G data every month for their tablet device through the end of 2014. |
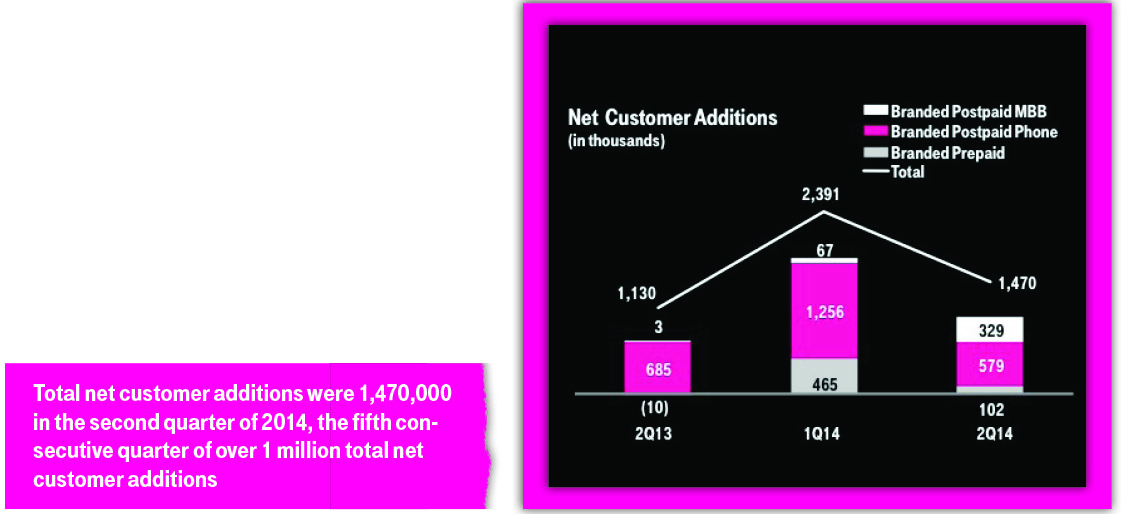
| ▪ | Branded postpaid phone churn was 1.5% in the second quarter of 2014, stable compared to the first quarter of 2014 and the second quarter of 2013. Sequentially and year-over-year, while churn remained stable deactivations increased due to a larger branded postpaid phone customer base driven by the continued success of the Company's Un-carrier value proposition along with ongoing focus on improving network quality and the total customer experience. |
| ▪ | Branded prepaid net customer additions were 102,000 in the second quarter of 2014, compared to 465,000 net customer additions in the first quarter of 2014, and 10,000 net customer losses in the second quarter of 2013. On a pro forma combined basis, branded prepaid net customer additions improved from 87,000 net customer losses in the second quarter of 2013. |
4
| ▪ | Sequentially, the decrease was primarily due to seasonal strength of prepaid gross additions and lower deactivations in the first quarter of 2014. |
| ▪ | Year-over-year, the increase was primarily due to higher gross additions from the inclusion and growth of MetroPCS customers along with the expansion of the MetroPCS brand into 30 additional markets during 2013. |
| ▪ | Branded prepaid net customer additions in the second quarter of 2014 were reduced by approximately 85,000 qualified upgrades of existing branded prepaid customers to the branded postpaid Simple Choice plan. |
| ▪ | Branded prepaid churn was 4.5% in the second quarter of 2014, up 20 basis points from 4.3% in the first quarter of 2014 and down 90 basis points from 5.4% in the second quarter of 2013. On a pro forma combined basis, branded prepaid churn was down 40 basis points from 4.9% in the second quarter of 2013. Sequentially, the increase in churn was primarily due to higher deactivations following the seasonal strength of the prepaid business in the first quarter of 2014. Year-over-year, branded prepaid churn benefited from the inclusion and growth of MetroPCS customers, which historically have lower rates of churn than T-Mobile branded prepaid customers. |
Wholesale
| ▪ | T-Mobile's wholesale customer base, which includes Mobile Virtual Network Operator (MVNO) and Machine to Machine (M2M) customers, increased by 460,000 in the second quarter of 2014 compared to wholesale net additions of 603,000 in the first quarter of 2014 and 452,000 in the second quarter of 2013. |
| • | MVNO partners delivered net customer additions of 235,000 in the second quarter of 2014, compared to 383,000 in the first quarter of 2014 and 319,000 in the second quarter of 2013. The increase in MVNO customers was primarily from growth in government subsidized Lifeline programs offered by T-Mobile's MVNO partners. The total MVNO customer base at the end of the second quarter of 2014 was 6.3 million. |
| • | T-Mobile offers its M2M customers innovative products and solutions to assist them in embracing the Internet of Things ("IoT"). The M2M business continued to grow, with 225,000 net customer additions in the second quarter of 2014 due to strong activation volume. The total M2M customer base at the end of the second quarter of 2014 was 4.0 million. |
Un-carrier Initiatives
| ▪ | In March of 2013, T-Mobile began unveiling its Un-carrier initiatives that have revolutionized the wireless industry. In 2013, T-Mobile introduced no annual service contracts, equipment installment plans (“EIP”), upgrade programs (“JUMP!”), and unlimited data and texting in more than 120 countries and destinations worldwide. Continuing the revolution in 2014, T-Mobile began reimbursing customers for early termination fees ("ETFs") of other carriers in January, launched Operation Tablet Freedom, wiped out overage charges for domestic usage, and introduced a Simple Starter plan in April, and in the second quarter of 2014, announced the following additional Un-carrier initiatives: |
| • | Un-carrier 5.0: T-Mobile launched "T-Mobile Test Drive” for a limited time, which allows consumers to try the T-Mobile network and test an iPhone 5s with unlimited nationwide service for seven days for free. |
| • | Un-carrier 6.0: T-Mobile launched "Music Freedom" which allows Simple Choice customers to stream music from popular music services without it counting against their 4G data allotment. Additionally as part of Un-carrier 6.0, T-Mobile partnered with Rhapsody to launch Rhapsody unRadio for a limited time, which allows Simple Choice customers with T-Mobile's newest unlimited 4G data service to stream music at no additional cost. Additionally, T-Mobile is offering Rhapsody unRadio at a discounted price for other eligible T-Mobile customers. |
5
Equipment Installment Plans
| ▪ | T-Mobile financed $1.3 billion of equipment sales on EIP in the second quarter of 2014, compared to $1.2 billion in the first quarter of 2014 and $0.8 billion in the second quarter of 2013. |
| ▪ | Customers on Value and Simple Choice plans (collectively referred to as "Simple Choice plans" hereafter) had associated EIP billings of $810 million in the second quarter of 2014, compared to $657 million in the first quarter of 2014 and $314 million in the second quarter of 2013. |
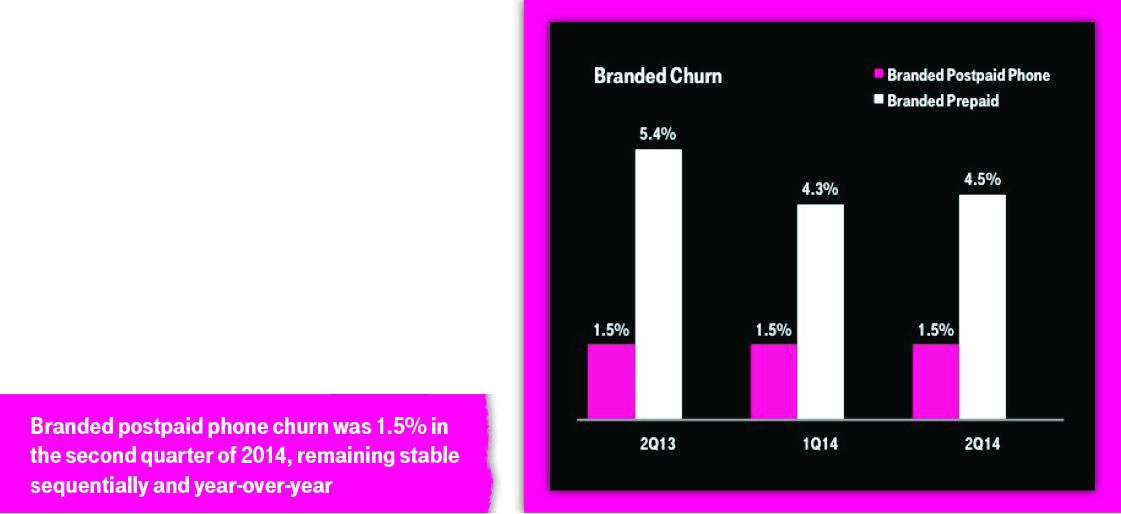
| ▪ | Total EIP receivables, net of deferred interest and allowances for credit losses, were $3.583 billion at the end of the second quarter of 2014, compared to $3.086 billion at the end of the first quarter of 2014 and $1.292 billion at the end of the second quarter of 2013. Total EIP receivables increased by $497 million in the second quarter of 2014, compared to an increase of $540 million in the first quarter of 2014, representing the second quarter where the sequential increase in EIP receivables was lower compared to the prior quarter. |
6
Devices
| ▪ | Branded Postpaid: At the end of the second quarter of 2014, 84% of the total branded postpaid phone customer base used smartphones, up from 81% in the first quarter of 2014 and 72% in the second quarter of 2013. |
| ▪ | Branded Prepaid: At the end of the second quarter of 2014, 83% of the total branded prepaid phone customer base used smartphones, up from 82% in the first quarter of 2014 and 77% in the second quarter of 2013. |
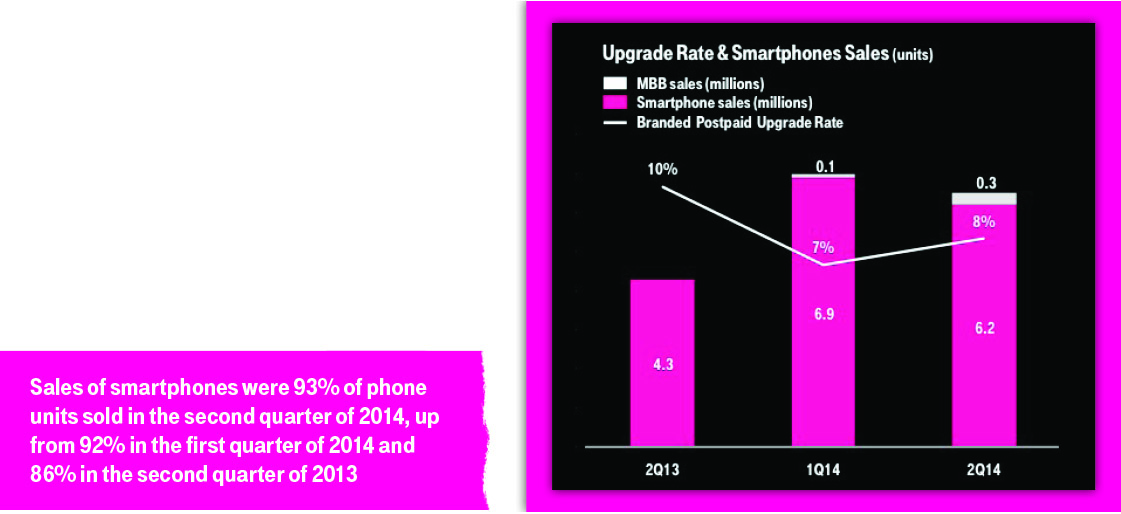
| ▪ | Smartphone Sales: Sales of smartphones, including branded postpaid and branded prepaid, were 6.2 million units in the second quarter of 2014, compared to 6.9 million units in the first quarter of 2014 and 4.3 million units in the second quarter of 2013. Smartphone sales accounted for 93% of device sales revenues and 93% of phone units sold in the second quarter of 2014, compared to 96% of device sales revenues and 92% of phone units sold in the first quarter of 2014 and 98% of device sales revenues and 86% of phone units sold in the second quarter of 2013. |
| ▪ | Mobile Broadband Device Sales: Sales of mobile broadband devices, including branded postpaid and branded prepaid, were 298,000 units in the second quarter of 2014, up significantly from 114,000 units in the first quarter of 2014 and 40,000 units in the second quarter of 2013. Mobile broadband sales accounted for 6% of device sales revenues and 4% of units sold in the second quarter of 2014, compared to 3% of device sales revenues and 2% of units sold in the first quarter of 2014 and 1% of device sales revenues and 1% of units sold in the second quarter of 2013. |
| ▪ | Upgrade Rate: The rate of branded postpaid customers upgrading their handsets in the second quarter of 2014 was approximately 8%; compared to approximately 7% in the first quarter of 2014 and approximately 10% in the second quarter of 2013. |
Revenues, ARPU & ABPU
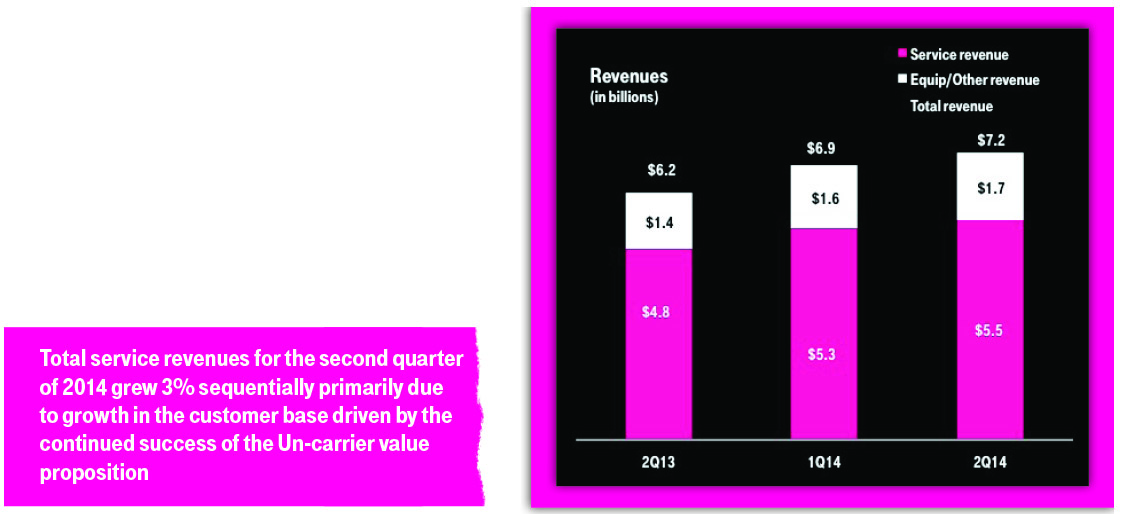
| ▪ | Service revenues were $5.5 billion in the second quarter of 2014, up 3% from $5.3 billion in the first quarter of 2014 and up 15% from $4.8 billion in the second quarter of 2013. |
| • | Sequentially, service revenues increased primarily due to growth in the customer base driven by the continued success of the Un-carrier value proposition along with an increase in revenues from the adoption of upgrade and insurance programs. Additional increases resulted from directly providing handset insurance services to MetroPCS customers beginning in the second quarter of 2014. These increases were offset in part by non-recurring factors, a reduction in certain regulatory surcharges and a revenue adjustment for expected customer refunds on premium Short Message Service (“SMS”) charges that together totaled $43 million for the second quarter of 2014. |
7
| • | Year-over-year, service revenues increased primarily due to the inclusion and growth of MetroPCS service revenues for the entire second quarter of 2014. Additional increases resulted from growth in the customer base driven by the continued success of the Un-carrier value proposition along with an increase in revenues from the adoption of upgrade and insurance programs. These increases were offset in part by lower branded postpaid phone average revenue per user ("ARPU") described below. Additionally, non-recurring factors, a reduction in certain regulatory surcharges and a revenue adjustment for expected customer refunds on premium SMS charges reduced branded postpaid revenues by $43 million for the second quarter of 2014. |
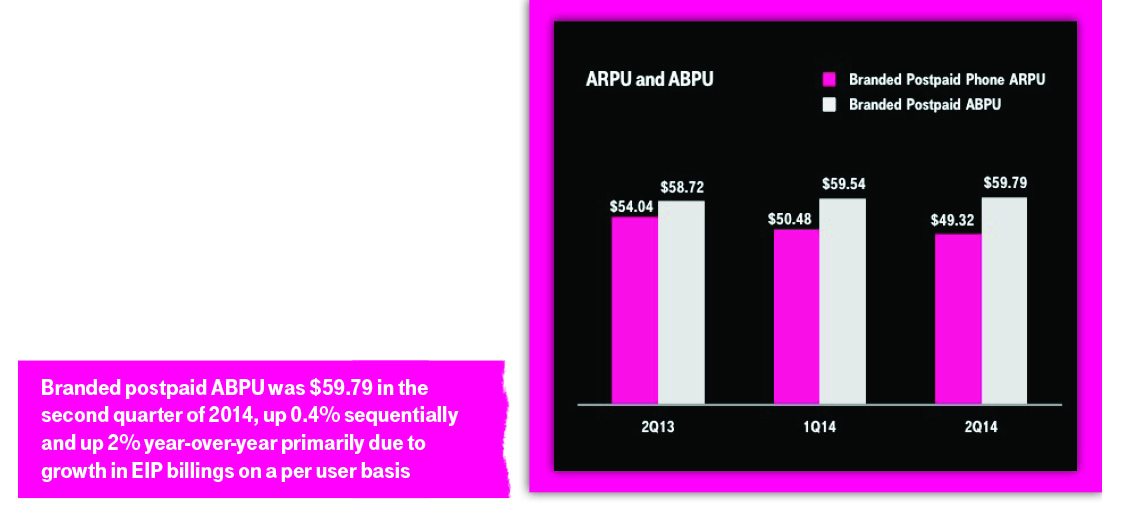
| ▪ | Branded postpaid phone ARPU was $49.32 in the second quarter of 2014, down 2% from $50.48 in the first quarter of 2014, and down 9% from $54.04 in the second quarter of 2013. |
• | Sequentially, branded postpaid phone ARPU decreased primarily due to a $0.61 impact resulting from non-recurring factors, a reduction in certain regulatory surcharges and a revenue adjustment for expected customer refunds on premium SMS charges. Excluding the non-recurring factors, branded postpaid phone ARPU would have been $49.93, resulting in a sequential decline of 1% or $0.55. Year-over-year, branded postpaid phone ARPU decreased primarily due to the continued growth of Simple Choice plans. |
| • | In the second quarter of 2014, Simple Choice customers accounted for 83% of branded postpaid gross customer additions, up from 80% in the first quarter of 2014 and 77% in the second quarter of 2013. At the end of the second quarter of 2014, 80% of the branded postpaid customer base was on a Simple Choice plan, up from 75% at the end of the first quarter of 2014 and 50% at the end of the second quarter of 2013. |
| • | Branded postpaid phone ARPU is reported for the first time in the second quarter of 2014 in replacement of branded postpaid ARPU to exclude mobile broadband customers and related revenues, which is more comparable with other national carriers' ARPU disclosures. |
| ▪ | Branded postpaid average billings per user ("ABPU") was $59.79 in the second quarter of 2014, up 0.4% from $59.54 in the first quarter of 2014, and up 2% from $58.72 in the second quarter of 2013. |
| • | Sequentially and year-over-year, branded postpaid ABPU increased primarily due to growth in EIP billings on a per user basis, offset in part by lower branded postpaid phone ARPU. ABPU reflects the shift in customer billings from branded postpaid service revenues to equipment sales revenues. |
| ▪ | Branded prepaid ARPU was $37.16 in the second quarter of 2014, up 3% from $36.09 in the first quarter of 2014 and up 7% from $34.78 in the second quarter of 2013. |
• | Sequentially and year-over-year, branded prepaid ARPU increased primarily due to the inclusion and growth of the MetroPCS customer base, which generates higher ARPU than T-Mobile's other branded prepaid customers. |
| ▪ | Equipment sales revenues for the second quarter of 2014 were $1.6 billion, up 10% from $1.4 billion in the first quarter of 2014 and up 16% from $1.4 billion in the second quarter of 2013. |
| • | Sequentially, the increase was primarily due to a reduced impact from the reimbursement of other carriers' ETFs in connection with Un-carrier 4.0, which are accounted for as a reduction of equipment sales revenues. |
| • | Year-over-year, the increase was primarily due to higher handset upgrade volumes, including JUMP! redemptions. Additional increases resulted from the inclusion of MetroPCS equipment sales revenues for the entire second quarter of 2014. |
| ▪ | Total revenues, including service, equipment sales, and other revenues, were $7.2 billion in the second quarter of 2014, up 5% from $6.9 billion in the first quarter of 2014 and up 15% from $6.2 billion in the second quarter of 2013. |
8
| • | Sequentially and year-over-year, total revenues increased primarily due to higher service and equipment sales revenues. Additional year-over-year increases resulted from the inclusion of MetroPCS revenues for the entire second quarter of 2014. |
Operating Expenses
| ▪ | Total operating expenses were $6.2 billion in the second quarter of 2014, down 10% from $6.9 billion in the first quarter of 2014 primarily due to a non-cash gain as described below, and up 3% from $6.0 billion in the second quarter of 2013. |
| ▪ | Cost of services of $1.5 billion in the second quarter of 2014 was stable compared to the first quarter of 2014, and increased 9% from $1.3 billion in the second quarter of 2013. The year-over-year increase was primarily due to the inclusion of MetroPCS' cost of services for the entire second quarter of 2014. Additional year-over-year increases resulted from higher lease expense primarily relating to spectrum license lease agreements. These increases were partially offset by a reduction of certain regulatory surcharges that reduced service revenues in the second quarter of 2014. |
| ▪ | Cost of equipment sales of $2.2 billion in the second quarter of 2014 decreased 3% from the first quarter of 2014, and increased 14% from $1.9 billion in the second quarter of 2013. The year-over-year increase was primarily due to the inclusion of MetroPCS' cost of equipment sales for the entire second quarter of 2014. Additional year-over-year increases resulted from higher handset upgrade volumes, including JUMP! redemptions. |
| ▪ | Selling, general and administrative expenses of $2.2 billion in the second quarter of 2014 increased 3% from the first quarter of 2014, and increased 16% from $1.8 billion in the second quarter of 2013. The year-over-year increase was primarily due to higher employee-related expenses as a result of increases in the number of retail and customer support employees as well as stock-based compensation, and the inclusion of MetroPCS' selling, general and administrative expenses for the entire second quarter of 2014. |
| ▪ | Total bad debt expense was $87 million in the second quarter of 2014, compared to $144 million in the first quarter of 2014 and $97 million in the second quarter of 2013. Sequentially and year-over-year, bad debt expense from service plans decreased, offset in part by an increase in bad debt expense related to growth in EIP receivables. The sequential and year-over-year decrease in bad debt from service plans was primarily due to the sale of receivables under the factoring arrangement which no longer results in service bad debt. |
| ▪ | The net expense from the factoring arrangement, primarily losses from the sale of receivables and transaction fees, was $77 million in the second quarter of 2014, compared to $13 million in the first quarter of 2014. |
| • | Depreciation and amortization expenses of $1.1 billion in the second quarter of 2014 increased 7% from the first quarter of 2014, and increased 27% from $0.9 billion in the second quarter of 2013. The sequential and year-over-year increase was primarily due to the build out of the T-Mobile 4G LTE network, which increased the depreciable base, accelerated depreciation related to the decommissioning of the MetroPCS Code Division Multiple Access (CDMA) network, and higher depreciation expense due to the shortening of useful lives of certain network equipment to be replaced in connection with network modernization efforts. Additionally, year-over-year increases resulted from the inclusion of MetroPCS' depreciation and amortization expenses for the entire second quarter of 2014. |
| • | Other, net for the second quarter of 2014 primarily consisted of a non-cash gain of $731 million from spectrum license transactions. |
9
Adjusted EBITDA
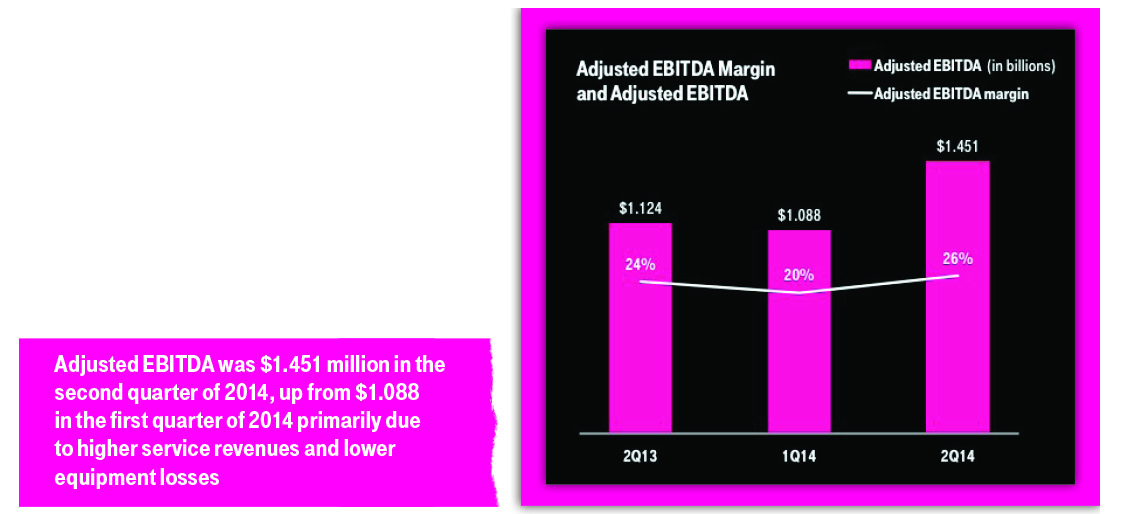
| ▪ | Adjusted EBITDA was $1.451 billion in the second quarter of 2014, up 33% from $1.088 billion in the first quarter of 2014 and up 29% from $1.124 billion in the second quarter of 2013. |
| ▪ | Adjusted EBITDA excludes certain non-recurring expenses and stock-based compensation as presented in more detail in the Adjusted EBITDA non-GAAP reconciliation located later in the Investor Quarterly. |
| ▪ | Sequentially, Adjusted EBITDA increased primarily due to higher service revenues, as well as a decrease in equipment losses due to a reduced impact from the reimbursement of other carriers' ETFs. |
| ▪ | Year-over-year, the inclusion of MetroPCS' operating results for the entire second quarter of 2014 and higher service revenues positively contributed to Adjusted EBITDA. These increases were offset in part by higher selling, general, and administrative expenses. |
| ▪ | Adjusted EBITDA margin was 26% in the second quarter of 2014, up from 20% in the first quarter of 2014 and up from 24% in the second quarter of 2013. |
Earnings (Loss) Per Share
| ▪ | In the second quarter of 2014, basic and diluted earnings per share was $0.49 and $0.48, respectively, an increase from a loss of $0.19 in the first quarter of 2014. The positive variance in the second quarter of 2014 was primarily driven by a non-cash gain of $731 million from spectrum license transactions as described in the Other Events section. |
Capital Expenditures
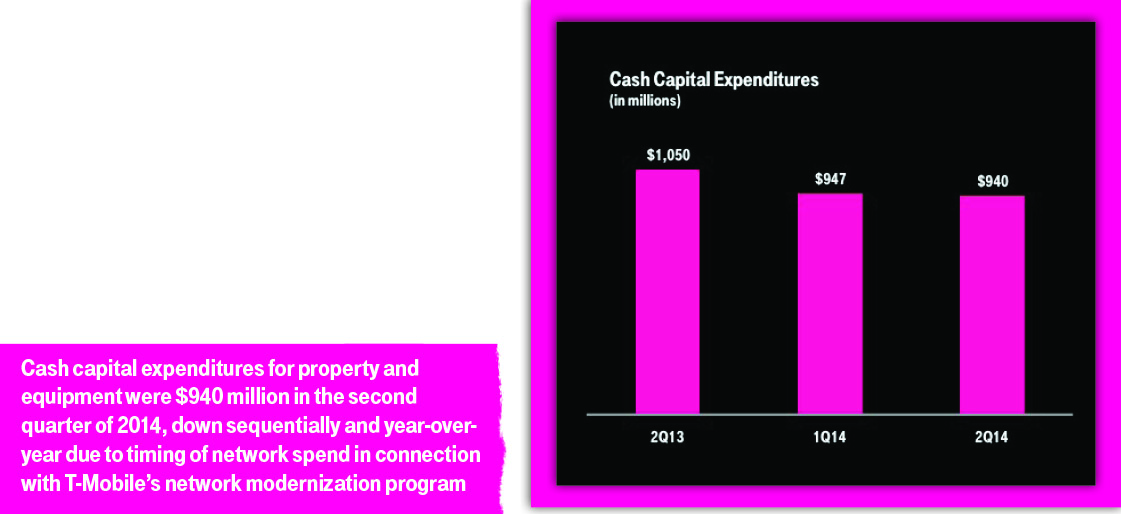
| ▪ | Cash capital expenditures for property and equipment were $940 million in the second quarter of 2014, compared to $947 million in the first quarter of 2014 and $1.050 billion in the second quarter of 2013. The sequential and year-over-year decline was primarily due to timing of network spend in connection with T-Mobile's network modernization program. |
| • | T-Mobile has now launched 4G LTE covering more than 233 million people in 325 metropolitan areas. |
| • | T-Mobile has the fastest nationwide 4G LTE network in the United States, according to crowd-sourced customer data based on millions of real-time speed tests. |
Simple Free Cash Flow
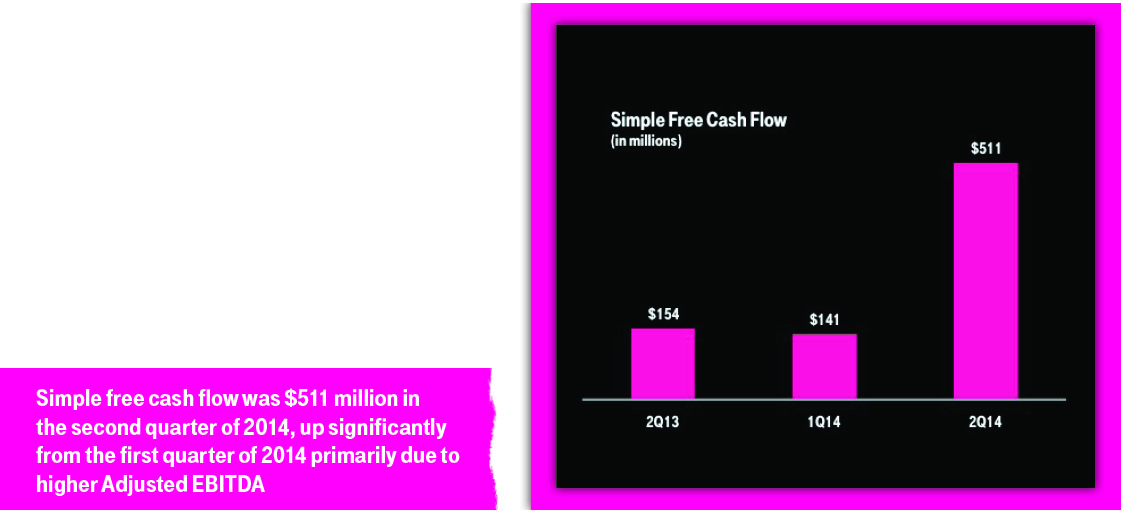
| ▪ | Simple free cash flow was $511 million in the second quarter of 2014, up significantly from $141 million in the first quarter of 2014 and $154 million in the second quarter of 2013 on a pro forma combined basis. The sequential increase was primarily due to higher Adjusted EBITDA resulting largely from higher service revenues, as well as a decrease in equipment losses due to a reduced impact from the reimbursement of other carriers’ ETFs. |
Capital Structure
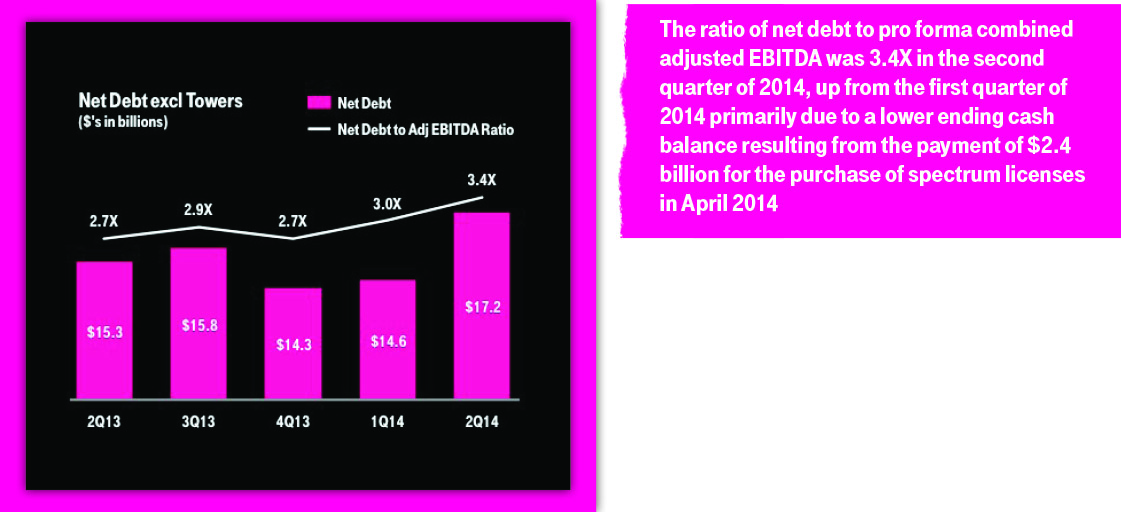
The ratio of net debt to pro forma combined Adjusted EBITDA for the trailing twelve month periods ended June 30, 2014, March 31, 2014, December 31, 2013, September 30, 2013, and June 30, 2013 is shown below. For the calculation of the ratio of net debt to pro forma combined Adjusted EBITDA, refer to the Pro Forma Combined Results section located later in the Investor Quarterly.
Other Events
| ▪ | In November 2013 and January 2014, T-Mobile entered into agreements with Verizon for the acquisition of 700 MHz A-Block AWS and PCS spectrum licenses in exchange for $2.4 billion in cash and the transfer of certain AWS and PCS spectrum licenses. These transactions further enhance T-Mobile's portfolio of U.S. nationwide broadband spectrum and enable the expansion of LTE coverage to new markets. Upon closing of the transactions in April 2014, T-Mobile received the 700 MHz A-Block spectrum licenses and exchanged certain AWS and PCS spectrum licenses. As a result of the closing of the spectrum transactions, T-Mobile recognized a non-cash gain of $731 million in the second quarter of 2014, which is included in Other, net in the condensed consolidated statements of comprehensive income (loss). For more information on these transactions, please refer to the Form 10-Q filed with the Securities and Exchange Commission on July 31, 2014. |
| ▪ | On July 1, 2014, the Federal Trade Commission (FTC) filed a lawsuit alleging that T-Mobile allowed third-party merchants to include unauthorized premium SMS content charges on customer bills, and seeking restitution and changes in business practices. This complaint does not seek a specified sum as monetary relief. In addition, the Federal Communications Commission and other government agencies have begun investigations and inquiries regarding billing for premium SMS content. |
Premium SMS content was provided to customers by third parties that sent text alerts on topics of interest, such as weather and sports scores, and ringtones. T-Mobile, along with the other major wireless carriers, stopped billing for these services in late 2013. In June 2014, T-Mobile announced a comprehensive refund program, under which T-Mobile will notify current and former customers who paid for premium SMS content and have not already received a refund how to request a summary of these charges and a refund for those charges customers assert to have been unauthorized. T-Mobile recognized the estimated cost of the refund program as a reduction to service revenues during the second quarter of 2014.
| ▪ | Prior to the closing of the business combination, T-Mobile developed integration plans which included the decommissioning of the MetroPCS Code Division Multiple Access (“CDMA”) network and certain other redundant network cell sites. In July 2014, T-Mobile began decommissioning the MetroPCS CDMA network and redundant network cell sites. During the second half of 2014, T-Mobile expects to incur network decommissioning costs between $250 million and $300 million for certain cell sites in three major metropolitan markets. Network decommissioning costs primarily relate to the acceleration of lease costs for cell sites, which will result in cash expenditures that will continue to be made over the remaining lease terms, but for which T-Mobile will no longer receive any economic benefit. Accrued liabilities for network decommissioning costs will be relieved as payments are made over the remaining lease terms. Network decommissioning costs will be recognized in MetroPCS transaction and integration costs in the condensed consolidated statements of comprehensive income (loss). |
T-Mobile expects to decommission certain cell sites in additional major metropolitan markets in 2015 and 2016. Currently, T-Mobile is unable to estimate the expected network decommissioning costs and related future cash expenditures for those cell sites due to uncertainties regarding the specific sites to be decommissioned and the timing of such decommissioning.
| ▪ | On July 31, 2014, J.D. Power recognized T-Mobile for its leadership in Customer Care Performance with both the T-Mobile and MetroPCS brands achieving the highest ranking. T-Mobile reclaimed the top spot and has been awarded the highest ranking among the four major US wireless carriers in the J.D. Power 2014 Wireless Customer Care Full-Service StudySM - Volume 2 and the 2014 Wireless Customer Care Non-Contract Study Volume 2. The MetroPCS brand received the highest ranking among non-contract providers in the study for the fourth consecutive time. The results reinforce T-Mobile’s track record as an organization with a strong focus and commitment to providing an outstanding customer experience whether you call in, come in to the stores, or access online. |
| ▪ | In July 2014, T-Mobile entered into agreements for the purchase of 700 MHz A-Block spectrum licenses covering an estimated population of 8.7 million people for approximately $51 million in the aggregate, averaging approximately $0.48 per MHz per person. The transactions are expected to close in the first quarter of 2015, subject to regulatory approval and other customary closing conditions. |
2014 Outlook Guidance
| ▪ | T-Mobile expects to drive further momentum while continuing to invest in profitable growth. With the success of T-Mobile's Simple Choice plan and the continued evolution of the Un-carrier value proposition, branded postpaid net additions for 2014 are now expected to be between 3.0 and 3.5 million, up from the prior guidance of 2.8 and 3.3 million. |
| ▪ | For the full year of 2014, T-Mobile expects Adjusted EBITDA to be in the range of $5.6 to $5.8 billion, which is unchanged from the earlier range despite the increase in customer growth guidance. |
| ▪ | Cash capital expenditures are expected to be in the range of $4.3 to $4.6 billion. |
| ▪ | With this growth and rate plan migrations, the penetration of Simple Choice plans in the branded postpaid base is projected to be between 85% and 90% by the end of 2014. |
For more details on T-Mobile's second quarter of 2014 financial results please visit T-Mobile US, Inc.'s Investor Relations website at http://investor.T-Mobile.com
15
T-Mobile US, Inc.
Condensed Consolidated Balance Sheets
(Unaudited)
| (in millions, except share and per share amounts) | June 30, 2014 | December 31, 2013 | |||||
| Assets | |||||||
| Current assets | |||||||
| Cash and cash equivalents | $ | 3,080 | $ | 5,891 | |||
| Accounts receivable, net of deferred interest and allowances of $473 and $381 | 3,939 | 3,619 | |||||
| Accounts receivable from affiliates | 87 | 41 | |||||
| Inventory | 791 | 586 | |||||
| Current portion of deferred tax assets, net | 820 | 839 | |||||
| Other current assets | 1,179 | 1,252 | |||||
| Total current assets | 9,896 | 12,228 | |||||
| Property and equipment, net of accumulated depreciation of $21,137 and $19,649 | 15,537 | 15,349 | |||||
| Goodwill | 1,683 | 1,683 | |||||
| Spectrum licenses | 21,828 | 18,122 | |||||
| Other intangible assets, net of accumulated amortization of $643 and $476 | 1,040 | 1,204 | |||||
| Other assets | 1,680 | 1,367 | |||||
| Total assets | $ | 51,664 | $ | 49,953 | |||
| Liabilities and Stockholders' Equity | |||||||
| Current liabilities | |||||||
| Accounts payable and accrued liabilities | $ | 5,555 | $ | 4,567 | |||
| Current payables and short-term debt to affiliates | 236 | 199 | |||||
| Short-term debt | 272 | 244 | |||||
| Deferred revenue | 447 | 445 | |||||
| Other current liabilities | 621 | 353 | |||||
| Total current liabilities | 7,131 | 5,808 | |||||
| Long-term debt to affiliates | 5,600 | 5,600 | |||||
| Long-term debt | 14,369 | 14,345 | |||||
| Long-term financial obligation | 2,502 | 2,496 | |||||
| Deferred tax liabilities | 4,757 | 4,645 | |||||
| Deferred rents | 2,237 | 2,113 | |||||
| Other long-term liabilities | 505 | 701 | |||||
| Total long-term liabilities | 29,970 | 29,900 | |||||
| Commitments and contingencies | |||||||
| Stockholders' equity | |||||||
| Preferred stock, par value $0.00001 per share, 100,000,000 shares authorized; no shares issued and outstanding | — | — | |||||
| Common stock, par value $0.00001 per share, 1,000,000,000 shares authorized; 808,508,529 and 803,262,309 shares issued, 807,126,024 and 801,879,804 shares outstanding | — | — | |||||
| Additional paid-in capital | 37,411 | 37,330 | |||||
| Treasury stock, at cost, 1,382,505 and 1,382,505 shares issued | — | — | |||||
| Accumulated other comprehensive income | — | 3 | |||||
| Accumulated deficit | (22,848 | ) | (23,088 | ) | |||
| Total stockholders' equity | 14,563 | 14,245 | |||||
| Total liabilities and stockholders' equity | $ | 51,664 | $ | 49,953 | |||
T-Mobile US, Inc.
Condensed Consolidated Statements of Comprehensive Income (Loss)
(Unaudited)
| Three Months Ended | Six Months Ended June 30, | ||||||||||||||||||
| (in millions, except shares and per share amounts) | June 30, 2014 | March 31, 2014 | June 30, 2013 | 2014 | 2013 | ||||||||||||||
| Revenues | |||||||||||||||||||
| Branded postpaid revenues | $ | 3,511 | $ | 3,447 | $ | 3,284 | $ | 6,958 | $ | 6,547 | |||||||||
| Branded prepaid revenues | 1,736 | 1,648 | 1,242 | 3,384 | 1,745 | ||||||||||||||
| Total branded revenues | 5,247 | 5,095 | 4,526 | 10,342 | 8,292 | ||||||||||||||
| Wholesale revenues | 172 | 174 | 143 | 346 | 293 | ||||||||||||||
| Roaming and other service revenues | 65 | 68 | 87 | 133 | 177 | ||||||||||||||
| Total service revenues | 5,484 | 5,337 | 4,756 | 10,821 | 8,762 | ||||||||||||||
| Equipment sales | 1,600 | 1,448 | 1,379 | 3,048 | 1,984 | ||||||||||||||
| Other revenues | 101 | 90 | 93 | 191 | 159 | ||||||||||||||
| Total revenues | 7,185 | 6,875 | 6,228 | 14,060 | 10,905 | ||||||||||||||
| Operating expenses | |||||||||||||||||||
| Cost of services, exclusive of depreciation and amortization shown separately below | 1,453 | 1,464 | 1,327 | 2,917 | 2,436 | ||||||||||||||
| Cost of equipment sales | 2,215 | 2,286 | 1,936 | 4,501 | 2,822 | ||||||||||||||
| Selling, general and administrative | 2,151 | 2,096 | 1,847 | 4,247 | 3,353 | ||||||||||||||
| Depreciation and amortization | 1,129 | 1,055 | 888 | 2,184 | 1,643 | ||||||||||||||
| MetroPCS transaction and integration costs | 22 | 12 | 26 | 34 | 39 | ||||||||||||||
| Restructuring costs | — | — | 23 | — | 54 | ||||||||||||||
| Other, net | (747 | ) | (10 | ) | — | (757 | ) | (2 | ) | ||||||||||
| Total operating expenses | 6,223 | 6,903 | 6,047 | 13,126 | 10,345 | ||||||||||||||
| Operating income (loss) | 962 | (28 | ) | 181 | 934 | 560 | |||||||||||||
| Other income (expense) | |||||||||||||||||||
| Interest expense to affiliates | (85 | ) | (18 | ) | (225 | ) | (103 | ) | (403 | ) | |||||||||
| Interest expense | (271 | ) | (276 | ) | (109 | ) | (547 | ) | (160 | ) | |||||||||
| Interest income | 83 | 75 | 40 | 158 | 75 | ||||||||||||||
| Other income (expense), net | (12 | ) | (6 | ) | 118 | (18 | ) | 112 | |||||||||||
| Total other expense, net | (285 | ) | (225 | ) | (176 | ) | (510 | ) | (376 | ) | |||||||||
| Income (loss) before income taxes | 677 | (253 | ) | 5 | 424 | 184 | |||||||||||||
| Income tax expense (benefit) | 286 | (102 | ) | 21 | 184 | 93 | |||||||||||||
| Net income (loss) | $ | 391 | $ | (151 | ) | $ | (16 | ) | $ | 240 | $ | 91 | |||||||
| Other comprehensive income (loss), net of tax: | |||||||||||||||||||
| Net gain on cross currency interest rate swaps, net of tax effect of $0, $0, $39, $0, and $13 | — | — | 66 | — | 23 | ||||||||||||||
| Net loss on foreign currency translation, net of tax effect of $0, $0, ($62), $0, and ($37) | — | — | (104 | ) | — | (62 | ) | ||||||||||||
| Unrealized loss on available-for-sale securities, net of tax effect of $0, ($1), $0, ($1), and $0 | — | (3 | ) | — | (3 | ) | — | ||||||||||||
| Other comprehensive loss, net of tax | — | (3 | ) | (38 | ) | (3 | ) | (39 | ) | ||||||||||
| Total comprehensive income (loss) | $ | 391 | $ | (154 | ) | $ | (54 | ) | $ | 237 | $ | 52 | |||||||
| Earnings (loss) per share | |||||||||||||||||||
| Basic | $ | 0.49 | $ | (0.19 | ) | $ | (0.02 | ) | $ | 0.30 | $ | 0.15 | |||||||
| Diluted | 0.48 | (0.19 | ) | (0.02 | ) | 0.30 | 0.15 | ||||||||||||
| Weighted average shares outstanding | |||||||||||||||||||
| Basic | 803,923,913 | 802,520,723 | 664,603,682 | 803,226,194 | 600,302,111 | ||||||||||||||
| Diluted | 813,556,137 | 802,520,723 | 664,603,682 | 812,903,135 | 601,694,911 | ||||||||||||||
17
T-Mobile US, Inc.
Condensed Consolidated Statements of Cash Flows
(Unaudited)
| Three Months Ended | Six Months Ended June 30, | ||||||||||||||||||
| (in millions) | June 30, 2014 | March 31, 2014 | June 30, 2013 | 2014 | 2013 | ||||||||||||||
| Operating activities | |||||||||||||||||||
| Net cash provided by operating activities | $ | 970 | $ | 759 | $ | 806 | $ | 1,729 | $ | 1,715 | |||||||||
| Investing activities | |||||||||||||||||||
| Purchases of property and equipment | (940 | ) | (947 | ) | (1,050 | ) | (1,887 | ) | (2,126 | ) | |||||||||
| Purchases of spectrum licenses and other intangible assets | (2,367 | ) | — | (2 | ) | (2,367 | ) | (51 | ) | ||||||||||
| Short term affiliate loan receivable, net | — | — | 25 | — | 300 | ||||||||||||||
| Cash and cash equivalents acquired in MetroPCS business combination | — | — | 2,144 | — | 2,144 | ||||||||||||||
| Investments in unconsolidated affiliates, net | (9 | ) | (11 | ) | — | (20 | ) | — | |||||||||||
| Other, net | 6 | (7 | ) | (1 | ) | (1 | ) | (5 | ) | ||||||||||
| Net cash provided by (used in) investing activities | (3,310 | ) | (965 | ) | 1,116 | (4,275 | ) | 262 | |||||||||||
| Financing activities | |||||||||||||||||||
| Repayments of short-term debt for purchases of property and equipment | (5 | ) | (226 | ) | — | (231 | ) | — | |||||||||||
| Repayments related to a variable interest entity | — | — | (40 | ) | — | (40 | ) | ||||||||||||
| Distribution to affiliate | — | — | (41 | ) | — | (41 | ) | ||||||||||||
| Taxes paid related to net share settlement of stock awards | (72 | ) | — | — | (72 | ) | — | ||||||||||||
| Excess tax benefit from stock-based compensation | 33 | — | 3 | 33 | 3 | ||||||||||||||
| Proceeds from exercise of stock options | 9 | 14 | 72 | 23 | 72 | ||||||||||||||
| Other, net | (16 | ) | (2 | ) | (3 | ) | (18 | ) | (3 | ) | |||||||||
| Net cash used in financing activities | (51 | ) | (214 | ) | (9 | ) | (265 | ) | (9 | ) | |||||||||
| Change in cash and cash equivalents | (2,391 | ) | (420 | ) | 1,913 | (2,811 | ) | 1,968 | |||||||||||
| Cash and cash equivalents | |||||||||||||||||||
| Beginning of period | 5,471 | 5,891 | 449 | 5,891 | 394 | ||||||||||||||
| End of period | $ | 3,080 | $ | 5,471 | $ | 2,362 | $ | 3,080 | $ | 2,362 | |||||||||
18
T-Mobile US, Inc. Supplementary Operating and Financial Data
| Quarter | Six Months Ended June 30, | |||||||||||||||||||||||
| (in thousands) | Q1 2013 | Q2 2013 | Q3 2013 | Q4 2013 | Q1 2014 | Q2 2014 | 2013 | 2014 | ||||||||||||||||
| Customers, end of period | ||||||||||||||||||||||||
| Branded postpaid phone customers | 19,668 | 20,355 | 20,997 | 21,797 | 23,054 | 23,633 | 20,355 | 23,633 | ||||||||||||||||
| Branded postpaid mobile broadband customers | 426 | 428 | 433 | 502 | 568 | 897 | 428 | 897 | ||||||||||||||||
| Total branded postpaid customers | 20,094 | 20,783 | 21,430 | 22,299 | 23,622 | 24,530 | 20,783 | 24,530 | ||||||||||||||||
| Branded prepaid customers | 6,028 | 14,935 | 14,960 | 15,072 | 15,537 | 15,639 | 14,935 | 15,639 | ||||||||||||||||
| Total branded customers | 26,122 | 35,718 | 36,390 | 37,371 | 39,159 | 40,169 | 35,718 | 40,169 | ||||||||||||||||
| M2M customers | 3,290 | 3,423 | 3,430 | 3,602 | 3,822 | 4,047 | 3,423 | 4,047 | ||||||||||||||||
| MVNO customers | 4,556 | 4,875 | 5,219 | 5,711 | 6,094 | 6,329 | 4,875 | 6,329 | ||||||||||||||||
| Total wholesale customers | 7,846 | 8,298 | 8,649 | 9,313 | 9,916 | 10,376 | 8,298 | 10,376 | ||||||||||||||||
| Total customers, end of period | 33,968 | 44,016 | 45,039 | 46,684 | 49,075 | 50,545 | 44,016 | 50,545 | ||||||||||||||||
| Quarter | Six Months Ended June 30, | |||||||||||||||||||||||
| (in thousands) | Q1 2013 | Q2 2013 | Q3 2013 | Q4 2013 | Q1 2014 | Q2 2014 | 2013 | 2014 | ||||||||||||||||
| Net customer additions (losses) | ||||||||||||||||||||||||
| Branded postpaid phone customers | (190 | ) | 685 | 643 | 800 | 1,256 | 579 | 496 | 1,835 | |||||||||||||||
| Branded postpaid mobile broadband customers | (9 | ) | 3 | 5 | 69 | 67 | 329 | (6 | ) | 396 | ||||||||||||||
| Total branded postpaid customers | (199 | ) | 688 | 648 | 869 | 1,323 | 908 | 490 | 2,231 | |||||||||||||||
| Branded prepaid customers | 202 | (10 | ) | 24 | 112 | 465 | 102 | 191 | 567 | |||||||||||||||
| Total branded customers | 3 | 678 | 672 | 981 | 1,788 | 1,010 | 681 | 2,798 | ||||||||||||||||
| M2M customers | 200 | 133 | 7 | 172 | 220 | 225 | 333 | 445 | ||||||||||||||||
| MVNO customers | 376 | 319 | 344 | 492 | 383 | 235 | 695 | 618 | ||||||||||||||||
| Total wholesale customers | 576 | 452 | 351 | 664 | 603 | 460 | 1,028 | 1,063 | ||||||||||||||||
| Total net customer additions | 579 | 1,130 | 1,023 | 1,645 | 2,391 | 1,470 | 1,709 | 3,861 | ||||||||||||||||
| Acquired customers | — | 8,918 | — | — | — | — | 8,918 | — | ||||||||||||||||
Note: Certain customer numbers may not add due to rounding
| Quarter | Six Months Ended June 30, | |||||||||||||||||||||||
| Q1 2013 | Q2 2013 | Q3 2013 | Q4 2013 | Q1 2014 | Q2 2014 | 2013 | 2014 | |||||||||||||||||
| Branded postpaid phone churn | 1.9 | % | 1.5 | % | 1.7 | % | 1.6 | % | 1.5 | % | 1.5 | % | 1.7 | % | 1.5 | % | ||||||||
| Branded prepaid churn | 7.0 | % | 5.4 | % | 5.0 | % | 5.1 | % | 4.3 | % | 4.5 | % | 6.0 | % | 4.4 | % | ||||||||
19
T-Mobile US, Inc. Supplementary Operating and Financial Data (continued)
| Quarter | Six Months Ended June 30, | |||||||||||||||
| Q1 2013 | Q2 2013 | Q3 2013 | Q4 2013 | Q1 2014 | Q2 2014 | 2013 | 2014 | |||||||||
| Service revenues (in millions) | $4,005 | $4,756 | $5,138 | $5,169 | $5,337 | $5,484 | $8,762 | $10,821 | ||||||||
| Total revenues (in millions) | $4,677 | $6,228 | $6,688 | $6,827 | $6,875 | $7,185 | $10,905 | $14,060 | ||||||||
| Adjusted EBITDA (in millions) | $1,178 | $1,124 | $1,344 | $1,239 | $1,088 | $1,451 | $2,302 | $2,539 | ||||||||
| Adjusted EBITDA margin | 29% | 24% | 26% | 24% | 20% | 26% | 26% | 23% | ||||||||
| Net Income (loss) (in millions) | $107 | $(16) | $(36) | $(20) | $(151) | $391 | $91 | $240 | ||||||||
| Cash Capex - Property & Equipment (in millions) | $1,076 | $1,050 | $1,017 | $882 | $947 | $940 | $2,126 | $1,887 | ||||||||
| Branded postpaid phone ARPU | $54.50 | $54.04 | $52.62 | $51.13 | $50.48 | $49.32 | $54.26 | $49.89 | ||||||||
| Branded postpaid ABPU | $57.28 | $58.72 | $59.08 | $58.78 | $59.54 | $59.79 | $58.01 | $59.67 | ||||||||
| Branded prepaid ARPU | $28.25 | $34.78 | $35.71 | $35.84 | $36.09 | $37.16 | $32.61 | $36.63 | ||||||||
| Smartphone sales volume (in millions) | 2.2 | 4.3 | 5.6 | 6.2 | 6.9 | 6.2 | 6.5 | 13.1 | ||||||||
| Smartphone sales / phone sales | 75% | 86% | 88% | 91% | 92% | 93% | 82% | 92% | ||||||||
| Branded postpaid handset upgrade rate | 5% | 10% | 9% | 9% | 7% | 8% | 15% | 15% | ||||||||
| EIP Financed (in millions) | $298 | $811 | $1,011 | $1,207 | $1,249 | $1,342 | $1,109 | $2,591 | ||||||||
| EIP Billings (in millions) | $194 | $314 | $435 | $528 | $657 | $810 | $508 | $1,467 | ||||||||
| EIP Receivables (net) (in millions) | $774 | $1,292 | $1,867 | $2,546 | $3,086 | $3,583 | $1,292 | $3,583 | ||||||||
20
T-Mobile US, Inc.
Reconciliation of Non-GAAP Financial Measures to GAAP Financial Measures
(Unaudited)
This Investor Quarterly includes non-GAAP financial measures. The non-GAAP financial measures should be considered in addition to, but not as a substitute for, the information provided in accordance with GAAP. Reconciliations for the non-GAAP financial measures to the most directly comparable GAAP financial measures are provided below.
Adjusted EBITDA is reconciled to net income (loss) as follows:
| Quarter | Six Months Ended June 30, | ||||||||||||||||||||||||||||||
| (in millions) | Q1 2013 | Q2 2013 | Q3 2013 | Q4 2013 | Q1 2014 | Q2 2014 | 2013 | 2014 | |||||||||||||||||||||||
| Net income (loss) | $ | 107 | $ | (16 | ) | $ | (36 | ) | $ | (20 | ) | $ | (151 | ) | $ | 391 | $ | 91 | $ | 240 | |||||||||||
| Adjustments: | |||||||||||||||||||||||||||||||
| Interest expense to affiliates | 178 | 225 | 183 | 92 | 18 | 85 | 403 | 103 | |||||||||||||||||||||||
| Interest expense | 51 | 109 | 151 | 234 | 276 | 271 | 160 | 547 | |||||||||||||||||||||||
| Interest income | (35 | ) | (40 | ) | (50 | ) | (64 | ) | (75 | ) | (83 | ) | (75 | ) | (158 | ) | |||||||||||||||
| Other expense (income), net | 6 | (118 | ) | 7 | 16 | 6 | 12 | (112 | ) | 18 | |||||||||||||||||||||
| Income tax expense (benefit) | 72 | 21 | 42 | (119 | ) | (102 | ) | 286 | 93 | 184 | |||||||||||||||||||||
| Operating income (loss) | 379 | 181 | 297 | 139 | (28 | ) | 962 | 560 | 934 | ||||||||||||||||||||||
| Depreciation and amortization | 755 | 888 | 987 | 997 | 1,055 | 1,129 | 1,643 | 2,184 | |||||||||||||||||||||||
| MetroPCS transaction and integration costs | 13 | 26 | 12 | 57 | 12 | 22 | 39 | 34 | |||||||||||||||||||||||
| Restructuring costs | 31 | 23 | — | — | — | — | 54 | — | |||||||||||||||||||||||
| Stock-based compensation | — | 6 | 48 | 46 | 49 | 63 | 6 | 112 | |||||||||||||||||||||||
Other, net (1) | — | — | — | — | — | (725 | ) | — | (725 | ) | |||||||||||||||||||||
| Adjusted EBITDA | $ | 1,178 | $ | 1,124 | $ | 1,344 | $ | 1,239 | $ | 1,088 | $ | 1,451 | $ | 2,302 | $ | 2,539 | |||||||||||||||
Adjusted EBITDA of MetroPCS (2) | 291 | 141 | — | — | — | — | 432 | — | |||||||||||||||||||||||
| Pro Forma Combined Adjusted EBITDA | $ | 1,469 | $ | 1,265 | $ | 1,344 | $ | 1,239 | $ | 1,088 | $ | 1,451 | $ | 2,734 | $ | 2,539 | |||||||||||||||
| (1) | Other, net for second quarter of 2014 and the six months ended June 30, 2014 primarily represents the gain on spectrum swap transactions with Verizon completed in April 2014. Other, net transactions may not agree in total to the other, net classification in the condensed consolidated statements of comprehensive income primarily due to certain routine operating activities, such as insignificant routine spectrum license exchanges that would be expected to reoccur, and are therefore included in Adjusted EBITDA. |
| (2) | The Adjusted EBITDA of MetroPCS for the second quarter of 2013 reflects the Adjusted EBITDA of MetroPCS for April 2013 and is included for informational purposes to allow for a comparison of T-Mobile’s Adjusted EBITDA for periods following the completion of the business combination of T-Mobile USA and MetroPCS to pro forma combined Adjusted EBITDA for periods prior to the completion of the business combination. For the first quarter of 2013, the Adjusted EBITDA of MetroPCS reflects the amounts previously reported by MetroPCS. |
21
T-Mobile US, Inc.
Reconciliation of Non-GAAP Financial Measures to GAAP Financial Measures (continued)
(Unaudited)
The following schedule reflects the branded postpaid phone ARPU calculation and provides a reconciliation to total branded postpaid service revenues reported in T-Mobile's condensed consolidated statements of comprehensive income.
| Quarter | Six Months Ended June 30, | |||||||||||||||||||||||||||||||
| (in millions, except average number of branded postpaid phone customers and branded postpaid phone ARPU) | Q1 2013 | Q2 2013 | Q3 2013 | Q4 2013 | Q1 2014 | Q2 2014 | 2013 | 2014 | ||||||||||||||||||||||||
| Branded postpaid service revenues | $ | 3,263 | $ | 3,284 | $ | 3,302 | $ | 3,317 | $ | 3,447 | $ | 3,511 | $ | 6,547 | $ | 6,958 | ||||||||||||||||
| Less: Branded postpaid mobile broadband revenues | (44 | ) | (42 | ) | (41 | ) | (42 | ) | (47 | ) | (54 | ) | (86 | ) | (101 | ) | ||||||||||||||||
| Branded postpaid phone service revenues | $ | 3,219 | $ | 3,242 | $ | 3,261 | $ | 3,275 | $ | 3,400 | $ | 3,457 | $ | 6,461 | $ | 6,857 | ||||||||||||||||
| Divided by: Average number of branded postpaid phone customers (in thousands) and number of months in period | 19,689 | 19,999 | 20,657 | 21,352 | 22,447 | 23,368 | 19,844 | 22,908 | ||||||||||||||||||||||||
| Branded postpaid phone ARPU | $ | 54.50 | $ | 54.04 | $ | 52.62 | $ | 51.13 | $ | 50.48 | $ | 49.32 | $ | 54.26 | $ | 49.89 | ||||||||||||||||
The following schedule reflects the branded postpaid ABPU calculation and provides a reconciliation of the billings for branded postpaid customers used for the branded postpaid ABPU calculation to total branded postpaid service revenues reported in T-Mobile's condensed consolidated statements of comprehensive income.
| Quarter | Six Months Ended June 30, | |||||||||||||||||||||||||||||||
| (in millions, except average number of branded postpaid customers and branded postpaid ABPU) | Q1 2013 | Q2 2013 | Q3 2013 | Q4 2013 | Q1 2014 | Q2 2014 | 2013 | 2014 | ||||||||||||||||||||||||
| Branded postpaid service revenues | $ | 3,263 | $ | 3,284 | $ | 3,302 | $ | 3,317 | $ | 3,447 | $ | 3,511 | $ | 6,547 | $ | 6,958 | ||||||||||||||||
| Add: EIP billings | 194 | 314 | 435 | 528 | 657 | 810 | 508 | 1,467 | ||||||||||||||||||||||||
| Total billings for branded postpaid customers | $ | 3,457 | $ | 3,598 | $ | 3,737 | $ | 3,845 | $ | 4,104 | $ | 4,321 | $ | 7,055 | $ | 8,425 | ||||||||||||||||
| Divided by: Average number of branded postpaid customers (in thousands) and number of months in period | 20,117 | 20,425 | 21,084 | 21,805 | 22,975 | 24,092 | 20,271 | 23,533 | ||||||||||||||||||||||||
| Branded postpaid ABPU | $ | 57.28 | $ | 58.72 | $ | 59.08 | $ | 58.78 | $ | 59.54 | $ | 59.79 | $ | 58.01 | $ | 59.67 | ||||||||||||||||
22
Pro Forma Combined Results
The following pages contain certain pro forma combined financial and other operating data for periods through the second quarter of 2013 that are presented solely for informational purposes to provide comparative customer and financial trends since the business combination of T-Mobile USA and MetroPCS was completed for the combined company. The pro forma combined amounts for periods through and including the second quarter of 2013 were created by combining certain financial results and other operating data of the individual entities for the relevant periods. The pro forma combined financial data have not been determined in accordance with the requirements of Article 11 of Regulation S-X. The following pages also include reconciliations for certain additional non-GAAP financial measures to the most directly comparable GAAP financial measures.
23
T-Mobile US, Inc. Supplementary Pro Forma Combined Operating and Financial Data
| Quarter | Six Months Ended June 30, | |||||||||||||||||||||||
| (in thousands) | Q1 2013 | Q2 2013 | Q3 2013 | Q4 2013 | Q1 2014 | Q2 2014 | 2013 | 2014 | ||||||||||||||||
| Customers, end of period | ||||||||||||||||||||||||
| Branded postpaid phone customers | 19,668 | 20,355 | 20,997 | 21,797 | 23,054 | 23,633 | 20,355 | 23,633 | ||||||||||||||||
| Branded postpaid mobile broadband customers | 426 | 428 | 433 | 502 | 568 | 897 | 428 | 897 | ||||||||||||||||
| Total branded postpaid customers | 20,094 | 20,783 | 21,430 | 22,299 | 23,622 | 24,530 | 20,783 | 24,530 | ||||||||||||||||
| Branded prepaid customers | 15,023 | 14,935 | 14,960 | 15,072 | 15,537 | 15,639 | 14,935 | 15,639 | ||||||||||||||||
| Total branded customers | 35,117 | 35,718 | 36,390 | 37,371 | 39,159 | 40,169 | 35,718 | 40,169 | ||||||||||||||||
| M2M customers | 3,290 | 3,423 | 3,430 | 3,602 | 3,822 | 4,047 | 3,423 | 4,047 | ||||||||||||||||
| MVNO customers | 4,556 | 4,875 | 5,219 | 5,711 | 6,094 | 6,329 | 4,875 | 6,329 | ||||||||||||||||
| Total wholesale customers | 7,846 | 8,298 | 8,649 | 9,313 | 9,916 | 10,376 | 8,298 | 10,376 | ||||||||||||||||
| Total customers, end of period | 42,963 | 44,016 | 45,039 | 46,684 | 49,075 | 50,545 | 44,016 | 50,545 | ||||||||||||||||
| Quarter | Six Months Ended June 30, | |||||||||||||||||||||||
| (in thousands) | Q1 2013 | Q2 2013 | Q3 2013 | Q4 2013 | Q1 2014 | Q2 2014 | 2013 | 2014 | ||||||||||||||||
| Net customer additions (losses) | ||||||||||||||||||||||||
| Branded postpaid phone customers | (190 | ) | 685 | 643 | 800 | 1,256 | 579 | 496 | 1,835 | |||||||||||||||
| Branded postpaid mobile broadband customers | (9 | ) | 3 | 5 | 69 | 67 | 329 | (6 | ) | 396 | ||||||||||||||
| Total branded postpaid customers | (199 | ) | 688 | 648 | 869 | 1,323 | 908 | 490 | 2,231 | |||||||||||||||
| Branded prepaid customers | 310 | (87 | ) | 24 | 112 | 465 | 102 | 222 | 567 | |||||||||||||||
| Total branded customers | 111 | 601 | 672 | 981 | 1,788 | 1,010 | 712 | 2,798 | ||||||||||||||||
| M2M customers | 200 | 133 | 7 | 172 | 220 | 225 | 333 | 445 | ||||||||||||||||
| MVNO customers | 376 | 319 | 344 | 492 | 383 | 235 | 695 | 618 | ||||||||||||||||
| Total wholesale customers | 576 | 452 | 351 | 664 | 603 | 460 | 1,028 | 1,063 | ||||||||||||||||
| Total net customer additions | 687 | 1,053 | 1,023 | 1,645 | 2,391 | 1,470 | 1,740 | 3,861 | ||||||||||||||||
Note: Certain customer numbers may not add due to rounding
| Quarter | Six Months Ended June 30, | |||||||||||||||||||||||
| Q1 2013 | Q2 2013 | Q3 2013 | Q4 2013 | Q1 2014 | Q2 2014 | 2013 | 2014 | |||||||||||||||||
| Branded postpaid phone churn | 1.9 | % | 1.5 | % | 1.7 | % | 1.6 | % | 1.5 | % | 1.5 | % | 1.7 | % | 1.5 | % | ||||||||
| Branded prepaid churn | 4.4 | % | 4.9 | % | 5.0 | % | 5.1 | % | 4.3 | % | 4.5 | % | 4.7 | % | 4.4 | % | ||||||||
All historical and current porting activity between the T-Mobile and MetroPCS brands has been removed from deactivations and treated as migration activity between brands/products, consistent with the treatment of the combined business. The effect of this treatment lowers the churn rates for both branded postpaid and branded prepaid customer bases.
24
T-Mobile US, Inc. Supplementary Pro Forma Combined Operating and Financial Data (continued)
| Quarter | Six Months Ended June 30, | |||||||||||||||
| Q1 2013 | Q2 2013 | Q3 2013 | Q4 2013 | Q1 2014 | Q2 2014 | 2013 | 2014 | |||||||||
| Service revenues (in millions) | $5,106 | $5,122 | $5,138 | $5,169 | $5,337 | $5,484 | $10,229 | $10,821 | ||||||||
| Thereof, branded postpaid revenues (in millions) | $3,263 | $3,284 | $3,302 | $3,317 | $3,447 | $3,511 | $6,547 | $6,958 | ||||||||
| Thereof, branded prepaid revenues (in millions) | $1,604 | $1,608 | $1,594 | $1,606 | $1,648 | $1,736 | $3,212 | $3,384 | ||||||||
| Total revenues (in millions) | $5,964 | $6,651 | $6,688 | $6,827 | $6,875 | $7,185 | $12,615 | $14,060 | ||||||||
| Adjusted EBITDA (in millions) | $1,469 | $1,265 | $1,344 | $1,239 | $1,088 | $1,451 | $2,734 | $2,539 | ||||||||
| Adjusted EBITDA margin | 29% | 25% | 26% | 24% | 20% | 26% | 27% | 23% | ||||||||
| Cash Capex - Property & Equipment (in millions) | $1,230 | $1,111 | $1,017 | $882 | $947 | $940 | $2,341 | $1,887 | ||||||||
| Branded postpaid phone ARPU | $54.50 | $54.04 | $52.62 | $51.13 | $50.48 | $49.32 | $54.26 | $49.89 | ||||||||
| Branded prepaid ARPU | $35.87 | $35.97 | $35.71 | $35.84 | $36.09 | $37.16 | $35.92 | $36.63 | ||||||||
| Three Months Ended | ||||||||||||||||||||
| (in millions, except net debt ratio) | Jun 30, 2013 | Sep 30, 2013 | Dec 31, 2013 | Mar 31, 2014 | Jun 30, 2014 | |||||||||||||||
| Net Debt (excluding Tower Obligations) to Last Twelve Months Adjusted EBITDA Ratio | ||||||||||||||||||||
| Short-term debt | $ | 210 | $ | 195 | $ | 244 | $ | 151 | $ | 272 | ||||||||||
| Long-term debt to affiliates | 11,200 | 11,200 | 5,600 | 5,600 | 5,600 | |||||||||||||||
| Long-term debt | 6,276 | 6,761 | 14,345 | 14,331 | 14,369 | |||||||||||||||
| Less: Cash and cash equivalents | (2,362 | ) | (2,365 | ) | (5,891 | ) | (5,471 | ) | (3,080 | ) | ||||||||||
| Net Debt (excluding Tower Obligations) | $ | 15,324 | $ | 15,791 | $ | 14,298 | $ | 14,611 | $ | 17,161 | ||||||||||
| Last twelve months Adjusted EBITDA * | 5,781 | 5,433 | 5,317 | 4,936 | 5,122 | |||||||||||||||
| Net Debt (excluding Tower Obligations) to Last Twelve Months Adjusted EBITDA Ratio | 2.7 | 2.9 | 2.7 | 3.0 | 3.4 | |||||||||||||||
| * Pro Forma Combined EBITDA | ||||||||||||||||||||
25
Pro Forma Combined Reconciliations
| Quarter | Six Months Ended June 30, | |||||||||||||||||||||||||||||||
| (in millions) | Q1 2013 | Q2 2013 | Q3 2013 | Q4 2013 | Q1 2014 | Q2 2014 | 2013 | 2014 | ||||||||||||||||||||||||
| Service Revenues | ||||||||||||||||||||||||||||||||
T-Mobile (1) | $ | 4,005 | $ | 4,756 | $ | 5,138 | $ | 5,169 | $ | 5,337 | $ | 5,484 | $ | 8,762 | $ | 10,821 | ||||||||||||||||
| MetroPCS | 1,101 | 366 | — | — | — | — | 1,467 | — | ||||||||||||||||||||||||
| Total service revenues | $ | 5,106 | $ | 5,122 | $ | 5,138 | $ | 5,169 | $ | 5,337 | $ | 5,484 | $ | 10,229 | $ | 10,821 | ||||||||||||||||
| Branded Revenues | ||||||||||||||||||||||||||||||||
T-Mobile (1) | $ | 3,766 | $ | 4,526 | $ | 4,896 | $ | 4,923 | $ | 5,095 | $ | 5,247 | $ | 8,292 | $ | 10,342 | ||||||||||||||||
| MetroPCS | 1,101 | 366 | — | — | — | — | 1,467 | — | ||||||||||||||||||||||||
| Total branded revenues | $ | 4,867 | $ | 4,892 | $ | 4,896 | $ | 4,923 | $ | 5,095 | $ | 5,247 | $ | 9,759 | $ | 10,342 | ||||||||||||||||
| Branded Prepaid Revenues | ||||||||||||||||||||||||||||||||
T-Mobile (1) | $ | 503 | $ | 1,242 | $ | 1,594 | $ | 1,606 | $ | 1,648 | $ | 1,736 | $ | 1,745 | $ | 3,384 | ||||||||||||||||
| MetroPCS | 1,101 | 366 | — | — | — | — | 1,467 | — | ||||||||||||||||||||||||
| Total branded prepaid revenues | $ | 1,604 | $ | 1,608 | $ | 1,594 | $ | 1,606 | $ | 1,648 | $ | 1,736 | $ | 3,212 | $ | 3,384 | ||||||||||||||||
| Total Revenues | ||||||||||||||||||||||||||||||||
T-Mobile (1) | $ | 4,677 | $ | 6,228 | $ | 6,688 | $ | 6,827 | $ | 6,875 | $ | 7,185 | $ | 10,905 | $ | 14,060 | ||||||||||||||||
| MetroPCS | 1,287 | 423 | — | — | — | — | 1,710 | — | ||||||||||||||||||||||||
| Total revenues | $ | 5,964 | $ | 6,651 | $ | 6,688 | $ | 6,827 | $ | 6,875 | $ | 7,185 | $ | 12,615 | $ | 14,060 | ||||||||||||||||
| Quarter | Six Months Ended June 30, | |||||||||||||||||||||||||||||||
| (in millions) | Q1 2013 | Q2 2013 | Q3 2013 | Q4 2013 | Q1 2014 | Q2 2014 | 2013 | 2014 | ||||||||||||||||||||||||
| Cash Capex - Property & Equipment | ||||||||||||||||||||||||||||||||
T-Mobile (1) | $ | 1,076 | $ | 1,050 | $ | 1,017 | $ | 882 | $ | 947 | $ | 940 | $ | 2,126 | $ | 1,887 | ||||||||||||||||
| MetroPCS | 154 | 61 | — | — | — | — | 215 | — | ||||||||||||||||||||||||
| Total Cash Capex - Property & Equipment | $ | 1,230 | $ | 1,111 | $ | 1,017 | $ | 882 | $ | 947 | $ | 940 | $ | 2,341 | $ | 1,887 | ||||||||||||||||
| (1) The second quarter of 2013 represents the results for T-Mobile USA for April, 2013 and the results for T-Mobile USA and MetroPCS on a combined basis for May and June 2013, as the business combination was completed on April 30, 2013. | ||||||||||||||||||||||||||||||||
| Quarter | Six Months Ended June 30, | |||||||||||||||||||||||||||||||
| (in millions) | Q1 2013 | Q2 2013 | Q3 2013 | Q4 2013 | Q1 2014 | Q2 2014 | 2013 | 2014 | ||||||||||||||||||||||||
| Simple Free Cash Flow | ||||||||||||||||||||||||||||||||
| Pro Forma Combined Adjusted EBITDA | $ | 1,469 | $ | 1,265 | $ | 1,344 | $ | 1,239 | $ | 1,088 | $ | 1,451 | $ | 2,734 | $ | 2,539 | ||||||||||||||||
| Pro Forma Combined Total Cash Capex - Property & Equipment | 1,230 | 1,111 | 1,017 | 882 | 947 | 940 | 2,341 | 1,887 | ||||||||||||||||||||||||
| Simple Free Cash Flow | $ | 239 | $ | 154 | $ | 327 | $ | 357 | $ | 141 | $ | 511 | $ | 393 | $ | 652 | ||||||||||||||||
Forward-Looking Statements
This Investor Quarterly includes "forward-looking statements" within the meaning of the U.S. federal securities laws. Any statements made herein that are not statements of historical fact, including statements about T-Mobile US, Inc.'s plans, outlook, beliefs, opinion, projections, guidance, strategy, integration of MetroPCS, expected network modernization and other advancements, are forward-looking statements. Generally, forward-looking statements may be identified by words such as "anticipate," "expect," "suggests," "plan," "project," "believe," "intend," "estimates," "targets," "views," "may," "will," "forecast," and other similar expressions. The forward-looking statements speak only as of the date made, are based on current assumptions and expectations, and involve a number of risks and uncertainties. Important factors that could affect future results and cause those results to differ materially from those expressed in the forward-looking statements include, among others, the following: T-Mobile's ability to compete in the highly competitive U.S. wireless telecommunications industry; adverse conditions in the U.S. and international economies and markets; significant capital commitments and the capital expenditures required to effect T-Mobile's business plan; T-Mobile's ability to adapt to future changes in technology, enhance existing offerings, and introduce new offerings to address customers' changing demands; changes in legal and regulatory requirements, including any change or increase in restrictions on T-Mobile's ability to operate its network; T-Mobile's ability to successfully maintain and improve its network, and the possibility of incurring additional costs in doing so; major equipment failures; severe weather conditions or other force majeure events; and other risks described in T-Mobile's filings with the Securities and Exchange Commission, including those described in T-Mobile's Annual Report on Form 10-K filed with the Securities and Exchange Commission on February 25, 2014. You should not place undue reliance on these forward-looking statements. T-Mobile does not undertake to update forward-looking statements, whether as a result of new information, future events or otherwise, except as required by law.
About T-Mobile US, Inc.
As America's Un-carrier, T-Mobile US, Inc. (NYSE: TMUS) is redefining the way consumers and businesses buy wireless services through leading product and service innovation. The Company's advanced nationwide 4G LTE network delivers outstanding wireless experiences for customers who are unwilling to compromise on quality and value. Based in Bellevue, Washington, T-Mobile US, Inc. provides services through its subsidiaries and operates its flagship brands, T-Mobile and MetroPCS. It currently serves approximately 50.5 million wireless customers and provides products and services through approximately 70,000 total points of distribution. For more information, please visit: http://www.T-Mobile.com.
Press Contact: | Investor Relations Contact: | |
| Media Relations | Nils Paellmann | |
| T-Mobile US, Inc. | T-Mobile US, Inc. | |
| mediarelations@t-mobile.com | 877-281-TMUS or 212-358-3210 | |
| http://newsroom.t-mobile.com | investor.relations@t-mobile.com | |
| http://investor.t-mobile.com | ||
26
Definitions of Terms
Operating and financial measures are utilized by T-Mobile's management to evaluate its operating performance and, in certain cases, its ability to meet liquidity requirements. Although companies in the wireless industry may not define measures in precisely the same way, T-Mobile believes the measures facilitate key operating performance comparisons with other companies in the wireless industry.
| 1. | Customer - SIM card with a unique T-Mobile mobile identity number which generates revenue. Branded customers generally include customers that are qualified either for postpaid service, where they generally pay after incurring service, or prepaid service, where they generally pay in advance. Wholesale customers include Machine-to-Machine (“M2M”) and Mobile Virtual Network Operator (“MVNO”) customers that operate on T-Mobile's network, but are managed by wholesale partners. |
| 2. | Churn - Number of customers whose service was discontinued as a percentage of the average number of customers during the specified period. T-Mobile believes churn provides management with useful information to evaluate customer retention and loyalty. |
| 3. | Average Revenue Per User (“ARPU”) - Average monthly service revenue earned from customers. Service revenues for the specified period divided by the average customers during the period, further divided by the number of months in the period. T-Mobile believes ARPU provides management with useful information to assess its per-customer service revenue realization and to assist in forecasting its future service revenues, and evaluate the average monthly service revenues generated from its customer base. |
Branded postpaid Average Billings per User ("ABPU") - Average monthly branded postpaid service revenue earned from customers plus equipment installment plan ("EIP") billings divided by the average branded postpaid customers during the period, further divided by the number of months in the period. T-Mobile believes ABPU provides management, investors, and analysts with useful information to evaluate average per-branded postpaid customer billings as it approximates the expected cash collections, including equipment installments, from T-Mobile's customers each month.
Service revenues - Postpaid, including handset insurance, prepaid, wholesale, and roaming and other service revenues.
| 4. | Cost of services - Costs to operate and maintain T-Mobile's networks, including direct switch and cell site costs, such as rent, fixed line costs, utilities, maintenance, and labor costs associated with network employees; long distance costs; regulatory fees; roaming fees paid to other carriers; fixed and variable costs paid to third parties for the use of proprietary data applications. |
Cost of equipment sales - Costs to sell T-Mobile's equipment, including equipment, accessories, inventory adjustments, shipping, and warranty expenses.
Selling, general and administrative expenses - Salaries and wages and benefits not directly attributable to a service or product; bad debt charges; taxes other than income taxes; advertising and sales commission costs; customer billing; call center and information technology costs; regulatory fees, professional service fees; and rent and utilities for administrative space.
| 5. | Adjusted EBITDA - Earnings before interest expense (net of interest income), tax, depreciation, amortization, stock-based compensation and expenses not reflective of T-Mobile's ongoing operating performance. Adjusted EBITDA margin is Adjusted EBITDA divided by service revenues. Adjusted EBITDA is a non-GAAP financial measure utilized by T-Mobile's management to monitor the financial performance of its operations. T-Mobile uses Adjusted EBITDA internally as a metric to evaluate and compensate its personnel and management for their performance, and as a benchmark to evaluate T-Mobile's operating performance in comparison to its competitors. Management also uses Adjusted EBITDA to measure its ability to provide cash flows to meet future debt service, capital expenditures and working capital requirements, and to fund future growth. T-Mobile believes analysts and investors use Adjusted EBITDA as a supplemental measure to evaluate overall operating performance and facilitate comparisons with other wireless communications companies. Adjusted EBITDA has limitations as an analytical tool and should not be considered in isolation or as a substitute for income from operations, net income, or any other measure of financial performance reported in accordance with GAAP. The reconciliation of Adjusted EBITDA to net income (loss) is detailed in the Reconciliation of Non-GAAP Financial Measures to GAAP Financial Measures schedule. |
| 6. | Cash capital expenditures - Amounts paid for construction and the purchase of property and equipment. |
| 7. | Smartphones are defined as UMTS/HSPA/HSPA+ 21/HSPA+ 42/4G LTE enabled converged devices, which integrate voice and data services. |
| 8. | Simple Free Cash Flow - Adjusted EBITDA less cash capital expenditures. Simple Free Cash Flow is utilized by management as a measure of liquidity and an indicator of how much cash is generated from the ordinary course of business operations. Simple free cash flow should not be construed as an alternative to cash flows from operating activities as determined in accordance with GAAP. |
| 9. | Net debt - Short-term debt, long-term debt to affiliates, and long-term debt (excluding tower obligations), less cash and cash equivalents. |
27