EXHIBIT 99.2
CUSTOMER METRICS
Branded Postpaid Customers
| |
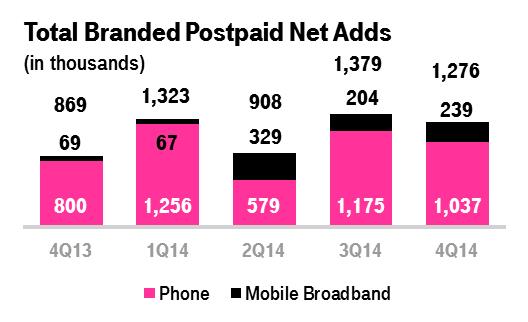
| ▪ | Branded postpaid net customer additions were 1,276,000 in the fourth quarter of 2014 compared to 1,379,000 in the third quarter of 2014 and 869,000 in the fourth quarter of 2013. This marked the third quarter of the year in which branded postpaid net customer additions were greater than one million, a clear indicator of the continued success of the Un-carrier initiatives and strong uptake of promotions for services and devices. |
| |
| ▪ | T-Mobile again led the industry in branded postpaid phone net customer additions with 1,037,000 in the fourth quarter of 2014, compared to 1,175,000 in the third quarter of 2014 and 800,000 in the fourth quarter of 2013. Branded postpaid phone gross additions in the fourth quarter of 2014 declined by 1% on a sequential basis, but were up 30% year-over-year. T-Mobile captured nearly 80% of the industry’s postpaid phone growth in the fourth quarter of 2014. |
| |
| ▪ | Branded postpaid mobile broadband net customer additions were 239,000 in the fourth quarter of 2014, compared to 204,000 in the third quarter of 2014 and 69,000 in the fourth quarter of 2013. |
| |
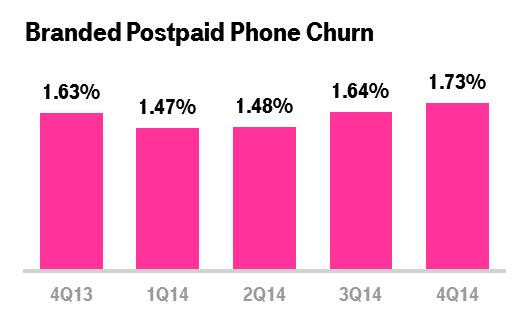
| ▪ | Branded postpaid phone churn was 1.73% in the fourth quarter of 2014, up 9 basis points compared to the third quarter of 2014 and up 10 basis points compared to the fourth quarter of 2013. Sequentially and year-over-year, the increase in branded postpaid phone churn was primarily due to increased competition and promotions in the marketplace during the fourth quarter of 2014. |
| |
| ▪ | For the full-year 2014, branded postpaid net customer additions were 4,886,000 compared to 2,006,000 in 2013, exceeding the high end of the guidance range of 4.3 million to 4.7 million provided in connection with the third quarter 2014 earnings. For the full-year 2014, branded postpaid phone net customer additions were 4,047,000 compared to 1,938,000 in 2013. T-Mobile captured nearly 100% of the industry’s postpaid phone growth in 2014. |
| |
| ▪ | Branded postpaid phone churn was 1.58% for the full-year 2014, down 11 basis points compared to 1.69% for 2013 primarily due to the continued success of Un-carrier initiatives resulting in increased customer loyalty. |
Branded Prepaid Customers
| |
| ▪ | Branded prepaid net customer additions were 266,000 in the fourth quarter of 2014, compared to 411,000 in the third quarter of 2014 and 112,000 in the fourth quarter of 2013. Sequentially, the decline in branded prepaid net customer additions was due to increased competition and promotions in the marketplace, which principally impacted the T-Mobile prepaid brand. Net customer additions for the MetroPCS brand in the fourth quarter of 2014 were up significantly on a sequential basis. Year-over-year, the increase in branded prepaid net customer additions was primarily due to the expansion of the MetroPCS brand to additional markets and the successful execution of promotions. |
| |
| ▪ | Migrations to branded postpaid plans reduced branded prepaid net customer additions in the fourth quarter of 2014 by approximately 120,000, up from 110,000 in the third quarter of 2014 and flat compared to the fourth quarter of 2013. |
| |
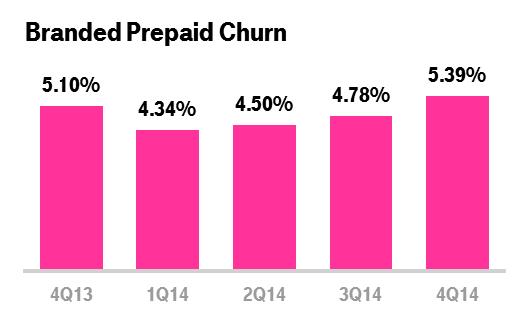
| ▪ | Branded prepaid churn was 5.39% in the fourth quarter of 2014, up 61 basis points from 4.78% in the third quarter of 2014 and up 29 basis points from 5.10% in the fourth quarter of 2013. Sequentially and year-over-year, the increase in churn was primarily due to increased competition and promotions in the marketplace. |
| |
| ▪ | For the full-year 2014, branded prepaid net customer additions were 1,244,000 compared to 359,000 in 2013 on a pro forma combined basis, as growth of the MetroPCS brand and expansion into additional markets drove strong results. Branded prepaid churn was 4.76% for the full-year 2014, down 8 basis points compared to the pro forma combined 4.84% branded prepaid churn reported for 2013. |
Total Branded Customers
| |
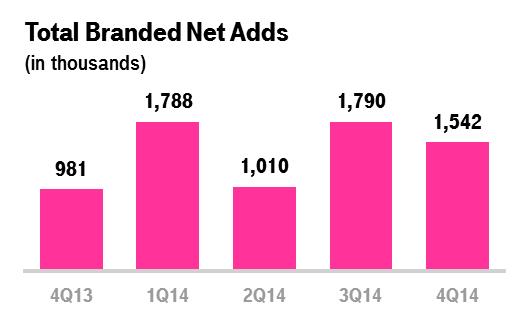
| ▪ | Total branded net customer additions were 1,542,000 in the fourth quarter of 2014 compared to 1,790,000 in the third quarter of 2014 and 981,000 in the fourth quarter of 2013. This was the fourth consecutive quarter in which branded net customer additions surpassed the one million milestone. |
| |
| ▪ | For the full-year 2014, total branded net customer additions were 6,130,000 compared to 2,365,000 in 2013 on a pro forma combined basis, as growth in branded postpaid more than doubled and growth in branded prepaid more than tripled. |
Wholesale Customers
| |
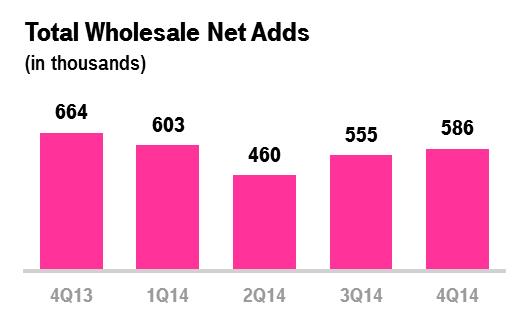
| ▪ | Total wholesale net customer additions were 586,000 in the fourth quarter of 2014 compared to 555,000 in the third quarter of 2014 and 664,000 in the fourth quarter of 2013. |
| |
| ▪ | MVNO net customer additions were 434,000 in the fourth quarter of 2014 compared to 333,000 in the third quarter of 2014 and 492,000 in the fourth quarter of 2013. |
| |
| ▪ | M2M net customer additions were 152,000 in the fourth quarter of 2014 compared to 222,000 in the third quarter of 2014 and 172,000 in the fourth quarter of 2013. |
| |
| ▪ | For the full-year 2014, total wholesale net customer additions were 2,204,000 compared to 2,043,000 in 2013. |
Total Customers
| |
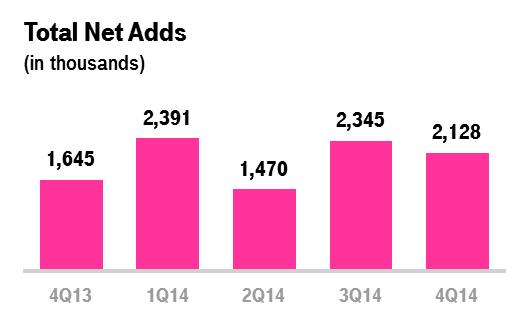
| ▪ | Total net customer additions were 2,128,000 in the fourth quarter of 2014 compared to 2,345,000 in the third quarter of 2014 and 1,645,000 in the fourth quarter of 2013. This was the third quarter of the year in which total net customer additions exceeded two million. |
| |
| ▪ | T-Mobile has added over 12 million total customers over the last 7 quarters, since the launch of the Un-carrier initiatives. |
| |
| ▪ | Total customers at the end of 2014 were more than 55.0 million. |
| |
| ▪ | For the full-year 2014, total net customer additions were 8,334,000 compared to 4,408,000 in 2013 on a pro forma combined basis. |
NETWORK
Network Modernization Update
| |
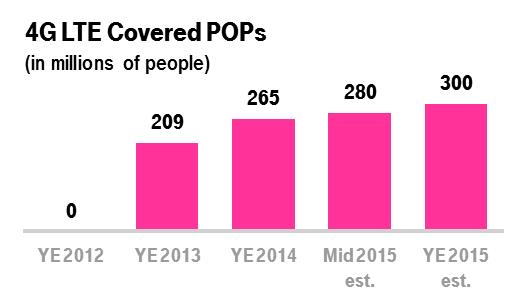
| ▪ | At year-end 2014, T-Mobile’s 4G LTE network covered 265 million people, exceeding its original year-end 2014 target of 250 million people. |
| |
| ▪ | T-Mobile is upgrading its remaining 2G only footprint by adding 4G LTE, and expects that this network modernization will result in 4G LTE network coverage of more than 280 million people by mid-2015. |
| |
| ▪ | The Company is targeting a total 4G LTE population coverage of 300 million people by year-end 2015. |
| |
| ▪ | Wideband LTE, which refers to markets that have bandwidth of at least 15+15 MHz dedicated to 4G LTE, is currently available in 121 market areas and is expected to be available in over 150 market areas by year-end 2015. Customers in Wideband LTE markets are regularly observing peak speeds in the 70 Mbps range, with maximum real-world speeds in excess of 145 Mbps. |
| |
| ▪ | T-Mobile has also commenced work with its partners to bring Licensed Assisted Access (“LAA”) to production trials in 2015. LAA is a new 4G LTE technology that combines licensed and unlicensed spectrum bands to increase speeds and reduce packet latencies. In essence, LAA brings LTE’s efficiencies to the unlicensed spectrum band in a way that complements Wi-Fi yet provides far greater coverage performance. |
Network Speed
| |
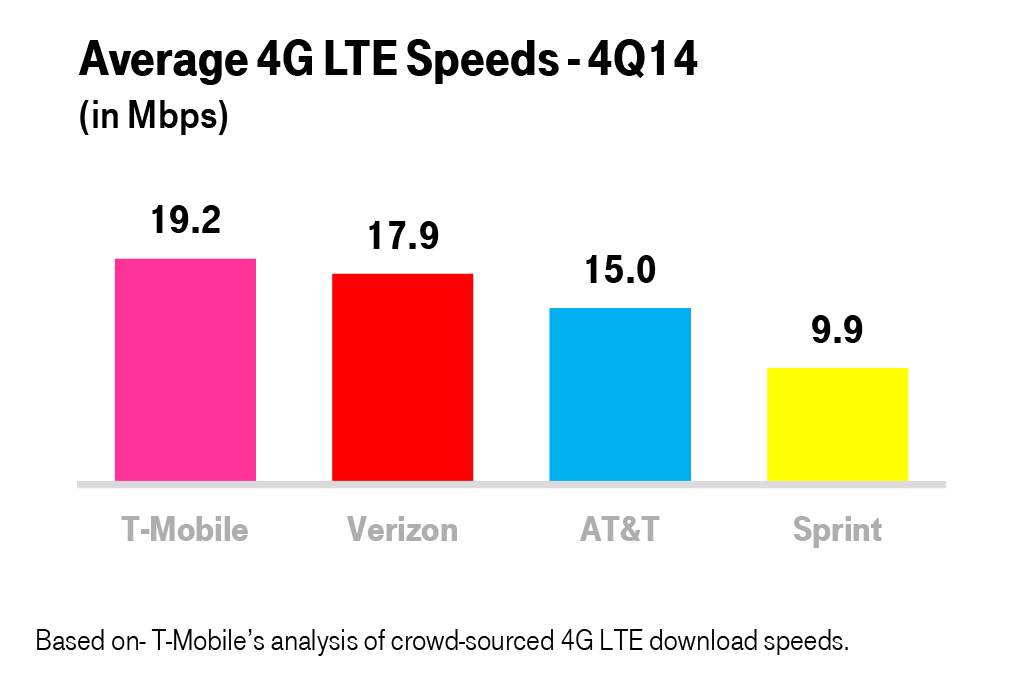
| ▪ | T-Mobile has the fastest nationwide 4G LTE network in the U.S. based on download speed from millions of user-generated test. This is the fourth consecutive quarter that T-Mobile has led the industry in download speeds. |
| |
| ▪ | In the fourth quarter of 2014, T-Mobile’s average 4G LTE download speed was 19.2 Mbps compared to Verizon at 17.9 Mbps, AT&T at 15.0 Mbps, and Sprint at 9.9 Mbps. |
| |
| ▪ | T-Mobile’s average 4G LTE download speed in the fourth quarter of 2014 was 7% faster than Verizon, 28% faster than AT&T, and nearly twice as fast as Sprint. |
Spectrum
| |
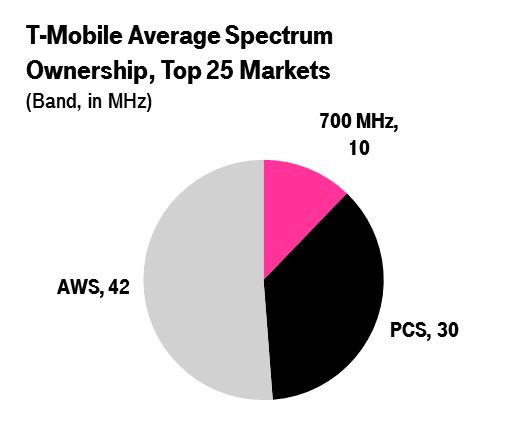
| ▪ | At year-end 2014, T-Mobile owned an average of 82 MHz of spectrum across the top 25 markets in the U.S. This was comprised of 10 MHz in the 700 MHz band, 30 MHz in the 1900 MHz PCS band, and 42 MHz in the AWS band. |
| |
| ▪ | In January 2015, the FCC announced that T-Mobile was the winning bidder of AWS-3 spectrum licenses covering approximately 97 million people for an aggregate bid price of $1.8 billion. T-Mobile will pay the FCC $1.4 billion for the AWS-3 spectrum licenses in March 2015, which is net of the $0.4 billion deposit paid to the FCC in October 2014. T-Mobile expects to receive the AWS-3 spectrum licenses, subject to regulatory approval, in the second quarter of 2015. |
| |
| ▪ | The Company expects to be a participant in future FCC spectrum auctions including the broadcast incentive auction. |
A-Block Update
| |
| ▪ | T-Mobile owns or has agreements to own 700 MHz A-Block spectrum covering 190 million people or approximately 60% of the U.S. population and more than 70% of the Company’s existing customer base. The spectrum covers 9 of the top 10 market areas and 24 of the top 30 market areas in the U.S. |
| |
| ▪ | T-Mobile has started deploying its 700 MHz A-Block spectrum with service launched in Washington D.C., Minneapolis, Cleveland, and Colorado Springs in 2014 and Dallas and Houston so far in 2015. The Company expects to continue to aggressively roll-out new 700 MHz sites going forward. |
| |
| ▪ | Several Band 12 capable handsets, including the Samsung Note 4, are currently available in the market. More Band 12 capable handsets are expected to become available in the first half of 2015. |
| |
| ▪ | Approximately 75% of the population covered by the Company’s A-Block spectrum is free and clear and ready to be deployed or will be ready for deployment in the first half of 2015. The remainder is encumbered by Channel 51 broadcasts, generally limiting T-Mobile’s ability to use the spectrum until after the broadcast incumbencies are resolved. The Company has already entered into agreements to relocate broadcasters to new frequencies or operate concurrently in 10 markets covering more than 41 million people, making those markets available for launch in 2015. |
METROPCS
Integration and Expansion
| |
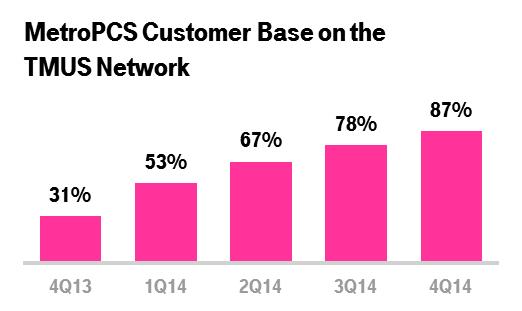
| ▪ | The MetroPCS customer base continues to rapidly migrate off the legacy CDMA network. At the end of the fourth quarter of 2014, 87% of the total MetroPCS customer base was on the T-Mobile network compared to 78% at the end of the third quarter of 2014. |
| |
| ▪ | Approximately 73% of the MetroPCS spectrum on a MHz/POP basis has already been re-farmed and integrated into the T-Mobile network at the end of the fourth quarter of 2014 compared to 63% at the end of the third quarter of 2014. |
| |
| ▪ | At year-end 2014, MetroPCS was available in 55 markets, up from 15 at the time of the business combination. |
| |
| ▪ | MetroPCS added 500 new points of sale in the fourth quarter of 2014, bringing the total to 4,500 in the 40 expansion markets and nearly 11,000 MetroPCS points of sale nationwide. |
Synergies and Integration Costs
| |
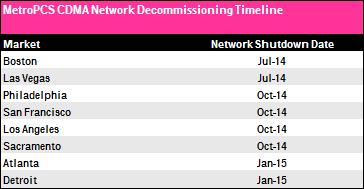
| ▪ | In the fourth quarter of 2014, T-Mobile decommissioned the CDMA portion of the MetroPCS networks in Philadelphia, Los Angeles, San Francisco, and Sacramento. Total network decommissioning costs were $263 million in 2014, of which $97 million was recognized in the third quarter of 2014 and $166 million was recognized in the fourth quarter of 2014. Network decommissioning costs primarily relate to the acceleration of lease costs for decommissioned cell sites, and are excluded from Adjusted EBITDA. |
| |
| ▪ | In 2015, the Company has already decommissioned the CDMA portion of the MetroPCS networks in Atlanta and the Detroit metro area, bringing the overall total to 8 market shutdowns since the close of the business combination. The Company expects to complete the shutdown of all the remaining CDMA markets by the second half of 2015. These network shutdowns will provide the CDMA customers of MetroPCS with access to a faster 4G LTE network, free up spectrum that can be re-used to further improve the speed and quality of the T-Mobile network, and enable the Company to realize the synergies from running a single network structure. |
| |
| ▪ | The Company expects to incur network decommissioning costs in the range of $500 million to $600 million to complete the shutdown of the remaining CMDA markets. Substantially all of these network decommissioning costs are expected to be incurred in 2015. |
| |
| ▪ | Total one-time network costs, both opex and capex, since the MetroPCS business combination are now expected to be between $1.5 billion and $1.7 billion, which is $600 million to $750 million lower than the original synergy guidance given at the time of the business combination. |
| |
| ▪ | At the time the business combination with MetroPCS was announced, the original projected synergy target called for $1.5 billion in annual run-rate synergies to be realized by the fifth year after the transaction close. The Company now expects to reach full run-rate synergies of at least $1.5 billion by 2016, more than one year ahead of the original plan. |
| |
| ▪ | Given the accelerated timeline in synergy realization, the Company now expects the net present value of the synergies to be between $9 and $10 billion, up from the original projection of $6 to $7 billion. |
UN-CARRIER INITIATIVES
| |
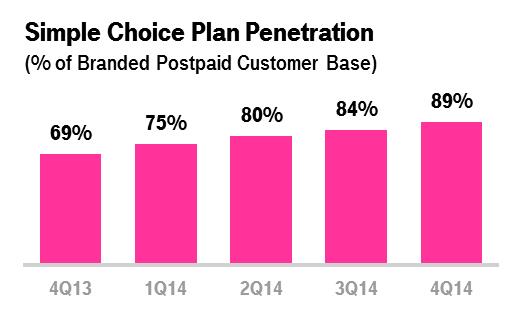
| ▪ | At the end of the fourth quarter of 2014, 89% of the branded postpaid customer base was on a Simple Choice plan, up from 84% at the end of the third quarter of 2014 and 69% at the end of the fourth quarter of 2013. |
| |
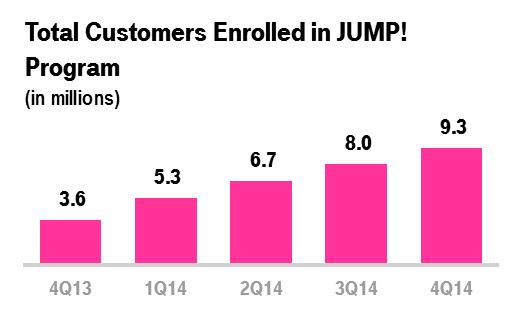
| ▪ | At the end of the fourth quarter of 2014, 9.3 million customers were enrolled in the JUMP! program, up from 8.0 million at the end of the third quarter of 2014 and 3.6 million at the end of the fourth quarter of 2013. |
Un-carrier 8.0: Data Stash
| |
| ▪ | With Data Stash, T-Mobile became the first national wireless provider to allow customers to save and retain their unused data capacity. The high-speed data that a customer does not use each month is automatically rolled into a personal Data Stash and available for use for one year. In addition, every Data Stash comes with an initial allotment of up to 10 GB of free 4G LTE data for qualifying customers. |
| |
| ▪ | The service, which was announced on December 16, 2014 and launched on January 1, 2015, is offered at no extra charge to every new and existing T-Mobile customer on an eligible postpaid Simple Choice plan who buys extra high-speed data for their tablet or smartphone. |
| |
| ▪ | Data Stash requires a deferral of certain revenues to account for the roll-over allowance and the initial 10 GB allotment. The non-cash deferral of the initial 10 GB allotment is expected to fully reverse itself during 2015. |
DEVICES
| |
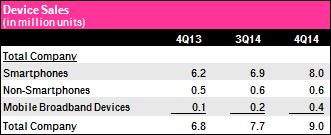
| ▪ | Total device sales were 9.0 million units in the fourth quarter of 2014 compared to 7.7 million units in the third quarter of 2014 and 6.8 million units in the fourth quarter of 2013. |
| |
| ▪ | Total smartphone sales were a record 8.0 million units in the fourth quarter of 2014 compared to 6.9 million units in the third quarter of 2014 and 6.2 million units in the fourth quarter of 2013. Smartphones comprised 93% of total phone unit sales in the fourth quarter of 2014. |
| |
| ▪ | The upgrade rate for branded postpaid customers was approximately 11% in the fourth quarter of 2014 compared to approximately 9% in the third quarter of 2014 and approximately 9% in the fourth quarter of 2013. |
EQUIPMENT INSTALLMENT PLANS (EIP)
| |
| ▪ | T-Mobile financed $1.902 billion of equipment sales on EIP in the fourth quarter of 2014, up 44% from $1.317 billion in the third quarter of 2014 and up 58% from $1.207 billion in the fourth quarter of 2013. The sequential and year-over-year increases were primarily due to growth in devices financed through EIP, including significant demand for the iPhone 6 and iPhone 6 Plus. |
| |
| ▪ | Customers on Simple Choice plans had associated EIP billings of $1.162 billion in the fourth quarter of 2014, up 20% from $967 million in the third quarter of 2014 and up 120% from $528 million in the fourth quarter of 2013. |
| |
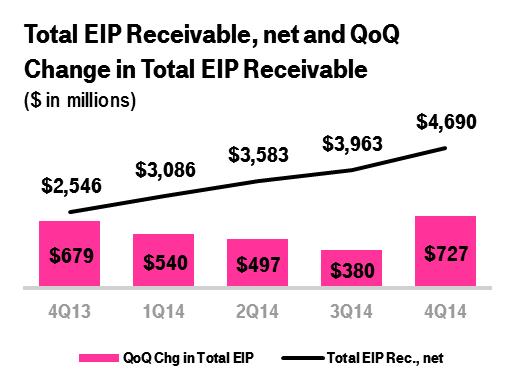
| ▪ | Total EIP receivables, net of imputed discount and allowances for credit losses, were $4.690 billion at the end of the fourth quarter of 2014 compared to $3.963 billion at the end of the third quarter of 2014 and $2.546 billion at the end of the fourth quarter of 2013. The $727 million sequential increase in total EIP receivables, net in the fourth quarter of 2014 was higher than the sequential increase of $380 million in the third quarter of 2014, and reflects the growth in devices financed through EIP, including the significant demand for the iPhone 6 and iPhone 6 Plus. |
| |
| ▪ | The Company continues to expect that the sequential growth in Total EIP Receivables, net will continue to moderate during the course of 2015. |
CUSTOMER QUALITY
| |
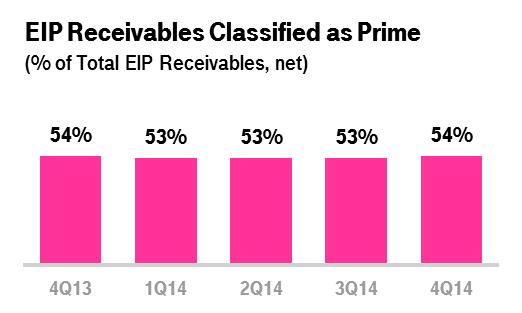
| ▪ | EIP receivables classified as Prime were 54% of total EIP receivables at the end of the fourth quarter of 2014, up one percentage point from the prior quarter and flat compared to the end of the fourth quarter of 2013. |
| |
| ▪ | Total bad debt expense and losses from the factoring arrangement was $150 million in the fourth quarter of 2014 compared to $152 million in the third quarter of 2014 and $131 million in the fourth quarter of 2013. Year-over-year, the increase was primarily due to an increase in bad debt related to growth of the EIP program. |
REVENUE METRICS
| |
| ▪ | T-Mobile is disclosing three new metrics to assist investors in evaluating its performance in the branded postpaid business: Average Revenue Per Account (ARPA), Average Billings Per Account (ABPA), and Customers Per Account. The Company considers ARPA and ABPA indicative of its revenue growth potential given the increase in average branded postpaid phone customers per account and increased penetration of mobile broadband devices. |
Branded Postpaid Phone ARPU
| |
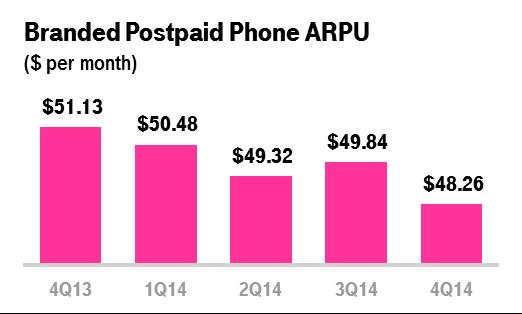
| ▪ | Branded postpaid phone ARPU was $48.26 in the fourth quarter of 2014, down 3.2% from $49.84 in the third quarter of 2014 and down 5.6% from $51.13 in the fourth quarter of 2013. As noted on the third quarter of 2014 earnings, branded postpaid phone ARPU was impacted by incremental customer growth partially attributable to promotions such as the “4 for $100” offer, and a reduction in certain regulatory surcharges. Year-over-year, the decrease was offset in part by changes in requalification requirements for corporate discount programs. The 3.2% sequential decline in the fourth quarter of 2014 was modestly below the 2.5% sequential decline anticipated in guidance and reflects a higher uptake on select promotions available during the quarter. |
Branded Postpaid ABPU
| |
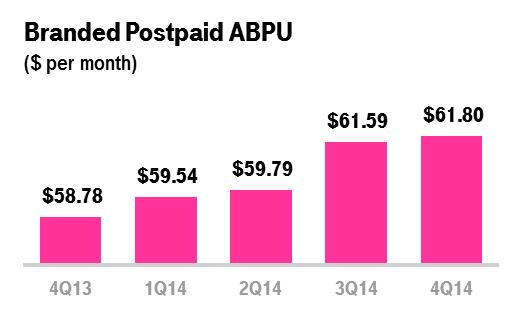
| ▪ | Branded postpaid ABPU was $61.80 in the fourth quarter of 2014, up 0.3% from $61.59 in the third quarter of 2014 and up 5.1% from $58.78 in the fourth quarter of 2013. ABPU in the fourth quarter of 2014 was the highest in the Company’s history. Year-over-year, the increase was primarily due to growth in EIP billings on a per user basis, offset in part by lower branded postpaid phone ARPU. The 5.1% year-over-year increase represents an ongoing progression from the 1.8% year-over-year growth rate in the second quarter of 2014 and the 4.2% year-over-year growth rate in the third quarter of 2014. |
Branded Postpaid Customers per Account
| |
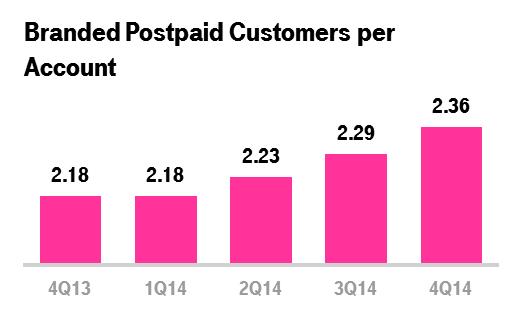
| ▪ | Branded postpaid customers per account is calculated by dividing the number of branded postpaid customers by the number of branded postpaid accounts. An account may include branded postpaid phone and mobile broadband customers. |
| |
| ▪ | Branded postpaid customers per account was 2.36 in the fourth quarter of 2014, compared to 2.29 in the third quarter of 2014 and 2.18 in the fourth quarter of 2013. The sequential and year-over-year increase was primarily due to two factors: an increase in the number of branded postpaid phone customers per account as a result of service promotions targeting multiple phone lines, including the “4 for $100” offer, and increased penetration of mobile broadband devices. |
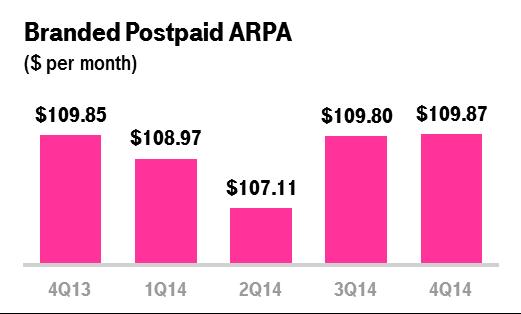
Branded Postpaid ARPA
| |
| ▪ | Branded postpaid ARPA is calculated by dividing branded postpaid service revenues by the average number of branded postpaid accounts. |
| |
| ▪ | Branded postpaid ARPA was $109.87 in the fourth quarter of 2014, essentially flat compared to $109.80 in the third quarter of 2014 and $109.85 in the fourth quarter of 2013. The stable branded postpaid ARPA reflects the increasing number of customers per account, offsetting declines in branded postpaid phone ARPU. |
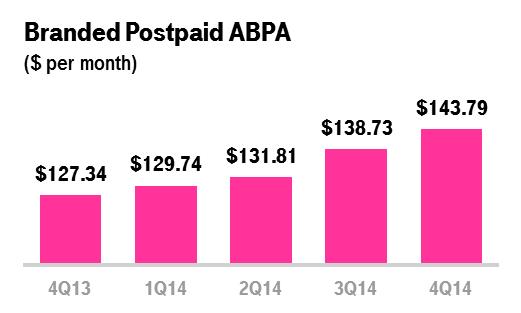
Branded Postpaid ABPA
| |
| ▪ | Branded postpaid ABPA is calculated by dividing the sum of branded postpaid service revenues and EIP billings by the average number of branded postpaid accounts. |
| |
| ▪ | Branded postpaid ABPA was $143.79 in the fourth quarter of 2014, up 3.6% from $138.73 in the third quarter of 2014 and up 12.9% from $127.34 in the fourth quarter of 2013. The sequential and year-over-year increase was primarily due to growth in EIP billings as well as an increase in the number of customers per account. |
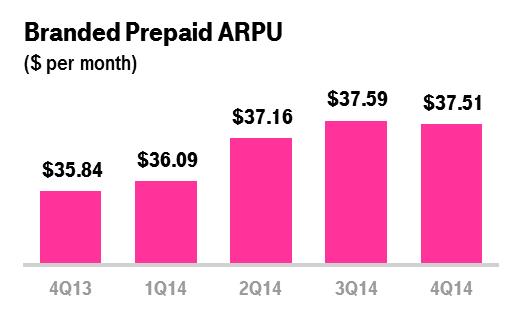
Branded Prepaid ARPU
| |
| ▪ | Branded prepaid ARPU was $37.51 in the fourth quarter of 2014, down 0.2% from $37.59 in the third quarter of 2014 and up 4.7% from $35.84 in the fourth quarter of 2013. Year-over-year, the increase in branded prepaid ARPU was primarily due to growth in the MetroPCS customer base, which generates higher ARPU than T-Mobile’s other branded prepaid customers. |
REVENUES
Service Revenues
| |
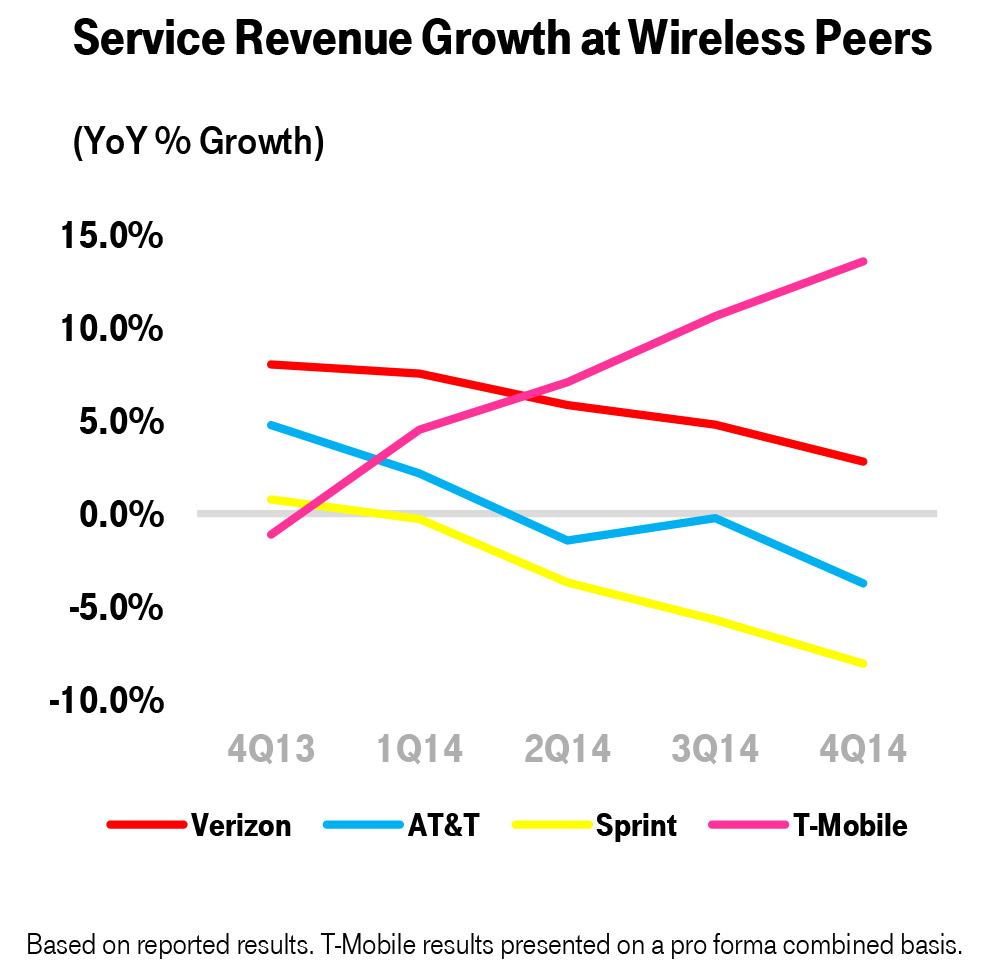
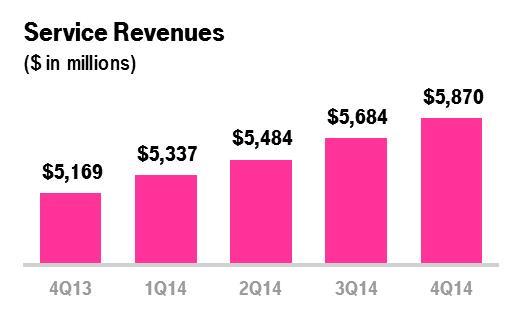
| ▪ | T-Mobile, again, led the industry in year-over-year service revenue growth in the fourth quarter of 2014 and reported the seventh consecutive quarter of sequential growth. |
| |
| ▪ | Service revenues were $5.870 billion in the fourth quarter of 2014, up 3.3% from $5.684 billion in the third quarter of 2014 and up 13.6% from $5.169 billion in the fourth quarter of 2013. The year-over-year growth rate of 13.6% in the fourth quarter of 2014 showed a further acceleration from the 10.6% year-over-year growth rate for the third quarter of 2014, the 7.1% pro forma combined year-over-year growth rate for the second quarter of 2014, and the 4.5% pro forma combined year-over-year growth rate for the first quarter of 2014. |
| |
| ▪ | Sequentially and year-over-year, the increase in service revenues was primarily due to growth in the customer base and increased adoption of insurance and upgrade programs such as JUMP!, partially offset by lower branded postpaid phone ARPU. |
| |
| ▪ | For the full-year 2014, services revenues were $22.375 billion, up 9.0% compared to the pro forma combined $20.535 billion in 2013. |
Equipment Sales Revenues
| |
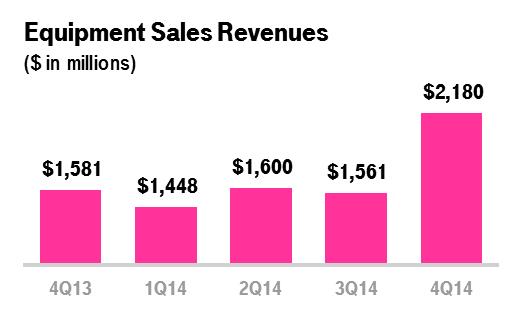
| ▪ | Equipment sales revenues were $2.180 billion in the fourth quarter of 2014, up 39.7% from $1.561 billion in the third quarter of 2014 and up 37.9% from $1.581 billion in the fourth quarter of 2013. |
| |
| ▪ | Sequentially, the increase in equipment sales revenues was primarily due to higher device upgrade volumes, growth in the number of devices sold, and a higher average revenue per device sold. |
| |
| ▪ | Year-over-year, the increase in equipment sales revenues was primarily due to higher device upgrade volumes, growth in the number of devices and accessories sold driven by higher branded gross customer additions, and a higher average revenue per device sold. |
| |
| ▪ | For the full-year 2014, equipment sales revenues were $6.789 billion, up 35% compared to $5.033 billion reported in 2013. |
Total Revenues
| |
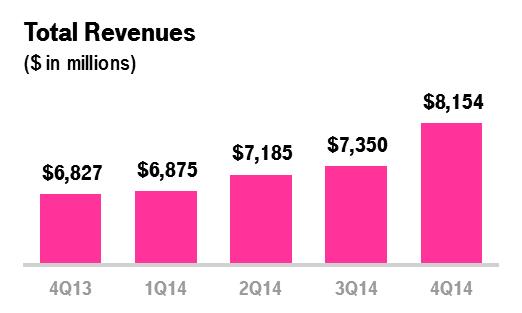
| ▪ | T-Mobile, again, led the industry in year-over-year total revenue growth in the fourth quarter of 2014. |
| |
| ▪ | Total revenues were $8.154 billion in the fourth quarter of 2014, up 10.9% from $7.350 billion in the third quarter of 2014 and up 19.4% from $6.827 billion in the fourth quarter of 2013. |
| |
| ▪ | For the full-year 2014, total revenues were $29.564 billion, up 13.1% compared to the pro forma combined $26.130 billion in 2013. |
OPERATING EXPENSES
Cost of Services
| |
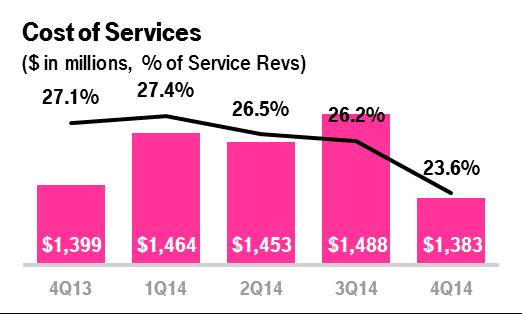
| ▪ | Cost of services was $1.383 billion in the fourth quarter of 2014, down 7.1% from $1.488 billion in the third quarter of 2014 and down 1.1% from $1.399 billion in the fourth quarter of 2013. The sequential decrease was primarily due to a reduction in certain regulatory surcharges, lower lease expense, and renegotiated backhaul contracts with key vendors. |
Cost of Equipment Sales
| |
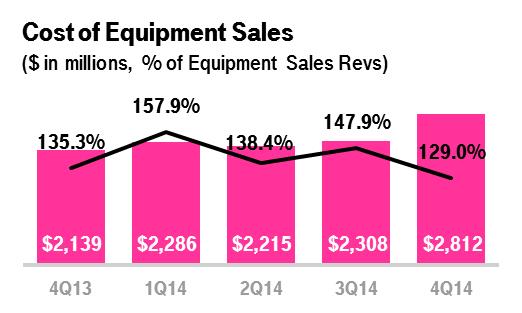
| ▪ | Cost of equipment sales was $2.812 billion in the fourth quarter of 2014, up 21.8% from $2.308 billion in the third quarter of 2014 and up 31.5% from $2.139 billion in the fourth quarter of 2013. The sequential and year-over-year increases were primarily due to higher device upgrade volumes, growth in the number of devices sold, and a higher average cost per device sold. |
Selling, General and Admin. (“SG&A”) Expenses
| |
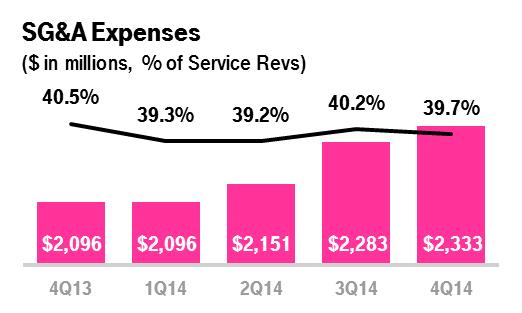
| ▪ | SG&A expenses were $2.333 billion in the fourth quarter of 2014, up 2.2% from $2.283 billion in the third quarter of 2014 and up 11.3% from $2.096 billion in the fourth quarter of 2013. The sequential increase was primarily due to higher promotional costs during the holiday selling season. The year-over-year increase was primarily due to higher commission expenses driven by increased gross customer additions, higher employee-related expenses associated with an increase in the number of retail and customer support employees, and higher promotional costs. |
Adjusted EBITDA
| |
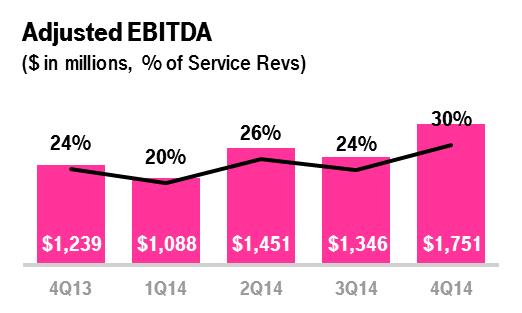
| ▪ | T-Mobile led the industry in year-over-year Adjusted EBITDA growth in the fourth quarter of 2014. |
| |
| ▪ | Adjusted EBITDA was $1.751 billion in the fourth quarter of 2014, up 30.1% from $1.346 billion in the third quarter of 2014 and up 41.3% from $1.239 billion in the fourth quarter of 2013. Sequentially and year-over-year, Adjusted EBITDA increased primarily due to higher branded postpaid and prepaid revenues from growth in the customer base as well as disciplined cost control. Sequentially, Adjusted EBITDA also benefited from lower losses on equipment sales. Year-over-year, the increase was offset in part by higher selling, general and administrative expenses associated with customer growth. |
| |
| ▪ | Adjusted EBITDA margin was 30% in the fourth quarter of 2014 compared to 24% in the third quarter of 2014 and 24% in the fourth quarter of 2013. |
| |
| ▪ | For the full-year 2014, Adjusted EBITDA was $5.636 billion, up 6.0% compared to the pro forma combined $5.317 billion in 2013. Full-year 2014 Adjusted EBITDA margin was 25% compared to a pro forma combined Adjusted EBITDA margin of 26% in full-year 2013. The full-year 2014 Adjusted EBITDA came in within the guidance range of $5.6 to $5.8 billion. |
EARNINGS PER SHARE
| |
| ▪ | Diluted earnings per share was $0.12 in the fourth quarter of 2014 compared to a loss of $0.12 in the third quarter of 2014 and a loss of $0.03 in the fourth quarter of 2013. The sequential and year-over-year increase in earnings per share was primarily due to higher operating income, including non-cash gains from routine spectrum transactions. |
CAPITAL EXPENDITURES
| |
| ▪ | Cash capital expenditures for property and equipment were $1.299 billion in the fourth quarter of 2014 compared to $1.131 billion in the third quarter of 2014 and $882 million in the fourth quarter of 2013. The sequential and year-over-year increase was primarily due to the timing of network spend in connection with T-Mobile’s modernization program as well as commencing the rollout of 4G LTE on the 700 MHz A-Block and 1900 MHz PCS spectrum. |
| |
| ▪ | For the full-year 2014, cash capital expenditures were $4.317 billion, up 1.8% compared to the pro forma combined $4.240 billion in 2013. Full-year 2014 cash capital expenditures were within the guidance range of $4.3 to $4.6 billion. |
SIMPLE FREE CASH FLOW
| |
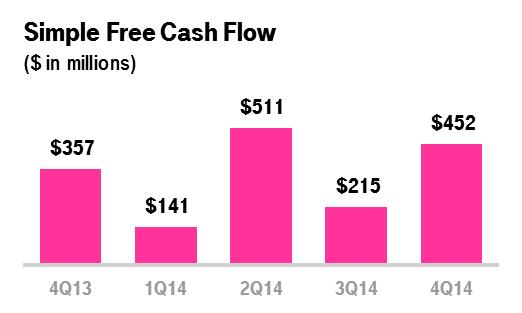
| ▪ | Simple free cash flow was $452 million in the fourth quarter of 2014, compared to $215 million in the third quarter of 2014 and $357 million in the fourth quarter of 2013. Sequentially and year-over-year, the increase was primarily due to higher Adjusted EBITDA, partially offset by higher cash capital expenditures. |
| |
| ▪ | For the full-year 2014, simple free cash flow was $1.319 billion, up 22.5% compared to the pro forma combined $1.077 billion in 2013. |
CAPITAL STRUCTURE
| |
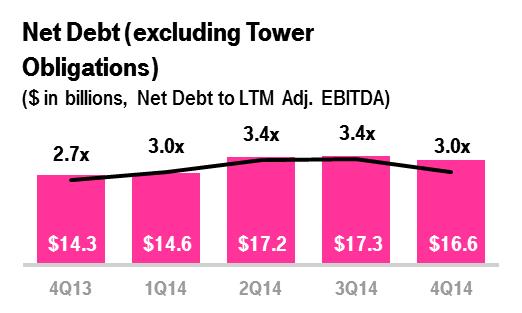
| ▪ | Net debt, excluding tower obligations, at the end of the fourth quarter of 2014 was $16.6 billion. |
| |
| ▪ | Total debt, excluding tower obligations, at the end of the fourth quarter of 2014 was $22.0 billion and was comprised of short-term debt of $0.1 billion, long-term debt to affiliates of $5.6 billion, and long-term debt of $16.3 billion. |
| |
| ▪ | The ratio of net debt to Adjusted EBITDA for the trailing last twelve month (“LTM”) period was 3.0x at the end of the fourth quarter of 2014 compared to 3.4x at the end of the third quarter of 2014 and 2.7x at the end of the fourth quarter of 2013. |
| |
| ▪ | The Company’s cash position remains strong with $5.3 billion in cash at the end of the fourth quarter of 2014. |
GUIDANCE
| |
| ▪ | T-Mobile expects to drive further customer momentum while delivering strong growth in Adjusted EBITDA. |
| |
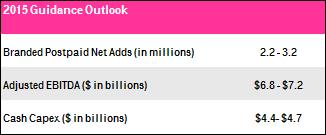
| ▪ | With the success of T-Mobile's Simple Choice plan and the continued evolution of the Un-carrier strategy, branded postpaid net customer additions for full-year 2015 are expected to be between 2.2 and 3.2 million. |
| |
| ▪ | For full-year 2015, T-Mobile expects Adjusted EBITDA to be in the range of $6.8 to $7.2 billion. Adjusted EBITDA in the first quarter of 2015 is expected to be significantly impacted by a large investment to front end customer growth in 2015, similar to what the Company did in 2014. In addition, the first quarter of 2015 will reflect the accounting treatment of Un-carrier 8.0: Data Stash, which is expected to have a non-cash impact in the range of $100 million to $150 million. The accounting treatment of the initial 10 GB allotment, which is a revenue deferral, is expected to fully reverse itself during 2015. |
| |
| ▪ | Cash capital expenditures for the full-year 2015 are expected to be in the range of $4.4 to $4.7 billion. |
OTHER EVENTS
Mandatory Convertible Preferred Stock Issuance
| |
| ▪ | In December 2014, T-Mobile US, Inc. issued 20 million shares of 5.50% Mandatory Convertible Preferred Stock, Series A, at a price of $50.00 per share, raising net proceeds of $982 million. |
| |
| ▪ | T-Mobile expects to use the net proceeds from this offering for general corporate purposes, including capital investments and the acquisition of additional spectrum, unrelated to spectrum it obtained in the Federal Communications Commission’s recently concluded AWS-3 spectrum auction. |
UPCOMING EVENTS (All dates and attendance tentative)
| |
| ▪ | Deutsche Telekom Capital Markets Day, February 26-27, 2015, Bonn, Germany |
| |
| ▪ | Morgan Stanley Technology, Media & Telecom Conference, March 2-5, 2015, San Francisco, CA |
| |
| ▪ | Deutsche Bank 23rd Annual Global Media, Internet & Telecom Conference, March 9-11, 2015, Palm Beach, FL |
| |
| ▪ | T-Mobile US, Inc. Q1 2015 Earnings Report, April 29, 2015 |
CONTACT INFORMATION
Press:
Media Relations
T-Mobile US, Inc.
mediarelations@t-mobile.com
http://newsroom.t-mobile.com
Investor Relations:
Nils Paellmann, nils.paellmann@t-mobile.com
Ben Barrett, ben.barrett@t-mobile.com
Chezzarae Hart, chezzarae.hart@t-mobile.com
877-281-TMUS or 212-358-3210
investor.relations@t-mobile.com
http://investor.t-mobile.com
T-Mobile US, Inc.
Consolidated Balance Sheets
(Unaudited)
|
| | | | | | | |
| (in millions, except share and per share amounts) | December 31,
2014 | | December 31,
2013 |
| Assets | | | |
| Current assets | | | |
| Cash and cash equivalents | $ | 5,315 |
| | $ | 5,891 |
|
| Accounts receivable, net of allowances of $83 and $109 | 1,865 |
| | 2,148 |
|
| Equipment installment plan receivables, net | 3,062 |
| | 1,471 |
|
| Accounts receivable from affiliates | 76 |
| | 41 |
|
| Inventories | 1,085 |
| | 586 |
|
| Deferred tax assets, net | 988 |
| | 839 |
|
| Other current assets | 1,593 |
| | 1,252 |
|
| Total current assets | 13,984 |
| | 12,228 |
|
| Property and equipment, net | 16,245 |
| | 15,349 |
|
| Goodwill | 1,683 |
| | 1,683 |
|
| Spectrum licenses | 21,955 |
| | 18,122 |
|
| Other intangible assets, net | 870 |
| | 1,204 |
|
| Equipment installment plan receivables due after one year, net | 1,628 |
| | 1,075 |
|
| Other assets | 288 |
| | 292 |
|
| Total assets | $ | 56,653 |
| | $ | 49,953 |
|
| Liabilities and Stockholders' Equity | | | |
| Current liabilities | | | |
| Accounts payable and accrued liabilities | $ | 7,364 |
| | $ | 4,567 |
|
| Current payables to affiliates | 231 |
| | 199 |
|
| Short-term debt | 87 |
| | 244 |
|
| Deferred revenue | 459 |
| | 445 |
|
| Other current liabilities | 635 |
| | 353 |
|
| Total current liabilities | 8,776 |
| | 5,808 |
|
| Long-term debt | 16,273 |
| | 14,345 |
|
| Long-term debt to affiliates | 5,600 |
| | 5,600 |
|
| Long-term financial obligation | 2,521 |
| | 2,496 |
|
| Deferred tax liabilities | 4,873 |
| | 4,645 |
|
| Deferred rents | 2,331 |
| | 2,113 |
|
| Other long-term liabilities | 616 |
| | 701 |
|
| Total long-term liabilities | 32,214 |
| | 29,900 |
|
| Commitments and contingencies | | | |
| Stockholders' equity | | | |
| 5.50% Mandatory Convertible Preferred Stock Series A, par value $0.00001 per share, 100,000,000 shares authorized; 20,000,000 and 0 shares issued; $1,000 and $0 aggregate liquidation value | — |
| | — |
|
| Common Stock, par value $0.00001 per share, 1,000,000,000 shares authorized; 808,851,108 and 803,262,309 shares issued, 807,468,603 and 801,879,804 shares outstanding | — |
| | — |
|
| Additional paid-in capital | 38,503 |
| | 37,330 |
|
| Treasury stock, at cost, 1,382,505 and 1,382,505 shares issued | — |
| | — |
|
| Accumulated other comprehensive income | 1 |
| | 3 |
|
| Accumulated deficit | (22,841 | ) | | (23,088 | ) |
| Total stockholders' equity | 15,663 |
| | 14,245 |
|
| Total liabilities and stockholders' equity | $ | 56,653 |
| | $ | 49,953 |
|
T-Mobile US, Inc.
Consolidated Statements of Comprehensive Income (Loss)
(Unaudited)
|
| | | | | | | | | | | | | | | | | | | |
| | Three Months Ended | | Year Ended |
| (in millions, except shares and per share amounts) | December 31,
2014 | | September 30,
2014 | | December 31,
2013 | | December 31,
2014 | | December 31,
2013 |
| Revenues | | | | | | | | | |
| Branded postpaid revenues | $ | 3,764 |
| | $ | 3,670 |
| | $ | 3,317 |
| | $ | 14,392 |
| | $ | 13,166 |
|
| Branded prepaid revenues | 1,812 |
| | 1,790 |
| | 1,606 |
| | 6,986 |
| | 4,945 |
|
| Total branded revenues | 5,576 |
| | 5,460 |
| | 4,923 |
| | 21,378 |
| | 18,111 |
|
| Wholesale revenues | 214 |
| | 171 |
| | 164 |
| | 731 |
| | 613 |
|
| Roaming and other service revenues | 80 |
| | 53 |
| | 82 |
| | 266 |
| | 344 |
|
| Total service revenues | 5,870 |
| | 5,684 |
| | 5,169 |
| | 22,375 |
| | 19,068 |
|
| Equipment sales | 2,180 |
| | 1,561 |
| | 1,581 |
| | 6,789 |
| | 5,033 |
|
| Other revenues | 104 |
| | 105 |
| | 77 |
| | 400 |
| | 319 |
|
| Total revenues | 8,154 |
| | 7,350 |
| | 6,827 |
| | 29,564 |
| | 24,420 |
|
| Operating expenses | | | | | | | | | |
| Cost of services, exclusive of depreciation and amortization shown separately below | 1,383 |
| | 1,488 |
| | 1,399 |
| | 5,788 |
| | 5,279 |
|
| Cost of equipment sales | 2,812 |
| | 2,308 |
| | 2,139 |
| | 9,621 |
| | 6,976 |
|
| Selling, general and administrative | 2,333 |
| | 2,283 |
| | 2,096 |
| | 8,863 |
| | 7,382 |
|
| Depreciation and amortization | 1,090 |
| | 1,138 |
| | 997 |
| | 4,412 |
| | 3,627 |
|
| Cost of MetroPCS business combination | 168 |
| | 97 |
| | 57 |
| | 299 |
| | 108 |
|
| Gains on disposal of spectrum licenses | (70 | ) | | (13 | ) | | — |
| | (840 | ) | | (2 | ) |
| Other, net | 5 |
| | — |
| | — |
| | 5 |
| | 54 |
|
| Total operating expenses | 7,721 |
| | 7,301 |
| | 6,688 |
| | 28,148 |
| | 23,424 |
|
| Operating income | 433 |
| | 49 |
| | 139 |
| | 1,416 |
| | 996 |
|
| Other income (expense) | | | | | | | | | |
| Interest expense to affiliates | (92 | ) | | (83 | ) | | (92 | ) | | (278 | ) | | (678 | ) |
| Interest expense | (266 | ) | | (260 | ) | | (234 | ) | | (1,073 | ) | | (545 | ) |
| Interest income | 104 |
| | 97 |
| | 64 |
| | 359 |
| | 189 |
|
| Other income (expense), net | 21 |
| | (14 | ) | | (16 | ) | | (11 | ) | | 89 |
|
| Total other expense, net | (233 | ) | | (260 | ) | | (278 | ) | | (1,003 | ) | | (945 | ) |
| Income (loss) before income taxes | 200 |
| | (211 | ) | | (139 | ) | | 413 |
| | 51 |
|
| Income tax expense (benefit) | 99 |
| | (117 | ) | | (119 | ) | | 166 |
| | 16 |
|
| Net income (loss) | $ | 101 |
| | $ | (94 | ) | | $ | (20 | ) | | $ | 247 |
| | $ | 35 |
|
| Other comprehensive income (loss), net of tax: | | | | | | | | | |
| Net gain on cross currency interest rate swaps, net of tax effect of $0, $0, $0, $0, and $13 | — |
| | — |
| | — |
| | — |
| | 23 |
|
| Net loss on foreign currency translation, net of tax effect of $0, $0, $0, $0, and $(37) | — |
| | — |
| | — |
| | — |
| | (62 | ) |
| Unrealized gain (loss) on available-for-sale securities, net of tax effect of $0, $0, $1, $(1), and $1 | — |
| | 1 |
| | 1 |
| | (2 | ) | | 1 |
|
| Other comprehensive income (loss), net of tax | — |
| | 1 |
| | 1 |
| | (2 | ) | | (38 | ) |
| Total comprehensive income (loss) | $ | 101 |
| | $ | (93 | ) | | $ | (19 | ) | | $ | 245 |
| | $ | (3 | ) |
| Earnings (loss) per share | | | | | | | | | |
| Basic | $ | 0.13 |
| | $ | (0.12 | ) | | $ | (0.03 | ) | | $ | 0.31 |
| | $ | 0.05 |
|
| Diluted | $ | 0.12 |
| | $ | (0.12 | ) | | $ | (0.03 | ) | | $ | 0.30 |
| | $ | 0.05 |
|
| Weighted average shares outstanding | | | | | | | | | |
| Basic | 807,396,425 |
| | 807,221,761 |
| | 761,964,720 |
| | 805,284,712 |
| | 672,955,980 |
|
| Diluted | 821,707,289 |
| | 807,221,761 |
| | 761,964,720 |
| | 815,922,258 |
| | 676,885,215 |
|
T-Mobile US, Inc.
Consolidated Statements of Cash Flows
(Unaudited)
|
| | | | | | | |
| | Year Ended |
| (in millions) | December 31,
2014 | | December 31,
2013 |
| Operating activities | | | |
| Net income | $ | 247 |
| | $ | 35 |
|
| Adjustments to reconcile net income to net cash provided by operating activities | | | |
| Depreciation and amortization | 4,412 |
| | 3,627 |
|
| Stock-based compensation expense | 196 |
| | 100 |
|
| Excess tax benefit from stock-based compensation | (34 | ) | | — |
|
| Deferred income tax expense | 122 |
| | 10 |
|
| Amortization of debt discount and premium, net | (47 | ) | | (62 | ) |
| Bad debt expense | 444 |
| | 463 |
|
| Losses from factoring arrangement | 179 |
| | — |
|
| Deferred rent expense | 225 |
| | 229 |
|
| Losses (gains) and other, net | (755 | ) | | 209 |
|
| Changes in operating assets and liabilities | | | |
| Accounts receivable | (90 | ) | | (158 | ) |
| Equipment installment plan receivables | (2,429 | ) | | (2,016 | ) |
| Inventories | (499 | ) | | 42 |
|
| Deferred purchase price from factoring arrangement | (204 | ) | | — |
|
| Other current and long-term assets | (328 | ) | | 314 |
|
| Accounts payable and accrued liabilities | 2,395 |
| | 611 |
|
| Other current and long-term liabilities | 312 |
| | 141 |
|
| Net cash provided by operating activities | 4,146 |
| | 3,545 |
|
| Investing activities | | | |
| Purchases of property and equipment | (4,317 | ) | | (4,025 | ) |
| Purchases of spectrum licenses and other intangible assets, including deposits | (2,900 | ) | | (381 | ) |
| Short term affiliate loan receivable, net | — |
| | 300 |
|
| Proceeds from disposals of property and equipment and intangible assets | 20 |
| | 3 |
|
| Cash and cash equivalents acquired in MetroPCS business combination | — |
| | 2,144 |
|
| Payments to acquire financial assets, net | (9 | ) | | — |
|
| Change in restricted cash equivalents | — |
| | (100 | ) |
| Investments in unconsolidated affiliates, net | (40 | ) | | (33 | ) |
| Net cash used in investing activities | (7,246 | ) | | (2,092 | ) |
| Financing activities | | | |
| Proceeds from issuance of long-term debt | 2,993 |
| | 2,494 |
|
| Repayments of long-term debt and capital lease obligations | (1,019 | ) | | (9 | ) |
| Proceeds from issuance of preferred stock | 982 |
| | — |
|
| Proceeds from issuance of common stock | — |
| | 1,787 |
|
| Repayments of short-term debt for purchases of inventory, property and equipment, net | (418 | ) | | (244 | ) |
| Repayments related to a variable interest entity | — |
| | (80 | ) |
| Distribution to affiliate | — |
| | (41 | ) |
| Proceeds from exercise of stock options | 27 |
| | 137 |
|
| Taxes paid related to net share settlement of stock awards | (73 | ) | | — |
|
| Excess tax benefit from stock-based compensation | 34 |
| | — |
|
| Other, net | (2 | ) | | — |
|
| Net cash provided by financing activities | 2,524 |
| | 4,044 |
|
| Change in cash and cash equivalents | (576 | ) | | 5,497 |
|
| Cash and cash equivalents | | | |
| Beginning of year | 5,891 |
| | 394 |
|
| End of year | $ | 5,315 |
| | $ | 5,891 |
|
T-Mobile US, Inc. Supplementary Operating and Financial Data
|
| | | | | | | | | | | | | | | | | | | | | | | | | | | | | |
| | Quarter | | Year Ended December 31, |
| (in thousands) | Q1 2013 | | Q2 2013 | | Q3 2013 | | Q4 2013 | | Q1 2014 | | Q2 2014 | | Q3 2014 | | Q4 2014 | | 2013 | | 2014 |
| Customers, end of period | | | | | | | | | | | | | | | | | | | |
| Branded postpaid phone customers | 19,668 |
| | 20,355 |
| | 20,997 |
| | 21,797 |
| | 23,054 |
| | 23,633 |
| | 24,807 |
| | 25,844 |
| | 21,797 |
| | 25,844 |
|
| Branded postpaid mobile broadband customers | 426 |
| | 428 |
| | 433 |
| | 502 |
| | 568 |
| | 897 |
| | 1,102 |
| | 1,341 |
| | 502 |
| | 1,341 |
|
| Total branded postpaid customers | 20,094 |
| | 20,783 |
| | 21,430 |
| | 22,299 |
| | 23,622 |
| | 24,530 |
| | 25,909 |
| | 27,185 |
| | 22,299 |
| | 27,185 |
|
| Branded prepaid customers | 6,028 |
| | 14,935 |
| | 14,960 |
| | 15,072 |
| | 15,537 |
| | 15,639 |
| | 16,050 |
| | 16,316 |
| | 15,072 |
| | 16,316 |
|
| Total branded customers | 26,122 |
| | 35,718 |
| | 36,390 |
| | 37,371 |
| | 39,159 |
| | 40,169 |
| | 41,959 |
| | 43,501 |
| | 37,371 |
| | 43,501 |
|
| M2M customers | 3,290 |
| | 3,423 |
| | 3,430 |
| | 3,602 |
| | 3,822 |
| | 4,047 |
| | 4,269 |
| | 4,421 |
| | 3,602 |
| | 4,421 |
|
| MVNO customers | 4,556 |
| | 4,875 |
| | 5,219 |
| | 5,711 |
| | 6,094 |
| | 6,329 |
| | 6,662 |
| | 7,096 |
| | 5,711 |
| | 7,096 |
|
| Total wholesale customers | 7,846 |
| | 8,298 |
| | 8,649 |
| | 9,313 |
| | 9,916 |
| | 10,376 |
| | 10,931 |
| | 11,517 |
| | 9,313 |
| | 11,517 |
|
| Total customers, end of period | 33,968 |
| | 44,016 |
| | 45,039 |
| | 46,684 |
| | 49,075 |
| | 50,545 |
| | 52,890 |
| | 55,018 |
| | 46,684 |
| | 55,018 |
|
|
| | | | | | | | | | | | | | | | | | | | | | | | | | | | | |
| | Quarter | | Year Ended December 31, |
| (in thousands) | Q1 2013 | | Q2 2013 | | Q3 2013 | | Q4 2013 | | Q1 2014 | | Q2 2014 | | Q3 2014 | | Q4 2014 | | 2013 | | 2014 |
| Net customer additions (losses) | | | | | | | | | | | | | | | | | | | |
| Branded postpaid phone customers | (190 | ) | | 685 |
| | 643 |
| | 800 |
| | 1,256 |
| | 579 |
| | 1,175 |
| | 1,037 |
| | 1,938 |
| | 4,047 |
|
| Branded postpaid mobile broadband customers | (9 | ) | | 3 |
| | 5 |
| | 69 |
| | 67 |
| | 329 |
| | 204 |
| | 239 |
| | 68 |
| | 839 |
|
| Total branded postpaid customers | (199 | ) | | 688 |
| | 648 |
| | 869 |
| | 1,323 |
| | 908 |
| | 1,379 |
| | 1,276 |
| | 2,006 |
| | 4,886 |
|
| Branded prepaid customers | 202 |
| | (10 | ) | | 24 |
| | 112 |
| | 465 |
| | 102 |
| | 411 |
| | 266 |
| | 328 |
| | 1,244 |
|
| Total branded customers | 3 |
| | 678 |
| | 672 |
| | 981 |
| | 1,788 |
| | 1,010 |
| | 1,790 |
| | 1,542 |
| | 2,334 |
| | 6,130 |
|
| M2M customers | 200 |
| | 133 |
| | 7 |
| | 172 |
| | 220 |
| | 225 |
| | 222 |
| | 152 |
| | 512 |
| | 819 |
|
| MVNO customers | 376 |
| | 319 |
| | 344 |
| | 492 |
| | 383 |
| | 235 |
| | 333 |
| | 434 |
| | 1,531 |
| | 1,385 |
|
| Total wholesale customers | 576 |
| | 452 |
| | 351 |
| | 664 |
| | 603 |
| | 460 |
| | 555 |
| | 586 |
| | 2,043 |
| | 2,204 |
|
| Total net customer additions | 579 |
| | 1,130 |
| | 1,023 |
| | 1,645 |
| | 2,391 |
| | 1,470 |
| | 2,345 |
| | 2,128 |
| | 4,377 |
| | 8,334 |
|
| Acquired customers | — |
| | 8,918 |
| | — |
| | — |
| | — |
| | — |
| | — |
| | — |
| | 8,918 |
| | — |
|
Note: Certain customer numbers may not add due to rounding.
|
| | | | | | | | | | | | | | | | | | | | | | | | | | | | | |
| | Quarter | | Year Ended December 31, |
| | Q1 2013 | | Q2 2013 | | Q3 2013 | | Q4 2013 | | Q1 2014 | | Q2 2014 | | Q3 2014 | | Q4 2014 | | 2013 | | 2014 |
| Branded postpaid phone churn | 1.89 | % | | 1.54 | % | | 1.70 | % | | 1.63 | % | | 1.47 | % | | 1.48 | % | | 1.64 | % | | 1.73 | % | | 1.69 | % | | 1.58 | % |
| Branded prepaid churn | 6.97 | % | | 5.44 | % | | 4.96 | % | | 5.10 | % | | 4.34 | % | | 4.50 | % | | 4.78 | % | | 5.39 | % | | 5.37 | % | | 4.76 | % |
T-Mobile US, Inc. Supplementary Operating and Financial Data (continued)
|
| | | | | | | | | | | | | | | | | | | |
| | Quarter | | Year Ended December 31, |
| | Q1 2013 | | Q2 2013 | | Q3 2013 | | Q4 2013 | | Q1 2014 | | Q2 2014 | | Q3 2014 | | Q4 2014 | | 2013 | | 2014 |
| Service revenues (in millions) | $4,005 | | $4,756 | | $5,138 | | $5,169 | | $5,337 | | $5,484 | | $5,684 | | $5,870 | | $19,068 | | $22,375 |
| Total revenues (in millions) | $4,677 | | $6,228 | | $6,688 | | $6,827 | | $6,875 | | $7,185 | | $7,350 | | $8,154 | | $24,420 | | $29,564 |
| Adjusted EBITDA (in millions) | $1,178 | | $1,124 | | $1,344 | | $1,239 | | $1,088 | | $1,451 | | $1,346 | | $1,751 | | $4,885 | | $5,636 |
| Adjusted EBITDA margin | 29% | | 24% | | 26% | | 24% | | 20% | | 26% | | 24% | | 30% | | 26% | | 25% |
| Net income (loss) (in millions) | $107 | | $(16) | | $(36) | | $(20) | | $(151) | | $391 | | $(94) | | $101 | | $35 | | $247 |
| Cash capex - Property & Equipment (in millions) | $1,076 | | $1,050 | | $1,017 | | $882 | | $947 | | $940 | | $1,131 | | $1,299 | | $4,025 | | $4,317 |
| Branded postpaid ARPA | $117.27 | | $115.95 | | $112.64 | | $109.85 | | $108.97 | | $107.11 | | $109.80 | | $109.87 | | $113.84 | | $108.95 |
| Branded postpaid ABPA | $124.24 | | $127.04 | | $127.47 | | $127.34 | | $129.74 | | $131.81 | | $138.73 | | $143.79 | | $126.55 | | $136.17 |
| Branded postpaid customers per account | 2.17 | | 2.16 | | 2.16 | | 2.18 | | 2.18 | | 2.23 | | 2.29 | | 2.36 | | 2.18 | | 2.36 |
| Branded postpaid phone ARPU | $54.50 | | $54.04 | | $52.62 | | $51.13 | | $50.48 | | $49.32 | | $49.84 | | $48.26 | | $53.03 | | $49.44 |
| Branded postpaid ABPU | $57.28 | | $58.72 | | $59.08 | | $58.78 | | $59.54 | | $59.79 | | $61.59 | | $61.80 | | $58.48 | | $60.73 |
| Branded prepaid ARPU | $28.25 | | $34.78 | | $35.71 | | $35.84 | | $36.09 | | $37.16 | | $37.59 | | $37.51 | | $34.59 | | $37.10 |
| Smartphone sales units (in millions) | 2.2 | | 4.3 | | 5.6 | | 6.2 | | 6.9 | | 6.2 | | 6.9 | | 8.0 | | 18.3 | | 28.0 |
| Smartphone sales / phone sales | 75% | | 86% | | 88% | | 91% | | 92% | | 93% | | 93% | | 93% | | 87% | | 93% |
| Branded postpaid handset upgrade rate | 5% | | 10% | | 9% | | 9% | | 7% | | 8% | | 9% | | 11% | | 33% | | 35% |
| EIP financed (in millions) | $298 | | $811 | | $1,011 | | $1,207 | | $1,249 | | $1,342 | | $1,317 | | $1,902 | | $3,327 | | $5,810 |
| EIP billings (in millions) | $194 | | $314 | | $435 | | $528 | | $657 | | $810 | | $967 | | $1,162 | | $1,471 | | $3,596 |
| EIP receivables, net (in millions) | $774 | | $1,292 | | $1,867 | | $2,546 | | $3,086 | | $3,583 | | $3,963 | | $4,690 | | $2,546 | | $4,690 |
| EIP receivables classified as prime | 44% | | 52% | | 53% | | 54% | | 53% | | 53% | | 53% | | 54% | | 54% | | 54% |
Bad debt expense (1) | $114 | | $97 | | $121 | | $131 | | $130 | | $105 | | $103 | | $106 | | $463 | | $444 |
Losses from factoring arrangement (1) | $— | | $— | | $— | | $— | | $27 | | $59 | | $49 | | $44 | | $— | | $179 |
Total bad debt expense and losses from factoring arrangement (1) | $114 | | $97 | | $121 | | $131 | | $157 | | $164 | | $152 | | $150 | | $463 | | $623 |
(1) Bad debt expense and losses from factoring arrangement in the first quarter of 2014 through the third quarter of 2014 have been restated to conform to the presentation in the fourth quarter of 2014.
T-Mobile US, Inc.
Reconciliation of Non-GAAP Financial Measures to GAAP Financial Measures
(Unaudited)
This Investor Factbook includes non-GAAP financial measures. The non-GAAP financial measures should be considered in addition to, but not as a substitute for, the information provided in accordance with GAAP. Reconciliations for the non-GAAP financial measures to the most directly comparable GAAP financial measures are provided below.
Adjusted EBITDA is reconciled to net income (loss) as follows:
|
| | | | | | | | | | | | | | | | | | | | | | | | | | | | | | | | | | | | | | | |
| | Quarter | | Year Ended December 31, |
| (in millions) | Q1 2013 | | Q2 2013 | | Q3 2013 | | Q4 2013 | | Q1 2014 | | Q2 2014 | | Q3 2014 | | Q4 2014 | | 2013 | | 2014 |
| Net income (loss) | $ | 107 |
| | $ | (16 | ) | | $ | (36 | ) | | $ | (20 | ) | | $ | (151 | ) | | $ | 391 |
| | $ | (94 | ) | | $ | 101 |
| | $ | 35 |
| | $ | 247 |
|
| Adjustments: | | | | | | | | | | | | | | | | | | | |
| Interest expense to affiliates | 178 |
| | 225 |
| | 183 |
| | 92 |
| | 18 |
| | 85 |
| | 83 |
| | 92 |
| | 678 |
| | 278 |
|
| Interest expense | 51 |
| | 109 |
| | 151 |
| | 234 |
| | 276 |
| | 271 |
| | 260 |
| | 266 |
| | 545 |
| | 1,073 |
|
| Interest income | (35 | ) | | (40 | ) | | (50 | ) | | (64 | ) | | (75 | ) | | (83 | ) | | (97 | ) | | (104 | ) | | (189 | ) | | (359 | ) |
| Other expense (income), net | 6 |
| | (118 | ) | | 7 |
| | 16 |
| | 6 |
| | 12 |
| | 14 |
| | (21 | ) | | (89 | ) | | 11 |
|
| Income tax expense (benefit) | 72 |
| | 21 |
| | 42 |
| | (119 | ) | | (102 | ) | | 286 |
| | (117 | ) | | 99 |
| | 16 |
| | 166 |
|
| Operating income (loss) | 379 |
| | 181 |
| | 297 |
| | 139 |
| | (28 | ) | | 962 |
| | 49 |
| | 433 |
| | 996 |
| | 1,416 |
|
| Depreciation and amortization | 755 |
| | 888 |
| | 987 |
| | 997 |
| | 1,055 |
| | 1,129 |
| | 1,138 |
| | 1,090 |
| | 3,627 |
| | 4,412 |
|
| Cost of MetroPCS business combination | 13 |
| | 26 |
| | 12 |
| | 57 |
| | 12 |
| | 22 |
| | 97 |
| | 168 |
| | 108 |
| | 299 |
|
Stock-based compensation (1) | — |
| | 6 |
| | 48 |
| | 46 |
| | 49 |
| | 63 |
| | 45 |
| | 54 |
| | 100 |
| | 211 |
|
Gains on disposal of spectrum licenses (1) | — |
| | — |
| | — |
| | — |
| | — |
| | (731 | ) | | 11 |
| | — |
| | — |
| | (720 | ) |
Other, net (1) | 31 |
| | 23 |
| | — |
| | — |
| | — |
| | 6 |
| | 6 |
| | 6 |
| | 54 |
| | 18 |
|
| Adjusted EBITDA | $ | 1,178 |
| | $ | 1,124 |
| | $ | 1,344 |
| | $ | 1,239 |
| | $ | 1,088 |
| | $ | 1,451 |
| | $ | 1,346 |
| | $ | 1,751 |
| | $ | 4,885 |
| | $ | 5,636 |
|
Adjusted EBITDA of MetroPCS (2) | 291 |
| | 141 |
| | — |
| | — |
| | — |
| | — |
| | — |
| | — |
| | 432 |
| | — |
|
| Pro Forma Combined Adjusted EBITDA | $ | 1,469 |
| | $ | 1,265 |
| | $ | 1,344 |
| | $ | 1,239 |
| | $ | 1,088 |
| | $ | 1,451 |
| | $ | 1,346 |
| | $ | 1,751 |
| | $ | 5,317 |
| | $ | 5,636 |
|
| |
| (1) | Stock-based compensation includes tax impacts and may not agree to stock based compensation expense in the consolidated financial statements. Gains on disposal of spectrum licenses and Other, net transactions may not agree in total to the Gains on disposal of spectrum licenses and Other, net in the Consolidated Statements of Comprehensive Income (Loss) primarily due to certain routine operating activities, such as insignificant or routine spectrum license exchanges that would be expected to reoccur, and are therefore included in Adjusted EBITDA. |
| |
| (2) | The Adjusted EBITDA of MetroPCS for the second quarter of 2013 reflects the Adjusted EBITDA of MetroPCS for April 2013 and is included for informational purposes to allow for a comparison of T-Mobile’s Adjusted EBITDA for periods following the completion of the business combination of T-Mobile USA and MetroPCS to pro forma combined Adjusted EBITDA for periods prior to the completion of the business combination. For the first quarter of 2013, the Adjusted EBITDA of MetroPCS reflects the amounts previously reported by MetroPCS. |
T-Mobile US, Inc.
Reconciliation of Non-GAAP Financial Measures to GAAP Financial Measures (continued)
(Unaudited)
The following tables illustrate the calculation of ARPA and ABPA and reconcile these measures to the related service revenues, which we consider to be the most directly comparable GAAP financial measure to ARPA and ABPA:
|
| | | | | | | | | | | | | | | | | | | | | | | | | | | | | | | | | | | | | | | |
| (in millions, except average number of accounts, ARPA and ABPA) | Quarter | | Year Ended December 31, |
| Q1 2013 | | Q2 2013 | | Q3 2013 | | Q4 2013 | | Q1 2014 | | Q2 2014 | | Q3 2014 | | Q4 2014 | | 2013 | | 2014 |
| Calculation of Branded Postpaid ARPA | | | | | | | | | | | | | | | | |
| Branded postpaid service revenues | $ | 3,263 |
| | $ | 3,284 |
| | $ | 3,302 |
| | $ | 3,317 |
| | $ | 3,447 |
| | $ | 3,511 |
| | $ | 3,670 |
| | $ | 3,764 |
| | $ | 13,166 |
| | $ | 14,392 |
|
| Divided by: Average number of branded postpaid accounts (in thousands) and number of months in period | 9,275 |
| | 9,441 |
| | 9,772 |
| | 10,064 |
| | 10,543 |
| | 10,928 |
| | 11,141 |
| | 11,421 |
| | 9,638 |
| | 11,008 |
|
| Branded postpaid ARPA | $ | 117.27 |
| | $ | 115.95 |
| | $ | 112.64 |
| | $ | 109.85 |
| | $ | 108.97 |
| | $ | 107.11 |
| | $ | 109.80 |
| | $ | 109.87 |
| | $ | 113.84 |
| | $ | 108.95 |
|
| | | | | | | | | | | | | | | | | | | | |
| Calculation of Branded Postpaid ABPA | | | | | | | | | | | | | | | | |
| Branded postpaid service revenues | $ | 3,263 |
| | $ | 3,284 |
| | $ | 3,302 |
| | $ | 3,317 |
| | $ | 3,447 |
| | $ | 3,511 |
| | $ | 3,670 |
| | $ | 3,764 |
| | $ | 13,166 |
| | $ | 14,392 |
|
| Add: EIP billings | 194 |
| | 314 |
| | 435 |
| | 528 |
| | 657 |
| | 810 |
| | 967 |
| | 1,162 |
| | 1,471 |
| | 3,596 |
|
| Total billings for branded postpaid customers | $ | 3,457 |
| | $ | 3,598 |
| | $ | 3,737 |
| | $ | 3,845 |
| | $ | 4,104 |
| | $ | 4,321 |
| | $ | 4,637 |
| | $ | 4,926 |
| | $ | 14,637 |
| | $ | 17,988 |
|
| Divided by: Average number of branded postpaid accounts (in thousands) and number of months in period | 9,275 |
| | 9,441 |
| | 9,772 |
| | 10,064 |
| | 10,543 |
| | 10,928 |
| | 11,141 |
| | 11,421 |
| | 9,638 |
| | 11,008 |
|
| Branded postpaid ABPA | $ | 124.24 |
| | $ | 127.04 |
| | $ | 127.47 |
| | $ | 127.34 |
| | $ | 129.74 |
| | $ | 131.81 |
| | $ | 138.73 |
| | $ | 143.79 |
| | $ | 126.55 |
| | $ | 136.17 |
|
T-Mobile US, Inc.
Reconciliation of Non-GAAP Financial Measures to GAAP Financial Measures (continued)
(Unaudited)
The following tables illustrate the calculation of ARPU and ABPU and reconcile these measures to the related service revenues, which we consider to be the most directly comparable GAAP financial measure to ARPU and ABPU:
|
| | | | | | | | | | | | | | | | | | | | | | | | | | | | | | | | | | | | | | | |
| (in millions, except average number of customers, ARPU and ABPU) | Quarter | | Year Ended December 31, |
| Q1 2013 | | Q2 2013 | | Q3 2013 | | Q4 2013 | | Q1 2014 | | Q2 2014 | | Q3 2014 | | Q4 2014 | | 2013 | | 2014 |
| Calculation of Branded Postpaid Phone ARPU | | | | | | | | | | | | | | | | |
| Branded postpaid service revenues | $ | 3,263 |
| | $ | 3,284 |
| | $ | 3,302 |
| | $ | 3,317 |
| | $ | 3,447 |
| | $ | 3,511 |
| | $ | 3,670 |
| | $ | 3,764 |
| | $ | 13,166 |
| | $ | 14,392 |
|
| Less: Branded postpaid mobile broadband revenues | (44 | ) | | (42 | ) | | (41 | ) | | (42 | ) | | (47 | ) | | (54 | ) | | (68 | ) | | (92 | ) | | (169 | ) | | (261 | ) |
| Branded postpaid phone service revenues | $ | 3,219 |
| | $ | 3,242 |
| | $ | 3,261 |
| | $ | 3,275 |
| | $ | 3,400 |
| | $ | 3,457 |
| | $ | 3,602 |
| | $ | 3,672 |
| | $ | 12,997 |
| | $ | 14,131 |
|
| Divided by: Average number of branded postpaid phone customers (in thousands) and number of months in period | 19,689 |
| | 19,999 |
| | 20,657 |
| | 21,352 |
| | 22,447 |
| | 23,368 |
| | 24,091 |
| | 25,359 |
| | 20,424 |
| | 23,817 |
|
| Branded postpaid phone ARPU | $ | 54.50 |
| | $ | 54.04 |
| | $ | 52.62 |
| | $ | 51.13 |
| | $ | 50.48 |
| | $ | 49.32 |
| | $ | 49.84 |
| | $ | 48.26 |
| | $ | 53.03 |
| | $ | 49.44 |
|
| | | | | | | | | | | | | | | | | | | | |
| Calculation of Branded Postpaid ABPU | | | | | | | | | | | | | | | | |
| Branded postpaid service revenues | $ | 3,263 |
| | $ | 3,284 |
| | $ | 3,302 |
| | $ | 3,317 |
| | $ | 3,447 |
| | $ | 3,511 |
| | $ | 3,670 |
| | $ | 3,764 |
| | $ | 13,166 |
| | $ | 14,392 |
|
| Add: EIP billings | 194 |
| | 314 |
| | 435 |
| | 528 |
| | 657 |
| | 810 |
| | 967 |
| | 1,162 |
| | 1,471 |
| | 3,596 |
|
| Total billings for branded postpaid customers | $ | 3,457 |
| | $ | 3,598 |
| | $ | 3,737 |
| | $ | 3,845 |
| | $ | 4,104 |
| | $ | 4,321 |
| | $ | 4,637 |
| | $ | 4,926 |
| | $ | 14,637 |
| | $ | 17,988 |
|
| Divided by: Average number of branded postpaid customers (in thousands) and number of months in period | 20,117 |
| | 20,425 |
| | 21,084 |
| | 21,805 |
| | 22,975 |
| | 24,092 |
| | 25,095 |
| | 26,572 |
| | 20,858 |
| | 24,683 |
|
| Branded postpaid ABPU | $ | 57.28 |
| | $ | 58.72 |
| | $ | 59.08 |
| | $ | 58.78 |
| | $ | 59.54 |
| | $ | 59.79 |
| | $ | 61.59 |
| | $ | 61.80 |
| | $ | 58.48 |
| | $ | 60.73 |
|
| | | | | | | | | | | | | | | | | | | | |
| Calculation of Branded Prepaid ARPU | | | | | | | | | | | | | | | | |
| Branded Prepaid Service Revenues | $ | 503 |
| | $ | 1,242 |
| | $ | 1,594 |
| | $ | 1,606 |
| | $ | 1,648 |
| | $ | 1,736 |
| | $ | 1,790 |
| | $ | 1,812 |
| | $ | 4,945 |
| | $ | 6,986 |
|
| Divided by: Average number of branded prepaid customer (in thousands) and number of months in period | 5,936 |
| | 11,902 |
| | 14,877 |
| | 14,935 |
| | 15,221 |
| | 15,569 |
| | 15,875 |
| | 16,097 |
| | 11,913 |
| | 15,691 |
|
| Branded prepaid ARPU | $ | 28.25 |
| | $ | 34.78 |
| | $ | 35.71 |
| | $ | 35.84 |
| | $ | 36.09 |
| | $ | 37.16 |
| | $ | 37.59 |
| | $ | 37.51 |
| | $ | 34.59 |
| | $ | 37.10 |
|
Pro Forma Combined Results
The following pages contain certain pro forma combined financial and other operating data for periods through the second quarter of 2013 that are presented solely for informational purposes to provide comparative customer and financial trends since the business combination of T-Mobile USA and MetroPCS was completed for the combined company. The pro forma combined amounts for periods through and including the second quarter of 2013 were created by combining certain financial results and other operating data of the individual entities for the relevant periods. The pro forma combined financial data have not been determined in accordance with the requirements of Article 11 of Regulation S-X. The following pages also include reconciliations for certain additional non-GAAP financial measures to the most directly comparable GAAP financial measures.
T-Mobile US, Inc. Supplementary Pro Forma Combined Operating and Financial Data
|
| | | | | | | | | | | | | | | | | | | | | | | | | | | | | |
| | Quarter | | Year Ended December 31, |
| (in thousands) | Q1 2013 | | Q2 2013 | | Q3 2013 | | Q4 2013 | | Q1 2014 | | Q2 2014 | | Q3 2014 | | Q4 2014 | | 2013 | | 2014 |
| Customers, end of period | | | | | | | | | | | | | | | | | | | |
| Branded postpaid phone customers | 19,668 |
| | 20,355 |
| | 20,997 |
| | 21,797 |
| | 23,054 |
| | 23,633 |
| | 24,807 |
| | 25,844 |
| | 21,797 |
| | 25,844 |
|
| Branded postpaid mobile broadband customers | 426 |
| | 428 |
| | 433 |
| | 502 |
| | 568 |
| | 897 |
| | 1,102 |
| | 1,341 |
| | 502 |
| | 1,341 |
|
| Total branded postpaid customers | 20,094 |
| | 20,783 |
| | 21,430 |
| | 22,299 |
| | 23,622 |
| | 24,530 |
| | 25,909 |
| | 27,185 |
| | 22,299 |
| | 27,185 |
|
| Branded prepaid customers | 15,023 |
| | 14,935 |
| | 14,960 |
| | 15,072 |
| | 15,537 |
| | 15,639 |
| | 16,050 |
| | 16,316 |
| | 15,072 |
| | 16,316 |
|
| Total branded customers | 35,117 |
| | 35,718 |
| | 36,390 |
| | 37,371 |
| | 39,159 |
| | 40,169 |
| | 41,959 |
| | 43,501 |
| | 37,371 |
| | 43,501 |
|
| M2M customers | 3,290 |
| | 3,423 |
| | 3,430 |
| | 3,602 |
| | 3,822 |
| | 4,047 |
| | 4,269 |
| | 4,421 |
| | 3,602 |
| | 4,421 |
|
| MVNO customers | 4,556 |
| | 4,875 |
| | 5,219 |
| | 5,711 |
| | 6,094 |
| | 6,329 |
| | 6,662 |
| | 7,096 |
| | 5,711 |
| | 7,096 |
|
| Total wholesale customers | 7,846 |
| | 8,298 |
| | 8,649 |
| | 9,313 |
| | 9,916 |
| | 10,376 |
| | 10,931 |
| | 11,517 |
| | 9,313 |
| | 11,517 |
|
| Total customers, end of period | 42,963 |
| | 44,016 |
| | 45,039 |
| | 46,684 |
| | 49,075 |
| | 50,545 |
| | 52,890 |
| | 55,018 |
| | 46,684 |
| | 55,018 |
|
|
| | | | | | | | | | | | | | | | | | | | | | | | | | | | | |
| | Quarter | | Year Ended December 31, |
| (in thousands) | Q1 2013 | | Q2 2013 | | Q3 2013 | | Q4 2013 | | Q1 2014 | | Q2 2014 | | Q3 2014 | | Q4 2014 | | 2013 | | 2014 |
| Net customer additions (losses) | | | | | | | | | | | | | | | | | | | |
| Branded postpaid phone customers | (190 | ) | | 685 |
| | 643 |
| | 800 |
| | 1,256 |
| | 579 |
| | 1,175 |
| | 1,037 |
| | 1,938 |
| | 4,047 |
|
| Branded postpaid mobile broadband customers | (9 | ) | | 3 |
| | 5 |
| | 69 |
| | 67 |
| | 329 |
| | 204 |
| | 239 |
| | 68 |
| | 839 |
|
| Total branded postpaid customers | (199 | ) | | 688 |
| | 648 |
| | 869 |
| | 1,323 |
| | 908 |
| | 1,379 |
| | 1,276 |
| | 2,006 |
| | 4,886 |
|
| Branded prepaid customers | 310 |
| | (87 | ) | | 24 |
| | 112 |
| | 465 |
| | 102 |
| | 411 |
| | 266 |
| | 359 |
| | 1,244 |
|
| Total branded customers | 111 |
| | 601 |
| | 672 |
| | 981 |
| | 1,788 |
| | 1,010 |
| | 1,790 |
| | 1,542 |
| | 2,365 |
| | 6,130 |
|
| M2M customers | 200 |
| | 133 |
| | 7 |
| | 172 |
| | 220 |
| | 225 |
| | 222 |
| | 152 |
| | 512 |
| | 819 |
|
| MVNO customers | 376 |
| | 319 |
| | 344 |
| | 492 |
| | 383 |
| | 235 |
| | 333 |
| | 434 |
| | 1,531 |
| | 1,385 |
|
| Total wholesale customers | 576 |
| | 452 |
| | 351 |
| | 664 |
| | 603 |
| | 460 |
| | 555 |
| | 586 |
| | 2,043 |
| | 2,204 |
|
| Total net customer additions | 687 |
| | 1,053 |
| | 1,023 |
| | 1,645 |
| | 2,391 |
| | 1,470 |
| | 2,345 |
| | 2,128 |
| | 4,408 |
| | 8,334 |
|
Note: Certain customer numbers may not add due to rounding.
T-Mobile US, Inc. Supplementary Pro Forma Combined Operating and Financial Data (continued)
|
| | | | | | | | | | | | | | | | | | | | | | | | | | | | | |
| | Quarter | | Year Ended December 31, |
| | Q1 2013 | | Q2 2013 | | Q3 2013 | | Q4 2013 | | Q1 2014 | | Q2 2014 | | Q3 2014 | | Q4 2014 | | 2013 | | 2014 |
| Branded postpaid phone churn | 1.89 | % | | 1.54 | % | | 1.70 | % | | 1.63 | % | | 1.47 | % | | 1.48 | % | | 1.64 | % | | 1.73 | % | | 1.69 | % | | 1.58 | % |
| Branded prepaid churn | 4.42 | % | | 4.90 | % | | 4.96 | % | | 5.10 | % | | 4.34 | % | | 4.50 | % | | 4.78 | % | | 5.39 | % | | 4.84 | % | | 4.76 | % |
All historical and current porting activity between the T-Mobile and MetroPCS brands has been removed from deactivations and treated as migration activity between brands/products, consistent with the treatment of the combined business. The effect of this treatment lowers the churn rates for both branded postpaid and branded prepaid customer bases.
|
| | | | | | | | | | | | | | | | | | | |
| | Quarter | | Year Ended December 31, |
| | Q1 2013 | | Q2 2013 | | Q3 2013 | | Q4 2013 | | Q1 2014 | | Q2 2014 | | Q3 2014 | | Q4 2014 | | 2013 | | 2014 |
| Service revenues (in millions) | $5,106 | | $5,122 | | $5,138 | | $5,169 | | $5,337 | | $5,484 | | $5,684 | | $5,870 | | $20,535 | | $22,375 |
| Thereof, branded postpaid revenues (in millions) | $3,263 | | $3,284 | | $3,302 | | $3,317 | | $3,447 | | $3,511 | | $3,670 | | $3,764 | | $13,166 | | $14,392 |
| Thereof, branded prepaid revenues (in millions) | $1,604 | | $1,608 | | $1,594 | | $1,606 | | $1,648 | | $1,736 | | $1,790 | | $1,812 | | $6,412 | | $6,986 |
| Total revenues (in millions) | $5,964 | | $6,651 | | $6,688 | | $6,827 | | $6,875 | | $7,185 | | $7,350 | | $8,154 | | $26,130 | | $29,564 |
| Adjusted EBITDA (in millions) | $1,469 | | $1,265 | | $1,344 | | $1,239 | | $1,088 | | $1,451 | | $1,346 | | $1,751 | | $5,317 | | $5,636 |
| Adjusted EBITDA margin | 29% | | 25% | | 26% | | 24% | | 20% | | 26% | | 24% | | 30% | | 26% | | 25% |
| Cash capex - Property & Equipment (in millions) | $1,230 | | $1,111 | | $1,017 | | $882 | | $947 | | $940 | | $1,131 | | $1,299 | | $4,240 | | $4,317 |
| Branded postpaid phone ARPU | $54.50 | | $54.04 | | $52.62 | | $51.13 | | $50.48 | | $49.32 | | $49.84 | | $48.26 | | $53.03 | | $49.44 |
| Branded prepaid ARPU | $35.87 | | $35.97 | | $35.71 | | $35.84 | | $36.09 | | $37.16 | | $37.59 | | $37.51 | | $35.85 | | $37.10 |
|
| | | | | | | | | | | | | | | | | | | | | | | | | | | |
| | Three Months Ended |
| (in millions, except net debt ratio) | Jun 30,
2013 | | Sep 30,
2013 | | Dec 31,
2013 | | Mar 31,
2014 | | Jun 30,
2014 | | Sep 30,
2014 | | Dec 31,
2014 |
| Net Debt (excluding Tower Obligations) to Last Twelve Months Adjusted EBITDA Ratio | | | | | | | | | | | | | |
| Short-term debt | $ | 210 |
| | $ | 195 |
| | $ | 244 |
| | $ | 151 |
| | $ | 272 |
| | $ | 1,168 |
| | $ | 87 |
|
| Long-term debt to affiliates | 11,200 |
| | 11,200 |
| | 5,600 |
| | 5,600 |
| | 5,600 |
| | 5,600 |
| | 5,600 |
|
| Long-term debt | 6,276 |
| | 6,761 |
| | 14,345 |
| | 14,331 |
| | 14,369 |
| | 16,284 |
| | 16,273 |
|
| Less: Cash and cash equivalents | (2,362 | ) | | (2,365 | ) | | (5,891 | ) | | (5,471 | ) | | (3,080 | ) | | (5,787 | ) | | (5,315 | ) |
| Net Debt (excluding Tower Obligations) | $ | 15,324 |
| | $ | 15,791 |
| | $ | 14,298 |
| | $ | 14,611 |
| | $ | 17,161 |
| | $ | 17,265 |
| | $ | 16,645 |
|
| Last twelve months Adjusted EBITDA * | 5,781 |
| | 5,433 |
| | 5,317 |
| | 4,936 |
| | 5,122 |
| | 5,124 |
| | 5,636 |
|
| Net Debt (excluding Tower Obligations) to Last Twelve Months Adjusted EBITDA Ratio | 2.7 |
| | 2.9 |
| | 2.7 |
| | 3.0 |
| | 3.4 |
| | 3.4 |
| | 3.0 |
|
| * Pro Forma Combined EBITDA | | | | | | | | | | | | | |
Pro Forma Combined Reconciliations
|
| | | | | | | | | | | | | | | | | | | | | | | | | | | | | | | | | | | | | | | |
| | Quarter | | Year Ended December 31, |
| (in millions) | Q1 2013 | | Q2 2013 | | Q3 2013 | | Q4 2013 | | Q1 2014 | | Q2 2014 | | Q3 2014 | | Q4 2014 | | 2013 | | 2014 |
| Service Revenues | | | | | | | | | | | | | | | | | | | |
T-Mobile (1) | $ | 4,005 |
| | $ | 4,756 |
| | $ | 5,138 |
| | $ | 5,169 |
| | $ | 5,337 |
| | $ | 5,484 |
| | $ | 5,684 |
| | $ | 5,870 |
| | $ | 19,068 |
| | $ | 22,375 |
|
| MetroPCS | 1,101 |
| | 366 |
| | — |
| | — |
| | — |
| | — |
| | — |
| | — |
| | 1,467 |
| | — |
|
| Total service revenues | $ | 5,106 |
| | $ | 5,122 |
| | $ | 5,138 |
| | $ | 5,169 |
| | $ | 5,337 |
| | $ | 5,484 |
| | $ | 5,684 |
| | $ | 5,870 |
| | $ | 20,535 |
| | $ | 22,375 |
|
| | | | | | | | | | | | | | | | | | | | |
| Branded Revenues | | | | | | | | | | | | | | | | | | | |
T-Mobile (1) | $ | 3,766 |
| | $ | 4,526 |
| | $ | 4,896 |
| | $ | 4,923 |
| | $ | 5,095 |
| | $ | 5,247 |
| | $ | 5,460 |
| | $ | 5,576 |
| | $ | 18,111 |
| | $ | 21,378 |
|
| MetroPCS | 1,101 |
| | 366 |
| | — |
| | — |
| | — |
| | — |
| | — |
| | — |
| | 1,467 |
| | — |
|
| Total branded revenues | $ | 4,867 |
| | $ | 4,892 |
| | $ | 4,896 |
| | $ | 4,923 |
| | $ | 5,095 |
| | $ | 5,247 |
| | $ | 5,460 |
| | $ | 5,576 |
| | $ | 19,578 |
| | $ | 21,378 |
|
| | | | | | | | | | | | | | | | | | | | |
| Branded Prepaid Revenues | | | | | | | | | | | | | | | | | | | |
T-Mobile (1) | $ | 503 |
| | $ | 1,242 |
| | $ | 1,594 |
| | $ | 1,606 |
| | $ | 1,648 |
| | $ | 1,736 |
| | $ | 1,790 |
| | $ | 1,812 |
| | $ | 4,945 |
| | $ | 6,986 |
|
| MetroPCS | 1,101 |
| | 366 |
| | — |
| | — |
| | — |
| | — |
| | — |
| | — |
| | 1,467 |
| | — |
|
| Total branded prepaid revenues | $ | 1,604 |
| | $ | 1,608 |
| | $ | 1,594 |
| | $ | 1,606 |
| | $ | 1,648 |
| | $ | 1,736 |
| | $ | 1,790 |
| | $ | 1,812 |
| | $ | 6,412 |
| | $ | 6,986 |
|
| | | | | | | | | | | | | | | | | | | | |
| Total Revenues | | | | | | | | | | | | | | | | | | | |
T-Mobile (1) | $ | 4,677 |
| | $ | 6,228 |
| | $ | 6,688 |
| | $ | 6,827 |
| | $ | 6,875 |
| | $ | 7,185 |
| | $ | 7,350 |
| | $ | 8,154 |
| | $ | 24,420 |
| | $ | 29,564 |
|
| MetroPCS | 1,287 |
| | 423 |
| | — |
| | — |
| | — |
| | — |
| | — |
| | — |
| | 1,710 |
| | — |
|
| Total revenues | $ | 5,964 |
| | $ | 6,651 |
| | $ | 6,688 |
| | $ | 6,827 |
| | $ | 6,875 |
| | $ | 7,185 |
| | $ | 7,350 |
| | $ | 8,154 |
| | $ | 26,130 |
| | $ | 29,564 |
|
|
| | | | | | | | | | | | | | | | | | | | | | | | | | | | | | | | | | | | | | | |
| | Quarter | | Year Ended December 31, |
| (in millions) | Q1 2013 | | Q2 2013 | | Q3 2013 | | Q4 2013 | | Q1 2014 | | Q2 2014 | | Q3 2014 | | Q4 2014 | | 2013 | | 2014 |
| Cash Capex - Property & Equipment | | | | | | | | | | | | | | | | |
T-Mobile (1) | $ | 1,076 |
| | $ | 1,050 |
| | $ | 1,017 |
| | $ | 882 |
| | $ | 947 |
| | $ | 940 |
| | $ | 1,131 |
| | $ | 1,299 |
| | $ | 4,025 |
| | $ | 4,317 |
|
| MetroPCS | 154 |
| | 61 |
| | — |
| | — |
| | — |
| | — |
| | — |
| | — |
| | 215 |
| | — |
|
| Total Cash Capex - Property & Equipment | $ | 1,230 |
| | $ | 1,111 |
| | $ | 1,017 |
| | $ | 882 |
| | $ | 947 |
| | $ | 940 |
| | $ | 1,131 |
| | $ | 1,299 |
| | $ | 4,240 |
| | $ | 4,317 |
|
| | | | | | | | | | | | | | | | | | | | |
| (1) The second quarter of 2013 represents the results for T-Mobile USA for April 2013 and the results for T-Mobile USA and MetroPCS on a combined basis for May and June 2013, as the business combination was completed on April 30, 2013. |
|
| | | | | | | | | | | | | | | | | | | | | | | | | | | | | | | | | | | | | | | |
| | Quarter | | Year Ended December 31, |
| (in millions) | Q1 2013 | | Q2 2013 | | Q3 2013 | | Q4 2013 | | Q1 2014 | | Q2 2014 | | Q3 2014 | | Q4 2014 | | 2013 | | 2014 |
| Simple Free Cash Flow | | | | | | | | | | | | | | | | | | | |
| Pro Forma Combined Adjusted EBITDA | $ | 1,469 |
| | $ | 1,265 |
| | $ | 1,344 |
| | $ | 1,239 |
| | $ | 1,088 |
| | $ | 1,451 |
| | $ | 1,346 |
| | $ | 1,751 |
| | $ | 5,317 |
| | $ | 5,636 |
|
| Pro Forma Combined Total Cash Capex - Property & Equipment | 1,230 |
| | 1,111 |
| | 1,017 |
| | 882 |
| | 947 |
| | 940 |
| | 1,131 |
| | 1,299 |
| | 4,240 |
| | 4,317 |
|
| Simple Free Cash Flow | $ | 239 |
| | $ | 154 |
| | $ | 327 |
| | $ | 357 |
| | $ | 141 |
| | $ | 511 |
| | $ | 215 |
| | $ | 452 |
| | $ | 1,077 |
| | $ | 1,319 |
|
Forward-Looking Statements
This Investor Factbook includes "forward-looking statements" within the meaning of the U.S. federal securities laws. Any statements made herein that are not statements of historical fact, including statements about T-Mobile US, Inc.'s plans, outlook, beliefs, opinion, projections, guidance, strategy, integration of MetroPCS, expected network modernization and other advancements, are forward-looking statements. Generally, forward-looking statements may be identified by words such as "anticipate," "expect," "suggests," "plan," “project,” "believe," "intend," "estimates," "targets," "views," "may," "will," "forecast," and other similar expressions. The forward-looking statements speak only as of the date made, are based on current assumptions and expectations, and involve a number of risks and uncertainties. Important factors that could affect future results and cause those results to differ materially from those expressed in the forward-looking statements include, among others, the following: our ability to compete in the highly competitive U.S. wireless telecommunications industry; adverse conditions in the U.S. and international economies and markets; significant capital commitments and the capital expenditures required to effect our business plan; our ability to adapt to future changes in technology, enhance existing offerings, and introduce new offerings to address customers' changing demands; changes in legal and regulatory requirements, including any change or increase in restrictions on our ability to operate our network; our ability to successfully maintain and improve our network, and the possibility of incurring additional costs in doing so; major equipment failures; severe weather conditions or other force majeure events; and other risks described in our filings with the Securities and Exchange Commission, including those described in our Annual Report on Form 10-K filed with the Securities and Exchange Commission on February 25, 2014. You should not place undue reliance on these forward-looking statements. We do not undertake to update forward-looking statements, whether as a result of new information, future events or otherwise, except as required by law.
About T-Mobile US, Inc.
As America's Un-carrier, T-Mobile US, Inc. (NYSE: TMUS) is redefining the way consumers and businesses buy wireless services through leading product and service innovation. The Company's advanced nationwide 4G LTE network delivers outstanding wireless experiences to more than 55 million customers who are unwilling to compromise on quality and value. Based in Bellevue, Washington, T-Mobile US provides services through its subsidiaries and operates its flagship brands, T-Mobile and MetroPCS. For more information, please visit http://www.T-Mobile.com.
Definitions of Terms
Operating and financial measures are utilized by T-Mobile's management to evaluate its operating performance and, in certain cases, its ability to meet liquidity requirements. Although companies in the wireless industry may not define measures in precisely the same way, T-Mobile believes the measures facilitate key operating performance comparisons with other companies in the wireless industry to provide management, investors, and analysts with useful information to assess and evaluate past performance and assist in forecasting future performance.
| |
| 1. | Customer - SIM card with a unique T-Mobile mobile identity number which generates revenue. Branded customers generally include customers that are qualified either for postpaid service, where they generally pay after incurring service, or prepaid service, where they generally pay in advance. Wholesale customers include Machine-to-Machine (M2M) and Mobile Virtual Network Operator (MVNO) customers that operate on T-Mobile's network, but are managed by wholesale partners. |
| |
| 2. | Churn - Number of customers whose service was discontinued as a percentage of the average number of customers during the specified period. |
| |
| 3. | Customers per account - The number of branded postpaid customers as of the end of the period divided by the number of branded postpaid accounts as of the end of the period. An account may include branded postpaid phone and mobile broadband customers. |
| |
| 4. | Average Revenue Per Account (ARPA) - Average monthly branded postpaid service revenue earned per account. Branded postpaid service revenues for the specified period divided by the average number of branded postpaid accounts during the period, further divided by the number of months in the period. T-Mobile considers branded postpaid ARPA to be indicative of its revenue growth potential given the increase in the average number of branded postpaid phone customers per account and increased penetration of mobile broadband devices. |
Average Billings Per Account (ABPA) - Average monthly branded postpaid service revenue earned from customers plus equipment installment plan (EIP) billings divided by the average number of branded postpaid accounts during the period, further divided by the number of months in the period. T-Mobile believes average branded postpaid customer billings per account is indicative of estimated cash collections, including equipment installments, from T-Mobile's customers each month on a per account basis.
Average Revenue Per User (ARPU) - Average monthly service revenue earned from customers. Service revenues for the specified period divided by the average customers during the period, further divided by the number of months in the period.
Branded postpaid phone ARPU excludes mobile broadband customers and related revenues.
Average Billings per User (ABPU) - Average monthly branded postpaid service revenue earned from customers plus EIP billings divided by the average branded postpaid customers during the period, further divided by the number of months in the period. T-Mobile believes branded postpaid ABPU is indicative of estimated cash collections, including equipment installments, from T-Mobile's customers each month.
Service revenues - Branded postpaid, including handset insurance, branded prepaid, wholesale, and roaming and other service revenues.
| |
| 5. | Cost of services - Costs to operate and maintain T-Mobile's networks, including direct switch and cell site costs, such as rent, fixed line costs, utilities, maintenance, and labor costs associated with network employees; long distance costs; regulatory fees; roaming fees paid to other carriers; fixed and variable costs paid to third parties for the use of proprietary data applications. |
Cost of equipment sales - Costs to sell T-Mobile's equipment, including equipment, accessories, inventory adjustments, shipping, and warranty expenses.
Selling, general and administrative expenses - Salaries and wages and benefits not directly attributable to a service or product; bad debt charges; taxes other than income taxes; advertising and sales commission costs; customer billing; call center and information technology costs; regulatory fees; professional service fees; and rent and utilities for administrative space.
| |
| 6. | Adjusted EBITDA - Earnings before interest expense (net of interest income), tax, depreciation, amortization, stock-based compensation and expenses not reflective of T-Mobile's ongoing operating performance. Adjusted EBITDA margin is Adjusted EBITDA divided by service revenues. Adjusted EBITDA is a non-GAAP financial measure utilized by T-Mobile's management to monitor the financial performance of its operations. T-Mobile uses Adjusted EBITDA internally as a metric to evaluate and compensate its personnel and management for their performance, and as a benchmark to evaluate T-Mobile's operating performance in comparison to its competitors. Management also uses Adjusted EBITDA to measure its ability to provide cash flows to meet future debt service, capital expenditures and working capital requirements, and to fund future growth. T-Mobile believes analysts and investors use Adjusted EBITDA as a supplemental measure to evaluate overall operating performance and facilitate comparisons with other wireless communications companies. Adjusted EBITDA has limitations as an analytical tool and should not be considered in isolation or as a substitute for income from operations, net income, or any other measure of financial performance reported in accordance with GAAP. The reconciliation of Adjusted EBITDA to net income (loss) is detailed in the Reconciliation of Non-GAAP Financial Measures to GAAP Financial Measures schedule. |
| |
| 7. | Cash capital expenditures - Amounts paid for construction and the purchase of property and equipment. |
| |
| 8. | Smartphones - UMTS/HSPA/HSPA+ 21/HSPA+ 42/4G LTE enabled converged devices, which integrate voice and data services. |
| |
| 9. | Simple Free Cash Flow - Adjusted EBITDA less cash capital expenditures. Simple Free Cash Flow is utilized by management as a measure of liquidity and an indicator of how much cash is generated from the ordinary course of business operations. Simple free cash flow should not be construed as an alternative to cash flows from operating activities as determined in accordance with GAAP. |
| |
| 10. | Net debt - Short-term debt, long-term debt to affiliates, and long-term debt (excluding tower obligations), less cash and cash equivalents. |