EXHIBIT 99.2
|
| | |
| | | |
| | T-Mobile US, Inc. | |
| | Investor Factbook | |
| | T-Mobile US Reports First Quarter 2017 Results | |
T-Mobile Celebrates 4 Years as a Public Company with Industry Leading Customer & Financial Growth and Game-Changing Spectrum Auction Results
1.1 Million Customer Net Additions, Record-Low Churn of 1.18%,
and 11% Growth in Service and Total Revenues
Industry-leading customer growth:
•1.1 million total net additions - 4 years of adding more than 1 million every quarter
•914,000 total branded postpaid net additions - expect to lead industry for the 5th consecutive quarter
•798,000 branded postpaid phone net additions - expect to capture over 250% of industry growth
•386,000 branded prepaid net additions - led by continued strong performance at MetroPCS
| |
| • | Record-low branded postpaid phone churn of 1.18% - down 15 bps YoY and 10 bps QoQ |
Industry-leading financial growth (all percentages year-over-year):
| |
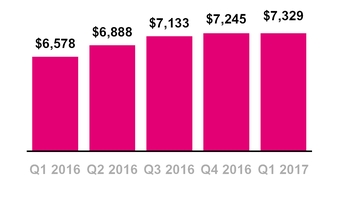
| • | $7.3 billion service revenues, up 11% - expect to lead industry in growth for the 12th consecutive quarter |
| |
| • | $9.6 billion total revenues, up 11%(1) - expect to lead industry in growth for the 15th quarter in past 4 years |
| |
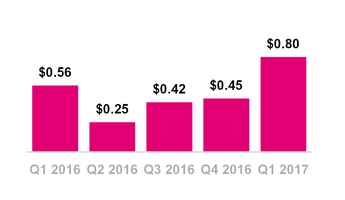
| • | $698 million net income, up 46%. Earnings per share ("EPS") of $0.80, up 43%. Excluding after-tax spectrum gains in Q1 2017 and Q1 2016, and certain net tax benefits related to a valuation allowance release recognized in Q1 2017, net income and EPS increased by $332 million and $0.38, respectively. |
| |
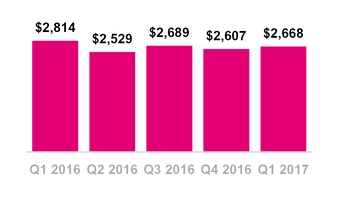
| • | $2.7 billion Adjusted EBITDA(1)(2), down 5%. Excluding spectrum gains Adjusted EBITDA up 21%. |
| |
| • | Net cash provided by operating activities of $1.7 billion. Free cash flow(2) of $185 million. |
Recent 600 MHz spectrum win is a game changer for wireless consumers:
| |
| • | Purchased 31 MHz of spectrum covering 100% of the U.S. for $8.0 billion, quadrupling our low-band holdings |
| |
| • | Won 45% of the spectrum sold, enabling more choice and competition for customers across the country |
| |
| • | Expect at least 10 MHz covering over one million square miles will be clear in 2017 |
| |
| • | Initial deployment of the spectrum will start in 2017 with handsets arriving in time for the Q4 2017 Holiday season |
Continued strong outlook for 2017:
•Guidance range for branded postpaid net additions increased to 2.8 to 3.5 million from 2.4 to 3.4 million
•Net income is not available on a forward looking basis(3)
| |
| • | Maintaining Adjusted EBITDA target of $10.4 to $10.8 billion, which includes leasing revenues of $0.8 to $0.9 billion.(2) |
•Maintaining guidance of $4.8 to $5.1 billion of cash capital expenditures, excluding capitalized interest
| |
| • | Three-year compound annual growth rates (CAGRs) for net cash provided by operating activities and free cash flow from FY 2016 to FY 2019 remain unchanged at 15% to 18% and 45% to 48%, respectively(2) |
________________________________________________________________
| |
| (1) | The amortized imputed discount on EIP receivables previously recognized as Interest income has been retrospectively reclassified as Other revenues. The effects of this change in accounting principle are provided in the financial tables on page 27. |
| |
| (2) | Adjusted EBITDA is a non-GAAP financial measure and Free Cash Flow is a non-GAAP financial metric. These non-GAAP financial items should be considered in addition to, but not as a substitute for, the information provided in accordance with GAAP. Reconciliations for these non-GAAP financial items to the most directly comparable GAAP financial items are provided in the financial tables on page 27 - 34. |
| |
| (3) | T-Mobile is not able to forecast net income on a forward looking basis without unreasonable efforts due to the high variability and difficulty in predicting certain items that affect GAAP net income including, but not limited to, income tax expense, stock based compensation expense, interest expense and interest income. |
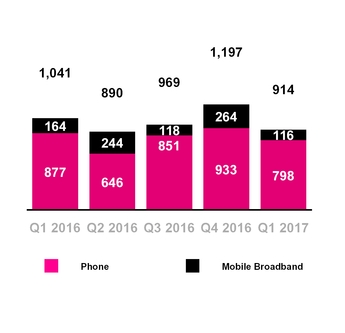
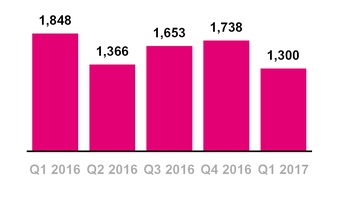
Total Branded Postpaid Net Additions
(in thousands)
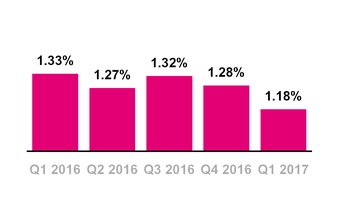
Branded Postpaid Phone Churn
CUSTOMER METRICS
Branded Postpaid Customers
| |
| ▪ | Branded postpaid phone net customer additions were 798,000 in Q1 2017 compared to 933,000 in Q4 2016 and 877,000 in Q1 2016. This is expected to mark the 13th consecutive quarter that T-Mobile has led the industry in branded postpaid phone net customer additions. |
| |
| ▪ | The sequential decrease was primarily due to seasonally lower gross additions, a delayed tax refund season, and the absence of an iconic device launch in the quarter, partially offset by decreased churn. |
| |
| ▪ | The year-over-year decrease was primarily due to increased competitive activity, the absence of iconic device launches during the quarter and a delayed tax refund season, partially offset by decreased churn. |
| |
| ▪ | Branded postpaid mobile broadband net customer additions were 116,000 in Q1 2017, compared to 264,000 in Q4 2016 and 164,000 in Q1 2016. |
| |
| ▪ | Branded postpaid net customer additions were 914,000 in Q1 2017 compared to 1,197,000 in Q4 2016 and 1,041,000 in Q1 2016. This is expected to mark the 5th consecutive quarter that T-Mobile has led the industry in branded postpaid net customer additions. |
| |
| ▪ | Branded postpaid phone churn was a record-low 1.18% in Q1 2017, down 10 basis points from 1.28% in Q4 2016 and down 15 basis points from 1.33% in Q1 2016. |
| |
| ▪ | On September 1, 2016, T-Mobile sold its marketing and distribution rights to certain existing T-Mobile co-branded customers to a current MVNO partner (the MVNO Transaction). The MVNO Transaction resulted in a re-categorization of 1.365 million branded postpaid phone customers and 326,000 branded prepaid customers to wholesale customers in Q3 2016. |
| |
| ▪ | The sequential decrease in branded postpaid phone churn was primarily due to seasonality, partially offset by increased competitive activity. |
| |
| ▪ | Year-over-year, branded postpaid phone churn was lower primarily as a result of the MVNO Transaction, as the customers transferred had a higher rate of churn. |
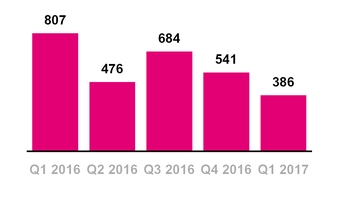
Total Branded Prepaid Net Additions
(in thousands)
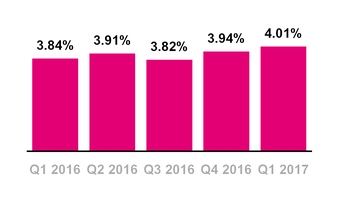
Branded Prepaid Churn
Total Branded Net Additions
(in thousands)
Branded Prepaid Customers
| |
| ▪ | Branded prepaid net customer additions were 386,000 in Q1 2017, compared to 541,000 in Q4 2016 and 807,000 in Q1 2016. |
| |
| ▪ | The sequential decrease was primarily due to lower gross additions from increased competitive activity and a delayed tax refund season, increased churn on a growing customer base, continued optimization of our third-party distribution channels and the ongoing de-emphasis of T-Mobile legacy prepaid products. |
| |
| ▪ | The year-over-year decrease was primarily driven by the continued optimization of our third-party distribution channels, including de-emphasis of T-Mobile legacy prepaid products, a delayed tax refund season, and higher MetroPCS deactivations from churn on a growing customer base and increased competitive activity. The decrease was partially offset by higher MetroPCS gross customer additions. |
| |
| ▪ | Migrations to branded postpaid plans reduced branded prepaid net customer additions in Q1 2017 by approximately 185,000, down from 210,000 in Q4 2016 and down from 200,000 in Q1 2016. |
| |
| ▪ | Branded prepaid churn was 4.01% in Q1 2017, compared to 3.94% in Q4 2016 and 3.84% in Q1 2016. |
| |
| ▪ | The sequential increase was due to the continued de-emphasis of T-Mobile legacy prepaid products as well as an increase in competitive activity. |
| |
| ▪ | The year-over-year increase was primarily due to higher MetroPCS churn from increased competitive activity, partially offset by de-emphasis of T-Mobile legacy prepaid products and a decrease in certain customers which have a higher rate of churn. The delayed tax refund season also contributed to the increase. |
Total Branded Customers
| |
| ▪ | Total branded net customer additions were 1,300,000 in Q1 2017, compared to 1,738,000 in Q4 2016 and 1,848,000 in Q1 2016. This was the 13th consecutive quarter in which branded net customer additions surpassed the one million milestone. |
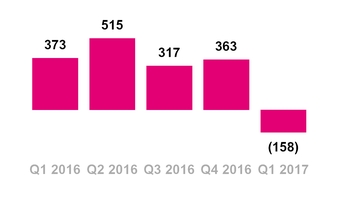
Wholesale Net Additions
(in thousands)
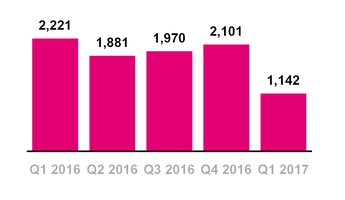
Total Net Additions
(in thousands)
Wholesale Customers
| |
| ▪ | Wholesale net customer losses were 158,000 in Q1 2017 compared to net additions of 363,000 in Q4 2016 and net additions of 373,000 in Q1 2016. |
| |
| ▪ | Sequentially, the decrease was primarily due to lower gross customer additions. |
| |
| ▪ | Year-over-year, the decrease was primarily due to higher MVNO deactivations as a result of our MVNO partners deemphasizing Lifeline in favor of higher ARPU customer categories. |
| |
| ▪ | Although wholesale customer additions are expected to be negative in 2017 as a result of the de-emphasis of Lifeline, we expect growth in total wholesale revenue and margin this year. |
Total Customers
| |
| ▪ | Total net customer additions were 1,142,000 in Q1 2017 compared to 2,101,000 in Q4 2016 and 2,221,000 in Q1 2016. This was the fourth straight year of adding more than one million total net customer every quarter. |
| |
| ▪ | T-Mobile ended Q1 2017 with 72.6 million total customers. |
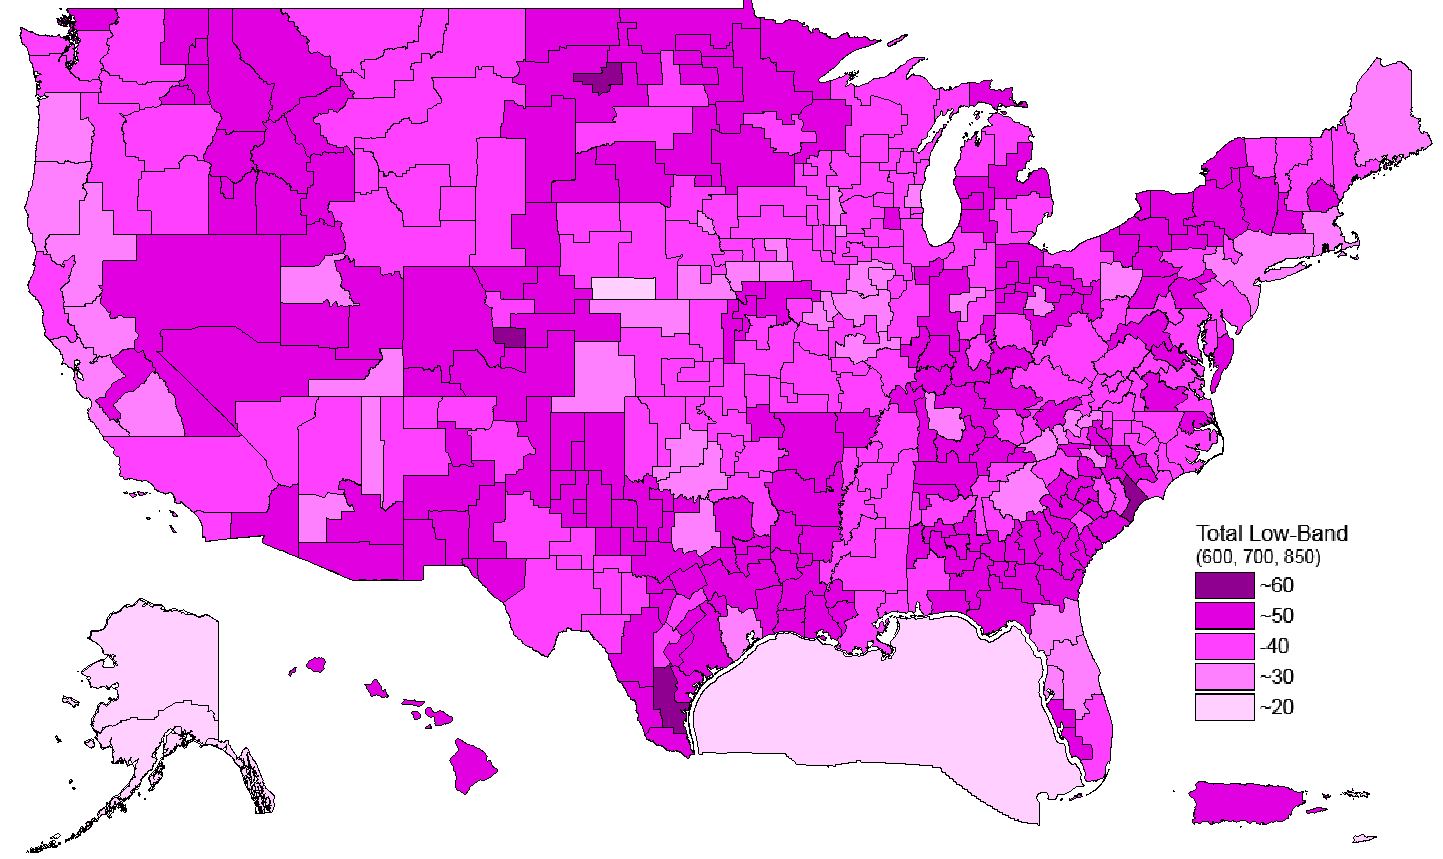
Depth of T-Mobile's Nationwide Low-Band Spectrum (600 MHz and 700 MHz)
NETWORK
Broadcast Incentive Auction Update
| |
| ▪ | On April 13, 2017, the FCC announced the results of the broadcast incentive auction which showed that T-Mobile has committed to purchase a nationwide average of 31 MHz of 600 MHz low-band spectrum covering 325 million POPs for $8.0 billion. |
| |
| ▪ | At the conclusion of the FCC's post-auction licensing process, T-Mobile will own approximately 41 MHz in the low-band (600 MHz and 700 MHz), quadrupling its existing low-band holdings. T-Mobile will own an average of 39 MHz in the Top 100 markets. |
| |
| ▪ | The purchased spectrum covers 100% of the U.S. and Puerto Rico and will be used to strengthen existing LTE coverage and increase capacity to meet customers' growing demand for mobile data. |
| |
| ▪ | T-Mobile expects that at least 10 MHz of 600 MHz spectrum covering over one million square miles will be clear in 2017 and we will begin to put this new spectrum to use to benefit T-Mobile and MetroPCS customers later this year. |
| |
| ▪ | Initial deployment of the spectrum will start in 2017 with handsets arriving in time for the Q4 2017 Holiday season. |
Network Transformation Update
| |
| ▪ | T-Mobile continues to increase the depth, breadth and functionality of the nation’s densest LTE network by adding new spectrum, re-farming existing spectrum, and implementing new technology. Collectively, these network advancements are providing improved network performance and reliability for T-Mobile's customers. |
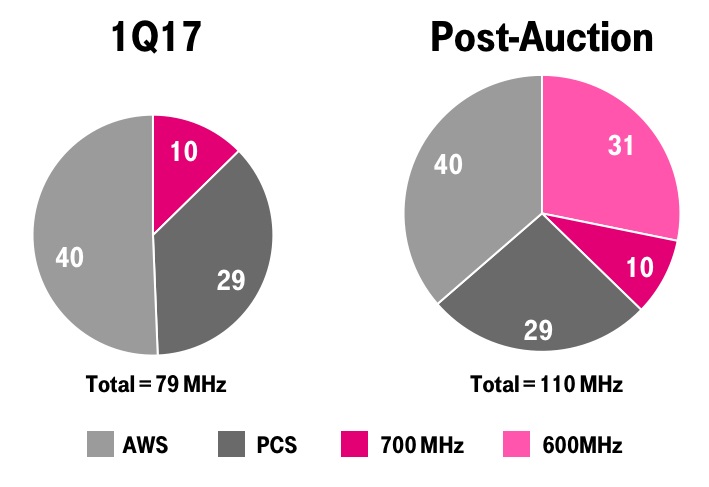
T-Mobile Average Spectrum
Ownership, All Markets
(Band, in MHz)
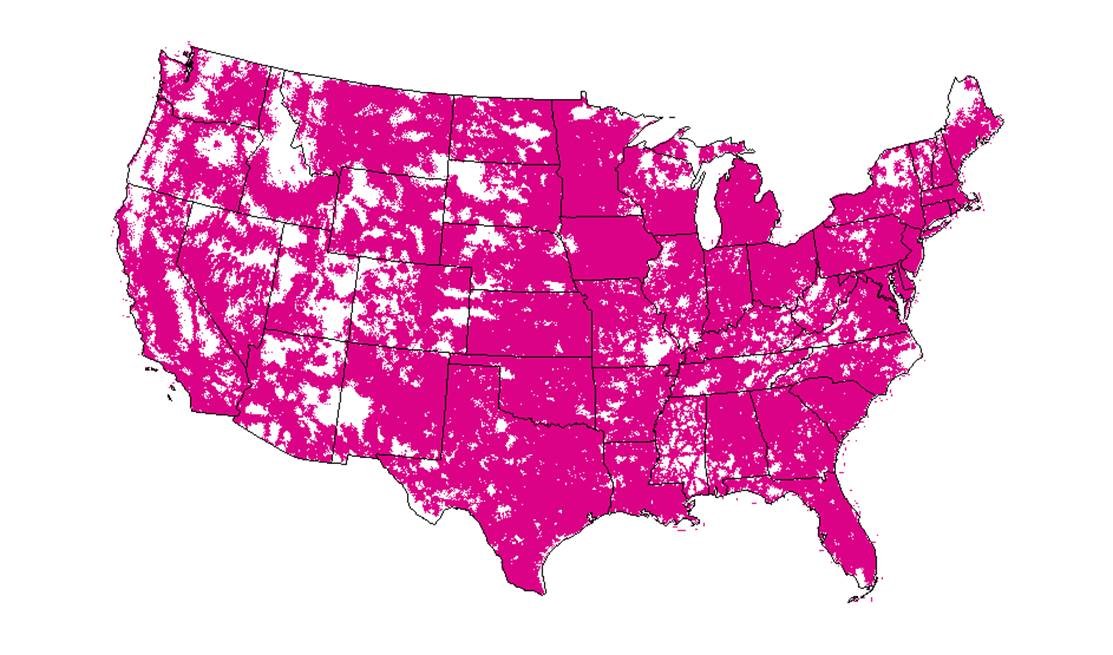
T-Mobile Projected Coverage Map
(as of December 31, 2017)
Spectrum Growth
| |
| ▪ | In Q1 2017, T-Mobile closed on the previously announced transaction for 700 MHz A-Block spectrum in Eastern Montana, bringing its total low-band spectrum holdings to 272 million POPs. |
| |
| ▪ | At the end of Q1 2017, T-Mobile owned an average of 79 MHz of spectrum nationwide. The spectrum is comprised of an average of 10 MHz in the 700 MHz band, 29 MHz in the 1900 MHz PCS band and 40 MHz in the AWS band. |
| |
| ▪ | Upon the conclusion of the FCC's post-auction licensing process, we will own an average of 110 MHz of spectrum nationwide, an increase of 39% in spectrum holdings compared to the end of Q1 2017. The spectrum is comprised of an average of 31 MHz in the 600 MHz band, 10 MHz in the 700 MHz band, 29 MHz in the 1900 MHz PCS band and 40 MHz in the AWS band. |
Network Coverage Growth
| |
| ▪ | T-Mobile continues to expand its coverage breadth and currently provides 4G LTE coverage to 314 million people. |
| |
| ▪ | We are targeting to provide 321 million people with 4G LTE coverage by year-end 2017. |
| |
| ▪ | T-Mobile has 700 MHz A-Block spectrum holdings covering 272 million people or approximately 84% of the U.S. population. The spectrum covers all of the top 10 market areas and 29 of the top 30 market areas in the U.S. |
| |
| ▪ | T-Mobile has substantially completed the deployment of its 700 MHz A-Block spectrum with the recent launch of Chicago. "Extended Range LTE" is now live in over 530 market areas covering 269 million people or approximately 99% of our 700 MHz A-Block spectrum holdings. |
| |
| ▪ | Our network expansion provides a unique ability to grow our distribution footprint by 30 to 40 million POPs. We plan to open 3,000 stores in 2017, including 1,500 T-Mobile stores and 1,500 MetroPCS stores. |
Network Capacity Growth
| |
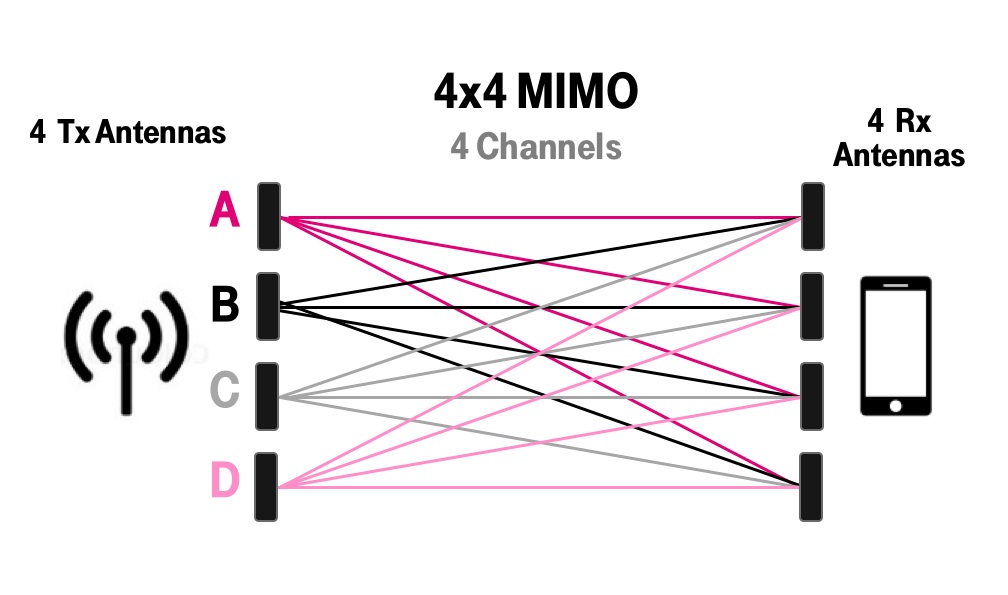
| ▪ | T-Mobile continues to expand its capacity through the re-farming of existing spectrum and implementation of new technologies including Voice over LTE ("VoLTE"), Carrier Aggregation, 4x4 MIMO, and 256 Quadrature Amplitude Modulation ("QAM"). |
| |
| ▪ | At the end of Q1 2017, approximately 71% of the then owned spectrum was being used for 4G LTE compared to 54% at the end of Q1 2016. We expect to continue to re-farm spectrum currently committed to 2G and 3G technologies. |
| |
| ▪ | Re-farmed spectrum enables T-Mobile to continue expanding Wideband LTE, which currently covers 235 million people. Wideband LTE refers to markets that have bandwidth of at least 15+15 MHz dedicated to 4G LTE. |
| |
| ▪ | VoLTE currently comprises approximately 70% of total voice calls compared to 51% in Q1 2016. Moving voice traffic to VoLTE frees up spectrum and allows for the transition of spectrum currently used for 2G and 3G to 4G LTE. T-Mobile is leading the U.S. wireless industry in terms of VoLTE migration. |
| |
| ▪ | Carrier aggregation is live for T-Mobile customers in 754 cities. This advanced technology delivers superior speed and performance by bonding two or three discrete spectrum channels together. |
| |
| ▪ | 4x4 MIMO is currently available in more than 340 cities. This technology effectively delivers twice the speed, and incremental network capacity, to customers by doubling the number of data paths between the cell site and a customer's device. |
| |
| ▪ | T-Mobile has rolled out 256 QAM, which increases the number of bits delivered per transmission to enable faster speed. |
| |
| ▪ | With the Samsung Galaxy S8, we have our first LTE-U capable device. Deployment of LTE-U capable network equipment has already started in limited locations and we plan to expand deployment through the coming year. |
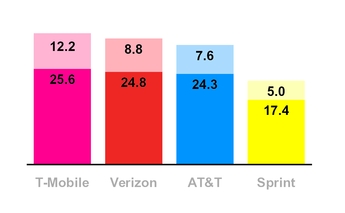
Average 4G LTE Download and
Upload Speeds - 1Q17
(in Mbps, D/L at Base, U/L at Top)
Based on T-Mobile's analysis of crowd-sourced 4G LTE download and upload speeds.
Network Speed Leadership
| |
| ▪ | T-Mobile continues to have the fastest nationwide 4G LTE network in the U.S. based on both download and upload speeds from millions of user-generated tests. This is the thirteenth consecutive quarter that T-Mobile has led the industry in both download and upload speeds. |
| |
| ▪ | In Q1 2017, T-Mobile’s average 4G LTE download speed was 25.6 Mbps compared to Verizon at 24.8 Mbps, AT&T at 24.3 Mbps and Sprint at 17.4 Mbps. |
| |
| ▪ | In Q1 2017, T-Mobile's average 4G LTE upload speed was 12.2 Mbps compared to Verizon at 8.8 Mbps, AT&T at 7.6 Mbps and Sprint at 5.0 Mbps. |
UN-CARRIER INITIATIVES
Un-carrier Updates
| |
| ▪ | Un-carrier Next: On January 5, 2017, T-Mobile announced that it would go "All In" on Unlimited by making T-Mobile ONE the only postpaid consumer plan available at the Un-carrier. Existing customers can remain on their current plans at their current pricing for as long as they remain a customer, but new consumer postpaid customers will join T-Mobile ONE exclusively. We also announced that we are including sales taxes and regulatory fees in the monthly service plan price for T-Mobile ONE, so that the advertised price is actually what the customer pays. In addition, T-Mobile extended the Un-contract to T-Mobile ONE, guaranteeing that pricing on T-Mobile ONE Unlimited 4G LTE plans will never change for current customers. For the customers that use less data, T-Mobile introduced KickBack on T-Mobile ONE, which will credit up to $10 every month to each participating line that uses 2 GB or less in a month. |
|
| | | | | | |
| Devices Sold or Leased |
| (in million units) |
| | | Q1 2016 | | Q4 2016 | | Q1 2017 |
| Total Company | | | | | | |
| Smartphones | | 8.8 | | 9.9 | | 8.6 |
| Non-Smartphones | | 0.2 | | 0.1 | | — |
| Mobile Broadband Devices | | 0.4 | | 0.5 | | 0.4 |
| Total Company | | 9.4 | | 10.5 | | 9.0 |
DEVICES
| |
| ▪ | Total devices sold or leased were 9.0 million units in Q1 2017 compared to 10.5 million units in Q4 2016 and 9.4 million units in Q1 2016. |
| |
| ▪ | Total smartphones sold or leased were 8.6 million units in Q1 2017 compared to 9.9 million units in Q4 2016 and 8.8 million units in Q1 2016. The sequential decline was primarily due to seasonality. |
| |
| ▪ | The upgrade rate for branded postpaid customers was approximately 7% in Q1 2017 compared to approximately 10% in Q4 2016 and approximately 7% in Q1 2016. |
Total EIP Receivables, net and QoQ
Change in Total EIP Receivables
($ in millions)
QoQ Chng in Total EIP — Total EIP Rec., net
Leased Devices Transferred to P&E,
net and Lease Revenues
($ in millions)
Leased Devices Trans. to P&E
DEVICE FINANCING
Equipment Installment Plans (EIP)
| |
| ▪ | T-Mobile provided $1.339 billion in gross EIP device financing to its customers in Q1 2017, down 31.5% from $1.956 billion in Q4 2016 and up 7.5% from $1.246 billion in Q1 2016. |
| |
| ▪ | Customers on T-Mobile plans had associated EIP billings of $1.402 billion in Q1 2017, up 2.3% compared to $1.370 billion in Q4 2016 and up 5.9% from $1.324 billion in Q1 2016. |
| |
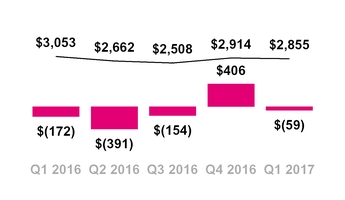
| ▪ | Total EIP receivables, net of imputed discount and allowances for credit losses, were $2.855 billion at the end of Q1 2017, compared to $2.914 billion at the end of Q4 2016 and $3.053 billion at the end of Q1 2016. |
| |
| ▪ | The sequential decrease was primarily due to continued growth in EIP billings exceeding EIP device financing in a seasonally slower quarter without iconic device launches. |
| |
| ▪ | The year-over-year decline was primarily due to sales of certain EIP receivables and an increase in EIP billings, partially offset by an increase in the gross amount of equipment financed on EIP. |
Leasing Plans
| |
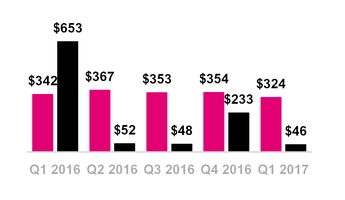
| ▪ | Leased devices transferred from inventory to property and equipment, net was $46 million in Q1 2017, compared to $233 million in Q4 2016 and $653 million in Q1 2016. |
| |
| ▪ | The sequential decrease was primarily due to existing JUMP! On Demand customers upgrading their devices in Q4 2016 primarily due to the continued success of the iPhone 7 launch. |
| |
| ▪ | The year-over-year decline was primarily due to an increase in devices financed due to our focus on EIP sales in 2017, compared to focus on devices financed on JUMP! On Demand for the first portion of Q1 2016. |
| |
| ▪ | Depreciation expense associated with leased devices was $379 million in Q1 2017 compared to $361 million in Q4 2016 and $403 million in Q1 2016. |
| |
| ▪ | Leased devices included in property and equipment, net were $1.097 billion at the end of Q1 2017, compared to $1.431 billion at the end of Q4 2016 and $2.223 billion at the end of Q1 2016. |
| |
| ▪ | Lease revenues were $324 million in Q1 2017, compared to $354 million in Q4 2016 and $342 million in Q1 2016. |
| |
| ▪ | Future minimum lease payments expected to be received over the lease term were $599 million at the end of Q1 2017, down from $802 million at the end of Q4 2016 and down from $1.425 billion at the end of Q1 2016. Future minimum lease payments exclude optional residual buy-out amounts at the end of the lease term. |
Total Bad Debt Expense and Losses from Sales of Receivables
($ in millions, % of Total Revs (1))
| |
| (1) | The amortized imputed discount on EIP receivables previously recognized as Interest income has been retrospectively reclassified as Other revenues. See Effect of Change in Accounting Principle table for further detail. |
CUSTOMER QUALITY
| |
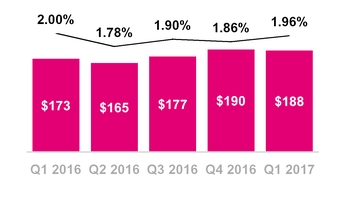
| ▪ | Total bad debt expense and losses from sales of receivables was $188 million in Q1 2017, compared to $190 million in Q4 2016 and $173 million in Q1 2016. |
| |
| ▪ | As a percentage of total revenues, total bad debt expense and losses from sales of receivables was 1.96% in Q1 2017, compared to 1.86% in Q4 2016 and 2.00% in Q1 2016. |
| |
| ▪ | Sequentially, total bad debt expense and losses from sales of receivables decreased by $2 million. As a percentage of total revenues, bad debt expense and losses from sales of receivables increased 10 basis points sequentially, but marked a record-low for a first quarter, reflecting our ongoing focus on managing customer quality. |
| |
| ▪ | Year-over-year, total bad debt expense and losses from sales of receivables increased by $15 million but decreased by 4 basis points as a percentage of total revenues, reflecting our ongoing focus on managing customer quality. |
| |
| ▪ | Including the EIP receivables sold, total EIP receivables classified as Prime were 53% of total EIP receivables at the end of Q1 2017, flat compared to 53% at the end of Q4 2016 and up compared to 52% at the end of Q1 2016. Excluding the receivables sold, EIP receivables classified as Prime were 43% at the end of Q1 2017, down compared to 44% at the end of Q4 2016 and down compared to 47% at the end of Q1 2016. The year-over-year decline in EIP receivables classified as Prime was due to the sale of certain EIP receivables. |
Branded Postpaid Phone ARPU
($ per month)
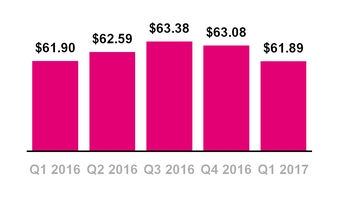
Branded Postpaid ABPU
($ per month)
OPERATING METRICS
Branded Postpaid Phone ARPU
| |
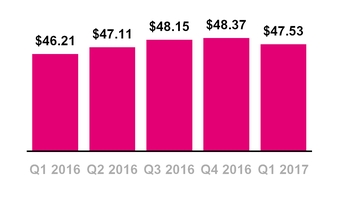
| ▪ | Branded postpaid phone ARPU was $47.53 in Q1 2017, down 1.7% from $48.37 in Q4 2016 and up 2.9% from $46.21 in Q1 2016. |
| |
| ▪ | Sequentially, the positive impact of growth in |
T-Mobile ONE rate plans and benefits from Data Stash were more than offset by decreases in taxes and fee revenue from the adoption of Un-carrier Next and promotional activity.
| |
| ▪ | Year-over-year, the increase was primarily due to benefits from Data Stash, a net positive impact from the T-Mobile ONE rate plans, inclusive of Un-Carrier Next, and the MVNO Transaction. These increases were partially offset by dilution from promotional activities. |
| |
| ▪ | T-Mobile continues to expect that branded postpaid phone ARPU in full-year 2017 will be generally stable compared to full-year 2016, with some quarterly variations driven by the actual migrations to T-Mobile ONE rate plans, inclusive of Un-carrier Next. |
Branded Postpaid ABPU
| |
| ▪ | Branded postpaid ABPU was $61.89 in Q1 2017, down 1.9% from $63.08 in Q4 2016 and flat compared to Q1 2016. |
| |
| ▪ | Sequentially, the decrease was primarily due to a decline in branded postpaid phone ARPU and lower lease revenues. |
| |
| ▪ | Year-over-year, branded postpaid ABPU was flat as the decrease in lease revenues was partially offset by higher branded postpaid service revenues. |
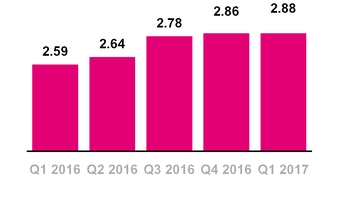
Branded Postpaid Customers per Account
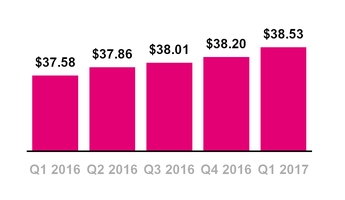
Branded Prepaid ARPU
($ per month)
Branded Postpaid Customers per Account
| |
| ▪ | Branded postpaid customers per account was 2.88 at the end of Q1 2017, compared to 2.86 at the end of Q4 2016 and 2.59 at the end of Q1 2016. |
| |
| ▪ | Sequentially, the slight increase was primarily due to growth of customers on promotions targeting families. |
| |
| ▪ | Year-over-year, the increase was primarily due to growth in customers on promotions targeting families, increased penetration of mobile broadband devices, and the MVNO Transaction. |
Branded Prepaid ARPU
| |
| ▪ | Branded prepaid ARPU was $38.53 in Q1 2017, up 0.9% from $38.20 in Q4 2016 and up 2.5% compared to $37.58 in Q1 2016. |
| |
| ▪ | Sequentially and year-over-year, the increase was primarily due to continued growth of MetroPCS customers, who generate higher ARPU, a de-emphasis of T-Mobile legacy prepaid products, and a decrease in certain other customers that had lower ARPU. |
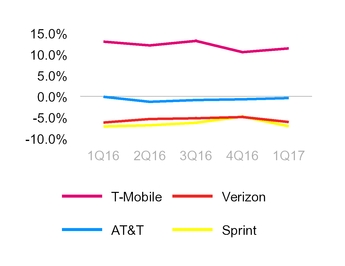
Service Revenue Growth at
Wireless Peers
(YoY % Growth)
Based on reported results if available or based on consensus
expectations if company has not yet reported quarterly results.
Service Revenues
($ in millions)
REVENUES
Service Revenues
| |
| ▪ | T-Mobile is expected to once again lead the industry in year-over-year service revenue percentage growth in Q1 2017. This is expected to mark the 12th consecutive quarter that T-Mobile has led the industry in this measure. |
| |
| ▪ | Service revenues were $7.329 billion in Q1 2017, up 1.2% from $7.245 billion in Q4 2016 and up 11.4% from $6.578 billion in Q1 2016. |
| |
| ▪ | Sequentially, the increase was primarily due to growth in both postpaid and prepaid revenues driven by the continued growth in our customer base and the impact from Data Stash, partially offset by a decrease in roaming and other service revenue. |
| |
| ▪ | Year-over-year, the increase was primarily due to growth in our postpaid and prepaid revenues. Postpaid revenues increased due to growth in the customer base driven by strong customer response to our Un-carrier initiatives and promotions for services and devices, higher branded postpaid phone ARPU including the impact of a decrease in the non-cash net revenue deferral for Data Stash, partially offset by the MVNO Transaction. Prepaid revenues increased due to the expansion into new markets, and the success of the MetroPCS brand, and higher branded prepaid ARPU, partially offset by the impact from the optimization of our third-party distribution channels including the de-emphasis of T-Mobile legacy prepaid products. |
Equipment Revenues
($ in millions)
Total Revenues (1)
($ in millions)
| |
| (1) | The amortized imputed discount on EIP receivables previously recognized as Interest income has been retrospectively reclassified as Other revenues. See the Effect of Change in Accounting Principle table for further detail. |
Equipment Revenues
| |
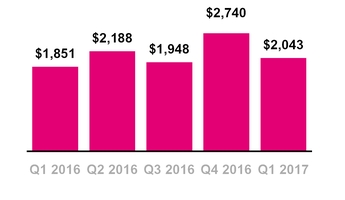
| ▪ | Equipment revenues were $2.043 billion in Q1 2017, down 25.4% from $2.740 billion in Q4 2016 and up 10.4% from $1.851 billion in Q1 2016. Equipment revenues in Q1 2017 were comprised of lease revenues of $324 million and non-lease revenues of $1.719 billion. |
| |
| ▪ | Sequentially, the decrease was due primarily to a lower average revenue per device sold as well as a seasonally lower number of devices sold. This decrease also reflects the absence of an iconic device launch in Q1 2017. |
| |
| ▪ | Year-over-year, the increase was primarily due to an increase in the number of devices sold and a higher average revenue per device sold due to the continued focus on EIP sales. An increase from purchased leased devices and higher SIM and accessory revenue also contributed to the year-over-year increase. Under the JUMP! On Demand program, upon device upgrade or at lease end, customers must return or purchase their device. The residual value of purchased leased devices is recorded as equipment revenues when revenue recognition criteria have been met. |
Total Revenues
| |
| ▪ | T-Mobile is expected to once again lead the industry in year-over-year total revenue percentage growth in Q1 2017. This is expected to mark the 15th quarter in the past four years that T-Mobile has led the industry in year-over-year total revenue percentage growth. |
| |
| ▪ | In Q1 2017, we implemented a previously announced change in presentation related to imputed interest associated with EIP receivables. Under the new presentation, the amortized imputed discount on EIP receivables previously recognized as Interest income has been retrospectively reclassified as Other revenues, which is included in Total revenues. See the Effect of Change in Accounting Principle table for further detail. |
| |
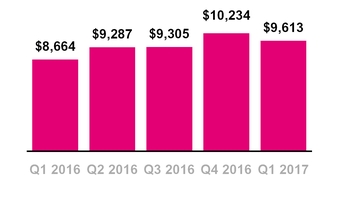
| ▪ | Total revenues were $9.613 billion in Q1 2017, down 6.1% from $10.234 billion in Q4 2016 and up 11.0% from $8.664 billion in Q1 2016. |
| |
| ▪ | The sequential decrease was primarily due to lower equipment revenues, partially offset by higher service revenues. |
| |
| ▪ | The year-over-year increase was primarily due to higher service revenues and equipment revenues. |
Cost of Services
($ in millions, % of Service Revs)
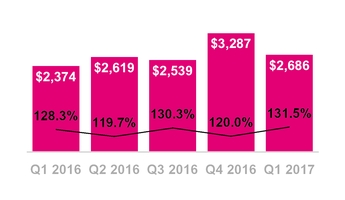
Cost of Equipment Sales
($ in millions, % of Equipment Revs)
OPERATING EXPENSES
Cost of Services
| |
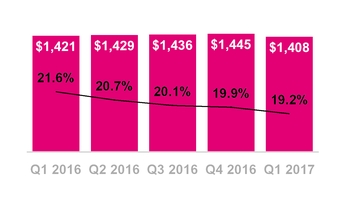
| ▪ | Cost of services was $1.408 billion in Q1 2017, down 2.6% from $1.445 billion in Q4 2016 and down 0.9% from $1.421 billion in Q1 2016. |
| |
| ▪ | Sequentially, the decreased was primarily due to lower regulatory program, long distance, and toll costs, partially offset by expenses associated with network expansion. As a percentage of service revenues, cost of service declined by 70 basis points sequentially. |
| |
| ▪ | Year-over-year, the decrease was primarily due to lower regulatory program and long distance and toll costs, as well as lower lease expense associated with reciprocal spectrum license lease agreements, partially offset by expenses associated with network expansion. As a percentage of service revenues, cost of service declined by 240 basis points year-over-year. |
Cost of Equipment Sales
| |
| ▪ | Cost of equipment sales was $2.686 billion in Q1 2017, down 18.3% from $3.287 billion in Q4 2016 and up 13.1% from $2.374 billion in Q1 2016. |
| |
| ▪ | Sequentially, the decrease was primarily due to a seasonally lower number of devices sold as well as a lower average cost per device sold. This decrease also reflects the absence of an iconic device launch in Q1 2017 and a decrease in warranty program costs. |
| |
| ▪ | Year-over-year, the increase was primarily due to an increase in the number of devices sold, a higher average cost per device sold due to the continued focus on EIP sales and an increase from purchased leased devices, partially offset by a decrease in the impact of returned leased devices. Under the JUMP! On Demand program, upon device upgrade or at lease end, customers must return or purchase their device. The cost of purchased leased devices is recorded as cost of equipment sales. Returned devices transferred from Property and equipment, net are recorded as inventory and are valued at the lower of cost or market with any write-down to market recognized as cost of equipment sales. |
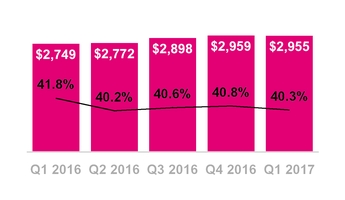
SG&A Expense
($ in millions, % of Service Revs)
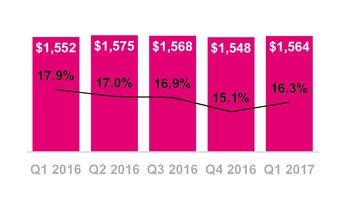
D&A Expense
($ in millions, % of Total Revs(1))
| |
| (1) | The amortized imputed discount on EIP receivables previously recognized as Interest income has been retrospectively reclassified as Other revenues. See the Effect of Change in Accounting Principle table for further detail. |
Selling, General and Admin. (SG&A) Expense
| |
| ▪ | SG&A expense was $2.955 billion in Q1 2017, down 0.1% from $2.959 billion in Q4 2016 and up 7.5% from $2.749 billion in Q1 2016. |
| |
| ▪ | Sequentially, the slight decrease was primarily due to a seasonally lower volume of gross customer additions, partially offset by strategic investments to support growing the customer base. As a percentage of service revenues, SG&A expense declined by 50 basis points sequentially. |
| |
| ▪ | Year-over-year, the increase was primarily due to strategic investments to support growing the customer base including higher employee-related costs, commissions and promotional costs. As a percentage of service revenues, SG&A declined by 150 basis points year-over-year. |
Depreciation and Amortization (D&A)
| |
| ▪ | D&A was $1.564 billion in Q1 2017, up 1.0% from $1.548 billion in Q4 2016 and up 0.8% from $1.552 billion in Q1 2016. |
| |
| ▪ | D&A related to leased devices was $379 million in Q1 2017 compared to $361 million in Q4 2016 and $403 million in Q1 2016. |
| |
| ▪ | Non-lease related D&A was $1,185 million in Q1 2017 compared to $1,187 million in Q4 2016 and $1,149 million in Q1 2016. |
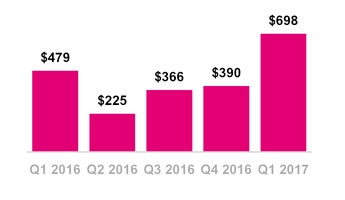
Net Income
($ in millions)
Earnings Per Share
NET INCOME AND EARNINGS PER SHARE
| |
| ▪ | Net income was $698 million in Q1 2017, up 79.0% from $390 million in Q4 2016 and up 45.7% from $479 million in Q1 2016. |
| |
| ▪ | Earnings per share was $0.80 in Q1 2017 up from $0.45 in Q4 2016 and $0.56 in Q1 2016. |
| |
| ▪ | Sequentially, the increases in net income and earnings per share were primarily due to $270 million in net tax benefits recognized in Q1 2017 related to a valuation allowance release, higher operating income, as well as after-tax spectrum gains of $23 million recognized in Q1 2017. Excluding the net tax benefits and after-tax spectrum gains recognized in Q1 2017, net income was up $15 million from $390 million to $405 million and EPS was up $0.03 from $0.45 to $0.48. |
| |
| ▪ | Net income as a percentage of service revenue was 9.5% in Q1 2017 compared to 5.4% in Q4 2016. Net income, excluding the $270 million net tax benefits and $23 million after-tax spectrum gains recognized in Q1 2017, as a percentage of service revenue was 5.5% in Q1 2017, up from 5.4% in Q4 2016. |
| |
| ▪ | Year-over-year, the increases in net income and earnings per share were primarily due to higher service and equipment revenues and $270 million in net tax benefits recognized in Q1 2017 partially offset by lower after-tax spectrum gains of $23 million and $406 million recognized in Q1 2017 and Q1 2016, respectively and higher cost of equipment sales and SG&A. Excluding the after-tax spectrum gains recognized in Q1 2017 and Q1 2016 and net tax benefits recognized in Q1 2017, net income was up $332 million from $73 million to $405 million and EPS was up $0.38 from $0.10 to $0.48. |
| |
| ▪ | Net income as a percentage of service revenue was 9.5% in Q1 2017 compared to 7.3% in Q1 2016. Net income, excluding the $270 million net tax benefits in Q1 2017 and $23 million after-tax spectrum gains recognized in Q1 2017 and Q1 2016, as a percentage of service revenue was 5.5% in Q1 2017, up from 1.1% in Q1 2016. |
Adjusted EBITDA(1)
($ in millions)
| |
| (1) | The amortized imputed discount on EIP receivables previously recognized as Interest income has been retrospectively reclassified as Other revenues. See the Effect of Change in Accounting Principle table for further detail. |
ADJUSTED EBITDA
| |
| ▪ | Adjusted EBITDA was $2.668 billion in Q1 2017, up 2.3% from $2.607 billion in Q4 2016 and down 5.2% from $2.814 billion in Q1 2016. |
| |
| ▪ | In Q1 2017, we implemented a previously announced change in presentation related to imputed interest associated with EIP receivables. Under the new presentation, the amortized imputed discount on EIP receivables previously recognized as Interest income has been retrospectively reclassified as Other revenues, which is included in Total revenues. See the Effect of Change in Accounting Principle table for further detail. |
| |
| ▪ | Sequentially, the increase in Adjusted EBITDA was primarily due to higher service revenues and improved cost performance in cost of service and SG&A, partially offset by higher losses on equipment. In addition, Adjusted EBITDA benefited from pre-tax spectrum gains of $37 million in Q1 2017. Excluding spectrum gains, Adjusted EBITDA growth was 0.9% sequentially. |
| |
| ▪ | Year-over-year, the decrease in Adjusted EBITDA was primarily due to lower spectrum gains in Q1 2017 compared to Q1 2016, higher selling, general and administrative expenses, and higher losses on equipment. These decreases were partially offset by higher branded postpaid and prepaid service revenues. Adjusted EBITDA included pre-tax spectrum gains of $37 million in Q1 2017 as compared to $636 million in Q1 2016. Excluding spectrum gains, Adjusted EBITDA growth was 20.8% year-over-year. |
| |
| ▪ | Adjusted EBITDA margin was 36% in Q1 2017, compared to 36% in Q4 2016 and 43% in Q1 2016. Adjusted EBITDA margin is calculated as Adjusted EBITDA divided by service revenues. Excluding spectrum gains, Adjusted EBITDA margin was 36% in Q1 2017, compared to 36% in Q4 2016 and 33% in Q1 2016. |
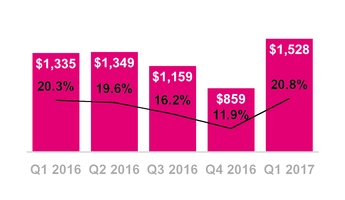
Cash Capital Expenditures
($ in millions, % of Service Revs)
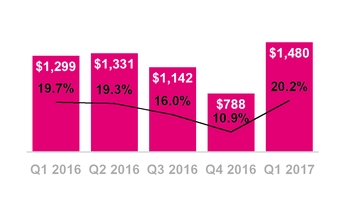
Cash Capital Expenditures,
Excluding Capitalized Interest
($ in millions, % of Service Revs)
CAPITAL EXPENDITURES
| |
| ▪ | Cash capital expenditures for property and equipment were $1.528 billion in Q1 2017, compared to $0.859 billion in Q4 2016 and $1.335 billion in Q1 2016. The sequential and year-over-year increases were due primarily to the build out of our 4G LTE network. |
| |
| ▪ | Cash capital expenditures for property and equipment excluding capitalized interest were $1.480 billion in Q1 2017, compared to $0.788 billion in Q4 2016 and $1.299 billion in Q1 2016. |
| |
| ▪ | Capitalized interest included in cash capital expenditures was $48 million in Q1 2017 compared to $71 million in Q4 2016 and $36 million in Q1 2016. |
Net Cash Provided by Operating Activities
($ in millions)
Net Cash Used in Investing Activities
($ in millions)
CASH FLOW
Operating Activities
| |
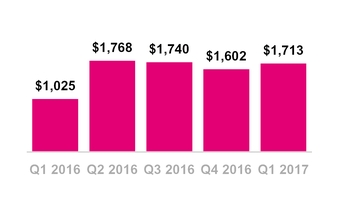
| ▪ | Net cash provided by operating activities was $1.713 billion in Q1 2017, compared to $1.602 billion in Q4 2016 and $1.025 billion in Q1 2016. |
| |
| ▪ | Sequentially, the increase was primarily due to changes in working capital. Within working capital, the change in EIP receivables was primarily due to continued growth in EIP billings exceeding EIP device financing in a seasonally slower quarter without iconic device launches. The pay-down of accounts payable and accrued liabilities was $651 million in Q1 2017 compared to net cash provided by growth in accounts payable and accrued liabilities of $367 million in Q4 2016. |
| |
| ▪ | Year-over-year, the increase was primarily due a decrease in net cash outflows from changes in working capital, including changes in inventories, partially offset by other current and long-term liabilities, other current and long-term assets, and an increased pay-down of accounts payable and accrued liabilities. The pay-down of accounts payable and accrued liabilities was $651 million in Q1 2017 compared to $492 million in Q1 2016. |
Investing Activities
| |
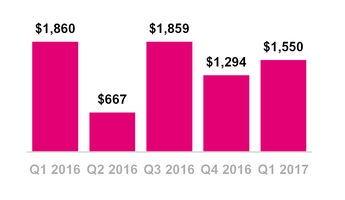
| ▪ | Cash used in investing activities was $1.550 billion in Q1 2017 compared to $1.294 billion in Q4 2016 and $1.860 billion in Q1 2016. |
| |
| ▪ | Sequentially, the increase was primarily due to an increase in cash capital expenditures, partially offset by less capital invested in the purchase of spectrum licenses in Q1 2017. |
| |
| ▪ | Year-over-year, the decrease was primarily due to less capital invested in the purchase of spectrum licenses, partially offset by an increase in cash capital expenditures. |
Net Cash Provided by (Used in)
Financing Activities
($ in millions)
Free Cash Flow
($ in millions)
Financing Activities
| |
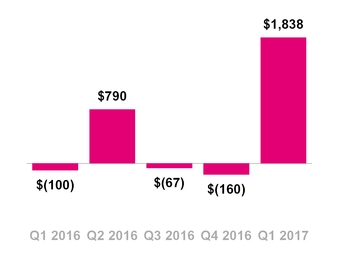
| ▪ | Cash provided by financing activities was an inflow of $1.838 billion in Q1 2017 compared to an outflow of $160 million in Q4 2016 and an outflow of $100 million in Q1 2016. |
| |
| ▪ | Sequentially and year-over-year, the increase was primarily due to issuances of long-term debt, partially offset by repayments of long-term debt. |
FREE CASH FLOW
| |
| ▪ | Free Cash Flow was an inflow of $185 million in Q1 2017, compared to an inflow of $743 million in Q4 2016 and an outflow of $310 million in Q1 2016. |
| |
| ▪ | Sequentially, the decrease was due to cash used for capital expenditures, partially offset by an increase in cash provided by operating activities including an increase in net income and changes in working capital. Within working capital, the change in EIP receivables was primarily due to continued growth in EIP billings exceeding EIP device financing in a seasonally slower quarter without iconic device launches. The pay-down of accounts payable and accrued liabilities was $651 million in Q1 2017 compared to net cash provided by accounts payable and accrued liabilities of $367 million in Q4 2016. |
| |
| ▪ | Year-over-year, the increase was due to higher net cash provided by operating activities including changes in inventories, partially offset by other current and long-term liabilities, other current and long-term assets, and an increased pay-down of accounts payable and accrued liabilities. The pay-down of accounts payable and accrued liabilities was $651 million in Q1 2017 compared to $492 million in Q1 2016. The increase in cash provided by operating activities was partially offset by higher purchases of property and equipment from the build-out of our 4G LTE network. |
Total Debt and Net Debt (excl. Tower Obligations)
($ in billions, Net Debt to LTM Adj. EBITDA(1))
Total Debt (excl. Tower Obligations) Net Debt (excl. Tower Obligations) — Net Debt to LTM Adj. EBITDA
| |
| (1) | The amortized imputed discount on EIP receivables previously recognized as Interest income has been retrospectively reclassified as Other revenues. See the Effect of Change in Accounting Principle table for further detail. |
CAPITAL STRUCTURE
| |
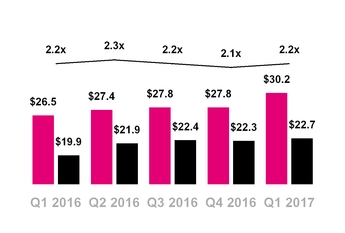
| ▪ | Total debt, excluding tower obligations, at the end of Q1 2017 was $30.247 billion and was comprised of short-term debt of $7.542 billion, long-term debt to affiliates of $9.600 billion and long-term debt of $13.105 billion. |
| |
| ▪ | Net debt, excluding tower obligations, at the end of Q1 2017 was $22.746 billion. |
| |
| ▪ | The ratio of net debt, excluding tower obligations, to Adjusted EBITDA for the trailing last twelve month (“LTM”) period was 2.2x at the end of Q1 2017 compared to 2.1x at the end of Q4 2016 and 2.2x at the end of Q1 2016. |
| |
| ▪ | In January 2017, T-Mobile USA borrowed $4.0 billion (which included $660 million from the December 29, 2016 commitment) under a secured term loan facility (“Incremental Term Loan Facility”) with Deutsche Telekom to refinance $1.98 billion of outstanding secured term loans under its Term Loan Credit Agreement dated November 9, 2015, with the remaining proceeds from the transaction intended to be used to redeem callable high yield debt. |
| |
| ▪ | In March 2017, T-Mobile USA issued public Senior Notes with an aggregate principal amount of $1.5 billion. Issuance costs totaled $5 million and we intend to use the net proceeds of $1.495 billion to redeem callable high yield debt. |
| |
| ▪ | During the quarter, we redeemed two Senior Notes with an aggregate principal amount of $1.5 billion. As of March 31, 2017, we had delivered the note redemptions for 5 Senior Notes, with an aggregate principal amount of $6.75 billion. The total aggregate amount related to these notes of $6.75 billion had not been redeemed and was classified as Short-term debt as of March 31, 2017. In April 2017, we redeemed one of the Senior Notes with an aggregate principal amount $1.750 billion. |
| |
| ▪ | In March 2017, we entered into an agreement with DT for three Senior Notes with an aggregate principal amount of $3.5 billion. Additionally, we issued a call notice and will redeem through net settlement, the outstanding aggregate principal amounts on two Senior Notes totaling $2.5 billion. The $1.0 billion of excess cash will be used to redeem callable high yield debt. |
| |
| ▪ | In April 2017, we exercised our option under existing high yield purchase agreements and will issue three Senior Notes with an aggregate principal amount of $4.0 billion to DT on May 9, 2017. The proceeds will be used to fund a portion of the purchase price of spectrum licenses won in the 600 MHz spectrum auction. |
|
| | | |
| 2017 Guidance Outlook | | | |
| | | | |
| | Original | | Q1 2017 Update |
Branded Postpaid Net Additions (in millions) | 2.4 - 3.4 | | 2.8 - 3.5 |
Adjusted EBITDA ($ in billions) | $10.4 - $10.8 | | Unchanged |
Cash Capex excluding Cap Interest ($ in billions) | $4.8 - $5.1 | | Unchanged |
| Net cash provided by operating activities three-year CAGR | 15% - 18% | | Unchanged |
| Free cash flow three-year CAGR | 45% - 48% | | Unchanged |
GUIDANCE
| |
| ▪ | Branded postpaid net customer additions for the full-year 2017 are expected to be between 2.8 and 3.5 million, an increase from the original guidance range of 2.4 and 3.4 million. |
| |
| ▪ | T-Mobile is not able to forecast net income on a forward looking basis without unreasonable efforts due to the high variability and difficulty in predicting certain items that affect GAAP net income including, but not limited to, income tax expense, stock based compensation expense, interest expense and interest income. |
| |
| ▪ | For the full-year 2017, T-Mobile expects Adjusted EBITDA to be in the range of $10.4 and $10.8 billion, unchanged from the guidance provided in the prior quarter. This target excludes future spectrum gains and includes expected leasing revenues of $0.8 to $0.9 billion. |
| |
| ▪ | Cash capital expenditures for the full-year 2017 are expected to be in the range of $4.8 to $5.1 billion, excluding capitalized interest, unchanged from the guidance provided in the prior quarter. |
| |
| ▪ | Net cash provided by operating activities three-year CAGR from full-year 2016 to full-year 2019 is expected to be between 15% and 18%, unchanged from the guidance provided in the prior quarter. |
| |
| ▪ | Free Cash Flow three-year CAGR from full-year 2016 to full-year 2019 is expected to be between 45% and 48%, also unchanged from the prior quarter. Free Cash Flow is a non-GAAP metric and is defined as the difference between Net cash provided by operating activities and Cash purchases of property and equipment. |
| |
| ▪ | Cash interest payments are expected to be elevated in 2017 compared to 2016 due to the increase in net debt as a result of the broadcast incentive auction and the payment of significant call premiums in connection with the calls on certain callable bonds with high interest rates. Specifically, cash interest payments are expected to increase to $0.7 to $0.8 billion in the second quarter of 2017 including call premiums of $238 million. For comparison, cash interest payments in the first quarter of 2017 amounted to $495 million including call premiums of $29 million. Cash interest payments for the full year are expected to increase to $2.1 billion to $2.2 billion including call premiums of $267 million. Excluding the call premiums, the normalized run-rate for the year will be $1.8 to $1.9 billion. |
UPCOMING EVENTS (All dates and attendance tentative)
| |
| ▪ | 4th Annual MoffettNathanson Media & Communications Summit, May 17-18, New York, NY |
| |
| ▪ | 2017 JP Morgan TMT 45th Annual Conference, May 22-24, Boston, MA |
| |
| ▪ | Barclays High Yield Bond and Syndicated Loan Conference, June 7-9, Colorado Springs, CO |
CONTACT INFORMATION
Press:
Media Relations
T-Mobile US, Inc.
mediarelations@t-mobile.com
http://newsroom.t-mobile.com
Investor Relations:
Nils Paellmann, nils.paellmann@t-mobile.com
Ben Barrett, ben.barrett@t-mobile.com
Jon Perachio, jonathan.perachio@t-mobile.com
Cristal Dunkin, cristal.dunkin@t-mobile.com
877-281-TMUS or 212-358-3210
investor.relations@t-mobile.com
http://investor.t-mobile.com
T-Mobile US, Inc.
Effect of Change in Accounting Principle
(Unaudited)
Effective January 1, 2017, we began presenting the amortization of the imputed discount on our Equipment Installment Plan (“EIP”) receivables as Other revenue on our Condensed Consolidated Statements of Comprehensive Income. Prior to the change, the imputed interest was presented as Interest income. We made this change to provide a better representation of amounts earned from our major ongoing operations, align with industry practice and enhance comparability. We have applied this change in accounting principle retrospectively and presented the effect of the change in the table below. For additional information, see Note 1 - Basis of Presentation of the Notes to the Consolidated Financial Statements included in Part I, Item 1 of our Form 10-Q filed April 24, 2017.
|
| | | | | | | | | | | | | | | | | | | |
| | Quarter |
| (in millions, except for Adjusted EBITDA margin and Net Debt Ratio) | Q1 2016 | | Q2 2016 | | Q3 2016 | | Q4 2016 | | Q1 2017 |
| EIP imputed discount | $ | 65 |
| | $ | 65 |
| | $ | 59 |
| | $ | 59 |
| | $ | 62 |
|
| | | | | | | | | | |
| Other revenue - as adjusted | $ | 235 |
| | $ | 211 |
| | $ | 224 |
| | $ | 249 |
| | $ | 241 |
|
| Other revenues - unadjusted | 170 |
| | 146 |
| | 165 |
| | 190 |
| | 179 |
|
| | | | | | | | | | |
| Total revenues - as adjusted | $ | 8,664 |
| | $ | 9,287 |
| | $ | 9,305 |
| | $ | 10,234 |
| | $ | 9,613 |
|
| Total revenues - unadjusted | 8,599 |
| | 9,222 |
| | 9,246 |
| | 10,175 |
| | 9,551 |
|
| | | | | | | | | | |
| Interest income - as adjusted | $ | 3 |
| | $ | 3 |
| | $ | 3 |
| | $ | 4 |
| | $ | 7 |
|
| Interest income - unadjusted | 68 |
| | 68 |
| | 62 |
| | 63 |
| | 69 |
|
| | | | | | | | | | |
| Operating income - as adjusted | $ | 1,168 |
| | $ | 833 |
| | $ | 1,048 |
| | $ | 1,001 |
| | $ | 1,037 |
|
| Operating income - unadjusted | 1,103 |
| | 768 |
| | 989 |
| | 942 |
| | 975 |
|
| | | | | | | | | | |
| Adjusted EBITDA - as adjusted | $ | 2,814 |
| | $ | 2,529 |
| | $ | 2,689 |
| | $ | 2,607 |
| | $ | 2,668 |
|
| Adjusted EBITDA - unadjusted | 2,749 |
| | 2,464 |
| | 2,630 |
| | 2,548 |
| | 2,606 |
|
| | | | | | | | | | |
| Adjusted EBITDA margin - as adjusted | 43 | % | | 37 | % | | 38 | % | | 36 | % | | 36 | % |
| Adjusted EBITDA margin - unadjusted | 42 | % | | 36 | % | | 37 | % | | 35 | % | | 36 | % |
| | | | | | | | | | |
| Last twelve months Adjusted EBITDA - as adjusted | $ | 9,124 |
| | $ | 9,723 |
| | $ | 10,396 |
| | $ | 10,639 |
| | $ | 10,493 |
|
| Last twelve months Adjusted EBITDA - unadjusted | 8,754 |
| | 9,401 |
| | 10,123 |
| | 10,391 |
| | 10,248 |
|
| | | | | | | | | | |
| Net Debt (excluding Tower Obligations) to LTM Adjusted EBITDA Ratio - as adjusted | 2.2 |
| | 2.3 |
| | 2.2 |
| | 2.1 |
| | 2.2 |
|
| Net Debt (excluding Tower Obligations) to LTM Adjusted EBITDA Ratio - unadjusted | 2.3 |
| | 2.3 |
| | 2.2 |
| | 2.1 |
| | 2.2 |
|
T-Mobile US, Inc.
Condensed Consolidated Balance Sheets
(Unaudited)
|
| | | | | | | |
| (in millions, except share and per share amounts) | March 31,
2017 |
| December 31,
2016 |
| Assets | | | |
| Current assets | | | |
| Cash and cash equivalents | $ | 7,501 |
|
| $ | 5,500 |
|
| Accounts receivable, net of allowances of $100 and $102 | 1,851 |
|
| 1,896 |
|
| Equipment installment plan receivables, net | 1,880 |
|
| 1,930 |
|
| Accounts receivable from affiliates | 37 |
|
| 40 |
|
| Inventories | 1,021 |
|
| 1,111 |
|
| Asset purchase deposit | 2,203 |
| | 2,203 |
|
| Other current assets | 1,406 |
|
| 1,537 |
|
| Total current assets | 15,899 |
|
| 14,217 |
|
| Property and equipment, net | 21,235 |
|
| 20,943 |
|
| Goodwill | 1,683 |
|
| 1,683 |
|
| Spectrum licenses | 27,150 |
|
| 27,014 |
|
| Other intangible assets, net | 338 |
|
| 376 |
|
| Equipment installment plan receivables due after one year, net | 975 |
|
| 984 |
|
| Other assets | 768 |
|
| 674 |
|
| Total assets | $ | 68,048 |
|
| $ | 65,891 |
|
| Liabilities and Stockholders' Equity | | | |
| Current liabilities | | | |
| Accounts payable and accrued liabilities | $ | 6,160 |
|
| $ | 7,152 |
|
| Payables to affiliates | 256 |
|
| 125 |
|
| Short-term debt | 7,542 |
|
| 354 |
|
| Deferred revenue | 934 |
|
| 986 |
|
| Other current liabilities | 393 |
|
| 405 |
|
| Total current liabilities | 15,285 |
|
| 9,022 |
|
| Long-term debt | 13,105 |
|
| 21,832 |
|
| Long-term debt to affiliates | 9,600 |
|
| 5,600 |
|
| Tower obligations | 2,614 |
|
| 2,621 |
|
| Deferred tax liabilities | 4,842 |
|
| 4,938 |
|
| Deferred rent expense | 2,635 |
|
| 2,616 |
|
| Other long-term liabilities | 1,004 |
|
| 1,026 |
|
| Total long-term liabilities | 33,800 |
|
| 38,633 |
|
| Commitments and contingencies | | | |
| Stockholders' equity | | | |
| 5.50% Mandatory Convertible Preferred Stock Series A, par value $0.00001 per share, 100,000,000 shares authorized; 20,000,000 and 20,000,000 shares issued and outstanding; $1,000 and $1,000 aggregate liquidation value | — |
|
| — |
|
| Common Stock, par value $0.00001 per share, 1,000,000,000 shares authorized; 832,259,647 and 827,768,818 shares issued, 830,804,268 and 826,357,331 shares outstanding | — |
|
| — |
|
| Additional paid-in capital | 38,877 |
|
| 38,846 |
|
| Treasury stock, at cost, 1,455,379 and 1,411,487 shares issued | (4 | ) |
| (1 | ) |
| Accumulated other comprehensive income | 2 |
|
| 1 |
|
| Accumulated deficit | (19,912 | ) |
| (20,610 | ) |
| Total stockholders' equity | 18,963 |
|
| 18,236 |
|
| Total liabilities and stockholders' equity | $ | 68,048 |
|
| $ | 65,891 |
|
T-Mobile US, Inc.
Condensed Consolidated Statements of Comprehensive Income
(Unaudited)
|
| | | | | | | | | | | |
| Three Months Ended |
| | March 31,
2017 |
| December 31,
2016 | | March 31,
2016 |
| (in millions, except share and per share amounts) | | | As Adjusted (1) | | As Adjusted (1) |
| Revenues |
| |
| |
|
| Branded postpaid revenues | $ | 4,725 |
| | $ | 4,680 |
| | $ | 4,302 |
|
| Branded prepaid revenues | 2,299 |
| | 2,227 |
| | 2,025 |
|
| Wholesale revenues | 270 |
| | 258 |
| | 200 |
|
| Roaming and other service revenues | 35 |
| | 80 |
| | 51 |
|
| Total service revenues | 7,329 |
| | 7,245 |
| | 6,578 |
|
| Equipment revenues | 2,043 |
| | 2,740 |
| | 1,851 |
|
Other revenues (1) | 241 |
| | 249 |
| | 235 |
|
Total revenues (1) | 9,613 |
| | 10,234 |
| | 8,664 |
|
| Operating expenses |
| |
| |
|
| Cost of services, exclusive of depreciation and amortization shown separately below | 1,408 |
| | 1,445 |
| | 1,421 |
|
| Cost of equipment sales | 2,686 |
| | 3,287 |
| | 2,374 |
|
| Selling, general and administrative | 2,955 |
| | 2,959 |
| | 2,749 |
|
| Depreciation and amortization | 1,564 |
| | 1,548 |
| | 1,552 |
|
| Cost of MetroPCS business combination | — |
| | (6 | ) | | 36 |
|
| Gains on disposal of spectrum licenses | (37 | ) | | — |
| | (636 | ) |
| Total operating expenses | 8,576 |
| | 9,233 |
| | 7,496 |
|
Operating income (1) | 1,037 |
| | 1,001 |
| | 1,168 |
|
| Other income (expense) |
| |
| |
|
| Interest expense | (339 | ) | | (335 | ) | | (339 | ) |
| Interest expense to affiliates | (100 | ) | | (64 | ) | | (79 | ) |
Interest income (1) | 7 |
| | 4 |
| | 3 |
|
| Other income (expense), net | 2 |
| | — |
| | (2 | ) |
Total other expense, net (1) | (430 | ) | | (395 | ) | | (417 | ) |
| Income before income taxes | 607 |
| | 606 |
| | 751 |
|
| Income tax benefit (expense) | 91 |
| | (216 | ) | | (272 | ) |
| Net income | 698 |
| | 390 |
| | 479 |
|
| Dividends on preferred stock | (14 | ) | | (14 | ) | | (14 | ) |
| Net income attributable to common stockholders | $ | 684 |
| | $ | 376 |
| | $ | 465 |
|
|
|
| |
|
| |
|
|
| Net income | $ | 698 |
| | $ | 390 |
| | $ | 479 |
|
| Other comprehensive income (loss), net of tax |
|
| |
|
| |
|
|
| Unrealized gain (loss) on available-for-sale securities, net of tax effect of $1, $0 and $(2) | 1 |
| | — |
| | (3 | ) |
| Other comprehensive income (loss) | 1 |
| | — |
| | (3 | ) |
| Total comprehensive income | $ | 699 |
| | $ | 390 |
| | $ | 476 |
|
| Earnings per share |
|
| |
|
| |
|
|
| Basic | $ | 0.83 |
| | $ | 0.46 |
| | $ | 0.57 |
|
| Diluted | $ | 0.80 |
| | $ | 0.45 |
| | $ | 0.56 |
|
| Weighted average shares outstanding |
|
| |
|
| |
|
|
| Basic | 827,723,034 |
| | 824,982,734 |
| | 819,431,761 |
|
| Diluted | 869,395,250 |
| | 867,262,400 |
| | 859,382,827 |
|
| |
| (1) | The amortized imputed discount on EIP receivables previously recognized as Interest income has been retrospectively reclassified as Other revenues. See the Effect of Change in Accounting Principle table for further detail. |
T-Mobile US, Inc.
Condensed Consolidated Statements of Cash Flows
(Unaudited)
|
| | | | | | | | | | | |
| Three Months Ended |
| (in millions) | March 31,
2017 | | December 31,
2016 | | March 31,
2016 |
| Operating activities | | | | | |
| Net income | $ | 698 |
| | $ | 390 |
| | $ | 479 |
|
| Adjustments to reconcile net income to net cash provided by operating activities | | | | | |
| Depreciation and amortization | 1,564 |
| | 1,548 |
| | 1,552 |
|
| Stock-based compensation expense | 67 |
| | 64 |
| | 52 |
|
| Deferred income tax expense (benefit) | (97 | ) | | 291 |
| | 264 |
|
| Bad debt expense | 93 |
| | 119 |
| | 121 |
|
| Losses from sales of receivables | 95 |
| | 71 |
| | 52 |
|
| Deferred rent expense | 20 |
| | 24 |
| | 32 |
|
| Gains on disposal of spectrum licenses | (37 | ) | | — |
| | (636 | ) |
| Changes in operating assets and liabilities | | | | | |
| Accounts receivable | (68 | ) | | (141 | ) | | (202 | ) |
| Equipment installment plan receivables | (13 | ) | | (459 | ) | | 109 |
|
| Inventories | 44 |
| | (305 | ) | | (801 | ) |
| Deferred purchase price from sales of receivables | (19 | ) | | (71 | ) | | 21 |
|
| Other current and long-term assets | (11 | ) | | (164 | ) | | 185 |
|
| Accounts payable and accrued liabilities | (651 | ) | | 367 |
| | (492 | ) |
| Other current and long-term liabilities | 45 |
| | (168 | ) | | 288 |
|
| Other, net | (17 | ) | | 36 |
| | 1 |
|
| Net cash provided by operating activities | 1,713 |
| | 1,602 |
| | 1,025 |
|
| Investing activities | | | | | |
| Purchases of property and equipment, including capitalized interest of $48, $71 and $36 | (1,528 | ) | | (859 | ) | | (1,335 | ) |
| Purchases of spectrum licenses and other intangible assets, including deposits | (14 | ) | | (424 | ) | | (594 | ) |
| Sales of short-term investments | — |
| | — |
| | 75 |
|
| Other, net | (8 | ) | | (11 | ) | | (6 | ) |
| Net cash used in investing activities | (1,550 | ) | | (1,294 | ) | | (1,860 | ) |
| Financing activities | | | | | |
| Proceeds from issuance of long-term debt | 5,495 |
| | — |
| | — |
|
| Repayments of capital lease obligations | (90 | ) | | (72 | ) | | (36 | ) |
| Repayments of long-term debt | (3,480 | ) | | (5 | ) | | (5 | ) |
| Tax withholdings on share-based awards | (92 | ) | | (69 | ) | | (46 | ) |
| Dividends on preferred stock | (14 | ) | | (14 | ) | | (14 | ) |
| Other, net | 19 |
| | — |
| | 1 |
|
| Net cash provided by (used in) financing activities | 1,838 |
| | (160 | ) | | (100 | ) |
| Change in cash and cash equivalents | 2,001 |
| | 148 |
| | (935 | ) |
| Cash and cash equivalents | | | | | |
| Beginning of period | 5,500 |
| | 5,352 |
| | 4,582 |
|
| End of period | $ | 7,501 |
| | $ | 5,500 |
| | $ | 3,647 |
|
| Supplemental disclosure of cash flow information | | | | | |
| Interest payments, net of amounts capitalized | $ | 495 |
| | $ | 389 |
| | $ | 415 |
|
| Income tax payments | 15 |
| | 2 |
| | 2 |
|
| Changes in accounts payable for purchases of property and equipment | (325 | ) | | 592 |
| | (127 | ) |
| Leased devices transferred from inventory to property and equipment | 243 |
| | 413 |
| | 784 |
|
| Returned leased devices transferred from property and equipment to inventory | (197 | ) | | (180 | ) | | (131 | ) |
| Issuance of short-term debt for financing of property and equipment | 288 |
| | — |
| | 150 |
|
| Assets acquired under capital lease obligations | 284 |
| | 120 |
| | 124 |
|
T-Mobile US, Inc. Supplementary Operating and Financial Data
|
| | | | | | | | | | | | | | |
| | Quarter |
| (in thousands) | Q1 2016 | | Q2 2016 | | Q3 2016 | | Q4 2016 | | Q1 2017 |
| Customers, end of period | | | | | | | | | |
| Branded postpaid phone customers | 30,232 |
| | 30,878 |
| | 30,364 |
| | 31,297 |
| | 32,095 |
|
| Branded postpaid mobile broadband customers | 2,504 |
| | 2,748 |
| | 2,866 |
| | 3,130 |
| | 3,246 |
|
| Total branded postpaid customers | 32,736 |
| | 33,626 |
| | 33,230 |
| | 34,427 |
| | 35,341 |
|
| Branded prepaid customers | 18,438 |
| | 18,914 |
| | 19,272 |
| | 19,813 |
| | 20,199 |
|
| Total branded customers | 51,174 |
| | 52,540 |
| | 52,502 |
| | 54,240 |
| | 55,540 |
|
| Wholesale customers | 14,329 |
| | 14,844 |
| | 16,852 |
| | 17,215 |
| | 17,057 |
|
| Total customers, end of period | 65,503 |
| | 67,384 |
| | 69,354 |
| | 71,455 |
| | 72,597 |
|
|
| | | | | | | | | | | | | | |
| | Quarter |
| (in thousands) | Q1 2016 | | Q2 2016 | | Q3 2016 | | Q4 2016 | | Q1 2017 |
| Net customer additions (losses) | | | | | | | | | |
| Branded postpaid phone customers | 877 |
| | 646 |
| | 851 |
| | 933 |
| | 798 |
|
| Branded postpaid mobile broadband customers | 164 |
| | 244 |
| | 118 |
| | 264 |
| | 116 |
|
| Total branded postpaid customers | 1,041 |
| | 890 |
| | 969 |
| | 1,197 |
| | 914 |
|
| Branded prepaid customers | 807 |
| | 476 |
| | 684 |
| | 541 |
| | 386 |
|
| Total branded customers | 1,848 |
| | 1,366 |
| | 1,653 |
| | 1,738 |
| | 1,300 |
|
| Wholesale customers | 373 |
| | 515 |
| | 317 |
| | 363 |
| | (158 | ) |
| Total net customer additions | 2,221 |
| | 1,881 |
| | 1,970 |
| | 2,101 |
| | 1,142 |
|
| Transfer from branded postpaid phone customers | — |
| | — |
| | (1,365 | ) | | — |
| | — |
|
| Transfer from branded prepaid customers | — |
| | — |
| | (326 | ) | | — |
| | — |
|
| Transfer to wholesale customers | — |
| | — |
| | 1,691 |
| | — |
| | — |
|
|
| | | | | | | | | | | | | | |
| | Quarter |
| | Q1 2016 | | Q2 2016 | | Q3 2016 | | Q4 2016 | | Q1 2017 |
| Branded postpaid phone churn | 1.33 | % | | 1.27 | % | | 1.32 | % | | 1.28 | % | | 1.18 | % |
| Branded prepaid churn | 3.84 | % | | 3.91 | % | | 3.82 | % | | 3.94 | % | | 4.01 | % |
T-Mobile US, Inc. Supplementary Operating and Financial Data (continued)
|
| | | | | | | | | |
| | Quarter |
| | Q1 2016 | | Q2 2016 | | Q3 2016 | | Q4 2016 | | Q1 2017 |
| Financial Metrics | | | | | | | | | |
| Service revenues (in millions) | $6,578 | | $6,888 | | $7,133 | | $7,245 | | $7,329 |
Total revenues (in millions) (1) | $8,664 | | $9,287 | | $9,305 | | $10,234 | | $9,613 |
| Net income (in millions) | $479 | | $225 | | $366 | | $390 | | $698 |
| Net income margin | 7% | | 3% | | 5% | | 5% | | 10% |
Adjusted EBITDA (in millions) (1) | $2,814 | | $2,529 | | $2,689 | | $2,607 | | $2,668 |
Adjusted EBITDA margin (1) | 43% | | 37% | | 38% | | 36% | | 36% |
| Cash capex - Property & Equipment (in millions) | $1,335 | | $1,349 | | $1,159 | | $859 | | $1,528 |
| Capitalized Interest (in millions) | $36 | | $18 | | $17 | | $71 | | $48 |
| Cash capex - Property & Equipment excluding cap interest (in millions) | $1,299 | | $1,331 | | $1,142 | | $788 | | $1,480 |
| Net cash provided by operating activities (in millions) | $1,025 | | $1,768 | | $1,740 | | $1,602 | | $1,713 |
| Net cash used in investing activities (in millions) | $(1,860) | | $(667) | | $(1,859) | | $(1,294) | | $(1,550) |
| Net cash provided by (used in) financing activities (in millions) | $(100) | | $790 | | $(67) | | $(160) | | $1,838 |
| Free Cash Flow (in millions) | $(310) | | $419 | | $581 | | $743 | | $185 |
| | | | | | | | | | |
| Revenue Metrics | | | | | | | | | |
| Branded postpaid phone ARPU | $46.21 | | $47.11 | | $48.15 | | $48.37 | | $47.53 |
| Branded postpaid ABPU | $61.90 | | $62.59 | | $63.38 | | $63.08 | | $61.89 |
| Branded prepaid ARPU | $37.58 | | $37.86 | | $38.01 | | $38.20 | | $38.53 |
| Branded postpaid accounts, end of period (in thousands) | 12,639 | | 12,753 | | 11,932 | | 12,055 | | 12,275 |
| Branded postpaid customers per account | 2.59 | | 2.64 | | 2.78 | | 2.86 | | 2.88 |
| | | | | | | | | | |
| Device Sales and Leased Devices | | | | | | | | | |
| Smartphone units (in millions) | 8.8 | | 8.1 | | 8.7 | | 9.9 | | 8.6 |
| Branded postpaid handset upgrade rate | 7% | | 6% | | 7% | | 10% | | 7% |
| | | | | | | | | | |
| Device Financing | | | | | | | | | |
| Gross EIP financed (in millions) | $1,246 | | $1,562 | | $1,372 | | $1,956 | | $1,339 |
| EIP billings (in millions) | $1,324 | | $1,344 | | $1,394 | | $1,370 | | $1,402 |
| EIP receivables, net (in millions) | $3,053 | | $2,662 | | $2,508 | | $2,914 | | $2,855 |
| Lease revenues (in millions) | $342 | | $367 | | $353 | | $354 | | $324 |
| Leased devices transferred from inventory to property and equipment (in millions) | $784 | | $157 | | $234 | | $413 | | $243 |
| Returned leased devices transferred from property and equipment to inventory (in millions) | $(131) | | $(105) | | $(186) | | $(180) | | $(197) |
| | | | | | | | | | |
| Customer Quality | | | | | | | | | |
| EIP receivables classified as prime | 47% | | 42% | | 42% | | 44% | | 43% |
| EIP receivables classified as prime (including EIP receivables sold) | 52% | | 53% | | 53% | | 53% | | 53% |
| Total bad debt expense and losses from sales of receivables (in millions) | $173 | | $165 | | $177 | | $190 | | $188 |
| |
| (1) | The amortized imputed discount on EIP receivables previously recognized as Interest income has been retrospectively reclassified as Other revenues. See Effect of Change in Accounting Principle table for further detail. |
T-Mobile US, Inc.
Reconciliation of Non-GAAP Financial Measures to GAAP Financial Measures
(Unaudited)
This Investor Factbook includes non-GAAP financial measures. The non-GAAP financial measures should be considered in addition to, but not as a substitute for, the information provided in accordance with GAAP. Reconciliations for the non-GAAP financial measures to the most directly comparable GAAP financial measures are provided below. T-Mobile is not able to forecast net income on a forward looking basis without unreasonable efforts due to the high variability and difficulty in predicting certain items that affect GAAP net income including, but not limited to, income tax expense, stock based compensation expense, interest expense and interest income. We made an accounting change in 2017 to include imputed interest associated with EIP receivables in Other revenues which are included in Adjusted EBITDA.
Adjusted EBITDA is reconciled to net income as follows:
|
| | | | | | | | | | | | | | | | | | | |
| | Quarter |
| (in millions) | Q1 2016 | | Q2 2016 | | Q3 2016 | | Q4 2016 | | Q1 2017 |
| Net income | $ | 479 |
| | $ | 225 |
| | $ | 366 |
| | $ | 390 |
| | $ | 698 |
|
| Adjustments: |
|
| | | | | |
|
| |
|
|
| Interest expense | 339 |
| | 368 |
| | 376 |
| | 335 |
| | 339 |
|
| Interest expense to affiliates | 79 |
| | 93 |
| | 76 |
| | 64 |
| | 100 |
|
Interest income (1) | (3 | ) | | (3 | ) | | (3 | ) | | (4 | ) | | (7 | ) |
| Other expense (income), net | 2 |
| | 3 |
| | 1 |
| | — |
| | (2 | ) |
| Income tax expense (benefit) | 272 |
| | 147 |
| | 232 |
| | 216 |
| | (91 | ) |
Operating income(1) | 1,168 |
| | 833 |
| | 1,048 |
| | 1,001 |
| | 1,037 |
|
| Depreciation and amortization | 1,552 |
| | 1,575 |
| | 1,568 |
| | 1,548 |
| | 1,564 |
|
Cost of MetroPCS business combination (2) | 36 |
| | 59 |
| | 15 |
| | (6 | ) | | — |
|
Stock-based compensation (3) | 53 |
| | 61 |
| | 57 |
| | 64 |
| | 67 |
|
Other, net (3) | 5 |
| | 1 |
| | 1 |
| | — |
| | — |
|
Adjusted EBITDA(1) | $ | 2,814 |
| | $ | 2,529 |
| | $ | 2,689 |
| | $ | 2,607 |
| | $ | 2,668 |
|
| |
| (1) | The amortized imputed discount on EIP receivables previously recognized as Interest income has been retrospectively reclassified as Other revenues. See the Effect of Change in Accounting Principle table for further detail. |
| |
| (2) | Beginning Q1 2017, we will no longer separately present Cost of MetroPCS business combination as it is insignificant. |
| |
| (3) | Stock-based compensation includes payroll tax impacts and may not agree to stock-based compensation expense in the condensed consolidated financial statements. Other, net may not agree to the Condensed Consolidated Statements of Comprehensive Income primarily due to certain non-routine operating activities, such as other special items that would not be expected to reoccur, and are therefore excluded in Adjusted EBITDA. |
Net debt (excluding Tower Obligations) to last twelve months adjusted EBITDA ratio is calculated as follows:
|
| | | | | | | | | | | | | | | | | | | |
| (in millions, except net debt ratio) | Mar 31,
2016 | | Jun 30,
2016 | | Sep 30,
2016 | | Dec 31,
2016 | | Mar 31,
2017 |
| Short-term debt | $ | 365 |
| | $ | 258 |
| | $ | 325 |
| | $ | 354 |
| | $ | 7,542 |
|
| Long-term debt to affiliates | 5,600 |
| | 5,600 |
| | 5,600 |
| | 5,600 |
| | 9,600 |
|
| Long-term debt | 20,505 |
| | 21,574 |
| | 21,825 |
| | 21,832 |
| | 13,105 |
|
| Less: Cash and cash equivalents | (3,647 | ) | | (5,538 | ) | | (5,352 | ) | | (5,500 | ) | | (7,501 | ) |
| Less: Short-term investments | (2,925 | ) | | — |
| | — |
| | — |
| | — |
|
| Net Debt (excluding Tower Obligations) | $ | 19,898 |
| | $ | 21,894 |
| | $ | 22,398 |
| | $ | 22,286 |
| | $ | 22,746 |
|
Divided by: Last twelve months Adjusted EBITDA (1) | $ | 9,124 |
| | $ | 9,723 |
| | $ | 10,396 |
| | $ | 10,639 |
| | $ | 10,493 |
|
Net Debt (excluding Tower Obligations) to Last Twelve Months Adjusted EBITDA Ratio (1) | 2.2 |
| | 2.3 |
| | 2.2 |
| | 2.1 |
| | 2.2 |
|
| |
| (1) | The amortized imputed discount on EIP receivables previously recognized as Interest income has been retrospectively reclassified as Other revenues. See the Effect of Change in Accounting Principle table for further detail. |
T-Mobile US, Inc.
Reconciliation of Non-GAAP Financial Measures to GAAP Financial Measures (continued)
(Unaudited)
Free cash flow is calculated as follows: |
| | | | | | | | | | | | | | | | | | | |
| | Quarter |
| (in millions) | Q1 2016 | | Q2 2016 | | Q3 2016 | | Q4 2016 | | Q1 2017 |
| Net cash provided by operating activities | $ | 1,025 |
| | $ | 1,768 |
| | $ | 1,740 |
| | $ | 1,602 |
| | $ | 1,713 |
|
| Cash purchases of property and equipment | (1,335 | ) | | (1,349 | ) | | (1,159 | ) | | (859 | ) | | (1,528 | ) |
| Free Cash Flow | $ | (310 | ) | | $ | 419 |
| | $ | 581 |
| | $ | 743 |
| | $ | 185 |
|
| Net cash used in investing activities | $ | (1,860 | ) | | $ | (667 | ) | | $ | (1,859 | ) | | $ | (1,294 | ) | | $ | (1,550 | ) |
| Net cash provided by (used in) financing activities | $ | (100 | ) | | $ | 790 |
| | $ | (67 | ) | | $ | (160 | ) | | $ | 1,838 |
|
Free cash flow three-year CAGR is calculated as follows:
|
| | | | | | | | | | | | | | | | | |
| | FY | | FY | | | | |
| (in millions, except CAGR Range) | 2016 | | 2019 Guidance Range | | CAGR Range |
| Net cash provided by operating activities | $ | 6,135 |
| | $ | 9,400 |
| | $ | 10,000 |
| | 15 | % | | 18 | % |
| Cash purchases of property and equipment | (4,702 | ) | | (5,000 | ) | | (5,400 | ) | | 2 | % | | 5 | % |
| Free Cash Flow | $ | 1,433 |
| | $ | 4,400 |
| | $ | 4,600 |
| | 45 | % | | 48 | % |
T-Mobile US, Inc.
Reconciliation of Operating Measures to Branded Postpaid Service Revenues
(Unaudited)
The following tables illustrate the calculation of our operating measures ARPU and ABPU and reconcile these measures to the related service revenues: |
| | | | | | | | | | | | | | | | | | | |
| | Quarter |
| (in millions, except average number of customers, ARPU and ABPU) | Q1 2016 | | Q2 2016 | | Q3 2016 | | Q4 2016 | | Q1 2017 |
| Calculation of Branded Postpaid Phone ARPU | | | | | | | | | |
| Branded postpaid service revenues | $ | 4,302 |
| | $ | 4,509 |
| | $ | 4,647 |
| | $ | 4,680 |
| | $ | 4,725 |
|
| Less: Branded postpaid mobile broadband revenues | (182 | ) | | (193 | ) | | (193 | ) | | (205 | ) | | (225 | ) |
| Branded postpaid phone service revenues | $ | 4,120 |
| | $ | 4,316 |
| | $ | 4,454 |
| | $ | 4,475 |
| | $ | 4,500 |
|
| Divided by: Average number of branded postpaid phone customers (in thousands) and number of months in period | 29,720 |
| | 30,537 |
| | 30,836 |
| | 30,842 |
| | 31,564 |
|
| Branded postpaid phone ARPU | $ | 46.21 |
| | $ | 47.11 |
| | $ | 48.15 |
| | $ | 48.37 |
| | $ | 47.53 |
|
| | | | | | | | | | |
| Calculation of Branded Postpaid ABPU | | | | | | | | | |
| Branded postpaid service revenues | $ | 4,302 |
| | $ | 4,509 |
| | $ | 4,647 |
| | $ | 4,680 |
| | $ | 4,725 |
|
| EIP billings | 1,324 |
| | 1,344 |
| | 1,394 |
| | 1,370 |
| | 1,402 |
|
| Lease revenues | 342 |
| | 367 |
| | 353 |
| | 354 |
| | 324 |
|
| Total billings for branded postpaid customers | $ | 5,968 |
| | $ | 6,220 |
| | $ | 6,394 |
| | $ | 6,404 |
| | $ | 6,451 |
|
| Divided by: Average number of branded postpaid customers (in thousands) and number of months in period | 32,140 |
| | 33,125 |
| | 33,632 |
| | 33,839 |
| | 34,740 |
|
| Branded postpaid ABPU | $ | 61.90 |
| | $ | 62.59 |
| | $ | 63.38 |
| | $ | 63.08 |
| | $ | 61.89 |
|
| | | | | | | | | | |
| Calculation of Branded Prepaid ARPU | | | | | | | | | |
| Branded prepaid service revenues | $ | 2,025 |
| | $ | 2,119 |
| | $ | 2,182 |
| | $ | 2,227 |
| | $ | 2,299 |
|
| Divided by: Average number of branded prepaid customers (in thousands) and number of months in period | 17,962 |
| | 18,662 |
| | 19,134 |
| | 19,431 |
| | 19,889 |
|
| Branded prepaid ARPU | $ | 37.58 |
| | $ | 37.86 |
| | $ | 38.01 |
| | $ | 38.20 |
| | $ | 38.53 |
|
Definitions of Terms
Operating and financial measures are utilized by T-Mobile's management to evaluate its operating performance and, in certain cases, its ability to meet liquidity requirements. Although companies in the wireless industry may not define measures in precisely the same way, T-Mobile believes the measures facilitate key operating performance comparisons with other companies in the wireless industry to provide management, investors and analysts with useful information to assess and evaluate past performance and assist in forecasting future performance.
| |
| 1. | Customer - SIM card with a unique T-Mobile mobile identity number which generates revenue. Branded customers generally include customers that are qualified either for postpaid service, where they generally pay after incurring service, or prepaid service, where they generally pay in advance. Wholesale customers include Machine-to-Machine (M2M) and Mobile Virtual Network Operator (MVNO) customers that operate on T-Mobile's network, but are managed by wholesale partners. |
| |
| 2. | Churn - Number of customers whose service was disconnected as a percentage of the average number of customers during the specified period. The number of customers whose service was disconnected is presented net of customers that subsequently have their service restored within a certain period of time. |
| |
| 3. | Customers per account - The number of branded postpaid customers as of the end of the period divided by the number of branded postpaid accounts as of the end of the period. An account may include branded postpaid phone and mobile broadband customers. |
| |
| 4. | Average Revenue Per User (ARPU) - Average monthly service revenue earned from customers. Service revenues for the specified period divided by the average customers during the period, further divided by the number of months in the period. |
Branded postpaid phone ARPU excludes mobile broadband customers and related revenues.
Average Billings per User (ABPU) - Average monthly branded postpaid service revenue earned from customers plus monthly EIP billings and lease revenues divided by the average branded postpaid customers during the period, further divided by the number of months in the period. T-Mobile believes branded postpaid ABPU is indicative of estimated cash collections, including device financing payments, from T-Mobile's postpaid customers each month.
Service revenues - Branded postpaid, including handset insurance, branded prepaid, wholesale, and roaming and other service revenues.
| |
| 5. | Cost of services - Costs directly attributable to providing wireless service through the operation of T-Mobile's network, including direct switch and cell site costs, such as rent, network access and transport costs, utilities, maintenance, associated labor costs, long distance costs, regulatory program costs, roaming fees paid to other carriers and data content costs. |
Cost of equipment sales - Costs of devices and accessories sold to customers and dealers, device costs to fulfill insurance and warranty claims, write-downs of inventory related to shrinkage and obsolescence, and shipping and handling costs.
Selling, general and administrative expenses - Costs not directly attributable to providing wireless service for the operation of sales, customer care and corporate activities. These include commissions paid to dealers and retail employees for activations and upgrades, labor and facilities costs associated with retail sales force and administrative space, marketing and promotional costs, customer support and billing, bad debt expense and administrative support activities.
| |
| 6. | Net income margin - Margin % calculated as net income divided by service revenues. |
| |
| 7. | Adjusted EBITDA - Earnings before interest expense, net of interest income, income tax expense, depreciation and amortization expense, non-cash stock-based compensation and certain expenses not reflective of T-Mobile's ongoing operating performance. Adjusted EBITDA margin represents Adjusted EBITDA divided by service revenues. Adjusted EBITDA is a non-GAAP financial measure utilized by T-Mobile's management to monitor the financial performance of our operations. T-Mobile uses Adjusted EBITDA internally as a metric to evaluate and compensate its personnel and management for their performance, and as a benchmark to evaluate T-Mobile's operating performance in comparison to its competitors. Management believes analysts and investors use Adjusted EBITDA as a supplemental measure to evaluate overall operating performance and facilitate comparisons with other wireless communications companies because it is indicative of T-Mobile's ongoing operating performance and trends by excluding the impact of interest expense from financing, non-cash depreciation and amortization from capital investments, non-cash stock-based compensation, network decommissioning costs as they are not indicative of T-Mobile's ongoing operating performance and certain other nonrecurring expenses. Adjusted EBITDA has limitations as an analytical tool and should not be considered in isolation or as a substitute for income from operations, net income or any other measure of financial performance reported in accordance with GAAP. In Q1 2017, we made an accounting change to include imputed interest associated with equipment installment plan ("EIP") receivables in Other revenues which are included in Adjusted EBITDA. |
| |
| 8. | Adjusted EBITDA Margin - Margin % calculated as Adjusted EBITDA divided by service revenues. |
| |
| 9. | Cash capital expenditures - Amounts paid for construction and the purchase of property and equipment. |
| |
| 10. | Smartphones - UMTS/HSPA/HSPA+ 21/HSPA+ 42/4G LTE enabled converged devices, which integrate voice and data services. |
| |
| 11. | Free Cash Flow - Net cash provided by operating activities less cash capital expenditures for property and equipment. Free Cash Flow is utilized by T-Mobile's management, investors, and analysts to evaluate cash available to pay debt and provide further investment in the business. The reconciliation of Free Cash Flow to net cash provided by operating activities is detailed in the Reconciliation of Non-GAAP Financial Measures to GAAP Financial Measures schedule. |
| |
| 12. | Net debt - Short-term debt, long-term debt to affiliates, and long-term debt (excluding tower obligations), less cash and cash equivalents and short-term investments. |
Forward-Looking Statements
This Investor Factbook includes "forward-looking statements" within the meaning of the U.S. federal securities laws. Any statements made herein that are not statements of historical fact, including statements about T-Mobile's plans, outlook, beliefs, opinion, projections, guidance, strategy, store openings, deployment of spectrum and expected network modernization and other advancements, are forward-looking statements. Generally, forward-looking statements may be identified by words such as "anticipate," "expect," "suggests," "plan," “project,” "believe," "intend," "estimates," "targets," "views," "may," "will," "forecast," and other similar expressions. The forward-looking statements speak only as of the date made, are based on current assumptions and expectations, and involve a number of risks and uncertainties. Important factors that could affect future results and cause those results to differ materially from those expressed in the forward-looking statements include, among others, the following: adverse economic or political conditions in the U.S. and international markets; competition in the wireless services market, including new competitors entering the industry as technologies converge; the effects any future merger or acquisition involving us, as well as the effects of mergers or acquisitions in the technology, media and telecommunications industry; challenges in implementing our business strategies or funding our wireless operations, including payment for additional spectrum or network upgrades; the possibility that we may be unable to renew our spectrum licenses on attractive terms or acquire new spectrum licenses at reasonable costs and terms; difficulties in managing growth in wireless data services, including network quality; material changes in available technology; the timing, scope and financial impact of our deployment of advanced network and business technologies; the impact on our networks and business from major technology equipment failures; breaches of our and/or our third party vendors’ networks, information technology and data security; natural disasters, terrorist attacks or similar incidents; existing or future litigation; any changes in the regulatory environments in which we operate, including any increase in restrictions on the ability to operate our networks; any disruption or failure of our third parties’ or key suppliers’ provisioning of products or services; material adverse changes in labor matters, including labor campaigns, negotiations or additional organizing activity, and any resulting financial, operational and/or reputational impact; the ability to make payments on our debt or to repay our existing indebtedness when due; adverse change in the ratings of our debt securities or adverse conditions in the credit markets; changes in accounting assumptions that regulatory agencies, including the Securities and Exchange Commission (“SEC”), may require, which could result in an impact on earnings; and changes in tax laws, regulations and existing standards and the resolution of disputes with any taxing jurisdictions; and other risks described in our filings with the SEC, including those described in our most recently filed Annual Report on Form 10-K. You should not place undue reliance on these forward-looking statements. We do not undertake to update forward-looking statements, whether as a result of new information, future events or otherwise, except as required by law.
About T-Mobile US, Inc.
As America's Un-carrier, T-Mobile US, Inc. (NASDAQ: TMUS) is redefining the way consumers and businesses buy wireless services through leading product and service innovation. Our advanced nationwide 4G LTE network delivers outstanding wireless experiences to 72.6 million customers who are unwilling to compromise on quality and value. Based in Bellevue, Washington, T-Mobile US provides services through its subsidiaries and operates its flagship brands, T-Mobile and MetroPCS. For more information, please visit http://www.T-Mobile.com or join the conversation on Twitter using $TMUS.