EXHIBIT 99.4
TMUS Q3 2017 Earnings Q&A
| |
| 1. | Why didn’t you have an earnings call this quarter? We miss Braxton’s hat. |
Our incredible Q3 results speak for themselves! We want to keep the focus on those results, without letting them be drowned out by the rumors that have been swirling around. As it relates to those rumors, we’ve got nothing to share.
Check out all our earnings materials on our IR website at http://investor.t-mobile.com and watch John’s vlog at https://newsroom.t-mobile.com/q3-2017 in our newsroom for his comments on the quarter. And don’t worry, Braxton is still wearing his Magenta hat today!
| |
| 2. | This is the second consecutive quarter that you have raised your Adj. EBITDA guidance. What drove this decision? |
Our guidance increase is a reflection of the confidence we have in our business. Since the launch of the Un-carrier in 2013, we have consistently met or exceeded all of our guidance. We are raising and narrowing our Adjusted EBITDA guidance for a second time this year to $10.8 - $11.0B, up from $10.5 - $10.9B(1), including unchanged leasing revenues of $850 - $950M, and we are raising and narrowing our branded postpaid net adds guidance to 3.3 - 3.6M, up from 3.0 - 3.6M previously.
| |
| 3. | How was the competitive environment in the quarter? Are you still expecting to lead the industry in postpaid phone net adds? |
We expect to lead the industry in postpaid phone net adds for the 15th quarter in a row with 595,000 net adds - that’s more than twice what Verizon just reported. Every quarter has a different competitive backdrop, but we’ve said for years that we can fight and win in any environment - this quarter is just further proof of that! What it comes down to is our product - we offer America’s Best Unlimited Network and customers continue to choose the incredible value that T-Mobile offers over our competitors.
| |
| 4. | How did the iPhone timing impact the quarter? |
The new iPhones this year captured a ton of attention from consumers, and it’s easy to see why - they’re incredible! Device launches are always a great share taking opportunity for T-Mobile, and given the new launch dates for the iPhones this year, we expect this to largely be reflected across Q4 2017 and - depending on inventory - potentially Q1 2018.
________________________________________________________________
1 Adjusted EBITDA is a non-GAAP financial measure and should be considered in addition to, but not as a substitute for, the information provided in accordance with GAAP. T-Mobile is unable to provide a reconciliation to the comparable GAAP measure because it is not able to forecast net income on a forward looking basis without unreasonable efforts due to the high variability and difficulty in predicting certain items that affect GAAP net income including, but not limited to, income tax expense, stock based compensation expense and interest expense. Adjusted EBITDA should not be used to predict net income as the difference between the two measures is variable.
| |
| 5. | How did the hurricanes impact the quarter? |
When disasters like these strike, our teams work tirelessly 24/7 to restore service and aid communities. This hurricane season was devastating and had a tremendous impact on our employees and customers in Texas, Florida, and especially Puerto Rico. T-Mobile has a significant market share in these regions and the hurricanes did have an impact on postpaid phone nets and our financial results this quarter, including a negative impact of $90M on net income and a negative impact of $148M on Adjusted EBITDA. For additional details please see the “Hurricane Impacts” section in our Factbook at http://investor.t-mobile.com/Quarterly-Results. We remain committed to doing everything we can to help rebuild these areas.
| |
| 6. | You launched another Un-carrier move this quarter - Netflix On Us. How have customers responded? How is your network handling the additional traffic from Netflix On Us? |
Our customers are loving our latest Un-carrier move, Netflix On Us! While the duopoly pushes bigger, fatter, and pricier bundles, T-Mobile is giving customers with T-Mobile ONE family plans the best in entertainment at no extra cost. Netflix On Us! is the latest of our industry shaking Un-carrier moves, and we’ve got plenty more to come. This industry is far from where it needs to be, and we mean it when we say we won’t stop!
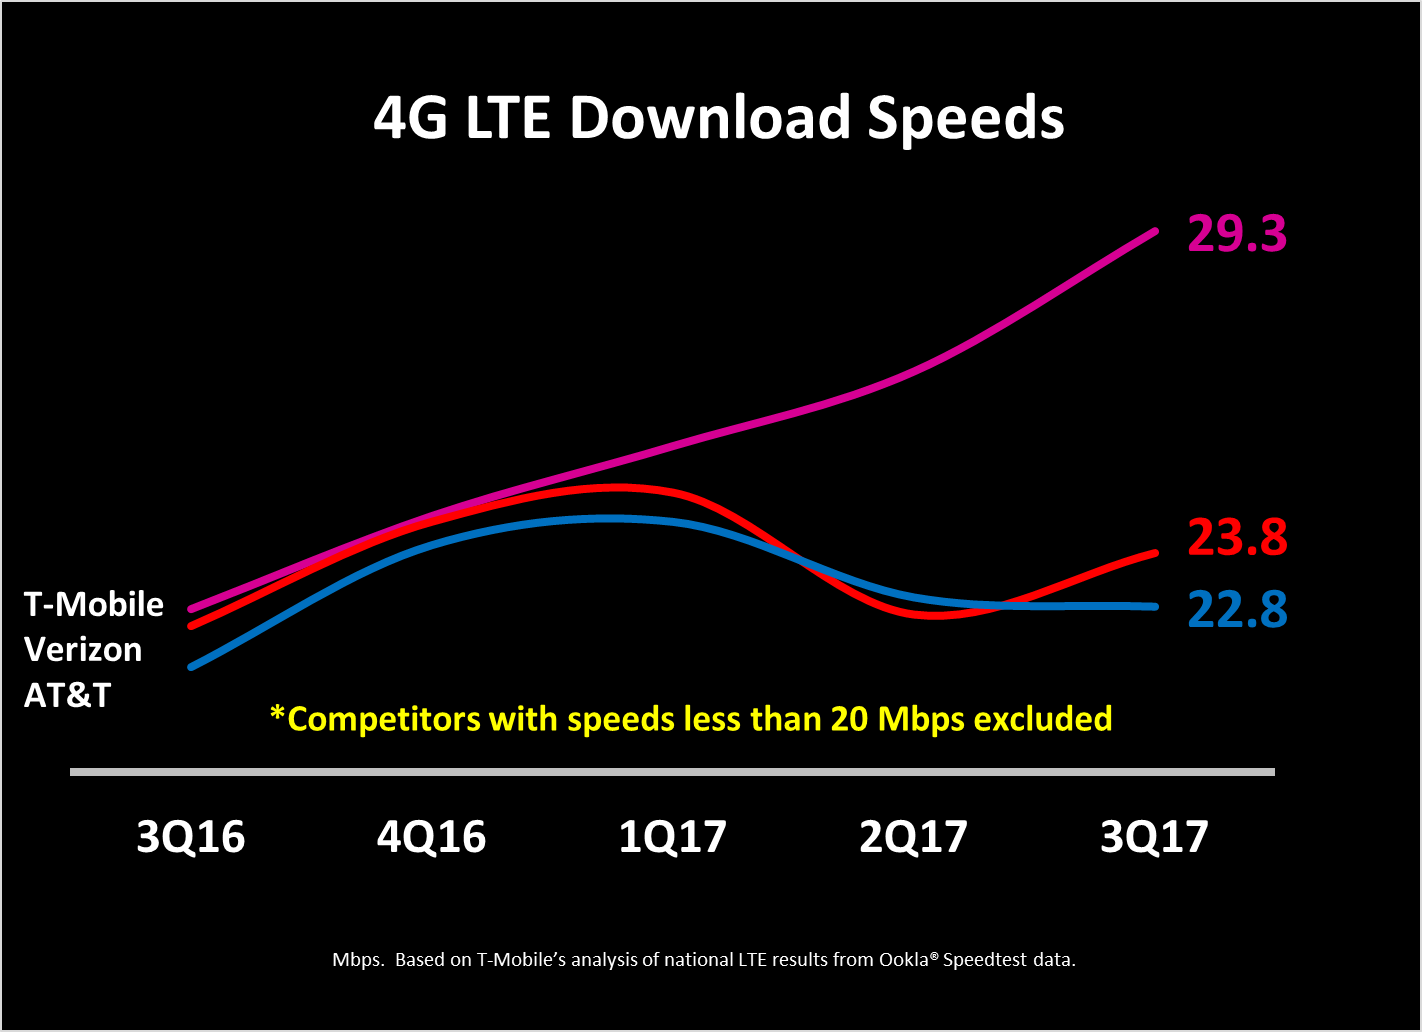
This was the 15th quarter in a row where T-Mobile had the fastest LTE network in the United States, and our network actually got even faster versus Q2 with the gap to our competitors widening further! We built our network for today’s world where customers are tweeting, browsing, and streaming more than ever before. We saw this world coming, back when Verizon was still charging for calling by the minute. This is why our network is soaring and Verizon’s is choking!
| |
| 7. | Where did all these customers come from? Are they coming from a particular carrier? Can you update us on your postpaid porting ratios? What is happening in terms of business customers? |
We once again took customers from every one of our competitors! This is the 18th quarter in a row where we have ported positive against the industry on the postpaid side, and the 15th quarter in a row porting positive versus each of our major competitors. In fact, based on our calculations, overall postpaid porting ratios improved in Q3 versus Q2, especially versus Verizon! In Q3 postpaid porting was 1.53 overall, 1.71 versus AT&T, 1.61 versus Verizon, and 1.24 versus Sprint. In comparison, Q2 postpaid porting was 1.38 overall, 1.63 versus AT&T, 1.20 versus Verizon, and 1.29 versus Sprint. So far in Q4 we have seen significant improvements in postpaid porting ratios both overall and versus each carrier compared to Q3.
We are also continuing to penetrate new segments of the market, and T-Mobile for Business (previously @Work) just had their best Q3 ever share of postpaid net customer additions! We continue to add significant new accounts and grow our existing accounts, and Q3 was no different. We are breaking the duopoly’s stranglehold on every segment of the market, including enterprises and governments across the country.
| |
| 8. | Do you have any updates on deployment of the 600 MHz spectrum you acquired in the most recent auction? And what are your plans with regard to 5G? |
With more than 1.2M square miles where spectrum is expected to clear this year, we plan to deploy this valuable spectrum at a record setting pace. On top of that we just made an agreement to clear a portion of New York City’s 600 MHz spectrum in early 2018, accelerating the final repack by 16 months and reducing overall costs for the Incentive Auction Relocation fund by tens of millions of dollars. We have several sites with 600 MHz live today and a compatible flagship device (LG V30) in stores with another one expected to arrive in time for the 2017 holiday season. We also expect the majority of new devices introduced in 2018 to be compatible with our 600 MHz spectrum. 600 MHz is a huge opportunity for us, and it will lay our network’s foundation for years to come. Planned deployment in 2018 will be significant!
We are deploying some of our 600 MHz with 5G ready equipment so when the time comes, we can literally turn on 5G with modest baseband and software upgrades later in the decade! T-Mobile was the first company to commit to building a nationwide 5G network, and we will use a portion of our 600 MHz spectrum to deploy America’s first nationwide 5G network in the 2019 / 2020 timeframe.
| |
| 9. | What progress have you made on your plan to open 3,000 stores this year? What are the early results for the new stores you have added so far this year? |
Our distribution expansion is in full swing. We have been building stores at a record setting pace and we’re on track to open approximately 3,000 new stores in 2017. We have built 1,200 new Magenta stores and 1,300 net new Metro stores this year alone! The addition of these 3,000 stores will help expand our distribution footprint by 30 to 40 million POPs from the beginning of 2016 through the end of 2017 so more customers in more locations can join the Un-carrier!
We are very pleased with the early results from these new stores, especially in the greenfield areas. We are penetrating new markets where there is huge pent-up demand for the Un-carrier. It’s early to gauge exact performance, but so far the results have been very encouraging.
| |
| 10. | Can you comment on the prepaid side of the business? |
We just delivered another strong quarter on the prepaid side with 226K net adds, and hit a new prepaid ARPU record of $38.93! This shows that we are continuing to grow our prepaid business rationally and not responding to irrational competitor offers. Our MetroPCS brand drives our prepaid business, and is doing so well that its customer base is set to double by the end of this year from since it was acquired in 2013.
Forward-Looking Statements
This news release includes "forward-looking statements" within the meaning of the U.S. federal securities laws. Any statements made herein that are not statements of historical fact, including statements about T-Mobile US, Inc.'s plans, outlook, beliefs, opinions, projections, guidance, strategy, store openings, deployment of spectrum and expected network modernization and other advancements, are forward-looking statements. Generally, forward-looking statements may be identified by words such as "anticipate," "expect," "suggests," "plan," “project,” "believe," "intend," "estimates," "targets," "views," "may," "will," "forecast," and other similar expressions. The forward-looking statements speak only as of the date made, are based on current assumptions and expectations, and involve a number of risks and uncertainties. Important factors that could affect future results and cause those results to differ materially from those expressed in the forward-looking statements include, among others, the following: adverse economic or political conditions in the U.S. and international markets; competition in the wireless services market, including new competitors entering the industry as technologies converge; the effects any future merger or acquisition involving us, as well as the effects of mergers or acquisitions in the technology, media and telecommunications industry; challenges in implementing our business strategies or funding our wireless operations, including payment for additional spectrum or network upgrades; the possibility that we may be unable to renew our spectrum licenses on attractive terms or acquire new spectrum licenses at reasonable costs and terms; difficulties in managing growth in wireless data services, including network quality; material changes in available technology; the timing, scope and financial impact of our deployment of advanced network and business technologies; the impact on our networks and business from major technology equipment failures; breaches of our and/or our third party vendors’ networks, information technology and data security; natural disasters, terrorist attacks or similar incidents; existing or future litigation; any changes in the regulatory environments in which we operate, including any increase in restrictions on the ability to operate our networks; any disruption or failure of our third parties’ or key suppliers’ provisioning of products or services; material adverse changes in labor matters, including labor campaigns, negotiations or additional organizing activity, and any resulting financial, operational and/or reputational impact; the ability to make payments on our debt or to repay our existing indebtedness when due; adverse change in the ratings of our debt securities or adverse conditions in the credit markets; changes in accounting assumptions that regulatory agencies, including the Securities and Exchange Commission (“SEC”), may require, which could result in an impact on earnings; and changes in tax laws, regulations and existing standards and the resolution of disputes with any taxing jurisdictions; and other risks described in our filings with the SEC, including those described in our most recently filed Annual Report on Form 10-K. You should not place undue reliance on these forward-looking statements. We do not undertake to update forward-looking statements, whether as a result of new information, future events or otherwise, except as required by law.
T-Mobile US, Inc.
Effect of Change in Accounting Principle
(Unaudited)
Effective January 1, 2017, we began presenting the amortization of the imputed discount on our Equipment Installment Plan (“EIP”) receivables as Other revenue on our Condensed Consolidated Statements of Comprehensive Income. Prior to the change, the imputed interest was presented as Interest income. We made this change to provide a better representation of amounts earned from our major ongoing operations, align with industry practice and enhance comparability. We have applied this change in accounting principle retrospectively and presented the effect of the change in the table below. For additional information, see Note 1 - Basis of Presentation of the Notes to the Consolidated Financial Statements included in Part I, Item 1 of our Form 10-Q to be filed on or about October 23, 2017.
|
| | | | | | | | | | | | | | | | | | | | | | | | | | | | | | | | | | | |
| (in millions, except for margin %'s and Net Debt Ratios) | Quarter | | Nine Months Ended September 30, |
| Q1 2016 | | Q2 2016 | | Q3 2016 | | Q4 2016 | | Q1 2017 | | Q2 2017 | | Q3 2017 | | 2016 | | 2017 |
| EIP imputed discount | $ | 65 |
| | $ | 65 |
| | $ | 59 |
| | $ | 59 |
| | $ | 62 |
| | $ | 68 |
| | $ | 74 |
| | $ | 189 |
| | $ | 204 |
|
| | | | | | | | | | | | | | | | | | |
| Other revenue - as adjusted | $ | 235 |
| | $ | 211 |
| | $ | 224 |
| | $ | 249 |
| | $ | 241 |
| | $ | 262 |
| | $ | 272 |
| | $ | 670 |
| | $ | 775 |
|
| Other revenues - unadjusted | 170 |
| | 146 |
| | 165 |
| | 190 |
| | 179 |
| | 194 |
| | 198 |
| | 481 |
| | 571 |
|
| | | | | | | | | | | | | | | | | | |
| Total revenues - as adjusted | $ | 8,664 |
| | $ | 9,287 |
| | $ | 9,305 |
| | $ | 10,234 |
| | $ | 9,613 |
| | $ | 10,213 |
| | $ | 10,019 |
| | $ | 27,256 |
| | $ | 29,845 |
|
| Total revenues - unadjusted | 8,599 |
| | 9,222 |
| | 9,246 |
| | 10,175 |
| | 9,551 |
| | 10,145 |
| | 9,945 |
| | 27,067 |
| | 29,641 |
|
| | | | | | | | | | | | | | | | | | |
| Operating income - as adjusted | $ | 1,168 |
| | $ | 833 |
| | $ | 1,048 |
| | $ | 1,001 |
| | $ | 1,037 |
| | $ | 1,416 |
| | $ | 1,323 |
| | $ | 3,049 |
| | $ | 3,776 |
|
| Operating income - unadjusted | 1,103 |
| | 768 |
| | 989 |
| | 942 |
| | 975 |
| | 1,348 |
| | 1,249 |
| | 2,860 |
| | 3,572 |
|
| | | | | | | | | | | | | | | | | | |
| Interest income - as adjusted | $ | 3 |
| | $ | 3 |
| | $ | 3 |
| | $ | 4 |
| | $ | 7 |
| | $ | 6 |
| | $ | 2 |
| | $ | 9 |
| | $ | 15 |
|
| Interest income - unadjusted | 68 |
| | 68 |
| | 62 |
| | 63 |
| | 69 |
| | 74 |
| | 76 |
| | 198 |
| | 219 |
|
| | | | | | | | | | | | | | | | | | |
| Total other expense, net - as adjusted | $ | (417 | ) | | $ | (461 | ) | | $ | (450 | ) | | $ | (395 | ) | | $ | (430 | ) | | $ | (482 | ) | | $ | (417 | ) | | $ | (1,328 | ) | | $ | (1,329 | ) |
| Total other expense, net - unadjusted | (352 | ) | | (396 | ) | | (391 | ) | | (336 | ) | | (368 | ) | | (414 | ) | | (343 | ) | | (1,139 | ) | | (1,125 | ) |
| | | | | | | | | | | | | | | | | | |
| Net income - as adjusted | $ | 479 |
| | $ | 225 |
| | $ | 366 |
| | $ | 390 |
| | $ | 698 |
| | $ | 581 |
| | $ | 550 |
| | $ | 1,070 |
| | $ | 1,829 |
|
| Net income - unadjusted | 479 |
| | 225 |
| | 366 |
| | 390 |
| | 698 |
| | 581 |
| | 550 |
| | 1,070 |
| | 1,829 |
|
| | | | | | | | | | | | | | | | | | |
| Adjusted EBITDA - as adjusted | $ | 2,814 |
| | $ | 2,529 |
| | $ | 2,689 |
| | $ | 2,607 |
| | $ | 2,668 |
| | $ | 3,012 |
| | $ | 2,822 |
| | $ | 8,032 |
| | $ | 8,502 |
|
| Adjusted EBITDA - unadjusted | 2,749 |
| | 2,464 |
| | 2,630 |
| | 2,548 |
| | 2,606 |
| | 2,944 |
| | 2,748 |
| | 7,843 |
| | 8,298 |
|
| | | | | | | | | | | | | | | | | | |
| Net income margin - as adjusted | 7 | % | | 3 | % | | 5 | % | | 5 | % | | 10 | % | | 8 | % | | 7 | % | | 5 | % | | 8 | % |
| Net income margin - unadjusted | 7 | % | | 3 | % | | 5 | % | | 5 | % | | 10 | % | | 8 | % | | 7 | % | | 5 | % | | 8 | % |
| | | | | | | | | | | | | | | | | | |
| Adjusted EBITDA margin - as adjusted | 43 | % | | 37 | % | | 38 | % | | 36 | % | | 36 | % | | 40 | % | | 37 | % | | 39 | % | | 38 | % |
| Adjusted EBITDA margin - unadjusted | 42 | % | | 36 | % | | 37 | % | | 35 | % | | 36 | % | | 40 | % | | 36 | % | | 38 | % | | 37 | % |
| | | | | | | | | | | | | | | | | | |
| Last twelve months Net income - as adjusted | $ | 1,275 |
| | $ | 1,139 |
| | $ | 1,367 |
| | $ | 1,460 |
| | $ | 1,679 |
| | $ | 2,035 |
| | $ | 2,219 |
| | N/A |
| | N/A |
|
| Last twelve months Net income - unadjusted | 1,275 |
| | 1,139 |
| | 1,367 |
| | 1,460 |
| | 1,679 |
| | 2,035 |
| | 2,219 |
| | N/A |
| | N/A |
|
| | | | | | | | | | | | | | | | | | |
Last twelve months Adjusted EBITDA - as adjusted (1) | $ | 9,124 |
| | $ | 9,723 |
| | $ | 10,396 |
| | $ | 10,639 |
| | $ | 10,493 |
| | $ | 10,976 |
| | $ | 11,109 |
| | N/A |
| | N/A |
|
Last twelve months Adjusted EBITDA - unadjusted (1) | 8,754 |
| | 9,401 |
| | 10,123 |
| | 10,391 |
| | 10,248 |
| | 10,728 |
| | 10,846 |
| | N/A |
| | N/A |
|
| | | | | | | | | | | | | | | | | | |
| Net Debt (excluding Tower Obligations) to Last Twelve Months Net income - as adjusted | 15.6 |
| | 19.2 |
| | 16.4 |
| | 15.3 |
| | 13.5 |
| | 13.9 |
| | 12.4 |
| | N/A |
| | N/A |
|
| Net Debt (excluding Tower Obligations) to Last Twelve Months Net income - unadjusted | 15.6 |
| | 19.2 |
| | 16.4 |
| | 15.3 |
| | 13.5 |
| | 13.9 |
| | 12.4 |
| | N/A |
| | N/A |
|
| | | | | | | | | | | | | | | | | | |
| Net Debt (excluding Tower Obligations) to LTM Adjusted EBITDA Ratio - as adjusted | 2.2 |
| | 2.3 |
| | 2.2 |
| | 2.1 |
| | 2.2 |
| | 2.6 |
| | 2.5 |
| | N/A |
| | N/A |
|
| Net Debt (excluding Tower Obligations) to LTM Adjusted EBITDA Ratio - unadjusted | 2.3 |
| | 2.3 |
| | 2.2 |
| | 2.1 |
| | 2.2 |
| | 2.6 |
| | 2.5 |
| | N/A |
| | N/A |
|
(1) For purposes of Last twelve months Adjusted EBITDA, prior quarterly adjustments were as follows: |
| | | | | | | | | | | |
| | Quarter |
| (in millions) | Q2 2015 | | Q3 2015 | | Q4 2015 |
| EIP imputed discount | $ | 113 |
| | $ | 108 |
| | $ | 84 |
|
| | | | | | |
| Net income - as adjusted | $ | 361 |
| | $ | 138 |
| | $ | 297 |
|
| Net income - unadjusted | 361 |
| | 138 |
| | 297 |
|
| | | | | | |
| Adjusted EBITDA - as adjusted | $ | 1,930 |
| | $ | 2,016 |
| | $ | 2,364 |
|
| Adjusted EBITDA - unadjusted | 1,817 |
| | 1,908 |
| | 2,280 |
|
T-Mobile US, Inc.
Reconciliation of Non-GAAP Financial Measures to GAAP Financial Measures
(Unaudited)
This Earnings External Q&A includes non-GAAP financial measures. The non-GAAP financial measures should be considered in addition to, but not as a substitute for, the information provided in accordance with GAAP. Reconciliations for the non-GAAP financial measures to the most directly comparable GAAP financial measures are provided below. T-Mobile is not able to forecast net income on a forward looking basis without unreasonable efforts due to the high variability and difficulty in predicting certain items that affect GAAP net income including, but not limited to, income tax expense, stock based compensation expense and interest expense. Adjusted EBITDA should not be used to predict net income as the difference between the two measures is variable. We made an accounting change in 2017 to include imputed interest associated with EIP receivables in Other revenues which will be included in Adjusted EBITDA.
Adjusted EBITDA is reconciled to net income as follows:
|
| | | | | | | | | | | | | | | | | | | | | | | | | | | | | | | | | | | | | | | | | | | | | | | |
| | Quarter | | Nine Months Ended September 30, |
| (in millions) | Q2 2015 | | Q3 2015 | | Q4 2015 | | Q1 2016 | | Q2 2016 | | Q3 2016 | | Q4 2016 | | Q1 2017 | | Q2 2017 | | Q3 2017 | | 2016 | | 2017 |
| Net income | $ | 361 |
| | $ | 138 |
| | $ | 297 |
| | $ | 479 |
| | $ | 225 |
| | $ | 366 |
| | $ | 390 |
| | $ | 698 |
| | $ | 581 |
| | $ | 550 |
| | $ | 1,070 |
| | $ | 1,829 |
|
| Adjustments: | | | | | | | | | | | | | | | | | | | | | | | |
| Interest expense | 257 |
| | 262 |
| | 305 |
| | 339 |
| | 368 |
| | 376 |
| | 335 |
| | 339 |
| | 265 |
| | 253 |
| | 1,083 |
| | 857 |
|
| Interest expense to affiliates | 92 |
| | 121 |
| | 134 |
| | 79 |
| | 93 |
| | 76 |
| | 64 |
| | 100 |
| | 131 |
| | 167 |
| | 248 |
| | 398 |
|
Interest income (1) | (1 | ) | | (1 | ) | | (1 | ) | | (3 | ) | | (3 | ) | | (3 | ) | | (4 | ) | | (7 | ) | | (6 | ) | | (2 | ) | | (9 | ) | | (15 | ) |
| Other (income) expense, net | (1 | ) | | 1 |
| | 3 |
| | 2 |
| | 3 |
| | 1 |
| | — |
| | (2 | ) | | 92 |
| | (1 | ) | | 6 |
| | 89 |
|
| Income tax expense (benefit) | 2 |
| | 100 |
| | 184 |
| | 272 |
| | 147 |
| | 232 |
| | 216 |
| | (91 | ) | | 353 |
| | 356 |
| | 651 |
| | 618 |
|
Operating income (1) | 710 |
| | 621 |
| | 922 |
| | 1,168 |
| | 833 |
| | 1,048 |
| | 1,001 |
| | 1,037 |
| | 1,416 |
| | 1,323 |
| | 3,049 |
| | 3,776 |
|
| Depreciation and Amortization | 1,075 |
| | 1,157 |
| | 1,369 |
| | 1,552 |
| | 1,575 |
| | 1,568 |
| | 1,548 |
| | 1,564 |
| | 1,519 |
| | 1,416 |
| | 4,695 |
| | 4,499 |
|
Cost of MetroPCS business combination (2) | 34 |
| | 193 |
| | 21 |
| | 36 |
| | 59 |
| | 15 |
| | (6 | ) | | — |
| | — |
| | — |
| | 110 |
| | — |
|
Stock-based compensation (3) | 71 |
| | 43 |
| | 52 |
| | 53 |
| | 61 |
| | 57 |
| | 64 |
| | 67 |
| | 72 |
| | 83 |
| | 171 |
| | 222 |
|
Other, net (3) | 40 |
| | 2 |
| | — |
| | 5 |
| | 1 |
| | 1 |
| | — |
| | — |
| | 5 |
| | — |
| | 7 |
| | 5 |
|
Adjusted EBITDA (1) | $ | 1,930 |
| | $ | 2,016 |
| | $ | 2,364 |
| | $ | 2,814 |
| | $ | 2,529 |
| | $ | 2,689 |
| | $ | 2,607 |
| | $ | 2,668 |
| | $ | 3,012 |
| | $ | 2,822 |
| | $ | 8,032 |
| | $ | 8,502 |
|
| |
| (1) | The amortized imputed discount on EIP receivables previously recognized as Interest income has been retrospectively reclassified as Other revenues. See the Effect of Change in Accounting Principle table for further detail. |
| |
| (2) | Beginning Q1 2017, we will no longer separately present Cost of MetroPCS business combination as it is insignificant. |
| |
| (3) | Stock-based compensation includes payroll tax impacts and may not agree to stock based compensation expense in the condensed consolidated financial statements. Other, net may not agree to the Condensed Consolidated Statements of Comprehensive Income primarily due to certain non-routine operating activities, such as other special items that would not be expected to reoccur, and are therefore excluded in Adjusted EBITDA. |
Adjusted EBITDA - Earnings before Interest expense, net of Interest income, Income tax expense, Depreciation and amortization expense, non-cash Stock-based compensation and certain expenses not reflective of T-Mobile's ongoing operating performance. Adjusted EBITDA margin represents Adjusted EBITDA divided by service revenues. Adjusted EBITDA is a non-GAAP financial measure utilized by T-Mobile's management to monitor the financial performance of our operations. T-Mobile uses Adjusted EBITDA internally as a metric to evaluate and compensate its personnel and management for their performance, and as a benchmark to evaluate T-Mobile's operating performance in comparison to its competitors. Management believes analysts and investors use Adjusted EBITDA as a supplemental measure to evaluate overall operating performance and facilitate comparisons with other wireless communications companies because it is indicative of T-Mobile's ongoing operating performance and trends by excluding the impact of interest expense from financing, non-cash depreciation and amortization from capital investments, non-cash stock-based compensation, network decommissioning costs as they are not indicative of T-Mobile's ongoing operating performance and certain other nonrecurring expenses. Adjusted EBITDA has limitations as an analytical tool and should not be considered in isolation or as a substitute for income from operations, net income or any other measure of financial performance reported in accordance with GAAP.