EXHIBIT 99.2
|
| | |
| | T-Mobile US, Inc. |
| |
| | Investor Factbook |
| | T-Mobile US Reports Third Quarter 2019 Results |
T-Mobile Maintains Unprecedented Momentum in Q3 and
Sets the Stage for the First Nationwide 5G Launch in 2019
Total Net Additions of 1.7M, Record-Low Q3 Branded Postpaid Phone Churn of 0.89%, Record Service Revenues of $8.6B, Record Q3 Net Income of $870M and Record Q3 Adj. EBITDA of $3.4B
Strong Customer Growth
| |
| • | 1.7 million total net additions in Q3 2019 - record 26th consecutive quarter of more than 1 million total net additions |
| |
| • | 1.1 million branded postpaid net additions in Q3 2019 - best in the industry |
| |
| • | 754,000 branded postpaid phone net additions in Q3 2019 - best in the industry |
| |
| • | 62,000 branded prepaid net additions in Q3 2019, up 27,000 YoY |
| |
| • | Record-low Q3 branded postpaid phone churn of 0.89% in Q3 2019, down 13 bps YoY |
Record Q3 Financial Performance (all percentages year-over-year)
| |
| • | Record Service revenues of $8.6 billion, up 6% in Q3 2019 with Branded postpaid revenues up 10% |
| |
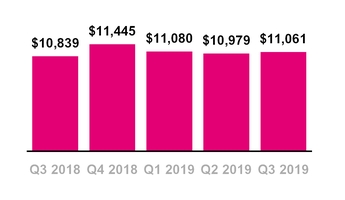
| • | Record Q3 Total revenues of $11.1 billion, up 2% in Q3 2019 |
| |
| • | Record Q3 Net income of $870 million, up 9% in Q3 2019 |
| |
| • | Record Q3 Diluted earnings per share (“EPS”) of $1.01, up 9% in Q3 2019 |
| |
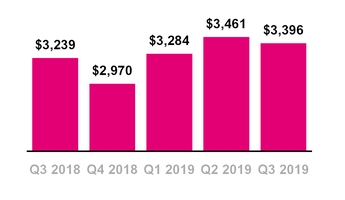
| • | Record Q3 Adjusted EBITDA(1) of $3.4 billion, up 5% in Q3 2019 |
| |
| • | Record Q3 Net cash provided by operating activities of $1.7 billion, up 91% in Q3 2019 |
| |
| • | Record Q3 Free Cash Flow(1) of $1.1 billion, up 27% in Q3 2019 |
Taking Major Steps Towards Nationwide 5G
| |
| • | Accelerated the planned launch of the first nationwide 5G network, utilizing 600 MHz spectrum, to this year, forming the foundational 5G coverage layer for New T-Mobile |
| |
| • | 600 MHz now reaching nearly 8,300 cities and towns in 48 states and Puerto Rico |
| |
| • | 4G LTE on 600 MHz now covers 200 million people and 1.4 million square miles |
| |
| • | More than 26 million 600 MHz compatible devices already on our network |
Continued Strong Outlook for 2019
| |
| • | Branded postpaid net additions of 4.1 to 4.3 million, up from prior guidance of 3.5 to 4.0 million |
| |
| • | Net income is not available on a forward-looking basis(2) |
| |
| • | Adjusted EBITDA target of $13.1 to $13.3 billion, which includes leasing revenues of $550 to $600 million, up at the midpoint from prior guidance of $12.9 to $13.3 billion(1) |
| |
| • | Cash purchases of property and equipment, excluding capitalized interest of approximately $450 million (up from prior guidance of $400 million), are expected to be $5.9 to $6.0 billion, up $200 to $300 million from the high end of the prior guidance range, reflecting the rapid rollout of 600 MHz spectrum, which sets the foundation for our accelerated plan to launch the first nationwide 5G network this year. Cash purchases of property and equipment, including capitalized interest, are expected to be $6.35 to $6.45 billion, up from the prior guidance of $5.8 to $6.1 billion |
| |
| • | Three-year compound annual growth rate (“CAGR”) from FY 2016 to FY 2019 for Net cash provided by operating activities, excluding payments for merger-related costs, is expected to be at 36% to 37%, an increase and narrowing from the prior target range of 33% to 35% |
| |
| • | Three-year CAGR from FY 2016 to FY 2019 for Free Cash Flow, excluding payments for merger-related costs, is unchanged at 46% to 48%(1) |
| |
| • | In Q4 2019, pre-close merger-related costs are expected to be $125 million to $150 million before taxes |
________________________________________________________________
| |
| (1) | Adjusted EBITDA and Free Cash Flow are non-GAAP financial measures. These non-GAAP financial measures should be considered in addition to, but not as a substitute for, the information provided in accordance with GAAP. Reconciliations for these non-GAAP financial measures to the most directly comparable financial measures are provided in the Reconciliation of Non-GAAP Financial Measures to GAAP Financial Measures tables. |
| |
| (2) | We are not able to forecast Net income on a forward-looking basis without unreasonable efforts due to the high variability and difficulty in predicting certain items that affect GAAP Net income including, but not limited to, Income tax expense, stock-based compensation expense and Interest expense. Adjusted EBITDA should not be used to predict Net income as the difference between the two measures is variable. |
Total Branded Postpaid Net Additions
(in thousands)
Branded Postpaid Phone Churn
CUSTOMER METRICS
Branded Postpaid Customers
| |
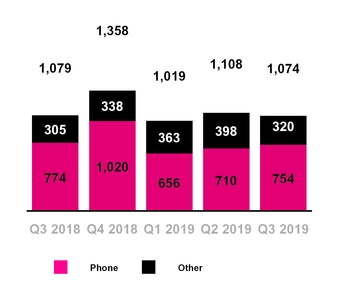
| ▪ | Branded postpaid phone net customer additions were 754,000 in Q3 2019, compared to 710,000 in Q2 2019 and 774,000 in Q3 2018. This marks the 23nd consecutive quarter that T-Mobile led the industry in branded postpaid phone net customer additions. |
| |
| ▪ | Sequentially, the increase was primarily due to higher gross customer additions driven by seasonality, partially offset by higher churn. |
| |
| ▪ | Year-over-year, the decrease was primarily due to lower gross customer additions, partially offset by record-low third-quarter churn. |
| |
| ▪ | Branded postpaid other net customer additions were 320,000 in Q3 2019, compared to 398,000 in Q2 2019 and 305,000 in Q3 2018. |
| |
| ▪ | The sequential decrease was primarily due to lower gross customer additions from wearables. |
| |
| ▪ | The year-over-year increase was primarily due to higher gross customer additions from connected devices, partially offset by higher deactivations from a growing customer base. |
| |
| ▪ | Branded postpaid net customer additions were 1,074,000 in Q3 2019, compared to 1,108,000 in Q2 2019 and 1,079,000 in Q3 2018. |
| |
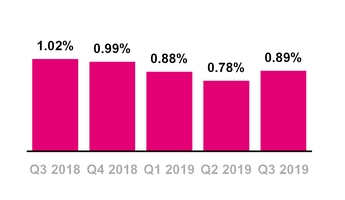
| ▪ | Branded postpaid phone churn was a third-quarter record-low 0.89% in Q3 2019, up 11 basis points from 0.78% in Q2 2019 and down 13 basis points from 1.02% in Q3 2018. |
| |
| ▪ | Sequentially, the increase was primarily due to seasonally increased promotional activity in the marketplace, partially offset by increased customer satisfaction and loyalty from ongoing improvements to network quality, industry-leading customer service and the overall value of our offerings. |
| |
| ▪ | Year-over-year, the decrease was due to increased customer satisfaction and loyalty from ongoing improvements to network quality, industry-leading customer service and the overall value of our offerings. |
Total Branded Prepaid Net Additions
(in thousands)
Branded Prepaid Churn
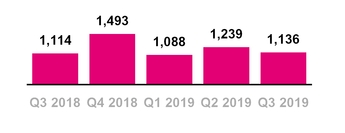
Total Branded Net Additions
(in thousands)
Branded Prepaid Customers
| |
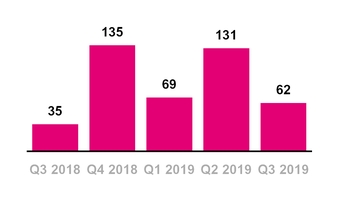
| ▪ | Branded prepaid net customer additions were 62,000 in Q3 2019, compared to 131,000 in Q2 2019 and 35,000 in Q3 2018. |
| |
| ▪ | Sequentially, the decrease was primarily due to higher churn driven by seasonality, partially offset by the continued success of our prepaid brands due to promotional activities and rate plan offers. |
| |
| ▪ | Year-over-year, the increase was primarily due to lower churn, partially offset by the impact of continued promotional activities in the marketplace. |
| |
| ▪ | Migrations to branded postpaid plans reduced branded prepaid net customer additions in Q3 2019 by approximately 130,000, up from 115,000 in Q2 2019 and down from 140,000 in Q3 2018. |
| |
| ▪ | On July 18, 2019, we entered into an agreement whereby certain T-Mobile branded prepaid products will now be offered and distributed by a current Mobile Virtual Network Operator (“MVNO”) partner. Upon the effective date, the agreement resulted in a base adjustment to reduce branded prepaid customers by 616,000 as we will no longer actively support the branded product offering. Prospectively, new customer activity associated with these products is recorded within Wholesale customers and revenue for these customers is recorded within Wholesale revenues in our Condensed Consolidated Statements of Comprehensive Income. |
| |
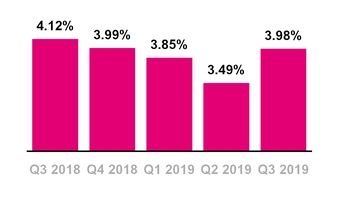
| ▪ | Branded prepaid churn was 3.98% in Q3 2019, compared to 3.49% in Q2 2019 and 4.12% in Q3 2018. |
| |
| ▪ | Sequentially, the increase was primarily due to seasonality and increased competitive activity. |
| |
| ▪ | Year-over-year, the decrease was primarily due to increased customer satisfaction and loyalty from ongoing improvements to network quality and the continued success of our prepaid brands due to promotional activities and rate plan offers. |
Total Branded Customers
| |
| ▪ | Total branded net customer additions were 1,136,000 in Q3 2019, compared to 1,239,000 in Q2 2019 and 1,114,000 in Q3 2018. |
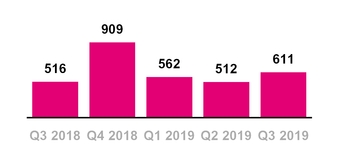
Wholesale Net Additions
(in thousands)
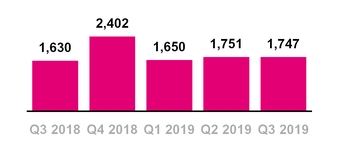
Total Net Additions
(in thousands)
Wholesale Customers
| |
| ▪ | Wholesale net customer additions were 611,000 in Q3 2019, compared to 512,000 in Q2 2019 and 516,000 in Q3 2018. |
| |
| ▪ | Sequentially, the increase was primarily due to higher Machine-to-Machine (“M2M”) net additions. |
| |
| ▪ | Year-over-year, the increase was primarily due to higher gross additions from the continued success of our M2M partnerships. |
Total Customers
| |
| ▪ | Total net customer additions were 1,747,000 in Q3 2019, compared to 1,751,000 in Q2 2019 and 1,630,000 in Q3 2018. This is the 26th consecutive quarter in which T-Mobile added more than one million total net customers. |
| |
| ▪ | T-Mobile ended Q3 2019 with 84.2 million total customers. |
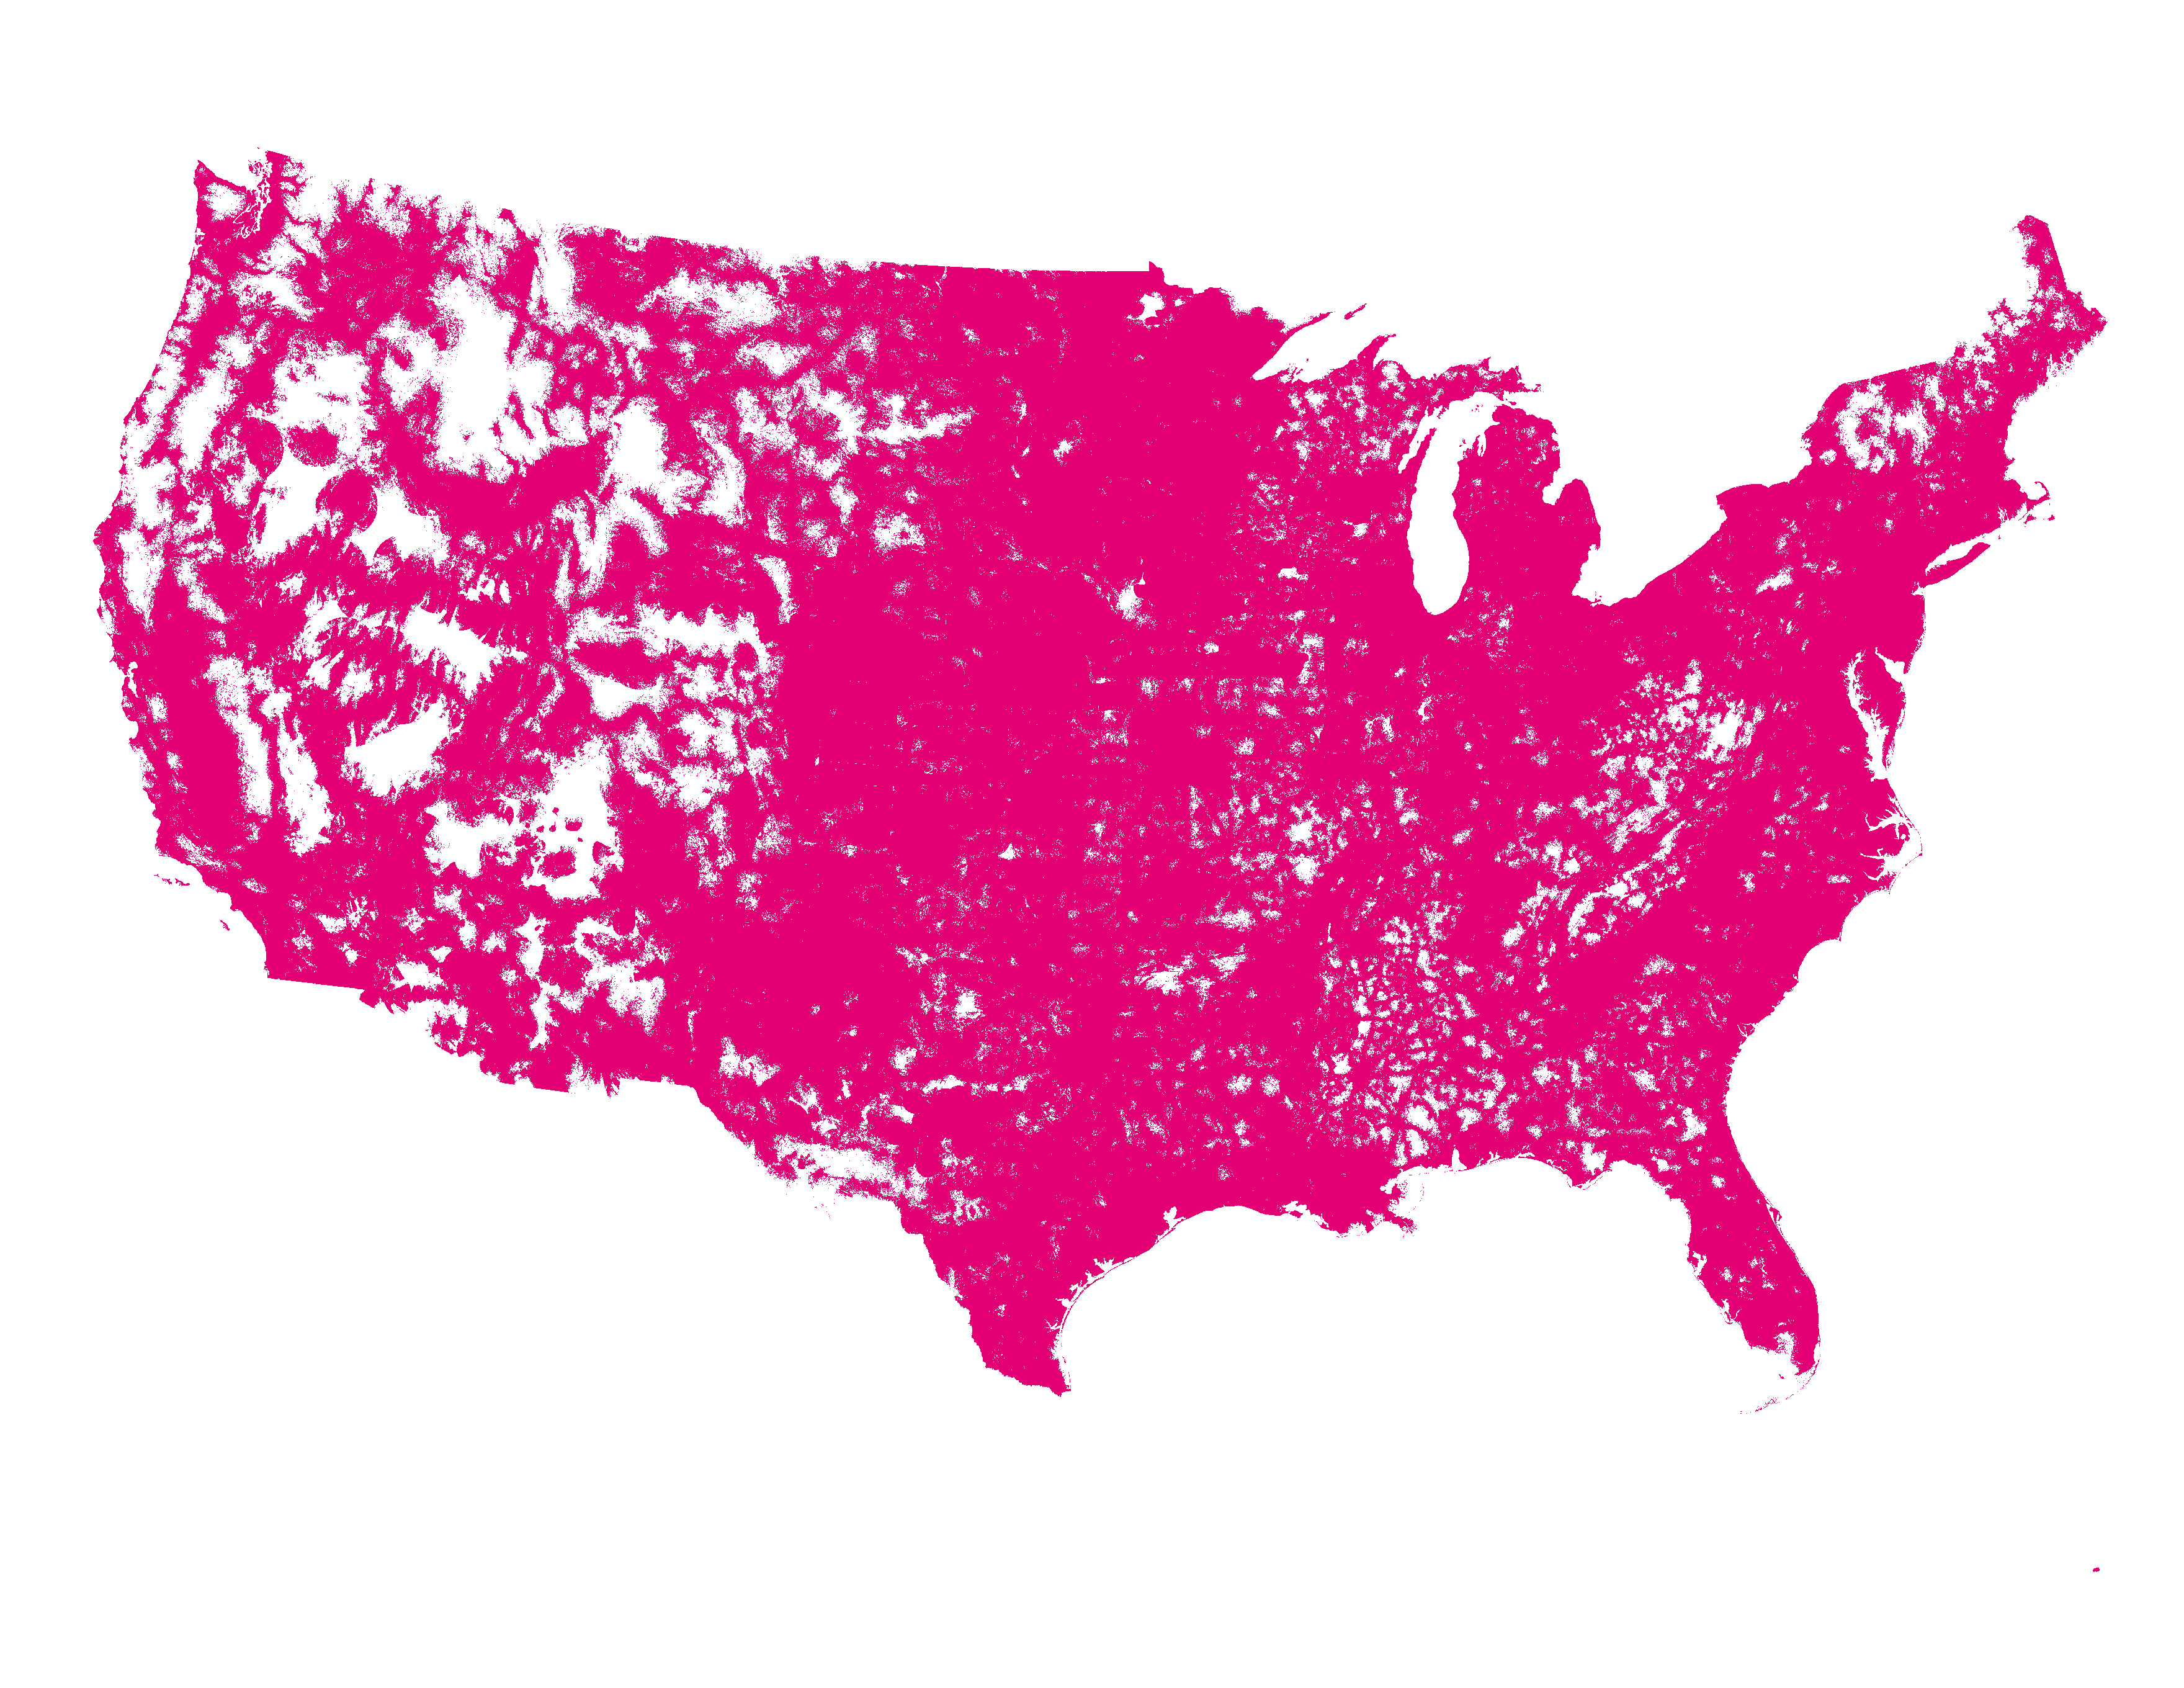
T-Mobile LTE Coverage Map
(as of September 30, 2019)
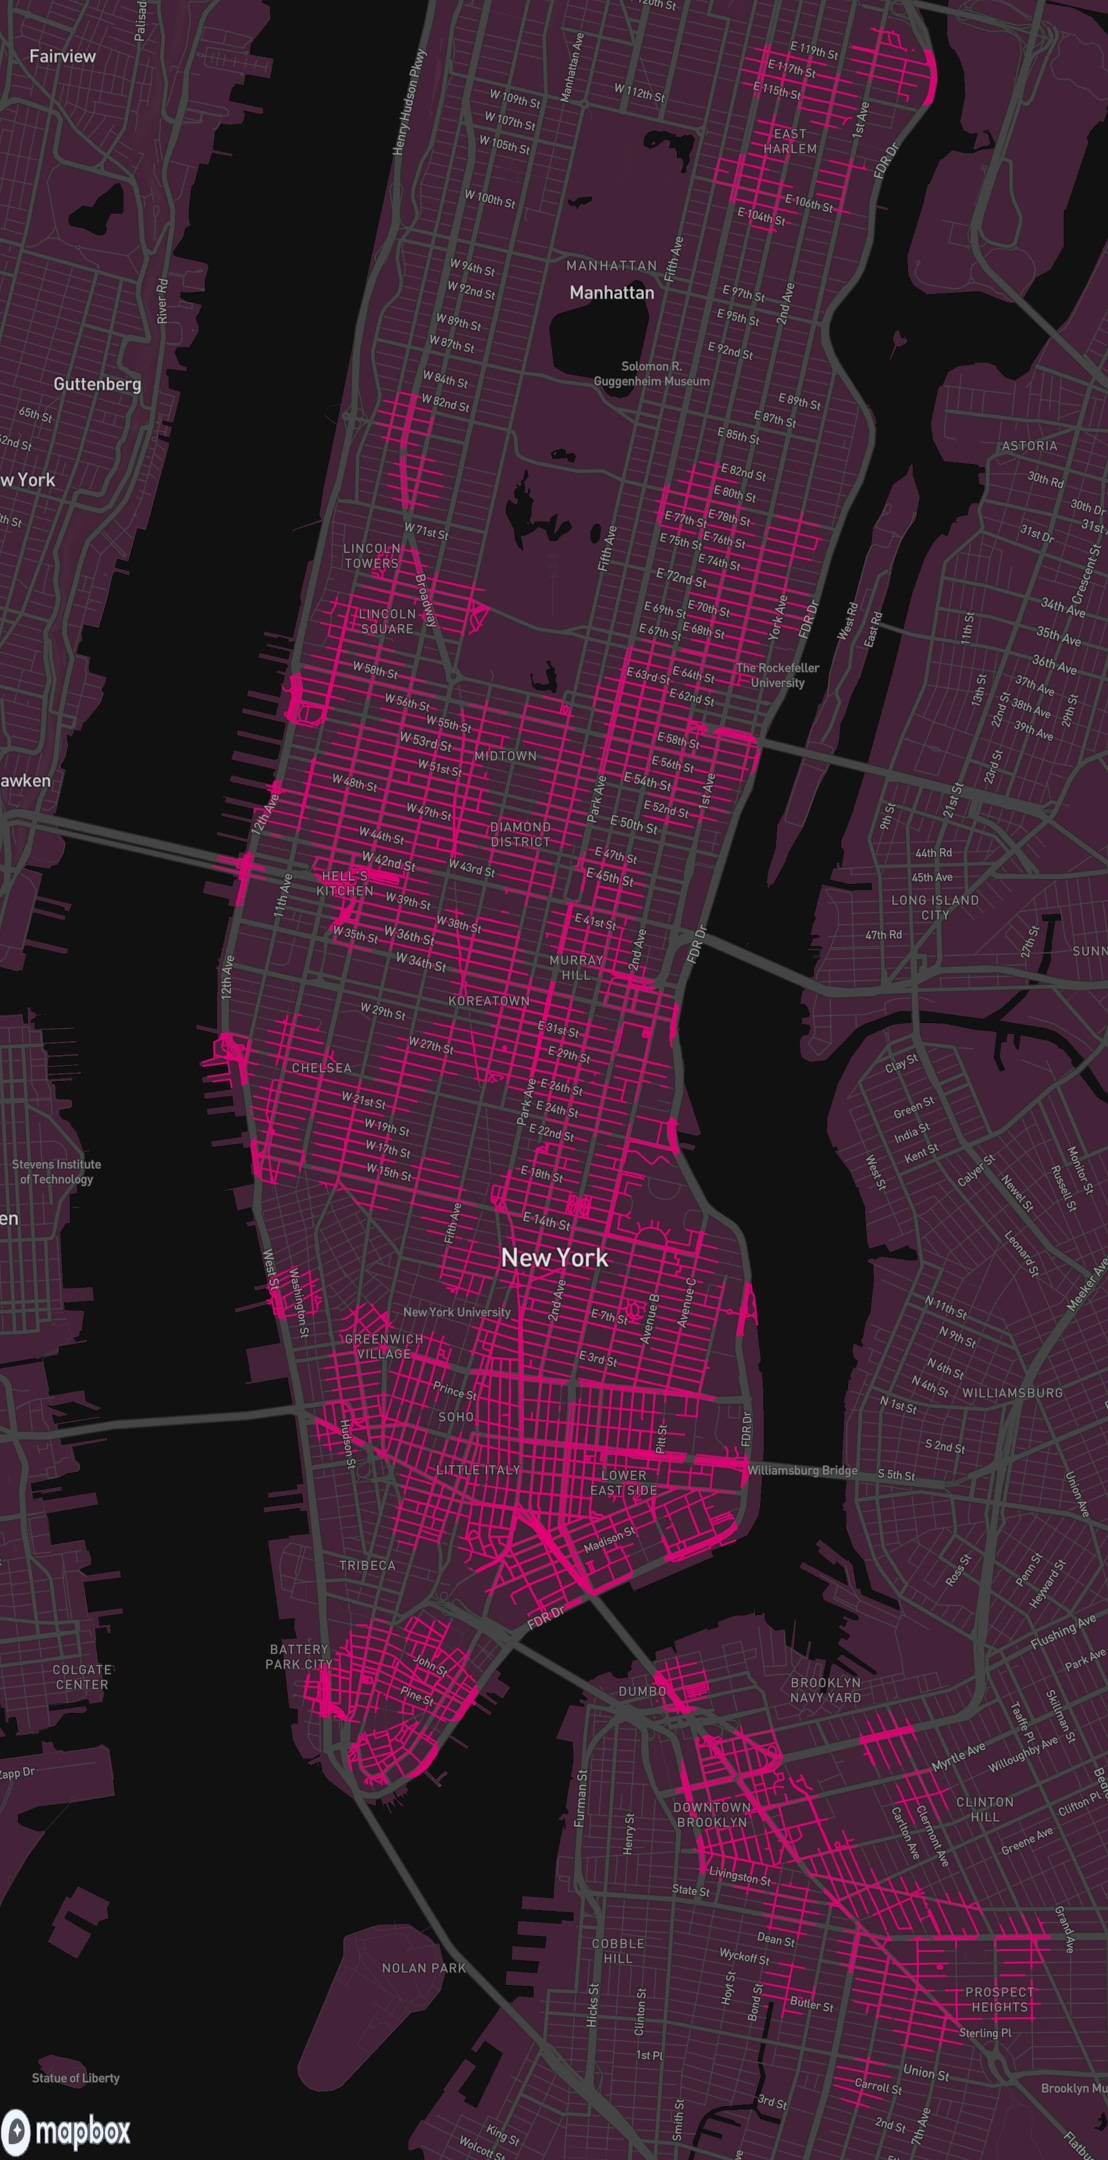
New York 5G Coverage Map
© Mapbox <https://www.mapbox.com/about/maps/>
© OpenStreetMap <http://www.openstreetmap.org/copyright>
Improve this map <https://www.mapbox.com/map-feedback/>
NETWORK
| |
| ▪ | T-Mobile continues to expand the footprint and improve the quality of our network to better serve our customers. Our advancements in network technology have allowed us to increase the capabilities of our 4G LTE network as we prepare for our nationwide deployment of 5G in 2019. |
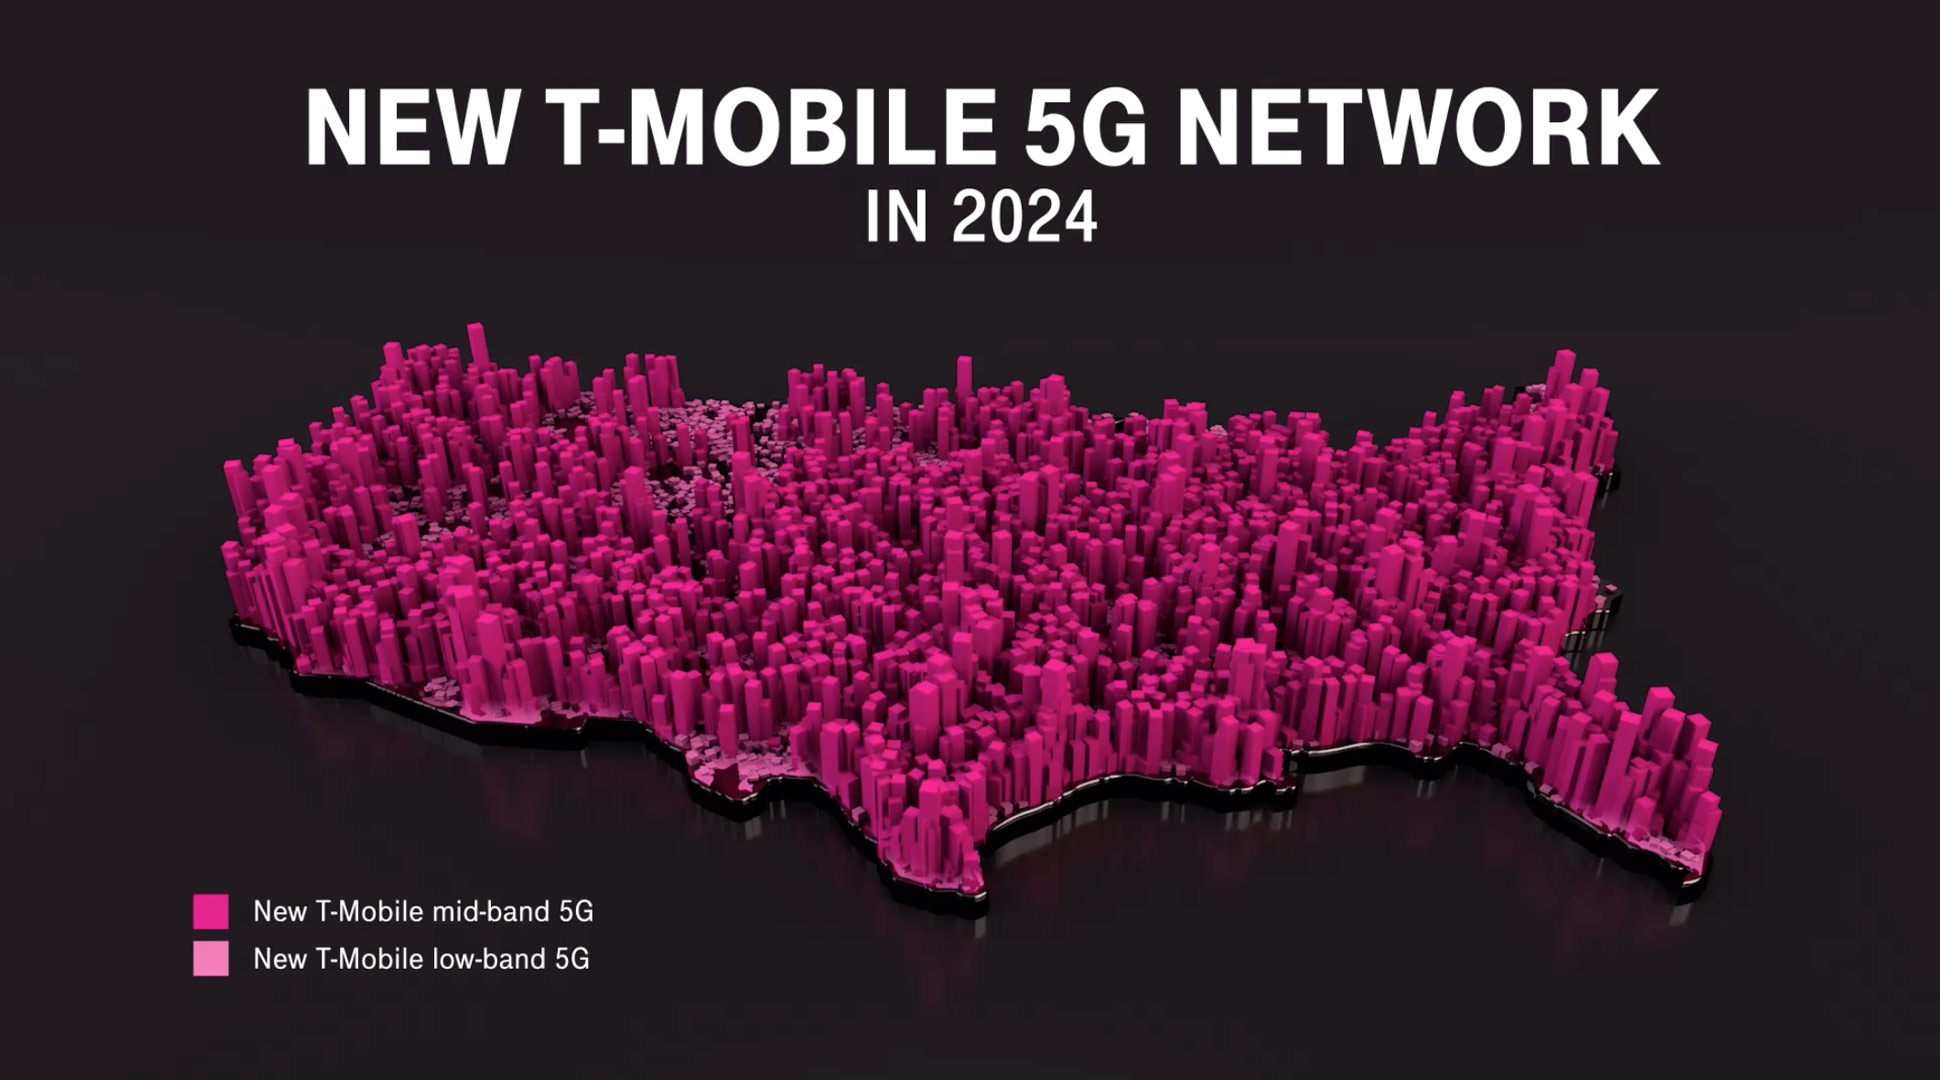
5G
| |
| ▪ | T-Mobile is building the foundation for its 5G network across the U.S. in 2019, utilizing both 600 MHz spectrum and mmWave spectrum. |
| |
| ▪ | We are continuing our deployment of LTE on 600 MHz using 5G-ready equipment and we expect to launch 5G on 600 MHz on a nationwide footprint later this year in conjunction with the introduction of the first compatible 5G smartphones, including the recently announced exclusive OnePlus 7T Pro 5G McLaren. This network will be the foundational 5G coverage layer for New T-Mobile, part of the overall “layer cake” of available low, mid, and high band spectrum for 5G that will be a game changer for consumers. |
| |
| ▪ | On June 28, 2019, T-Mobile introduced its 5G network using high-band mmWave spectrum in conjunction with the introduction of our first 5G handset, the Samsung Galaxy S10 5G. The 5G network commenced in six cities (New York City, Los Angeles, Dallas, Atlanta, Cleveland, and Las Vegas) and will be expanded and enhanced by continued deployments and the addition of new high-band spectrum over time. |
| |
| ▪ | Our mid-band spectrum will for now be reserved for LTE access. Should we close our merger with Sprint, we will rapidly deploy 5G on Sprint’s currently unused 2.5 GHz spectrum, completing the “layer cake” of spectrum and providing consumers with an unmatched 5G experience. |
600 MHz Spectrum
| |
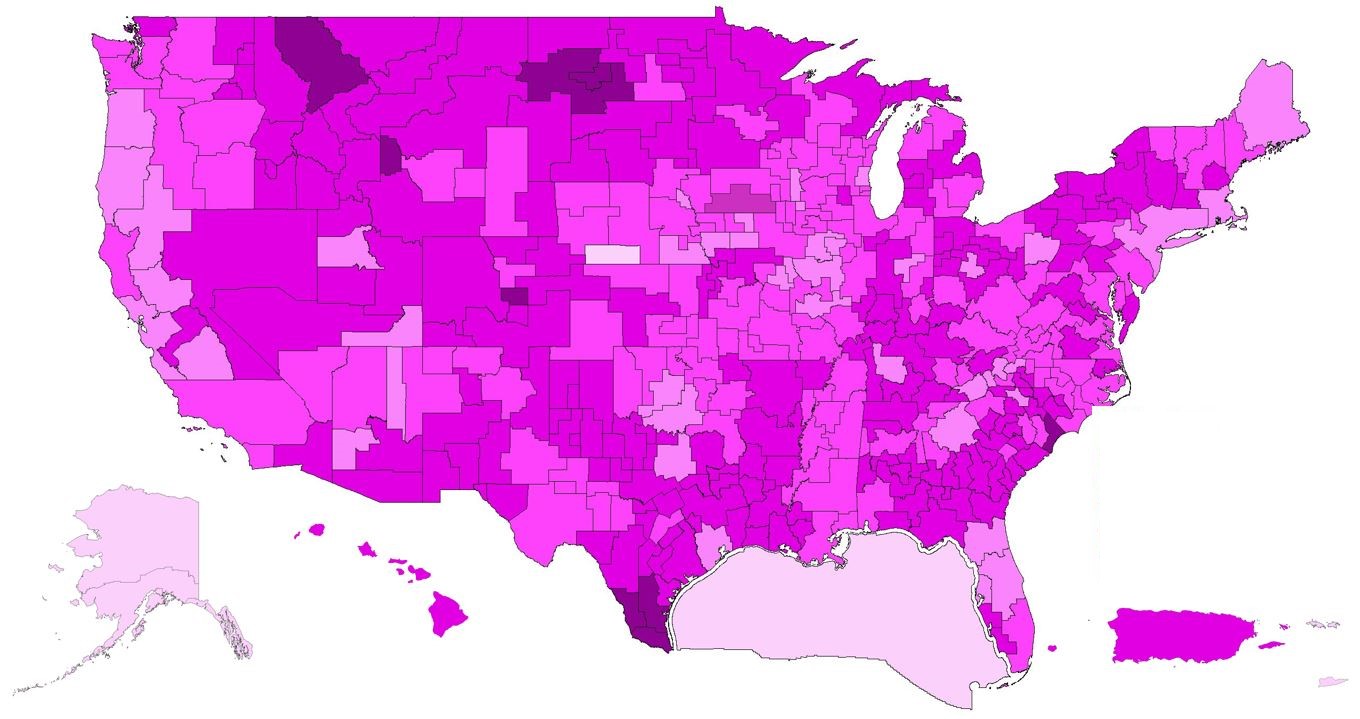
| ▪ | At the end of Q3 2019, T-Mobile owned a nationwide average of 31 MHz of 600 MHz low-band spectrum. In total, T-Mobile owns approximately 41 MHz of low-band spectrum (600 MHz and 700 MHz). The spectrum covers 100% of the U.S. |
| |
| ▪ | As of the end of Q3 2019, T-Mobile had cleared 231 million POPs and expects to clear approximately 275 million POPs by year-end 2019. |
Depth of T-Mobile’s Nationwide Low-Band Spectrum (600 MHz and 700 MHz)
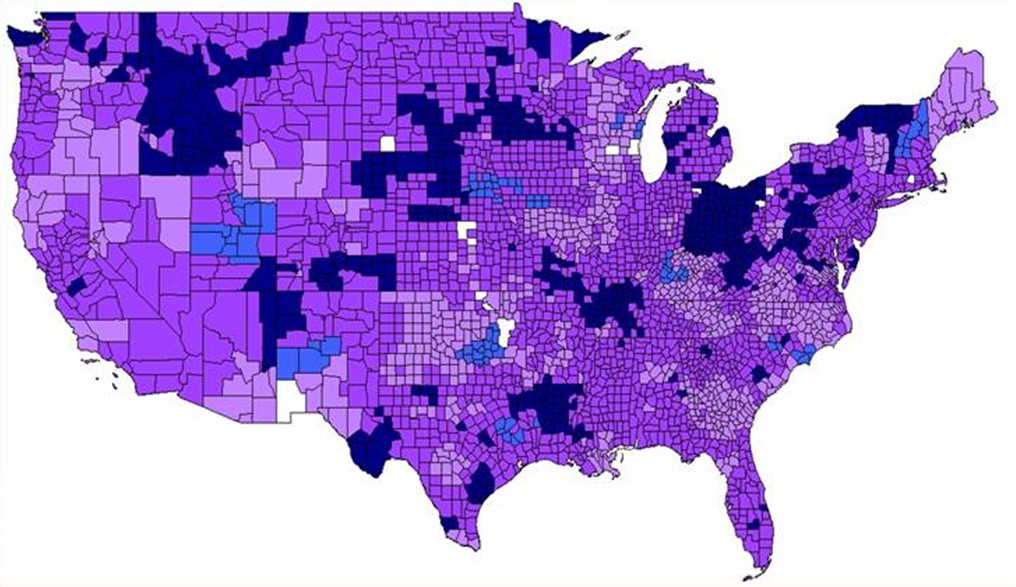
Depth of T-Mobile’s Nationwide mmWave Spectrum
| |
| ▪ | T-Mobile continues its deployment of LTE on 600 MHz spectrum using 5G-ready equipment. At the end of Q3 2019, we were live with 4G LTE in nearly 8,300 cities and towns in 48 states and Puerto Rico covering 1.4 million square miles and 200 million POPs. |
| |
| ▪ | Combining 600 and 700 MHz spectrum, we have deployed 4G LTE in low-band spectrum to 311 million POPs. |
| |
| ▪ | Currently, more than 26 million devices on T-Mobile’s network are compatible with 600 MHz spectrum. |
Spectrum Position
| |
| ▪ | At the end of Q3 2019, T-Mobile owned an average of 111 MHz of spectrum nationwide, not including mmWave spectrum. The spectrum comprises an average of 31 MHz in the 600 MHz band, 10 MHz in the 700 MHz band, 29 MHz in the 1900 MHz PCS band, and 41 MHz in the AWS band. |
| |
| ▪ | On June 3, 2019, the FCC announced the results of Auctions 101 (28 GHz spectrum) and 102 (24 GHz spectrum). In the combined auctions, T-Mobile spent $842 million to more than quadruple its nationwide average total mmWave spectrum holdings from 104 MHz to 471 MHz. |
| |
| ▪ | We will evaluate future spectrum purchases in upcoming auctions and in the secondary market to further augment our current spectrum position. No option currently available (or that we predict will become available) comes close to matching the efficiencies and synergies possible from merging with Sprint. |
Network Coverage Growth
| |
| ▪ | T-Mobile continues to expand its coverage breadth and covered 326 million people with 4G LTE at the end of Q3 2019. |
| |
| ▪ | At the end of Q3 2019, T-Mobile had equipment deployed on approximately 66,000 macro cell sites and 25,000 small cell/distributed antenna system sites. |
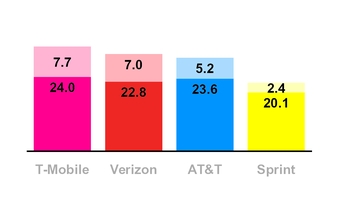
Download and
Upload Speed Experience
(Q3 2019)
(in Mbps, D/L at Base, U/L at Top)
Based on analysis of Opensignal Inc. data
Network Speed
| |
| ▪ | Based on data from Opensignal for Q3 2019, T-Mobile’s average download speed was 24.0 Mbps, Verizon at 22.8 Mbps, AT&T at 23.6 Mbps, and Sprint at 20.1 Mbps. |
| |
| ▪ | Based on data from Opensignal for Q3 2019, T-Mobile’s average upload speed was 7.7 Mbps, compared to Verizon at 7.0 Mbps, AT&T at 5.2 Mbps, and Sprint at 2.4 Mbps. |
Network Capacity Growth
| |
| ▪ | Due to industry spectrum limitations (especially in mid-band), T-Mobile continues to make efforts to expand its capacity and increase the quality of its network through the re-farming of existing spectrum and implementation of new technologies including Voice over LTE (“VoLTE”), Carrier Aggregation, 4x4 multiple-input and multiple-output (“MIMO”), 256 Quadrature Amplitude Modulation (“QAM”) and License Assisted Access (“LAA”). |
| |
| ▪ | VoLTE comprised 90% of total voice calls in Q3 2019, up from 89% in Q2 2019 and 85% in Q3 2018. |
| |
| ▪ | Carrier aggregation is live for T-Mobile customers in 956 markets, up from 947 markets in Q2 2019 and 904 in Q3 2018. |
| |
| ▪ | 4x4 MIMO is currently available in 683 markets, up from 639 markets in Q2 2019 and 535 in Q3 2018. |
| |
| ▪ | T-Mobile customers have 256 QAM available across the Un-carrier’s entire 4G LTE footprint. |
| |
| ▪ | T-Mobile is the first carrier globally to have rolled out the combination of carrier aggregation, 4x4 MIMO and 256 QAM. This trifecta of standards has been rolled out to 674 markets. |
| |
| ▪ | LAA has been deployed to 29 cities including Atlanta, Austin, Chicago, Denver, Houston, Las Vegas, Los Angeles, Miami, New Orleans, New York, Philadelphia, Sacramento, San Diego, Seattle, and Washington, DC. |
PROPOSED SPRINT TRANSACTIONS
| |
| ▪ | On April 29, 2018, T-Mobile entered into a Business Combination Agreement with Sprint to merge in an all-stock transaction at a fixed exchange ratio of 0.10256 shares of T-Mobile common stock for each share of Sprint common stock, or 9.75 shares of Sprint common stock for each share of T-Mobile common stock (the “Merger”). The Merger, and other transactions contemplated by the Business Combination Agreement, are referred to as the “Transactions.” |
| |
| ▪ | The combined company will be named “T-Mobile” and, as a result of the Merger, is expected to be able to rapidly launch a broad and deep nationwide 5G network, accelerate innovation and increase competition in the U.S. wireless, video and broadband industries. Neither T-Mobile nor Sprint on its own could generate comparable benefits to consumers. The combined company is expected to trade under the “TMUS” symbol on NASDAQ. |
| |
| ▪ | The Transactions are subject to regulatory approvals and certain other customary closing conditions: |
| |
| ▪ | We received approval from CFIUS and Team Telecom in December 2018. |
| |
| ▪ | We received favorable action from 18 of the 19 state utility commissions conducting reviews with only the California Public Utility Commission (PUC) still outstanding. |
| |
| ▪ | In June 2019, the attorneys general of certain states and the District of Columbia filed a lawsuit against us, Deutsche Telekom, Sprint, and Softbank Group Corp. in the U.S. District Court for the Southern District of New York, alleging that the Merger, if consummated, would violate Section 7 of the Clayton Act. We believe the plaintiffs’ claims are without merit and are defending the lawsuit vigorously. Trial is set to begin on December 9, 2019. |
| |
| ▪ | In July 2019, T-Mobile and Sprint received clearance for the Merger from the U.S. Department of Justice by entering into a consent decree. The DOJ consent decree is still subject to the final Tunney Act review. |
| |
| ▪ | In July 2019, T-Mobile and Sprint also entered into agreements with DISH Network Corporation to divest Sprint’s prepaid businesses and 800 MHz spectrum assets to DISH for total proceeds of $5.0 billion. Additionally, the companies will enter into commercial agreements to provide the |
transferred prepaid and new DISH wireless customers access to the New T-Mobile network for seven years.
| |
| ▪ | In early October, the State of Florida joined the DOJ settlement and Mississippi and Colorado came off the state AG complaint. In total, 19 state governments - state AGs, governors and/or PUCs - have now expressed their support for the Merger, highlighting benefits such as increased competition, rural coverage, jobs, affordability and new wireless competition for fixed broadband access. |
| |
| ▪ | The Federal Communications Commission (“FCC”) voted to approve the Merger on October 16th. |
| |
| ▪ | We remain confident and optimistic about completing the final steps for the Merger and will continue to seek approval from the California PUC and engage with State Attorneys General. |
| |
| ▪ | We now expect the Merger will be permitted to close in early 2020. |
| |
| ▪ | In Q3 2019, costs related to the Sprint transaction were $159 million before taxes compared to $222 million in Q2 2019 and $53 million in Q3 2018. These costs impacted Selling, general, and administrative (“SG&A”) expenses and Net income but are excluded from Adjusted EBITDA. |
| |
| ▪ | In Q4 2019, pre-close merger-related costs are expected to be $125 million to $150 million before taxes. |
|
| | | | | |
| Devices Sold or Leased |
| (in million units) |
| | Q3 2018 | | Q2 2019 | | Q3 2019 |
| Total Company | | | | | |
| Phones | 8.1 | | 6.5 | | 7.4 |
| Mobile broadband and IoT devices | 0.6 | | 0.6 | | 0.6 |
| Total Company | 8.7 | | 7.1 | | 8.0 |
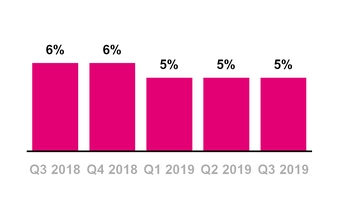
Branded Postpaid Upgrade Rate
DEVICES
| |
| ▪ | Total devices sold or leased were 8.0 million units in Q3 2019, compared to 7.1 million units in Q2 2019 and 8.7 million units in Q3 2018. |
| |
| ▪ | Total phones (smartphones and non-smartphones) sold or leased were 7.4 million units in Q3 2019, compared to 6.5 million units in Q2 2019 and 8.1 million units in Q3 2018. |
| |
| ▪ | The branded postpaid upgrade rate was approximately 5% in Q3 2019, flat sequentially and down year-over-year from 6% in Q3 2018. |
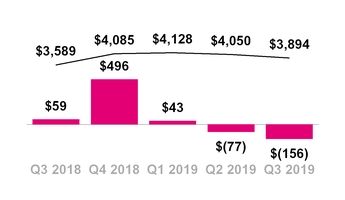
Total EIP Receivables, net and QoQ
Change in Total EIP Receivables
($ in millions)
QoQ Change in Total EIP — Total EIP Rec., net
Leased Devices Transferred to P&E,
Net and Lease Revenues
($ in millions)
Leased Devices Trans. to P&E
DEVICE FINANCING
Equipment Installment Plans (“EIP”)
| |
| ▪ | T-Mobile provided $1.54 billion in gross EIP device financing to its customers in Q3 2019, down 5.5% from $1.63 billion in Q2 2019 and down 12.9% from $1.76 billion in Q3 2018. |
| |
| ▪ | Sequentially, the decrease was primarily due to lower average revenue per device sold. |
| |
| ▪ | Year-over-year, the decrease was primarily due to lower EIP unit sales. |
| |
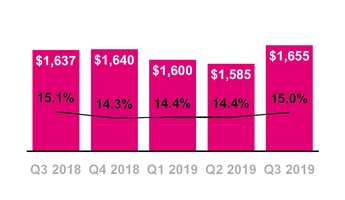
| ▪ | Customers on T-Mobile plans had associated EIP billings of $1.69 billion in Q3 2019, up 2.6% from $1.65 billion in Q2 2019 and up 5.4% from $1.60 billion in Q3 2018. EIP billings include prepayments and adjustments. |
| |
| ▪ | Total EIP receivables, net of imputed discount and allowances for credit losses, were $3.89 billion at the end of Q3 2019, compared to $4.05 billion at the end of Q2 2019 and $3.59 billion at the end of Q3 2018. |
Leasing Plans
| |
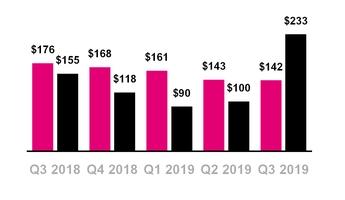
| ▪ | Leased devices transferred to property and equipment from inventory, net, was $233 million in Q3 2019, compared to $100 million in Q2 2019 and $155 million in Q3 2018. |
| |
| ▪ | The sequential and year-over year increases were primarily due to a higher number of devices leased. |
| |
| ▪ | Depreciation expense associated with leased devices was $107 million in Q3 2019, compared to $124 million in Q2 2019 and $245 million in Q3 2018. |
| |
| ▪ | Leased devices included in property and equipment, net was $543 million at the end of Q3 2019, compared to $418 million at the end of Q2 2019 and $653 million at the end of Q3 2018. |
| |
| ▪ | Lease revenues were $142 million in Q3 2019, compared to $143 million in Q2 2019 and $176 million in Q3 2018. |
Total Bad Debt Expense and Losses from Sales of Receivables
($ in millions, % of Total Revs)
CUSTOMER QUALITY
| |
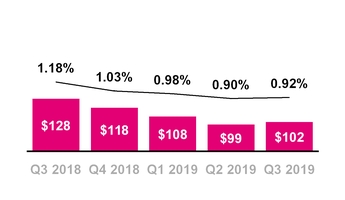
| ▪ | Total bad debt expense and losses from sales of receivables was $102 million in Q3 2019, compared to $99 million in Q2 2019 and $128 million in Q3 2018. |
| |
| ▪ | As a percentage of total revenues, total bad debt expense and losses from sales of receivables was 0.92% in Q3 2019, compared to 0.90% in Q2 2019 and 1.18% in Q3 2018. |
| |
| ▪ | Sequentially, total bad debt expense and losses from sales of receivables increased by $3 million. As a percentage of total revenues, bad debt expense and losses from sales of receivables increased by 2 basis points. |
| |
| ▪ | Year-over-year, total bad debt expense and losses from sales of receivables decreased by $26 million. As a percentage of total revenues, bad debt expense and losses from sales of receivables decreased by 26 basis points. |
| |
| ▪ | The third quarter of 2019 included certain one-time benefits and we expect a seasonal uptick in Q4 2019. |
| |
| ▪ | Including the EIP receivables sold, total EIP receivables classified as Prime were 52% of total EIP receivables at the end of Q3 2019, compared to 52% at the end of Q2 2019 and 52% at the end of Q3 2018. |
Branded Postpaid Phone ARPU
($ per month)
Branded Postpaid Customers per
Account
OPERATING METRICS
Branded Postpaid Phone ARPU
| |
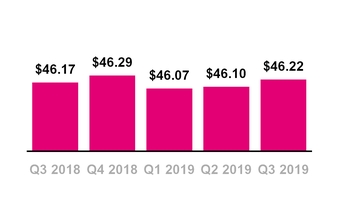
| ▪ | Branded postpaid phone ARPU was $46.22 in Q3 2019, essentially flat from $46.10 in Q2 2019 and $46.17 in Q3 2018. |
| |
| ▪ | Sequentially, there were no significant drivers. |
| |
| ▪ | Year-over-year, the change was primarily due to offsetting factors including higher premium services revenue and the growing success of new customer segments and rate plans, offset by a reduction in certain non-recurring charges, a reduction in regulatory program revenues from the continued adoption of tax inclusive plans and the ongoing growth in our Netflix offering, which totaled $0.59 for the three months ended September 30, 2019, and decreased branded postpaid phone ARPU by $0.18 compared to the three months ended September 30, 2018. |
| |
| ▪ | We expect Branded postpaid phone ARPU in full-year 2019 to be down approximately 0.7% to 0.9% compared to full-year 2018, which implies a sequential and year-over-year decline in Q4 2019. This decrease is driven in part by a reduction in the non-cash, non-recurring benefit related to Data Stash as the majority of impacted customers have transitioned to unlimited plans. |
Branded Postpaid Customers per Account
| |
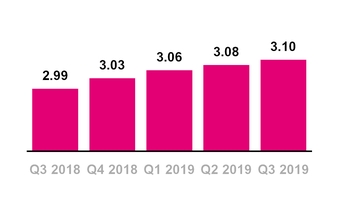
| ▪ | Branded postpaid customers per account was 3.10 at the end of Q3 2019, compared to 3.08 at the end of Q2 2019 and 2.99 at the end of Q3 2018. |
| |
| ▪ | The sequential and year-over-year increase was primarily due to the continued growth of new customer segments and rate plans such as Unlimited 55+, Military, Business and Essentials, promotional activities targeting families and the continued success of connected devices and wearables, specifically the Apple Watch. |
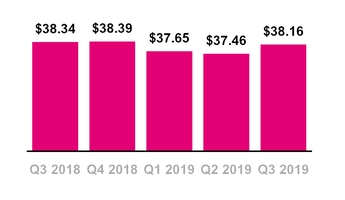
Branded Prepaid ARPU
($ per month)
Branded Prepaid ARPU
| |
| ▪ | Branded prepaid ARPU was $38.16 in Q3 2019, up 1.9% from $37.46 in Q2 2019 and essentially flat compared to $38.34 in Q3 2018. |
| |
| ▪ | Sequentially, the increase was primarily due to the removal of certain branded prepaid customers associated with products now offered and distributed by a current MVNO partner as those customers had lower ARPU. |
| |
| ▪ | Year-over-year, the change was primarily due to dilution from promotional rate plans and the growth in our Amazon Prime offering - included as a benefit with certain Metro by T-Mobile unlimited rate plans as of Q4 2018 - which impacted prepaid ARPU by $0.40 in Q3 2019, offset by the removal of certain branded prepaid customers associated with products now offered and distributed by a current MVNO partner as those customers had lower ARPU. |
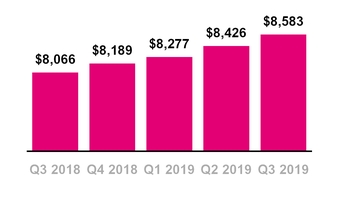
Service Revenues
($ in millions)
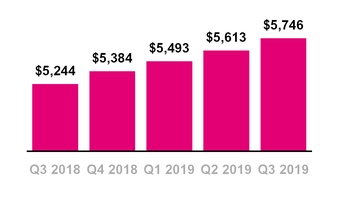
Branded Postpaid Service Revenues
($ in millions)
REVENUES
Service Revenues
| |
| ▪ | T-Mobile again led the industry in year-over-year service revenue percentage growth in Q3 2019. This marks the 22nd consecutive quarter that T-Mobile led the industry in this measure. |
| |
| ▪ | Service revenues were a record-high $8.58 billion in Q3 2019, up 1.9% from $8.43 billion in Q2 2019 and up 6.4% from $8.07 billion in Q3 2018. |
| |
| ▪ | Sequentially, the increase was primarily due to a 2.4% increase in Branded postpaid revenues, primarily due to higher average branded postpaid phone customers from growth in our customer base driven by the continued growth in existing and Greenfield markets, including the growing success of new customer segments and rate plans such as Unlimited 55+, Military, Business and Essentials. |
| |
| ▪ | Year-over-year, the increase was primarily due to a 9.6% increase in Branded postpaid revenues, primarily due to higher average branded postpaid phone customers from growth in our customer base driven by the continued growth in existing and Greenfield markets, including the growing success of new customer segments and rate plans such as Unlimited 55+, Military, Business and Essentials, along with higher average branded postpaid other customers driven by higher connected devices and wearables, specifically the Apple Watch. |
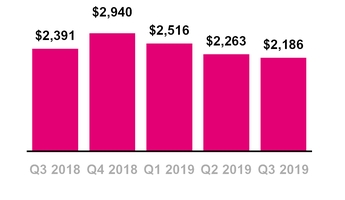
Equipment Revenues
($ in millions)
Total Revenues
($ in millions)
Equipment Revenues
| |
| ▪ | Equipment revenues were $2.19 billion in Q3 2019, down 3.4% from $2.26 billion in Q2 2019 and down 8.6% from $2.39 billion in Q3 2018. Equipment revenues in Q3 2019 were comprised of lease revenues of $142 million and non-lease revenues of $2.04 billion. |
| |
| ▪ | Sequentially, the decrease was primarily due to a lower average revenue per device sold, driven by a decrease in the high-end device mix and a decrease in proceeds from the liquidation of inventory, partially offset by a 9% increase in the number of devices sold, excluding purchased leased devices. |
| |
| ▪ | Year-over-year, the decrease was primarily due to a 10% decrease in the number of devices sold, excluding purchased leased devices, a decrease of $34 million in lease revenues primarily due to a lower number of customer devices under lease and a decrease in proceeds from the liquidation of inventory, partially offset by a higher average revenue per device sold primarily due to an increase in the high-end device mix and lower promotions. |
Total Revenues
| |
| ▪ | Total revenues were a Q3 record-high $11.06 billion in Q3 2019, up 0.7% from $10.98 billion in Q2 2019 and up 2.0% from $10.84 billion in Q3 2018. |
Cost of Services
($ in millions, % of Service Revs)
Cost of Equipment Sales
($ in millions, % of Equipment Revs)
OPERATING EXPENSES
Cost of Services
| |
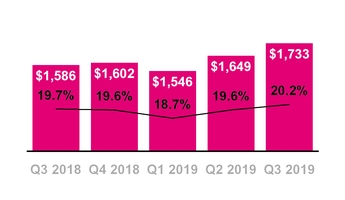
| ▪ | Cost of services, exclusive of depreciation and amortization (“D&A”), was $1.73 billion in Q3 2019, up 5.1% from $1.65 billion in Q2 2019 and up 9.3% from $1.59 billion in Q3 2018. |
| |
| ▪ | Sequentially, the increase was primarily due to higher costs for network expansion and certain one-time costs. |
| |
| ▪ | Cost of services as a percentage of Service revenues increased by 60 basis points sequentially. |
| |
| ▪ | Year-over-year, the increase was due to higher costs for network expansion and employee-related expenses and hurricane-related reimbursements, net of costs, of $54 million in Q3 2018, compared to no significant impact from hurricanes in Q3 2019, partially offset by the positive impact of the new lease standard of approximately $95 million in Q3 2019 and lower regulatory program costs. |
| |
| ▪ | As a percentage of Service revenues, Cost of services increased by 50 basis points year- |
over-year.
Cost of Equipment Sales
| |
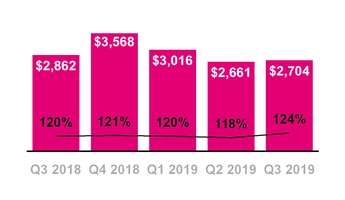
| ▪ | Cost of equipment sales, exclusive of D&A, was $2.70 billion in Q3 2019, up 1.6% from $2.66 billion in Q2 2019 and down 5.5% from $2.86 billion in Q3 2018. |
| |
| ▪ | Sequentially, the increase was primarily due to a 9% increase in the number of devices sold, excluding purchased leased devices, partially offset by a lower average cost per device sold, primarily due to a decrease in the high-end device mix, and a decrease in costs related to the liquidation of inventory. |
| |
| ▪ | Year-over-year, the decrease was primarily due to a 10% decrease in the number of devices sold, excluding purchased leased devices, and a decrease in costs related to the liquidation of inventory, partially offset by a higher average cost per device sold due to an increase in the high-end device mix. |
SG&A Expense
($ in millions, % of Service Revs)
SG&A Expense (Excluding merger-related costs)
($ in millions, % of Service Revs)
D&A Expense
($ in millions, % of Total Revs)
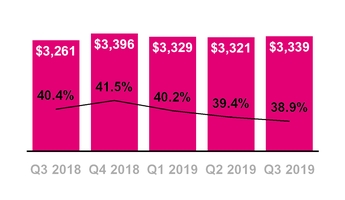
Selling, General and Admin. “SG&A” Expense
| |
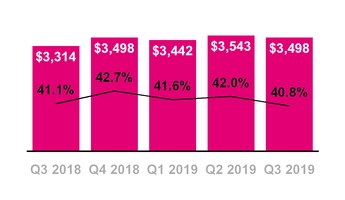
| ▪ | SG&A expense was $3.50 billion in Q3 2019, down 1.3% from $3.54 billion in Q2 2019 and up 5.6% from $3.31 billion in Q3 2018. |
| |
| ▪ | Sequentially, the decrease was primarily due to merger-related costs of $159 million in Q3 2019, compared to $222 million in Q2 2019. |
| |
| ▪ | As a percentage of Service revenues, SG&A expense decreased 120 basis points sequentially. As a percentage of Service revenues, excluding merger-related costs, SG&A expense decreased 50 basis points sequentially. |
| |
| ▪ | Year-over-year, the increase was primarily due to merger-related costs of $159 million in Q3 2019, compared to $53 million in Q3 2018, higher costs related to outsourced functions and employee-related costs and higher commissions expense resulting from an increase of $83 million in amortization expense related to commission costs that were capitalized beginning upon the adoption of ASC 606 on January 1, 2018; partially offset by lower commissions expense from lower gross branded customer additions and compensation structure changes. |
| |
| ▪ | As a percentage of Service revenues, SG&A expense decreased 30 basis points year-over-year. As a percentage of Service revenues, excluding merger-related costs, SG&A expense decreased 150 basis points year-over-year. |
Depreciation and Amortization
| |
| ▪ | D&A was $1.66 billion in Q3 2019, up 4.4% from $1.59 billion in Q2 2019 and up 1.1% from $1.64 billion in Q3 2018. |
| |
| ▪ | D&A related to leased devices was $108 million in Q3 2019, compared to $125 million in Q2 2019 and $245 million in Q3 2018. |
| |
| ▪ | Non-lease-related D&A was $1.55 billion in Q3 2019, compared to $1.46 billion in Q2 2019 and $1.39 billion in Q3 2018. |
| |
| ▪ | Sequentially and year-over-year, the increase was primarily due to the continued deployment of lower-band spectrum, including 600 MHz, partially offset by lower depreciation expense resulting from a lower total number of customer devices under lease. |
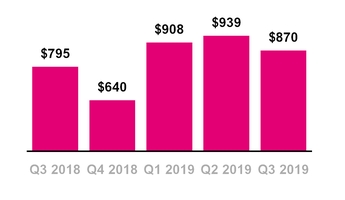
Net Income
($ in millions)
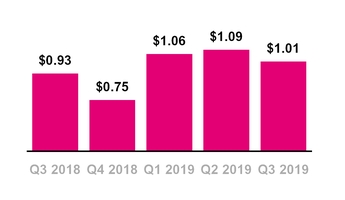
Diluted Earnings Per Share
NET INCOME AND
DILUTED EARNINGS PER SHARE
| |
| ▪ | Net income was $870 million in Q3 2019, down 7% from $939 million in Q2 2019 and up 9% from $795 million in Q3 2018. EPS was $1.01 in Q3 2019, down from $1.09 in Q2 2019 and up from $0.93 in Q3 2018. |
| |
| ▪ | Sequentially, the decreases in Net income and EPS were primarily due to lower Operating income and higher income tax expense, partially offset by higher Other income, net. |
| |
| ▪ | Net income and EPS included the following: |
| |
| ◦ | The impact from merger-related costs on Net income and EPS for Q3 2019 of $128 million and $0.15, respectively, compared to $175 million and $0.20 in Q2 2019, respectively. |
| |
| ▪ | Year-over-year, the increases in Net income and EPS were primarily due to higher Operating income and lower Interest expense to affiliates and Interest expense. |
| |
| ▪ | Net income and EPS included the following: |
| |
| ◦ | The impact from merger-related costs on Net income and EPS for Q3 2019 of $128 million and $0.15, respectively, compared to $53 million and $0.06 in Q3 2018, respectively. |
| |
| ◦ | There was no significant impact from hurricanes on Net income and EPS for Q3 2019, compared to the impact from hurricane-related reimbursements, net of costs, of $88 million and $0.10, respectively, for Q3 2018. |
| |
| ▪ | Net income margin was 10% in Q3 2019, compared to 11% in Q2 2019 and 10% in Q3 2018. Net income margin is calculated as Net income divided by Service revenues. |
| |
| ▪ | The effective tax rate for Q3 2019 was 27%. For full-year 2019, the effective tax rate is expected to be 25% to 26%. |
Adjusted EBITDA
($ in millions)
ADJUSTED EBITDA
| |
| ▪ | Adjusted EBITDA was $3.4 billion in Q3 2019, down 1.9% from $3.5 billion in Q2 2019 and up 4.8% from $3.2 billion in Q3 2018. |
| |
| ▪ | Sequentially, the decrease in Adjusted EBITDA was primarily due to higher net losses on equipment sales and higher Cost of services expenses, partially offset by higher Service revenues. |
| |
| ▪ | Year-over-year, the increase in Adjusted EBITDA was primarily due to higher Service revenues, partially offset by higher Cost of services expenses, higher Selling, general and administrative expenses, excluding merger-related costs, and the impact from hurricane-related reimbursements, net of costs, of $138 million in Q3 2018. There were no significant impacts from hurricanes in Q3 2019. |
| |
| ▪ | The impact from commission costs capitalized and amortized beginning upon the adoption of ASC 606 on January 1, 2018, reduced Adjusted EBITDA by $25 million sequentially and $83 million year-over-year. |
| |
| ▪ | Adjusted EBITDA excludes merger-related costs of $159 million in Q3 2019 compared to $222 million in Q2 2019 and $53 million in Q3 2018. |
| |
| ▪ | Adjusted EBITDA margin was 40% in Q3 2019, compared to 41% in Q2 2019 and 40% in Q3 2018. Adjusted EBITDA margin is calculated as Adjusted EBITDA divided by Service revenues. |
Cash Purchases of Property and Equipment
($ in millions, % of Service Revenues)
Cash Purchases of Property and Equipment (Excluding Capitalized Interest)
($ in millions, % of Service Revenues)
CAPITAL EXPENDITURES
| |
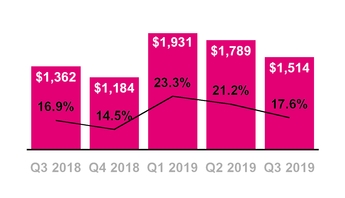
| ▪ | Cash purchases of property and equipment were $1.51 billion in Q3 2019, compared to $1.79 billion in Q2 2019 and $1.36 billion in Q3 2018. |
| |
| ▪ | Sequentially, the decrease was primarily due to fluctuations in the timing of the build-out of our network, including the build-out of 600 MHz low-band spectrum. |
| |
| ▪ | Year-over-year, the increase was primarily due to growth in network build as we continued deployment of lower-band spectrum, including 600 MHz, and laying the groundwork for 5G. |
| |
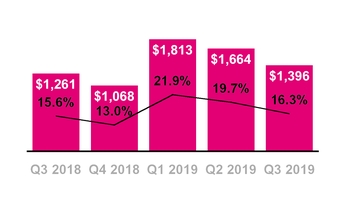
| ▪ | Cash purchases of property and equipment, excluding capitalized interest, were $1.40 billion in Q3 2019, compared to $1.66 billion in Q2 2019 and $1.26 billion in Q3 2018. |
| |
| ▪ | Capitalized interest included in cash purchases of property and equipment was $118 million in Q3 2019, compared to $125 million in Q2 2019 and $101 million in Q3 2018. |
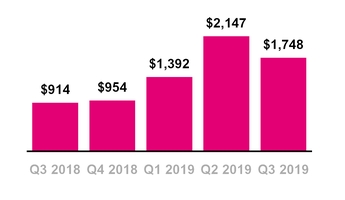
Net Cash Provided by Operating Activities
($ in millions)
CASH FLOW
Operating Activities
| |
| ▪ | Net cash provided by operating activities was $1.75 billion in Q3 2019, compared to $2.15 billion in Q2 2019 and $914 million in Q3 2018. |
| |
| ▪ | Sequentially, the decrease was primarily due to higher net cash outflows from changes in working capital and lower Net income. |
| |
| ◦ | The change in working capital was primarily due to higher use from Accounts payable and accrued liabilities and Inventories, partially offset by lower use from Equipment installment plan receivables, changes in Other current and long-term liabilities, and lower use from Accounts receivable. |
| |
| ▪ | Year-over-year, the increase was primarily due to lower net cash outflows from change in working capital and higher Net income. |
| |
| ◦ | The change in working capital was primarily due to lower use from Accounts receivable and Equipment installment plan receivables, partially offset by higher use from Accounts payable and accrued liabilities. |
| |
| ▪ | Changes in Operating lease right-of-use assets and Short and long-term operating lease liabilities are now presented in Changes in operating assets and liabilities due to the adoption of the new lease standard. Sequentially, the net impact of changes in these accounts decreased Net cash provided by operating activities by $6 million. Year-over-year, the net impact of changes in these accounts decreased Net cash provided by operating activities by $58 million. |
| |
| ▪ | Net cash provided by operating activities three-year CAGR, excluding payments for merger-related costs, from full-year 2016 to full-year 2019 is expected to be between 36% and 37%, an increase and narrowing of the prior target range of 33% to 35%. |
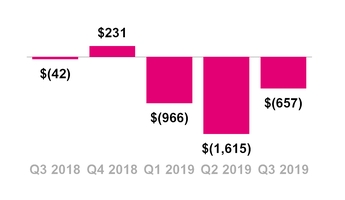
Net Cash Provided by (Used in) Investing Activities
($ in millions)
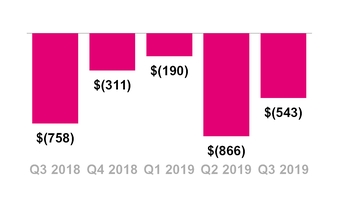
Net Cash Used in Financing Activities
($ in millions)
Investing Activities
| |
| ▪ | Net cash used in investing activities was an outflow of $657 million in Q3 2019, compared to $1.62 billion in Q2 2019 and $42 million in Q3 2018. |
| |
| ▪ | Sequentially, the decrease was primarily due to lower purchases of spectrum licenses and other intangible assets, including deposits, and lower purchases of property and equipment, including capitalized interest. |
| |
| ▪ | Year-over-year, the increase was primarily due to lower proceeds related to our deferred purchase price from securitization transactions and higher purchases of property and equipment, including capitalized interest. |
Financing Activities
| |
| ▪ | Net cash used in financing activities was $543 million in Q3 2019, compared to $866 million in Q2 2019 and $758 million in Q3 2018. |
| |
| ▪ | Sequentially, the decrease was primarily due to repayments of long-term debt in Q2 2019, partially offset by repayments of short-term debt for purchases of inventory, property and equipment in Q3 2019. |
| |
| ▪ | Year-over-year, the decrease was primarily due to net repayments on the revolving credit facility in Q3 2018, compared to no net activity in Q3 2019, partially offset by higher repayments of financing lease obligations and higher repayments of short-term debt for purchases of inventory, property and equipment. |
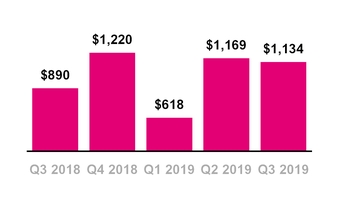
Free Cash Flow
($ in millions)
FREE CASH FLOW
| |
| ▪ | Free Cash Flow was $1.1 billion in Q3 2019, compared to $1.2 billion in Q2 2019 and $890 million in Q3 2018. |
| |
| ▪ | Sequentially, the decrease was primarily due to lower net cash provided by operating activities, as described above, partially offset by lower cash purchases of property and equipment, including capitalized interest, and higher proceeds related to our deferred purchase price from securitization transactions. |
| |
| ▪ | Year-over-year, the increase was due to higher net cash provided by operating activities, as described above, partially offset by lower proceeds related to our deferred purchase price from securitization transactions and higher cash purchases of property and equipment, including capitalized interest. |
| |
| ▪ | The impact of payments for merger-related costs on Free Cash Flow was $124 million in Q3 2019 compared to $151 million in Q2 2019 and $23 million in Q3 2018. Free cash flow, excluding payments for merger-related costs, was $1.3 billion in Q3 2019. |
| |
| ▪ | Free Cash Flow three-year CAGR, excluding payments for merger-related costs, from full-year 2016 to full-year 2019 is expected to be between 46% and 48%, unchanged from the prior target range. Free cash flow guidance does not assume any material net cash inflows from securitization going forward. |
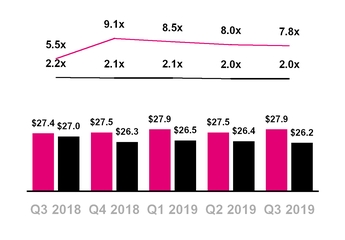
Total Debt and Net Debt (Excluding Tower Obligations)
Net Debt to LTM Net Income
Net Debt to LTM Adjusted EBITDA
($ in billions)
Total Debt (excl. Tower Obligations) Net Debt (excl. Tower Obligations) — Net Debt (excl. Tower Obligations) to LTM Net income
— Net Debt (excl. Tower Obligations) to LTM Adj. EBITDA
CAPITAL STRUCTURE
| |
| ▪ | Total debt, excluding tower obligations, at the end of Q3 2019 was $27.9 billion and was comprised of the following: |
| |
| ▪ | $475 million of Short-term debt, |
| |
| ▪ | $11.0 billion of Long-term debt, |
| |
| ▪ | $14.0 billion of Long-term debt to affiliates, |
| |
| ▪ | $1.0 billion of Short-term financing lease liabilities, and |
| |
| ▪ | $1.4 billion of Financing lease liabilities |
| |
| ▪ | Net debt, excluding tower obligations, at the end of Q3 2019 was $26.2 billion. |
| |
| ▪ | The ratio of net debt, excluding tower obligations, to Net income for the trailing last twelve months (“LTM”) period was 7.8x at the end of Q3 2019, compared to 8.0x at the end of Q2 2019 and 5.5x at the end of Q3 2018. |
| |
| ▪ | The ratio of net debt, excluding tower obligations, to Adjusted EBITDA for the trailing LTM period was 2.0x at the end of Q3 2019, compared to 2.0x at the end of Q2 2019 and 2.2x at the end of Q3 2018. |
|
| | | | | | | | | | | | | | | |
| 2019 Guidance Outlook |
| |
| | Original | | Q1 2019 Update | | Q2 2019 Update | | Q3 2019 Update |
Branded Postpaid Net Adds (in millions) | 2.6 | | 3.6 | | 3.1 | | 3.7 | | 3.5 | | 4.0 | | 4.1 | | 4.3 |
Adjusted EBITDA ($ in billions) | $12.7 | | $13.2 | | Unchanged | | $12.9 | | $13.3 | | $13.1 | | $13.3 |
Cash purchases of prop and equip excl Cap int ($ in billions) | $5.4 | | $5.7 | | Unchanged | | Unchanged | | $5.9 | | $6.0 |
| Net cash provided by op act 3-yr CAGR | 17% | | 21% | | 32% | | 35% | | 33% | | 35% | | 36% | | 37% |
| Free Cash Flow three-year CAGR | 46% | | 48% | | Unchanged | | Unchanged | | Unchanged |
GUIDANCE
| |
| ▪ | Branded postpaid net customer additions: Branded postpaid net customer additions for the full-year 2019 are expected to be 4.1 to 4.3 million, up from prior guidance of 3.5 to 4.0 million. |
| |
| ▪ | Net Income: We are not able to forecast net income on a forward-looking basis without unreasonable efforts due to the high variability and difficulty in predicting certain items that affect GAAP net income, including, but not limited to, income tax expense, stock-based compensation expense and interest expense. Adjusted EBITDA should not be used to predict net income as the difference between the two measures is variable. |
| |
| ▪ | Adjusted EBITDA: For the full-year 2019, Adjusted EBITDA is expected to be in the range of $13.1 to $13.3 billion, increasing the midpoint from the prior guidance range of $12.9 to $13.3 billion. This target includes expected leasing revenues of $550 to $600 million, unchanged from prior guidance, and takes into account the network expansion, including the deployment of our 600 MHz spectrum and the build-out of our 5G network. |
| |
| ▪ | Capital expenditures: Cash purchases of property and equipment for the full-year 2019, excluding capitalized interest of approximately $450 million (up from prior guidance of $400 million), are expected to be in the range of $5.9 to $6.0 billion, up $200 to $300 million from the high end of the prior guidance range. Cash purchases of property and equipment for the full-year 2019, including capitalized interest, are expected to be in the range of $6.35 to $6.45 billion, up from the prior guidance of $5.8 to $6.1 billion. The higher capital expenditures guidance reflects our rapid rollout of 600 MHz spectrum, setting the foundation for our accelerated plan to launch the first nationwide 5G network with more than 200 million POPs later this year. |
| |
| ▪ | Net cash provided by operating activities: Net cash provided by operating activities three-year CAGR, excluding payments for merger-related costs, from full-year 2016 to full-year 2019 is expected to be between 36% and 37%, an increase and narrowing of the prior target range of 33% to 35%. |
| |
| ▪ | Free Cash Flow: Free Cash Flow three-year CAGR, excluding payments for merger-related costs, from full-year 2016 to full-year 2019 is expected to be between 46% and 48%, unchanged from the prior target range. Free cash flow guidance does not assume any material net cash inflows from securitization going forward. |
| |
| ▪ | Branded postpaid phone ARPU: We expect Branded postpaid phone ARPU in full-year 2019 to be down approximately 0.7% to 0.9% compared to full-year 2018, which implies a sequential and year-over-year decline in Q4 2019. This decrease is driven in part by a reduction in the non-cash, non-recurring benefit related to Data Stash as the majority of impacted customers have transitioned to unlimited plans. |
| |
| ▪ | Tax Rate: For full-year 2019, the effective tax rate is expected to be 25% to 26%, unchanged from prior guidance. |
| |
| ▪ | Merger-related costs: In Q4 2019, pre-close merger-related costs are expected to be $125 to $150 million before taxes. These costs are excluded from Adjusted EBITDA but will impact Net income and cash flows. |
UPCOMING EVENTS (All dates and attendance tentative)
| |
| ▪ | UBS Global TMT Conference, December 9-11, New York, NY |
| |
| ▪ | Citi 2020 Global TMT West Conference, January 7-8, Las Vegas, NV |
| |
| ▪ | Raymond James Deer Valley Summit, January 9-10, Park City, UT |
CONTACT INFORMATION
Press:
Media Relations
T-Mobile US, Inc.
mediarelations@t-mobile.com
http://newsroom.t-mobile.com
Investor Relations:
Nils Paellmann, nils.paellmann@t-mobile.com
Ben Barrett, ben.barrett@t-mobile.com
Esther Tehrani, esther.tehrani@t-mobile.com
investor.relations@t-mobile.com
http://investor.t-mobile.com
T-Mobile US, Inc.
Condensed Consolidated Balance Sheets
(Unaudited)
|
| | | | | | | |
| (in millions, except share and per share amounts) | September 30,
2019 | | December 31,
2018 |
| Assets | | | |
| Current assets | | | |
| Cash and cash equivalents | $ | 1,653 |
| | $ | 1,203 |
|
| Accounts receivable, net of allowances of $61 and $67 | 1,822 |
| | 1,769 |
|
| Equipment installment plan receivables, net | 2,425 |
| | 2,538 |
|
| Accounts receivable from affiliates | 20 |
| | 11 |
|
| Inventory | 801 |
| | 1,084 |
|
| Other current assets | 1,737 |
| | 1,676 |
|
| Total current assets | 8,458 |
| | 8,281 |
|
| Property and equipment, net | 22,098 |
| | 23,359 |
|
| Operating lease right-of-use assets | 10,914 |
| | — |
|
| Financing lease right-of-use assets | 2,855 |
| | — |
|
| Goodwill | 1,930 |
| | 1,901 |
|
| Spectrum licenses | 36,442 |
| | 35,559 |
|
| Other intangible assets, net | 144 |
| | 198 |
|
| Equipment installment plan receivables due after one year, net | 1,469 |
| | 1,547 |
|
| Other assets | 1,799 |
| | 1,623 |
|
| Total assets | $ | 86,109 |
| | $ | 72,468 |
|
| Liabilities and Stockholders' Equity | | | |
| Current liabilities | | | |
| Accounts payable and accrued liabilities | $ | 6,406 |
| | $ | 7,741 |
|
| Payables to affiliates | 252 |
| | 200 |
|
| Short-term debt | 475 |
| | 841 |
|
| Deferred revenue | 608 |
| | 698 |
|
| Short-term operating lease liabilities | 2,232 |
| | — |
|
| Short-term financing lease liabilities | 1,013 |
| | — |
|
| Other current liabilities | 1,883 |
| | 787 |
|
| Total current liabilities | 12,869 |
| | 10,267 |
|
| Long-term debt | 10,956 |
| | 12,124 |
|
| Long-term debt to affiliates | 13,986 |
| | 14,582 |
|
| Tower obligations | 2,241 |
| | 2,557 |
|
| Deferred tax liabilities | 5,296 |
| | 4,472 |
|
| Operating lease liabilities | 10,614 |
| | — |
|
| Financing lease liabilities | 1,440 |
| | — |
|
| Deferred rent expense | — |
| | 2,781 |
|
| Other long-term liabilities | 936 |
| | 967 |
|
| Total long-term liabilities | 45,469 |
| | 37,483 |
|
| Commitments and contingencies | | | |
| Stockholders' equity | | | |
| Common Stock, par value $0.00001 per share, 1,000,000,000 shares authorized; 857,072,063 and 851,675,119 shares issued, 855,557,671 and 850,180,317 shares outstanding | — |
| | — |
|
| Additional paid-in capital | 38,433 |
| | 38,010 |
|
| Treasury stock, at cost, 1,514,392 and 1,494,802 shares issued | (8 | ) | | (6 | ) |
| Accumulated other comprehensive loss | (1,070 | ) | | (332 | ) |
| Accumulated deficit | (9,584 | ) | | (12,954 | ) |
| Total stockholders' equity | 27,771 |
| | 24,718 |
|
| Total liabilities and stockholders' equity | $ | 86,109 |
| | $ | 72,468 |
|
T-Mobile US, Inc.
Condensed Consolidated Statements of Comprehensive Income
(Unaudited)
|
| | | | | | | | | | | | | | | | | | | |
| | Three Months Ended | | Nine Months Ended September 30, |
| (in millions, except share and per share amounts) | September 30,
2019 | | June 30,
2019 | | September 30,
2018 | | 2019 | | 2018 |
| Revenues | | | | | | | | | |
| Branded postpaid revenues | $ | 5,746 |
| | $ | 5,613 |
| | $ | 5,244 |
| | $ | 16,852 |
| | $ | 15,478 |
|
| Branded prepaid revenues | 2,385 |
| | 2,379 |
| | 2,395 |
| | 7,150 |
| | 7,199 |
|
| Wholesale revenues | 321 |
| | 313 |
| | 338 |
| | 938 |
| | 879 |
|
| Roaming and other service revenues | 131 |
| | 121 |
| | 89 |
| | 346 |
| | 247 |
|
| Total service revenues | 8,583 |
| | 8,426 |
| | 8,066 |
| | 25,286 |
| | 23,803 |
|
| Equipment revenues | 2,186 |
| | 2,263 |
| | 2,391 |
| | 6,965 |
| | 7,069 |
|
| Other revenues | 292 |
| | 290 |
| | 382 |
| | 869 |
| | 993 |
|
| Total revenues | 11,061 |
| | 10,979 |
| | 10,839 |
| | 33,120 |
| | 31,865 |
|
| Operating expenses | | | | | | | | | |
| Cost of services, exclusive of depreciation and amortization shown separately below | 1,733 |
| | 1,649 |
| | 1,586 |
| | 4,928 |
| | 4,705 |
|
| Cost of equipment sales, exclusive of depreciation and amortization shown separately below | 2,704 |
| | 2,661 |
| | 2,862 |
| | 8,381 |
| | 8,479 |
|
| Selling, general and administrative | 3,498 |
| | 3,543 |
| | 3,314 |
| | 10,483 |
| | 9,663 |
|
| Depreciation and amortization | 1,655 |
| | 1,585 |
| | 1,637 |
| | 4,840 |
| | 4,846 |
|
| Total operating expense | 9,590 |
| | 9,438 |
| | 9,399 |
| | 28,632 |
| | 27,693 |
|
| Operating income | 1,471 |
| | 1,541 |
| | 1,440 |
| | 4,488 |
| | 4,172 |
|
| Other income (expense) | | | | | | | | | |
| Interest expense | (184 | ) | | (182 | ) | | (194 | ) | | (545 | ) | | (641 | ) |
| Interest expense to affiliates | (100 | ) | | (101 | ) | | (124 | ) | | (310 | ) | | (418 | ) |
| Interest income | 5 |
| | 4 |
| | 5 |
| | 17 |
| | 17 |
|
| Other (expense) income, net | 3 |
| | (22 | ) | | 3 |
| | (12 | ) | | (51 | ) |
| Total other expense, net | (276 | ) | | (301 | ) | | (310 | ) | | (850 | ) | | (1,093 | ) |
| Income before income taxes | 1,195 |
| | 1,240 |
| | 1,130 |
| | 3,638 |
| | 3,079 |
|
| Income tax expense | (325 | ) | | (301 | ) | | (335 | ) | | (921 | ) | | (831 | ) |
| Net income | 870 |
| | 939 |
| | 795 |
| | 2,717 |
| | 2,248 |
|
| | | | | | | | | | |
| Net income | $ | 870 |
| | $ | 939 |
| | $ | 795 |
| | $ | 2,717 |
| | $ | 2,248 |
|
| Other comprehensive loss, net of tax | | | | | | | | | |
| Unrealized loss on cash flow hedges, net of tax effect of $88, $102, $0, $256 and $0 | (257 | ) | | (292 | ) | | — |
| | (738 | ) | | — |
|
| Other comprehensive (loss) | (257 | ) | | (292 | ) | | — |
| | (738 | ) | | — |
|
| Total comprehensive income | $ | 613 |
| | $ | 647 |
| | $ | 795 |
| | $ | 1,979 |
| | $ | 2,248 |
|
| Earnings per share | | | | | | | | | |
| Basic | $ | 1.02 |
| | $ | 1.10 |
| | $ | 0.94 |
| | $ | 3.18 |
| | $ | 2.65 |
|
| Diluted | $ | 1.01 |
| | $ | 1.09 |
| | $ | 0.93 |
| | $ | 3.15 |
| | $ | 2.62 |
|
| Weighted average shares outstanding | | | | | | | | | |
| Basic | 854,578,241 |
| | 854,368,443 |
| | 847,087,120 |
| | 853,391,370 |
| | 849,960,290 |
|
| Diluted | 862,690,751 |
| | 860,135,593 |
| | 853,852,764 |
| | 862,854,654 |
| | 858,248,568 |
|
T-Mobile US, Inc.
Condensed Consolidated Statements of Cash Flows
(Unaudited) |
| | | | | | | | | | | | | | | | | | | |
| | Three Months Ended | | Nine Months Ended September 30, |
| (in millions) | September 30,
2019 | | June 30,
2019 | | September 30,
2018 | | 2019 | | 2018 |
| Operating activities | | | | | | | | | |
| Net income | $ | 870 |
| | $ | 939 |
| | $ | 795 |
| | $ | 2,717 |
| | $ | 2,248 |
|
| Adjustments to reconcile net income to net cash provided by operating activities | | | | | | | | | |
| Depreciation and amortization | 1,655 |
| | 1,585 |
| | 1,637 |
| | 4,840 |
| | 4,846 |
|
| Stock-based compensation expense | 126 |
| | 130 |
| | 115 |
| | 366 |
| | 324 |
|
| Deferred income tax expense | 294 |
| | 267 |
| | 284 |
| | 849 |
| | 762 |
|
| Bad debt expense | 74 |
| | 71 |
| | 80 |
| | 218 |
| | 209 |
|
| Losses from sales of receivables | 28 |
| | 28 |
| | 48 |
| | 91 |
| | 127 |
|
| Deferred rent expense | — |
| | — |
| | 10 |
| | — |
| | 21 |
|
| Losses on redemption of debt | — |
| | 19 |
| | — |
| | 19 |
| | 122 |
|
| Changes in operating assets and liabilities | | | | | | | | | |
| Accounts receivable | (745 | ) | | (805 | ) | | (1,238 | ) | | (2,693 | ) | | (3,247 | ) |
| Equipment installment plan receivables | (78 | ) | | (150 | ) | | (335 | ) | | (478 | ) | | (843 | ) |
| Inventories | (36 | ) | | 162 |
| | (115 | ) | | (139 | ) | | 43 |
|
| Operating lease right-of-use assets | 491 |
| | 469 |
| | — |
| | 1,395 |
| | — |
|
| Other current and long-term assets | (118 | ) | | (83 | ) | | (193 | ) | | (288 | ) | | (309 | ) |
| Accounts payable and accrued liabilities | (395 | ) | | 43 |
| | (265 | ) | | (339 | ) | | (1,372 | ) |
| Short and long-term operating lease liabilities | (549 | ) | | (521 | ) | | — |
| | (1,592 | ) | | — |
|
| Other current and long-term liabilities | 42 |
| | (27 | ) | | 39 |
| | 136 |
| | (21 | ) |
| Other, net | 89 |
| | 20 |
| | 52 |
| | 185 |
| | 35 |
|
| Net cash provided by operating activities | 1,748 |
| | 2,147 |
| | 914 |
| | 5,287 |
| | 2,945 |
|
| Investing activities | | |
|
| | | | | | |
| Purchases of property and equipment, including capitalized interest of $118, $125 and $101 | (1,514 | ) | | (1,789 | ) | | (1,362 | ) | | (5,234 | ) | | (4,357 | ) |
| Purchases of spectrum licenses and other intangible assets, including deposits | (13 | ) | | (665 | ) | | (22 | ) | | (863 | ) | | (101 | ) |
| Proceeds related to beneficial interests in securitization transactions | 900 |
| | 839 |
| | 1,338 |
| | 2,896 |
| | 3,956 |
|
| Acquisition of companies, net of cash acquired | (31 | ) | | — |
| | — |
| | (31 | ) | | (338 | ) |
| Other, net | 1 |
| | — |
| | 4 |
| | (6 | ) | | 30 |
|
| Net cash provided by (used in) investing activities | (657 | ) | | (1,615 | ) | | (42 | ) | | (3,238 | ) | | (810 | ) |
| Financing activities | | | | | | | | | |
| Proceeds from issuance of long-term debt | — |
| | — |
| | — |
| | — |
| | 2,494 |
|
| Payments of consent fees related to long-term debt | — |
| | — |
| | — |
| | — |
| | (38 | ) |
| Proceeds from borrowing on revolving credit facility | 575 |
| | 880 |
| | 1,810 |
| | 2,340 |
| | 6,050 |
|
| Repayments of revolving credit facility | (575 | ) | | (880 | ) | | (2,130 | ) | | (2,340 | ) | | (6,050 | ) |
| Repayments of financing lease obligations | (235 | ) | | (229 | ) | | (181 | ) | | (550 | ) | | (508 | ) |
| Repayments of short-term debt for purchases of inventory, property and equipment, net | (300 | ) | | — |
| | (246 | ) | | (300 | ) | | (246 | ) |
| Repayments of long-term debt | — |
| | (600 | ) | | — |
| | (600 | ) | | (3,349 | ) |
| Repurchases of common stock | — |
| | — |
| | — |
| | — |
| | (1,071 | ) |
| Tax withholdings on share-based awards | (4 | ) | | (4 | ) | | (5 | ) | | (108 | ) | | (89 | ) |
| Cash payments for debt prepayment or debt extinguishment costs | — |
| | (28 | ) | | — |
| | (28 | ) | | (212 | ) |
| Other, net | (4 | ) | | (5 | ) | | (6 | ) | | (13 | ) | | (6 | ) |
| Net cash used in financing activities | (543 | ) | | (866 | ) | | (758 | ) | | (1,599 | ) | | (3,025 | ) |
| Change in cash and cash equivalents | 548 |
| | (334 | ) | | 114 |
| | 450 |
| | (890 | ) |
| Cash and cash equivalents | | | | | | | | | |
| Beginning of period | 1,105 |
| | 1,439 |
| | 215 |
| | 1,203 |
| | 1,219 |
|
| End of period | $ | 1,653 |
| | $ | 1,105 |
| | $ | 329 |
| | $ | 1,653 |
| | $ | 329 |
|
| Supplemental disclosure of cash flow information | | | | | | | | | |
| Interest payments, net of amounts capitalized | $ | 327 |
| | $ | 245 |
| | $ | 366 |
| | $ | 912 |
| | $ | 1,303 |
|
Operating lease payments (1) | 703 |
| | 703 |
| | — |
| | 2,094 |
| | — |
|
| Income tax payments | 5 |
| | 40 |
| | 29 |
| | 77 |
| | 40 |
|
| Noncash investing and financing activities | | | | | | | | | |
| Noncash beneficial interest obtained in exchange for securitized receivables | $ | 1,734 |
| | $ | 1,616 |
| | $ | 1,263 |
| | $ | 4,862 |
| | $ | 3,596 |
|
| (Decrease) increase in accounts payable for purchases of property and equipment | (460 | ) | | (113 | ) | | 78 |
| | (906 | ) | | (672 | ) |
| Leased devices transferred from inventory to property and equipment | 298 |
| | 167 |
| | 229 |
| | 612 |
| | 813 |
|
| Returned leased devices transferred from property and equipment to inventory | (65 | ) | | (67 | ) | | (74 | ) | | (189 | ) | | (246 | ) |
| Short-term debt assumed for financing of property and equipment | 475 |
| | 50 |
| | — |
| | 775 |
| | 291 |
|
| Operating lease right-of-use assets obtained in exchange for lease obligations | 989 |
| | 1,400 |
| | — |
| | 3,083 |
| | — |
|
| Financing lease right-of-use assets obtained in exchange for lease obligations | 395 |
| | 368 |
| | 133 |
| | 943 |
| | 451 |
|
| |
| (1) | On January 1, 2019, we adopted ASU 2016-02, “Leases (Topic 842),” which requires certain supplemental cash flow disclosures. Where these disclosures or a comparable figure were not required under the former lease standard, we have not retrospectively presented historical amounts. See Note 1 – Summary of Significant Accounting Policies in the Q3 2019 10-Q for additional details. |
T-Mobile US, Inc.
Supplementary Operating and Financial Data
(Unaudited)
|
| | | | | | | | | | | | | | | | | | | | | | | | | | |
| | Quarter | | Nine Months Ended September 30, |
| (in thousands) | Q1 2018 | | Q2 2018 | | Q3 2018 | | Q4 2018 | | Q1 2019 | | Q2 2019 | | Q3 2019 | | 2018 | | 2019 |
| Customers, end of period | | | | | | | | | | | | | | | | | |
| Branded postpaid phone customers | 34,744 |
| | 35,430 |
| | 36,204 |
| | 37,224 |
| | 37,880 |
| | 38,590 |
| | 39,344 |
| | 36,204 |
| | 39,344 |
|
| Branded postpaid other customers | 4,321 |
| | 4,652 |
| | 4,957 |
| | 5,295 |
| | 5,658 |
| | 6,056 |
| | 6,376 |
| | 4,957 |
| | 6,376 |
|
| Total branded postpaid customers | 39,065 |
| | 40,082 |
| | 41,161 |
| | 42,519 |
| | 43,538 |
| | 44,646 |
| | 45,720 |
| | 41,161 |
| | 45,720 |
|
Branded prepaid customers (1) | 20,876 |
| | 20,967 |
| | 21,002 |
| | 21,137 |
| | 21,206 |
| | 21,337 |
| | 20,783 |
| | 21,002 |
| | 20,783 |
|
| Total branded customers | 59,941 |
| | 61,049 |
| | 62,163 |
| | 63,656 |
| | 64,744 |
| | 65,983 |
| | 66,503 |
| | 62,163 |
| | 66,503 |
|
Wholesale customers (1) | 14,099 |
| | 14,570 |
| | 15,086 |
| | 15,995 |
| | 16,557 |
| | 17,069 |
| | 17,680 |
| | 15,086 |
| | 17,680 |
|
| Total customers, end of period | 74,040 |
| | 75,619 |
| | 77,249 |
| | 79,651 |
| | 81,301 |
| | 83,052 |
| | 84,183 |
| | 77,249 |
| | 84,183 |
|
| Adjustments to branded prepaid customers | — |
| | — |
| | — |
| | — |
| | — |
| | — |
| | (616 | ) | | — |
| | (616 | ) |
| |
| (1) | On July 18, 2019, we entered into an agreement whereby certain T-Mobile branded prepaid products will now be offered and distributed by a current MVNO partner. As a result, we included a base adjustment to reduce branded prepaid customers by 616,000. Prospectively, new customer activity associated with these products is recorded within wholesale customers. |
|
| | | | | | | | | | | | | | | | | | | | | | | | | | |
| | Quarter | | Nine Months Ended September 30, |
| (in thousands) | Q1 2018 | | Q2 2018 | | Q3 2018 | | Q4 2018 | | Q1 2019 | | Q2 2019 | | Q3 2019 | | 2018 | | 2019 |
| Net customer additions (losses) | | | | | | | | | | | | | | | | | |
| Branded postpaid phone customers | 617 |
| | 686 |
| | 774 |
| | 1,020 |
| | 656 |
| | 710 |
| | 754 |
| | 2,077 |
| | 2,120 |
|
| Branded postpaid other customers | 388 |
| | 331 |
| | 305 |
| | 338 |
| | 363 |
| | 398 |
| | 320 |
| | 1,024 |
| | 1,081 |
|
| Total branded postpaid customers | 1,005 |
| | 1,017 |
| | 1,079 |
| | 1,358 |
| | 1,019 |
| | 1,108 |
| | 1,074 |
| | 3,101 |
| | 3,201 |
|
Branded prepaid customers (1) | 199 |
| | 91 |
| | 35 |
| | 135 |
| | 69 |
| | 131 |
| | 62 |
| | 325 |
| | 262 |
|
| Total branded customers | 1,204 |
| | 1,108 |
| | 1,114 |
| | 1,493 |
| | 1,088 |
| | 1,239 |
| | 1,136 |
| | 3,426 |
| | 3,463 |
|
Wholesale customers (1) | 229 |
| | 471 |
| | 516 |
| | 909 |
| | 562 |
| | 512 |
| | 611 |
| | 1,216 |
| | 1,685 |
|
| Total net customer additions | 1,433 |
| | 1,579 |
| | 1,630 |
| | 2,402 |
| | 1,650 |
| | 1,751 |
| | 1,747 |
| | 4,642 |
| | 5,148 |
|
| |
| (1) | On July 18, 2019, we entered into an agreement whereby certain T-Mobile branded prepaid products will now be offered and distributed by a current MVNO partner. As a result, we included a base adjustment to reduce branded prepaid customers by 616,000. Prospectively, new customer activity associated with these products is recorded within wholesale customers. |
|
| | | | | | | | | | | | | | | | | | | | | | | | | | |
| | Quarter | | Nine Months Ended September 30, |
| | Q1 2018 | | Q2 2018 | | Q3 2018 | | Q4 2018 | | Q1 2019 | | Q2 2019 | | Q3 2019 | | 2018 | | 2019 |
| Branded postpaid phone churn | 1.07 | % | | 0.95 | % | | 1.02 | % | | 0.99 | % | | 0.88 | % | | 0.78 | % | | 0.89 | % | | 1.02 | % | | 0.85 | % |
| Branded prepaid churn | 3.94 | % | | 3.81 | % | | 4.12 | % | | 3.99 | % | | 3.85 | % | | 3.49 | % | | 3.98 | % | | 3.95 | % | | 3.77 | % |
T-Mobile US, Inc.
Supplementary Operating and Financial Data (continued)
(Unaudited)
|
| | | | | | | | | | | | | | | | | |
| | Quarter | | Nine Months Ended September 30, |
| | Q1 2018 | | Q2 2018 | | Q3 2018 | | Q4 2018 | | Q1 2019 | | Q2 2019 | | Q3 2019 | | 2018 | | 2019 |
| Financial Measures | | | | | | | | | | | | | | | | | |
| Service revenues (in millions) | $7,806 | | $7,931 | | $8,066 | | $8,189 | | $8,277 | | $8,426 | | $8,583 | | $23,803 | | $25,286 |
| Total revenues (in millions) | $10,455 | | $10,571 | | $10,839 | | $11,445 | | $11,080 | | $10,979 | | $11,061 | | $31,865 | | $33,120 |
| Net income (in millions) | $671 | | $782 | | $795 | | $640 | | $908 | | $939 | | $870 | | $2,248 | | $2,717 |
| Net income margin | 9% | | 10% | | 10% | | 8% | | 11% | | 11% | | 10% | | 9% | | 11% |
| Adjusted EBITDA (in millions) | $2,956 | | $3,233 | | $3,239 | | $2,970 | | $3,284 | | $3,461 | | $3,396 | | $9,428 | | $10,141 |
| Adjusted EBITDA margin | 38% | | 41% | | 40% | | 36% | | 40% | | 41% | | 40% | | 40% | | 40% |
| Selling, general and administrative (in millions) | $3,164 | | $3,185 | | $3,314 | | $3,498 | | $3,442 | | $3,543 | | $3,498 | | $9,663 | | $10,483 |
| Merger-related costs (in millions) | $— | | $41 | | $53 | | $102 | | $113 | | $222 | | $159 | | $94 | | $494 |
| Selling, general and administrative excluding merger-related costs (in millions) | $3,164 | | $3,144 | | $3,261 | | $3,396 | | $3,329 | | $3,321 | | $3,339 | | $9,569 | | $9,989 |
| Cash purchases of property and equipment including capitalized interest (in millions) | $1,366 | | $1,629 | | $1,362 | | $1,184 | | $1,931 | | $1,789 | | $1,514 | | $4,357 | | $5,234 |
| Capitalized Interest (in millions) | $43 | | $102 | | $101 | | $116 | | $118 | | $125 | | $118 | | $246 | | $361 |
| Cash purchases of property and equipment excluding capitalized interest (in millions) | $1,323 | | $1,527 | | $1,261 | | $1,068 | | $1,813 | | $1,664 | | $1,396 | | $4,111 | | $4,873 |
| Net cash provided by operating activities (in millions) | $770 | | $1,261 | | $914 | | $954 | | $1,392 | | $2,147 | | $1,748 | | $2,945 | | $5,287 |
| Net cash (used in) provided by investing activities (in millions) | $(462) | | $(306) | | $(42) | | $231 | | $(966) | | $(1,615) | | $(657) | | $(810) | | $(3,238) |
| Net cash provided by (used in) financing activities (in millions) | $1,000 | | $(3,267) | | $(758) | | $(311) | | $(190) | | $(866) | | $(543) | | $(3,025) | | $(1,599) |
| Free Cash Flow (in millions) | $668 | | $774 | | $890 | | $1,220 | | $618 | | $1,169 | | $1,134 | | $2,332 | | $2,921 |
| Net cash proceeds from securitization (in millions) | $(150) | | $25 | | $(18) | | $(36) | | $(18) | | $95 | | $(3) | | $(143) | | $74 |
| Operating Metrics | | | | | | | | | | | | | | | | | |
| Branded postpaid phone ARPU | $46.66 | | $46.52 | | $46.17 | | $46.29 | | $46.07 | | $46.10 | | $46.22 | | $46.44 | | $46.13 |
| Branded prepaid ARPU | $38.90 | | $38.48 | | $38.34 | | $38.39 | | $37.65 | | $37.46 | | $38.16 | | $38.57 | | $37.76 |
| Branded postpaid accounts, end of period (in thousands) | 13,237 | | 13,498 | | 13,753 | | 14,015 | | 14,234 | | 14,480 | | 14,734 | | 13,753 | | 14,734 |
| Branded postpaid customers per account | 2.95 | | 2.97 | | 2.99 | | 3.03 | | 3.06 | | 3.08 | | 3.10 | | 2.99 | | 3.10 |
| Device Sales and Leased Devices | | | | | | | | | | | | | | | | | |
| Phones (in millions) | 8.7 | | 7.9 | | 8.1 | | 8.3 | | 7.4 | | 6.5 | | 7.4 | | 24.7 | | 21.3 |
| Branded postpaid upgrade rate | 5% | | 6% | | 6% | | 6% | | 5% | | 5% | | 5% | | 18% | | 15% |
| Device Financing | | | | | | | | | | | | | | | | | |
| Gross EIP financed (in millions) | $1,572 | | $1,705 | | $1,762 | | $2,203 | | $1,742 | | $1,625 | | $1,535 | | $5,039 | | $4,902 |
| EIP billings (in millions) | $1,698 | | $1,585 | | $1,601 | | $1,664 | | $1,663 | | $1,645 | | $1,688 | | $4,884 | | $4,996 |
| EIP receivables, net (in millions) | $3,515 | | $3,530 | | $3,589 | | $4,085 | | $4,128 | | $4,050 | | $3,894 | | $3,589 | | $3,894 |
| Lease revenues (in millions) | $171 | | $177 | | $176 | | $168 | | $161 | | $143 | | $142 | | $524 | | $446 |
| Leased devices transferred from inventory to property and equipment (in millions) | $304 | | $280 | | $229 | | $198 | | $147 | | $167 | | $298 | | $813 | | $612 |
| Returned leased devices transferred from property and equipment to inventory (in millions) | $(82) | | $(90) | | $(74) | | $(80) | | $(57) | | $(67) | | $(65) | | $(246) | | $(189) |
| Customer Quality | | | | | | | | | | | | | | | | | |
| EIP receivables classified as prime | 43% | | 42% | | 42% | | 44% | | 46% | | 50% | | 51% | | 42% | | 51% |
| EIP receivables classified as prime (including EIP receivables sold) | 53% | | 52% | | 52% | | 53% | | 52% | | 52% | | 52% | | 52% | | 52% |
| Total bad debt expense and losses from sales of receivables (in millions) | $106 | | $102 | | $128 | | $118 | | $108 | | $99 | | $102 | | $336 | | $309 |
T-Mobile US, Inc.
Reconciliation of Non-GAAP Financial Measures to GAAP Financial Measures
(Unaudited)
This Investor Factbook includes non-GAAP financial measures. The non-GAAP financial measures should be considered in addition to, but not as a substitute for, the information provided in accordance with GAAP. Reconciliations for the non-GAAP financial measures to the most directly comparable GAAP financial measures are provided below. T-Mobile is not able to forecast net income on a forward-looking basis without unreasonable efforts due to the high variability and difficulty in predicting certain items that affect GAAP net income including, but not limited to, income tax expense, stock-based compensation expense and interest expense. Adjusted EBITDA should not be used to predict net income as the difference between the two measures is variable.
Adjusted EBITDA is reconciled to net income as follows:
|
| | | | | | | | | | | | | | | | | | | | | | | | | | | | | | | | | | | |
| | Quarter | | Nine Months Ended September 30, |
| (in millions) | Q1 2018 | | Q2 2018 | | Q3 2018 | | Q4 2018 | | Q1 2019 | | Q2 2019 | | Q3 2019 | | 2018 | | 2019 |
| Net income | $ | 671 |
| | $ | 782 |
| | $ | 795 |
| | $ | 640 |
| | $ | 908 |
| | $ | 939 |
| | $ | 870 |
| | $ | 2,248 |
| | $ | 2,717 |
|
| Adjustments: | | | | | | | | | | | | | | | | | |
| Interest expense | 251 |
| | 196 |
| | 194 |
| | 194 |
| | 179 |
| | 182 |
| | 184 |
| | 641 |
| | 545 |
|
| Interest expense to affiliates | 166 |
| | 128 |
| | 124 |
| | 104 |
| | 109 |
| | 101 |
| | 100 |
| | 418 |
| | 310 |
|
| Interest income | (6 | ) | | (6 | ) | | (5 | ) | | (2 | ) | | (8 | ) | | (4 | ) | | (5 | ) | | (17 | ) | | (17 | ) |
| Other (income) expense, net | (10 | ) | | 64 |
| | (3 | ) | | 3 |
| | (7 | ) | | 22 |
| | (3 | ) | | 51 |
| | 12 |
|
| Income tax expense | 210 |
| | 286 |
| | 335 |
| | 198 |
| | 295 |
| | 301 |
| | 325 |
| | 831 |
| | 921 |
|
| Operating income | 1,282 |
| | 1,450 |
| | 1,440 |
| | 1,137 |
| | 1,476 |
| | 1,541 |
| | 1,471 |
| | 4,172 |
| | 4,488 |
|
| Depreciation and amortization | 1,575 |
| | 1,634 |
| | 1,637 |
| | 1,640 |
| | 1,600 |
| | 1,585 |
| | 1,655 |
| | 4,846 |
| | 4,840 |
|
Stock-based compensation (1) | 96 |
| | 106 |
| | 102 |
| | 85 |
| | 93 |
| | 111 |
| | 108 |
| | 304 |
| | 312 |
|
| Merger-related costs | — |
| | 41 |
| | 53 |
| | 102 |
| | 113 |
| | 222 |
| | 159 |
| | 94 |
| | 494 |
|
Other, net (2) | 3 |
| | 2 |
| | 7 |
| | 6 |
| | 2 |
| | 2 |
| | 3 |
| | 12 |
| | 7 |
|
| Adjusted EBITDA | $ | 2,956 |
| | $ | 3,233 |
| | $ | 3,239 |
| | $ | 2,970 |
| | $ | 3,284 |
| | $ | 3,461 |
| | $ | 3,396 |
| | $ | 9,428 |
| | $ | 10,141 |
|
| |
| (1) | Stock-based compensation includes payroll tax impacts and may not agree to stock-based compensation expense in the Condensed Consolidated Financial Statements. Additionally, certain stock-based compensation expenses associated with the Transactions have been included in Merger-related costs. |
| |
| (2) | Other, net may not agree to the Condensed Consolidated Statements of Comprehensive Income primarily due to certain non-routine operating activities, such as other special items that would not be expected to reoccur or are not reflective of T-Mobile’s ongoing operating performance, and are therefore excluded in Adjusted EBITDA. |
T-Mobile US, Inc.
Reconciliation of Non-GAAP Financial Measures to GAAP Financial Measures (continued)
(Unaudited)
Net debt (excluding tower obligations)(1) to last twelve months Net income and Adjusted EBITDA ratios are calculated as follows:
|
| | | | | | | | | | | | | | | | | | | | | | | | | | | |
| (in millions, except net debt ratios) | Mar 31,
2018 | | Jun 30,
2018 | | Sep 30,
2018 | | Dec 31,
2018 | | Mar 31,
2019 | | Jun 30,
2019 | | Sep 30,
2019 |
| Short-term debt | $ | 3,320 |
| | $ | 1,004 |
| | $ | 783 |
| | $ | 841 |
| | $ | 250 |
| | $ | 300 |
| | $ | 475 |
|
| Short-term debt to affiliates | 445 |
| | 320 |
| | — |
| | — |
| | 598 |
| | — |
| | — |
|
| Short-term financing lease liabilities | | | | | | | | | 911 |
| | 963 |
| | 1,013 |
|
| Long-term debt | 12,127 |
| | 12,065 |
| | 11,993 |
| | 12,124 |
| | 10,952 |
| | 10,954 |
| | 10,956 |
|
| Long-term debt to affiliates | 14,586 |
| | 14,581 |
| | 14,581 |
| | 14,582 |
| | 13,985 |
| | 13,985 |
| | 13,986 |
|
| Financing lease liabilities | | | | | | | | | 1,224 |
| | 1,314 |
| | 1,440 |
|
| Less: Cash and cash equivalents | (2,527 | ) | | (215 | ) | | (329 | ) | | (1,203 | ) | | (1,439 | ) | | (1,105 | ) | | (1,653 | ) |
| Net debt (excluding tower obligations) | $ | 27,951 |
| | $ | 27,755 |
| | $ | 27,028 |
| | $ | 26,344 |
| | $ | 26,481 |
| | $ | 26,411 |
| | $ | 26,217 |
|
| Divided by: Last twelve months Net income | $ | 4,509 |
| | $ | 4,710 |
| | $ | 4,955 |
| | $ | 2,888 |
| | $ | 3,125 |
| | $ | 3,282 |
| | $ | 3,357 |
|
| Net debt (excluding tower obligations) to last twelve months Net income Ratio | 6.2 |
| | 5.9 |
| | 5.5 |
| | 9.1 |
| | 8.5 |
| | 8.0 |
| | 7.8 |
|
| Divided by: Last twelve months Adjusted EBITDA | $ | 11,501 |
| | $ | 11,722 |
| | $ | 12,139 |
| | $ | 12,398 |
| | $ | 12,726 |
| | $ | 12,954 |
| | $ | 13,111 |
|
| Net debt (excluding tower obligations) to last twelve months Adjusted EBITDA Ratio | 2.4 |
| | 2.4 |
| | 2.2 |
| | 2.1 |
| | 2.1 |
| | 2.0 |
| | 2.0 |
|
| |
| (1) | In Q1 2019, the adoption of the new lease accounting standard resulted in a reclassification of capital lease liabilities previously included in Short-term debt and Long-term debt to Short-term financing lease liabilities and Financing lease liabilities in our Condensed Consolidated Balance Sheet. In Q1 2019, we redefined Net debt (excluding tower obligations) to reflect the above changes in classification and present Net debt (excluding tower obligations) on a consistent basis for investor transparency. The effects of this change are applied prospectively, consistent with the adoption of the standard. See Note 1 – Summary of Significant Accounting Policies in the Q3 2019 10-Q for additional details. |
Free Cash Flow is calculated as follows
|
| | | | | | | | | | | | | | | | | | | | | | | | | | | | | | | | | | | |
| | Quarter | | Nine Months Ended September 30, |
| (in millions) | Q1 2018 | | Q2 2018 | | Q3 2018 | | Q4 2018 | | Q1 2019 | | Q2 2019 | | Q3 2019 | | 2018 | | 2019 |
| Net cash provided by operating activities | $ | 770 |
| | $ | 1,261 |
| | $ | 914 |
| | $ | 954 |
| | $ | 1,392 |
| | $ | 2,147 |
| | $ | 1,748 |
| | $ | 2,945 |
| | $ | 5,287 |
|
| Cash purchases of property and equipment | (1,366 | ) | | (1,629 | ) | | (1,362 | ) | | (1,184 | ) | | (1,931 | ) | | (1,789 | ) | | (1,514 | ) | | (4,357 | ) | | (5,234 | ) |
| Proceeds related to beneficial interests in securitization transactions | 1,295 |
| | 1,323 |
| | 1,338 |
| | 1,450 |
| | 1,157 |
| | 839 |
| | 900 |
| | 3,956 |
| | 2,896 |
|
| Cash payments for debt prepayment or debt extinguishment costs | (31 | ) | | (181 | ) | | — |
| | — |
| | — |
| | (28 | ) | | — |
| | (212 | ) | | (28 | ) |
| Free Cash Flow | $ | 668 |
| | $ | 774 |
| | $ | 890 |
| | $ | 1,220 |
| | $ | 618 |
| | $ | 1,169 |
| | $ | 1,134 |
| | $ | 2,332 |
| | $ | 2,921 |
|
| Net cash (used in) provided by investing activities | $ | (462 | ) | | $ | (306 | ) | | $ | (42 | ) | | $ | 231 |
| | $ | (966 | ) | | $ | (1,615 | ) | | $ | (657 | ) | | $ | (810 | ) | | $ | (3,238 | ) |
| Net cash provided by (used in) financing activities | $ | 1,000 |
| | $ | (3,267 | ) | | $ | (758 | ) | | $ | (311 | ) | | $ | (190 | ) | | $ | (866 | ) | | $ | (543 | ) | | $ | (3,025 | ) | | $ | (1,599 | ) |
Free Cash Flow three-year CAGR(1) is calculated as follows:
|
| | | | | | | | | | | | | | | | | |
| | FY | | FY | | |
| (in millions, except CAGR Range) | 2016 | | 2019 Guidance Range | | CAGR Range |
| Net cash provided by operating activities | $ | 2,779 |
| | $ | 6,950 |
| | $ | 7,200 |
| | 36 | % | | 37 | % |
| Cash purchases of property and equipment | (4,702 | ) | | (6,350 | ) | | (6,450 | ) | | 11 | % | | 11 | % |
| Proceeds related to beneficial interests in securitization transactions | 3,356 |
| | 3,900 |
| | 3,900 |
| | | | |
| Cash payments for debt prepayment or debt extinguishment costs | — |
| | — |
| | (50 | ) | | | | |
| Free Cash Flow | $ | 1,433 |
| | $ | 4,500 |
| | $ | 4,600 |
| | 46 | % | | 48 | % |
(1) The Net cash provided by operating activities and Free Cash Flow three-year CAGR figures exclude payments for merger-related costs.
T-Mobile US, Inc.
Reconciliation of Operating Measures to Service Revenues
(Unaudited)
The following table illustrates the calculation of our operating measure ARPU and reconciles this measure to the related service revenues:
|
| | | | | | | | | | | | | | | | | | | | | | | | | | | | | | | | | | | |
| (in millions, except average number of customers and ARPU) | Quarter | | Nine Months Ended September 30, |
| Q1 2018 | | Q2 2018 | | Q3 2018 | | Q4 2018 | | Q1 2019 | | Q2 2019 | | Q3 2019 | | 2018 | | 2019 |
| Calculation of Branded Postpaid Phone ARPU | | | | | | | | | | | | | | | | | |
| Branded postpaid service revenues | $ | 5,070 |
| | $ | 5,164 |
| | $ | 5,244 |
| | $ | 5,384 |
| | $ | 5,493 |
| | $ | 5,613 |
| | $ | 5,746 |
| | $ | 15,478 |
| | $ | 16,852 |
|
| Less: Branded postpaid other revenues | (259 | ) | | (272 | ) | | (289 | ) | | (297 | ) | | (310 | ) | | (326 | ) | | (346 | ) | | (820 | ) | | (982 | ) |
| Branded postpaid phone service revenues | $ | 4,811 |
| | $ | 4,892 |
| | $ | 4,955 |
| | $ | 5,087 |
| | $ | 5,183 |
| | $ | 5,287 |
| | $ | 5,400 |
| | $ | 14,658 |
| | $ | 15,870 |
|
| Divided by: Average number of branded postpaid phone customers (in thousands) and number of months in period | 34,371 |
| | 35,051 |
| | 35,779 |
| | 36,631 |
| | 37,504 |
| | 38,226 |
| | 38,944 |
| | 35,067 |
| | 38,225 |
|
| Branded postpaid phone ARPU | $ | 46.66 |
| | $ | 46.52 |
| | $ | 46.17 |
| | $ | 46.29 |
| | $ | 46.07 |
| | $ | 46.10 |
| | $ | 46.22 |
| | $ | 46.44 |
| | $ | 46.13 |
|
| Calculation of Branded Prepaid ARPU | | | | | | | | | | | | | | | | | |
| Branded prepaid service revenues | $ | 2,402 |
| | $ | 2,402 |
| | $ | 2,395 |
| | $ | 2,399 |
| | $ | 2,386 |
| | $ | 2,379 |
| | $ | 2,385 |
| | $ | 7,199 |
| | $ | 7,150 |
|
| Divided by: Average number of branded prepaid customers (in thousands) and number of months in period | 20,583 |
| | 20,806 |
| | 20,820 |
| | 20,833 |
| | 21,122 |
| | 21,169 |
| | 20,837 |
| | 20,737 |
| | 21,043 |
|
| Branded prepaid ARPU | $ | 38.90 |
| | $ | 38.48 |
| | $ | 38.34 |
| | $ | 38.39 |
| | $ | 37.65 |
| | $ | 37.46 |
| | $ | 38.16 |
| | $ | 38.57 |
| | $ | 37.76 |
|
Definitions of Terms
Operating and financial measures are utilized by T-Mobile’s management to evaluate its operating performance and, in certain cases, its ability to meet liquidity requirements. Although companies in the wireless industry may not define measures in precisely the same way, T-Mobile believes the measures facilitate key operating performance comparisons with other companies in the wireless industry to provide management, investors and analysts with useful information to assess and evaluate past performance and assist in forecasting future performance.
| |
| 1. | Customer - SIM number with a unique T-Mobile mobile identifier which is associated with an account that generates revenue. Branded customers generally include customers that are qualified either for postpaid service, where they generally pay after incurring service, or prepaid service, where they generally pay in advance. Wholesale customers include Machine-to-Machine (M2M) and Mobile Virtual Network Operator (MVNO) customers that operate on T-Mobile’s network, but are managed by wholesale partners. |
| |
| 2. | Churn - Number of customers whose service was disconnected as a percentage of the average number of customers during the specified period. The number of customers whose service was disconnected is presented net of customers that subsequently have their service restored within a certain period of time. |
| |
| 3. | Customers per account - The number of branded postpaid customers as of the end of the period divided by the number of branded postpaid accounts as of the end of the period. An account may include branded postpaid phone, mobile broadband, and DIGITS customers. |
| |
| 4. | Average Revenue Per User (ARPU) - Average monthly service revenue earned from customers. Service revenues for the specified period divided by the average customers during the period, further divided by the number of months in the period. |
Branded postpaid phone ARPU excludes branded postpaid other customers and related revenues.
Service revenues - Branded postpaid, including handset insurance, branded prepaid, wholesale, and roaming and other service revenues.
| |
| 5. | Cost of services - Costs directly attributable to providing wireless service through the operation of T-Mobile’s network, including direct switch and cell site costs, such as rent, network access and transport costs, utilities, maintenance, associated labor costs, long distance costs, regulatory program costs, roaming fees paid to other carriers and data content costs. |
Cost of equipment sales - Costs of devices and accessories sold to customers and dealers, device costs to fulfill insurance and warranty claims, write-downs of inventory related to shrinkage and obsolescence, and shipping and handling costs.
Selling, general and administrative expenses - Costs not directly attributable to providing wireless service for the operation of sales, customer care and corporate activities. These include all commissions paid to dealers and retail employees for activations and upgrades, labor and facilities costs associated with retail sales force and administrative space, marketing and promotional costs, customer support and billing, bad debt expense and administrative support activities.
| |
| 6. | Net income margin - Margin % calculated as net income divided by service revenues. |
| |
| 7. | Adjusted EBITDA - Earnings before interest expense, net of interest income, income tax expense, depreciation and amortization expense, non-cash stock-based compensation and certain expenses not reflective of T-Mobile’s ongoing operating performance such as merger-related costs. Adjusted EBITDA margin represents Adjusted EBITDA divided by service revenues. Adjusted EBITDA is a non-GAAP financial measure utilized by T-Mobile’s management to monitor the financial performance of our operations. T-Mobile uses Adjusted EBITDA internally as a measure to evaluate and compensate its personnel and management for their performance, and as a benchmark to evaluate T-Mobile’s operating performance in comparison to its competitors. Management believes analysts and investors use Adjusted EBITDA as a supplemental measure to evaluate overall operating performance and facilitate comparisons with other wireless communications companies because it is indicative of T-Mobile’s ongoing operating performance and trends by excluding the impact of interest expense from financing, non-cash depreciation and amortization from capital investments, non-cash stock-based compensation, network decommissioning costs and costs related to the Transactions, as they are not indicative of T-Mobile’s ongoing operating performance, as well as certain other nonrecurring income and expenses. Adjusted EBITDA has limitations as an analytical tool and should not be considered in isolation or as a substitute for income from operations, net income or any other measure of financial performance reported in accordance with U.S. Generally Accepted Accounting Principles (“GAAP”). |
| |
| 8. | Adjusted EBITDA Margin - Margin % calculated as Adjusted EBITDA divided by service revenues. |
| |
| 9. | Smartphones - UMTS/HSPA/HSPA+ 21/HSPA+ 42/4G LTE enabled converged devices, which integrate voice and data services. |
| |
| 10. | Free Cash Flow - Net cash provided by operating activities less cash purchases of property and equipment, including proceeds related to beneficial interests in securitization transactions and less cash payments for debt prepayment or debt extinguishment costs. Free Cash Flow is utilized by T-Mobile’s management, investors, and analysts to evaluate cash available to pay debt and provide further investment in the business. The reconciliation of Free Cash Flow to net cash provided by operating activities is detailed in the Reconciliation of Non-GAAP Financial Measures to GAAP Financial Measures schedule. In Q1 2018, we made an accounting change to reduce net cash provided by operating activities by the deferred purchase price less payments for debt prepayment or debt extinguishment costs, as a result of the adoption of ASU 2016-15. Free Cash Flow has been redefined to reflect the changes in classification and present cash flows on a consistent basis for investor transparency. |
| |
| 11. | Net debt - Short-term debt, short-term debt to affiliates, long-term debt, and long-term debt (excluding tower obligations) to affiliates, short-term financing lease liabilities and financing lease liabilities, less cash and cash equivalents. Leases classified as capital leases under the previous standard are included in Financing Lease liabilities within our Condensed Consolidated Balance Sheet under the new lease standard. The liabilities related to these leases are included in the Net debt calculation under the previous and new lease standards. |
Cautionary Statement Regarding Forward-Looking Statements
This communication includes forward-looking statements within the meaning of the Private Securities Litigation Reform Act of 1995. All statements other than statements of historical fact, including information concerning T-Mobile US, Inc.’s future results of operations, are forward-looking statements. These forward-looking statements are generally identified by the words “anticipate,” “believe,” “estimate,” “expect,” “intend,” “may,” “could,” or similar expressions. Forward-looking statements are based on current expectations and assumptions, which are subject to risks and uncertainties and may cause actual results to differ materially from the forward-looking statements. Important factors that could affect future results and cause those results to differ materially from those expressed in the forward-looking statements include, among others, the following: the failure to obtain, or delays in obtaining, required regulatory approvals for the merger (the “Merger”) with Sprint Corporation (“Sprint”), pursuant to the Business Combination Agreement with Sprint and other parties therein (as amended, the “Business Combination Agreement”) and the other transactions contemplated by the Business Combination Agreement (collectively, the “Transactions”), risks associated with the actions and conditions we have agreed to in connection with such approvals, and the risk that such approvals may result in the imposition of additional conditions that, if accepted by the parties, could adversely affect the combined company or the expected benefits of the Transactions, or the failure to satisfy any of the other conditions to the Transactions on a timely basis or at all; the occurrence of events that may give rise to a right of one or both of the parties to terminate the Business Combination Agreement; adverse effects on the market price of our common stock or on our operating results because of a failure to complete the Merger in the anticipated timeframe, on the anticipated terms or at all; inability to obtain the financing contemplated to be obtained in connection with the Transactions on the expected terms or timing or at all; the ability of us, Sprint and the combined company to make payments on debt or to repay existing or future indebtedness when due or to comply with the covenants contained therein; adverse changes in the ratings of our or Sprint’s debt securities or adverse conditions in the credit markets; negative effects of the announcement, pendency or consummation of the Transactions on the market price of our common stock and on our or Sprint’s operating results, including as a result of changes in key customer, supplier, employee or other business relationships; significant costs related to the Transactions, including financing costs, and unknown liabilities of Sprint or that may arise; failure to realize the expected benefits and synergies of the Transactions in the expected timeframes, in part or at all; costs or difficulties related to the integration of Sprint’s network and operations into our network and operations, including intellectual property and communications systems, administrative and information technology infrastructure and accounting, financial reporting and internal control systems, and the alignment of the two companies’ guidelines and practices; costs or difficulties related to the completion of the divestiture of Sprint’s prepaid wireless businesses to DISH Network Corporation and the satisfaction of any related government commitments to such divestiture; the risk of litigation or regulatory actions related to the Transactions, including the antitrust litigation related to the Transactions brought by the attorneys general of certain states and the District of Columbia; the inability of us, Sprint or the combined company to retain and hire key personnel; the risk that certain contractual restrictions contained in the Business Combination Agreement during the pendency of the Transactions could adversely affect our or Sprint’s ability to pursue business opportunities or strategic transactions; adverse economic, political or market conditions in the U.S. and international markets; competition, industry consolidation, and changes in the market for wireless services, which could negatively affect our ability to attract and retain customers; the effects of any future merger, investment, or acquisition involving us, as well as the effects of mergers, investments, or acquisitions in the technology, media and telecommunications industry; challenges in implementing our business strategies or funding our operations, including payment for additional spectrum or network upgrades; the possibility that we may be unable to renew our spectrum licenses on attractive terms or acquire new spectrum licenses at reasonable costs and terms; difficulties in managing growth in wireless data services, including network quality; material changes in available technology and the effects of such changes, including product substitutions and deployment costs and performance; the timing, scope and financial impact of our deployment of advanced network and business technologies; the impact on our networks and business from major technology equipment failures; inability to implement and maintain effective cyber security measures over critical business systems; breaches of our and/or our third-party vendors’ networks, information technology and data security, resulting in unauthorized access to customer confidential information; natural disasters, terrorist attacks or similar incidents; unfavorable outcomes of existing or future litigation; any changes in the regulatory environments in which we operate, including any increase in restrictions on the ability to operate our networks and changes in data privacy laws; any disruption or failure of our third parties’ or key suppliers’ provisioning of products or services; material adverse changes in labor matters, including labor campaigns, negotiations or additional organizing activity, and any resulting financial, operational and/or reputational impact; changes in accounting assumptions that regulatory agencies, including the Securities and Exchange Commission (“SEC”), may require, which could result in an impact on earnings; changes in tax laws, regulations and existing standards and the resolution of disputes with any taxing jurisdictions; the possibility that the reset process under our trademark license results in changes to the royalty rates for our trademarks; the possibility that we may be unable to adequately protect our intellectual property rights or be accused of infringing the intellectual property rights of others; our business, investor confidence in our financial results and stock price may be adversely affected if our internal controls are not effective; the occurrence of high fraud rates related to device financing, credit card, dealers, or subscriptions; and interests of a majority stockholder may differ from the interests of other stockholders. Given these risks and uncertainties, readers are cautioned not to place undue reliance on such forward-looking statements. We undertake no obligation to revise or publicly release the results of any revision to these forward-looking statements, except as required by law.
Important Additional Information
In connection with the Transactions, T-Mobile US, Inc. (“T-Mobile”) has filed a registration statement on Form S-4 (File No. 333-226435), which contains a joint consent solicitation statement of T-Mobile and Sprint Corporation (“Sprint”), that also constitutes a prospectus of T-Mobile (the “joint consent solicitation statement/prospectus”), and each party will file other documents regarding the Transactions with the SEC. The registration statement on Form S-4 was declared effective by the SEC on October 29, 2018, and T-Mobile and Sprint commenced mailing the joint consent solicitation statement/prospectus to their respective stockholders on October 29, 2018. INVESTORS AND SECURITY HOLDERS ARE URGED TO READ THE JOINT CONSENT SOLICITATION STATEMENT/PROSPECTUS AND OTHER RELEVANT DOCUMENTS FILED WITH THE SEC WHEN THEY BECOME AVAILABLE BECAUSE THEY WILL CONTAIN IMPORTANT INFORMATION. Investors and security holders may obtain these documents free of charge from the SEC’s website or from T-Mobile or Sprint. The documents filed by T-Mobile may be obtained free of charge at T-Mobile’s website, at www.t-mobile.com, or at the SEC’s website, at www.sec.gov, or from T-Mobile by requesting them by mail at T-Mobile US, Inc., Investor Relations, 1 Park Avenue, 14th Floor, New York, NY 10016, or by telephone at 212-358-3210. The documents filed by Sprint may be obtained free of charge at Sprint’s website, at www.sprint.com, or at the SEC’s website, at www.sec.gov, or from Sprint by requesting them by mail at Sprint Corporation, Shareholder Relations, 6200 Sprint Parkway, Mailstop KSOPHF0302-3B679, Overland Park, Kansas 66251, or by telephone at 913-794-1091.
No Offer or Solicitation
This communication shall not constitute an offer to sell or the solicitation of an offer to buy any securities, nor shall there be any sale of securities in any jurisdiction in which such offer, solicitation or sale would be unlawful prior to registration or qualification under the securities laws of any such jurisdiction. No offering of securities shall be made except by means of a prospectus meeting the requirements of Section 10 of the U.S. Securities Act of 1933, as amended.
About T-Mobile US, Inc.
As America’s Un-carrier, T-Mobile US, Inc. (NASDAQ: TMUS) is redefining the way consumers and businesses buy wireless services through leading product and service innovation. Our advanced nationwide 4G LTE network delivers outstanding wireless experiences to 84.2 million customers who are unwilling to compromise on quality and value. Based in Bellevue, Washington, T-Mobile US provides services through its subsidiaries and operates its flagship brands, T-Mobile and Metro by T-Mobile. For more information, please visit http://www.T-Mobile.com or join the conversation on Twitter using $TMUS.