EXHIBIT 99.2
| | | | | | | | |
| | Highlights |
| | Customer Metrics |
| | Financial Metrics |
| | Capital Structure |
| | 5G Network Leadership |
| | Merger & Integration |
| | Guidance |
| | Contacts |
| | Financial and Operational Tables |
Unless otherwise noted, historical results for T-Mobile from the close of the merger (“Merger”) with Sprint Corporation (“Sprint”) on April 1, 2020 reflect the Merger transactions and are inclusive of the results and operations of Sprint, while historical results prior to April 1, 2020 do not reflect the Merger transactions and are inclusive of the results and operations of stand-alone T-Mobile only. As such, the year-over-year changes may not be meaningful as further detailed in this Investor Factbook.
T-Mobile Caps Best Year Ever in 2020 with Strong Q4 Results, Is the Only National Wireless Provider to Beat Expectations on BOTH Customer Growth and Profitability
Industry-Leading Customer Growth
•Total net additions of 1.7 million in Q4 2020, best in industry — 5.6 million in full-year 2020, best in industry and highest in four years
•Postpaid net additions of 1.6 million in Q4 2020, best in industry — 5.5 million in full-year 2020, best in industry and most in company history
•Postpaid phone net additions of 824 thousand in Q4 2020, best in industry — 2.2 million in full-year 2020, best in industry
Strong Financial Results
•Total revenues of $20.3 billion in Q4 2020 — $68.4 billion in full-year 2020
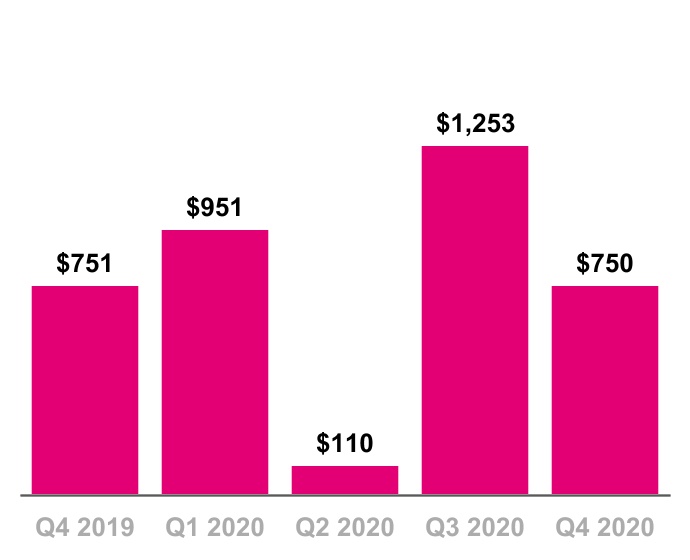
•Net income of $750 million in Q4 2020 — $3.1 billion in full-year 2020
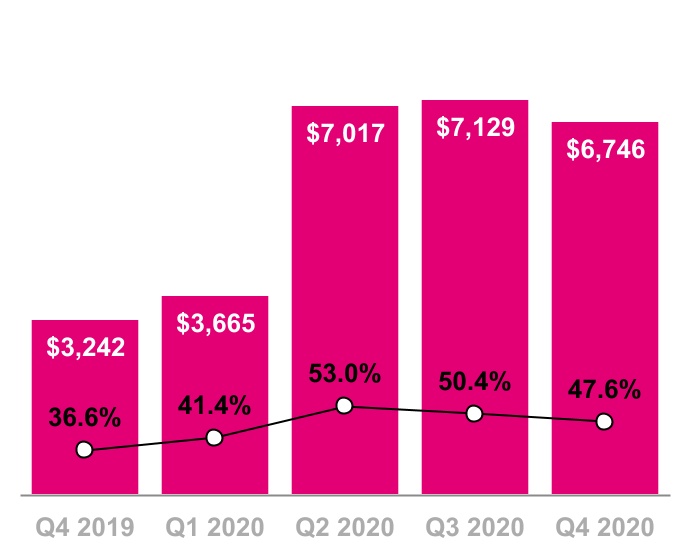
•Adjusted EBITDA(1) of $6.7 billion in Q4 2020 — $24.6 billion in full-year 2020
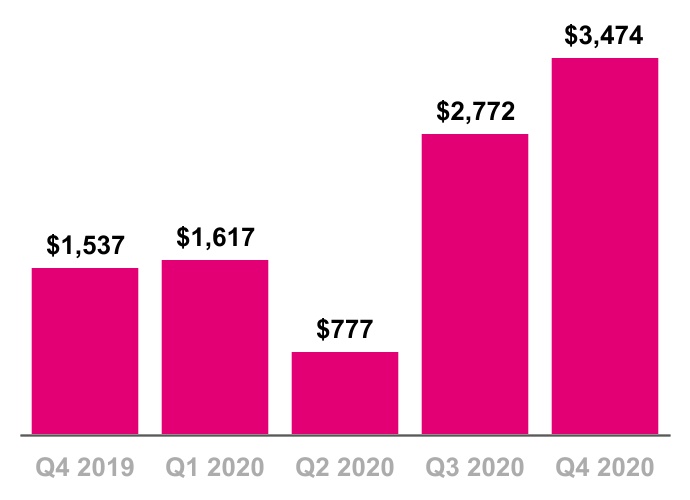
•Net cash provided by operating activities of $3.5 billion in Q4 2020 — $8.6 billion in full-year 2020
•Free Cash Flow, excluding gross payments for the settlement of interest rate swaps(1) of $476 million in Q4 2020 — $3.0 billion in full-year 2020
Merger Synergies and Customer Migrations Ahead of Schedule
•Delivered $1.3 billion of synergies in full-year 2020, exceeding guidance
•25 percent of Sprint postpaid customer traffic has already been moved over to the T-Mobile network and more than 4 million customer network migrations have been completed
Largest 5G Network in America is Now the Fastest Too
•Extended Range 5G covers 280 million people across 1.6 million square miles, nearly 4x more than Verizon and nearly 2.5x more than AT&T
•Ultra Capacity 5G covers 106 million people, over 50x more than Verizon's 5G Ultra Wideband, and expect to cover 200 million people nationwide by the end of 2021
•Fastest 5G speeds based on recent data from Opensignal and umlaut (formerly P3)
Strong 2021 Outlook and Analyst Day Coming After Auction 107
•Expect growth in postpaid customers, Core Adjusted EBITDA(1), Net cash provided by operating activities, and Free Cash Flow(1) in 2021
•Updated merger synergies, medium and long-term guidance, and a strategic overview of the business to be provided at Analyst Day following the expected end of the FCC quiet period for Auction 107
| | | | | | | | | | | |
| | | |
| | “These results show that we’re pulling way ahead of the pack on what matters - overall 5G network performance - and executing to stay ahead. And customers are noticing. 2020 was quite simply our best year yet, with our highest EVER total postpaid net additions of 5.5 million. Our team delivered - leading the industry on customer growth, while being the ONLY major player to grow profitability as well, with our synergy-backed business model. The best team, the best assets, the best 5G network. We’re positioned to create enormous value. I like the hand we’re holding!” | |
| | Mike Sievert, CEO | |
(1)Adjusted EBITDA, Core Adjusted EBITDA and Free Cash Flow, excluding gross payments for the settlement of interest rate swaps, are non-GAAP financial measures. These non-GAAP financial measures should be considered in addition to, but not as a substitute for, the information provided in accordance with GAAP. Reconciliations for these non-GAAP financial measures to the most directly comparable GAAP financial measures, to the extent applicable, are provided in the Reconciliation of Non-GAAP Financial Measures to GAAP Financial Measures tables. We are not able to forecast Net income on a forward-looking basis without unreasonable efforts due to the high variability and difficulty in predicting certain items that affect Net income including, but not limited to, Income tax expense, stock-based compensation expense and Interest expense. Core Adjusted EBITDA should not be used to predict Net income as the difference between the two measures is variable.
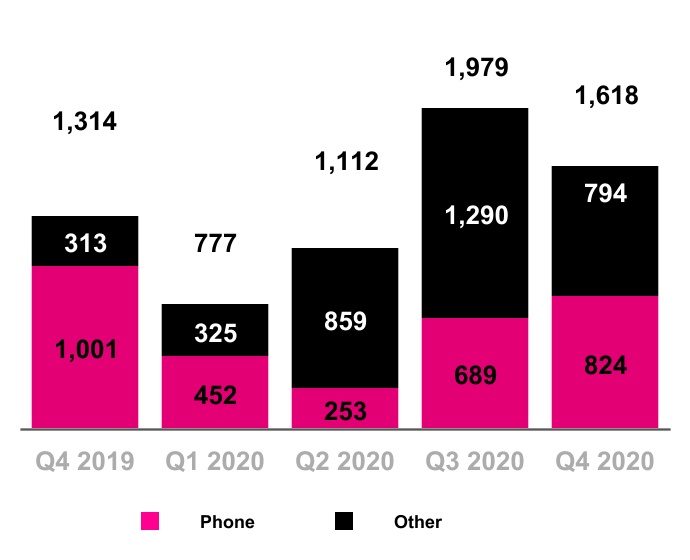
Total Postpaid Net Additions
(in thousands)
Postpaid phone net customer additions were 824 thousand in Q4 2020, compared to 689 thousand in Q3 2020 and 1.0 million in Q4 2019.
▪Sequentially, the increase was primarily due to higher gross customer additions driven by seasonality and promotions, partially offset by a seasonal increase in churn.
▪Year-over-year, the decrease was primarily due to higher churn from customers acquired in the Merger, in addition to lower switching activity in the industry resulting from reduced store traffic arising from the COVID-19 pandemic (the “Pandemic”).
Postpaid other net customer additions were 794 thousand in Q4 2020, compared to 1.3 million in Q3 2020 and 313 thousand in Q4 2019.
▪Sequentially, the decrease was primarily due to lower growth in the public and educational sector compared to Q3 2020.
▪Year-over-year, the increase was primarily due to higher gross additions in the public and educational sector.
Postpaid net customer additions were 1.6 million in Q4 2020, compared to 2.0 million in Q3 2020 and 1.3 million in Q4 2019.
The postpaid upgrade rate was approximately 5.7% in Q4 2020, compared to 4.3% in Q3 2020 and 5.6% in Q4 2019.
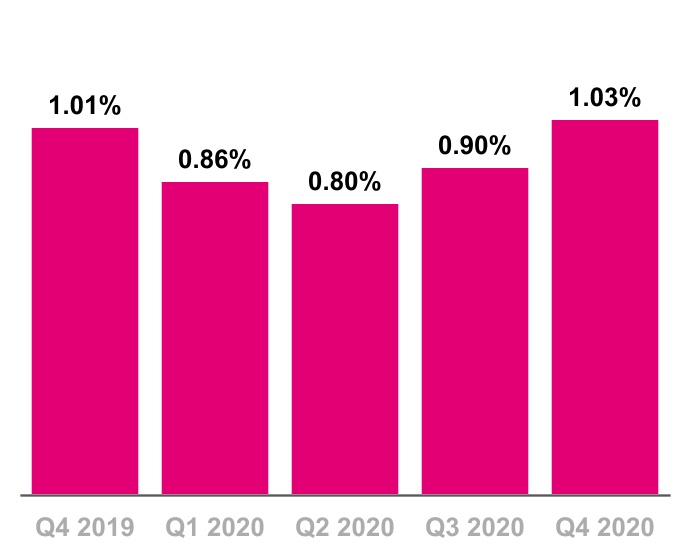
Postpaid phone churn was 1.03% in Q4 2020, up 13 basis points from 0.90% in Q3 2020 and essentially flat compared to 1.01% in Q4 2019.
▪Sequentially, the increase was primarily due to seasonally higher switching activity.
▪Year-over-year, postpaid phone churn was essentially flat, as an increase in churn from the inclusion of the customers acquired in the Merger was offset by lower switching activity in the industry arising from the Pandemic.
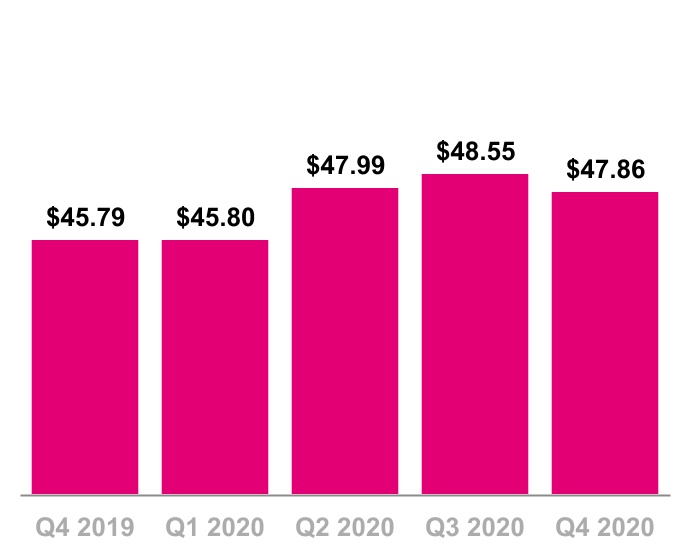
Postpaid phone ARPU was $47.86 in Q4 2020, down 1.4% from $48.55 in Q3 2020 and up 4.5% from $45.79 in Q4 2019.
▪Sequentially, the decrease was primarily due to a seasonal increase in our promotions and an increase in average customers per account.
▪Year-over-year, the increase was primarily due to the net impact of higher ARPU customers acquired in the Merger and higher premium service revenues, partially offset by an increase in our promotional activities.
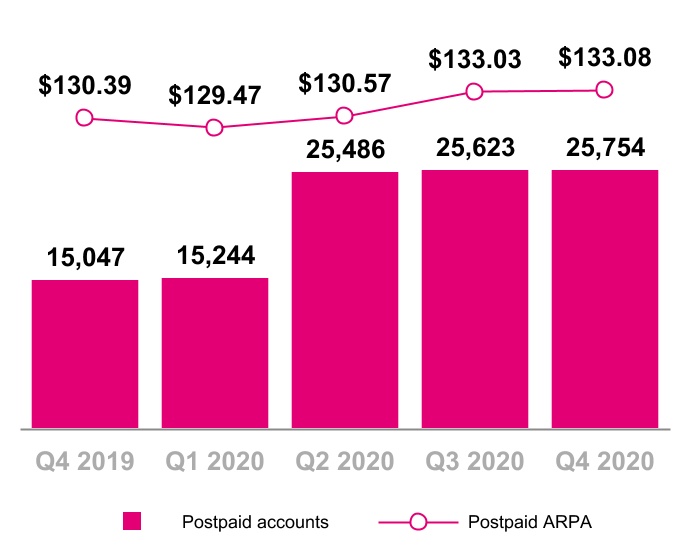
Total postpaid accounts were 25.8 million at the end of Q4 2020, compared to 25.6 million at the end of Q3 2020 and 15.0 million at the end of Q4 2019.
Postpaid ARPA was $133.08 in Q4 2020, essentially flat compared to $133.03 in Q3 2020 and up 2.1% compared to $130.39 in Q4 2019.
▪Sequentially, postpaid ARPA was essentially flat as an increase in average customers per account was offset by a seasonal increase in our promotional activities.
▪Year-over-year, the increase was primarily due to an increase in average customers per account, including further penetration in connected devices, and higher premium service revenues, partially offset by an increase in our promotional activities.
Postpaid Accounts & Postpaid ARPA
(Accounts in thousands)
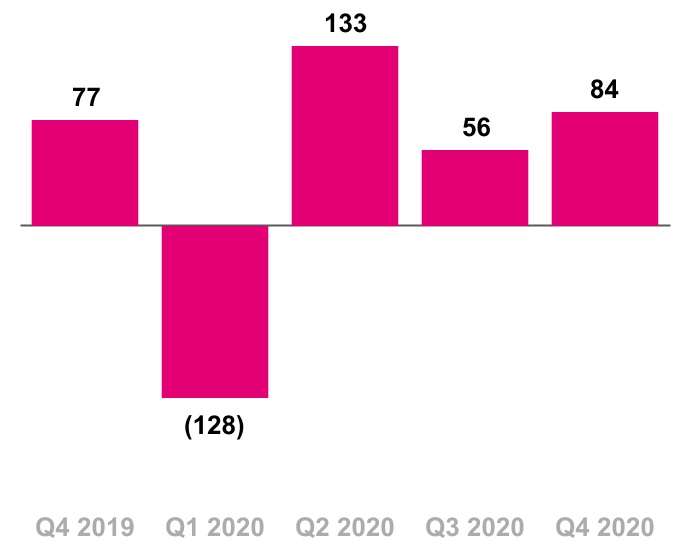
Total Prepaid Net Additions (losses)
(in thousands)
Prepaid net customer additions were 84 thousand in Q4 2020, compared to net additions of 56 thousand in Q3 2020 and net additions of 77 thousand in Q4 2019.
▪Sequentially, the increase was primarily due to seasonally higher promotional activity, partially offset by higher migrations to postpaid plans.
▪Year-over-year was relatively flat with lower churn offset by reduced gross additions due to lower switching activity in the industry as a result of the Pandemic.
▪Migrations to postpaid plans reduced prepaid net customer additions in Q4 2020 by approximately 165 thousand, up from 130 thousand in Q3 2020 and 160 thousand in Q4 2019.
Prepaid churn was 2.92% in Q4 2020, compared to 2.86% in Q3 2020 and 3.97% in Q4 2019.
▪Sequentially, the slight increase was primarily due to seasonally higher switching activity.
▪Year-over year, the decrease was primarily due to lower switching activity in the industry due to the Pandemic.
Prepaid ARPU was $38.08 in Q4 2020, down 1.1% from $38.49 in Q3 2020 and down 1.2% from $38.54 in Q4 2019.
▪Sequentially and year-over-year, the decrease was primarily due to promotional activities.
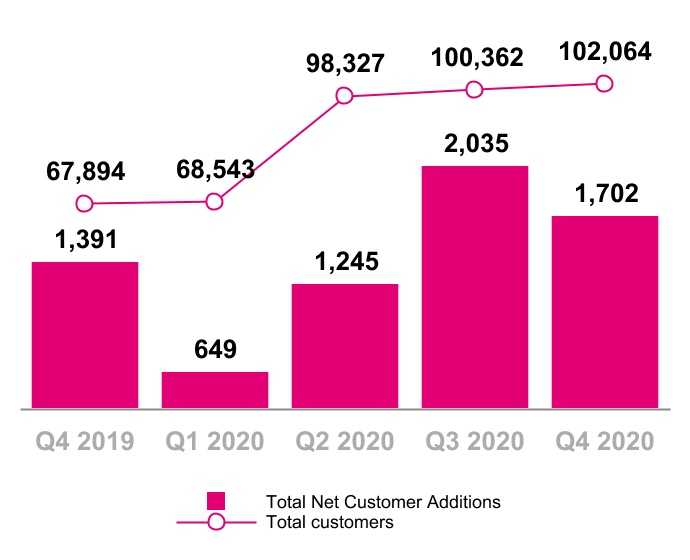
Total net customer additions were 1.7 million in Q4 2020, compared to 2.0 million in Q3 2020 and 1.4 million in Q4 2019.
Total customers were 102.1 million at the end of Q4 2020, compared to 100.4 million at the end of Q3 2020 and 67.9 million at the end of Q4 2019.
Total devices sold or leased were 11.7 million units in Q4 2020, compared to 11.4 million units in Q3 2020 and 9.1 million units in Q4 2019.
▪Total phones sold or leased were 10.1 million units in Q4 2020, compared to 9.2 million units in Q3 2020 and 8.3 million units in Q4 2019.
▪Mobile broadband and IoT devices sold or leased were 1.6 million units in Q4 2020, compared to 2.2 million units in Q3 2020 and 838 thousand units in Q4 2019.
Total Customers
(in thousands)
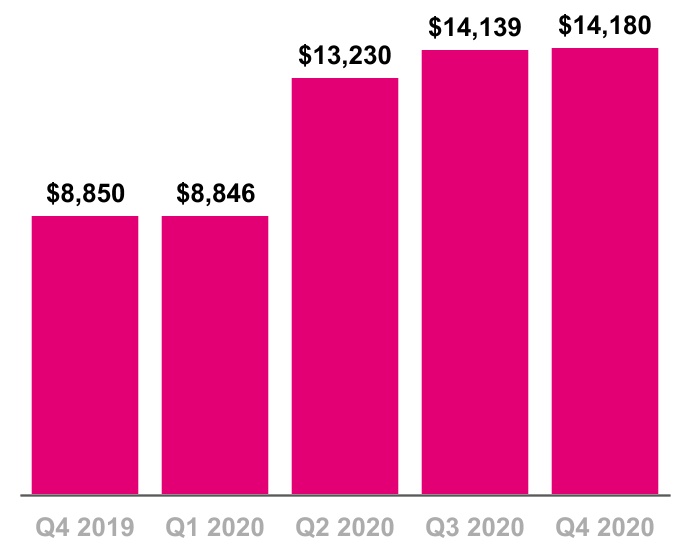
Service Revenues
($ in millions)
Service revenues were $14.2 billion in Q4 2020, up slightly from $14.1 billion in Q3 2020 and up 60% from $8.9 billion in Q4 2019.
▪Sequentially, Postpaid service revenues increased slightly, primarily driven by higher average postpaid customers, mostly offset by lower postpaid phone ARPU.
▪Year-over-year, the increase was primarily due to an increase in Postpaid service revenues, largely driven by customers acquired in the Merger and continued growth in existing and new markets, an increase in Wholesale revenues primarily driven by our Master Network Service Agreement with DISH, which went into effect on July 1, 2020, and higher Roaming and other service revenues, primarily from the inclusion of wireline operations acquired in the Merger.
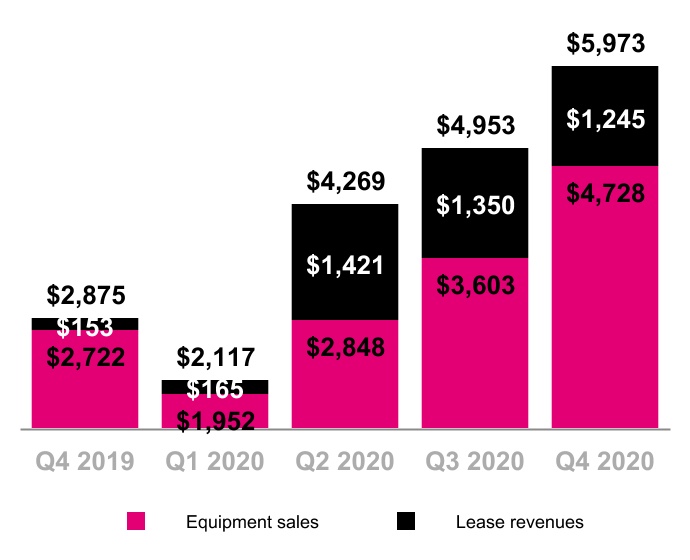
Equipment revenues were $6.0 billion in Q4 2020, up 21% from $5.0 billion in Q3 2020 and up 108% from $2.9 billion in Q4 2019. Lease revenues included in equipment revenues were $1.2 billion in Q4 2020 compared to $1.4 billion in Q3 2020 and $153 million in Q4 2019.
▪Sequentially, the increase was primarily due to:
▪Higher average revenue per device sold, excluding purchased leased devices and devices sold through educational programs, driven by an increase in the high-end device mix, partially offset by increased promotional activities;
▪An increase in the number of devices sold, driven by seasonality and iconic device launches; and
▪A continued shift in device financing from leasing to equipment installment plans.
▪Year-over-year, the increase was primarily due to:
▪Higher average revenue per device sold, excluding purchased leased devices and devices sold through educational programs, primarily due to an increase in the high-end device mix primarily driven by a larger postpaid customer base as a result of the Merger and iconic device launches, which were partially offset by increased promotional activities;
▪An increase in the number of devices sold primarily due to an increased customer base as the result of the Merger; and
▪An increase in lease revenues due to a higher number of customer devices under leases acquired in the Merger.
Equipment Revenues
($ in millions)
| | | | | | | | |
| Total revenues were $20.3 billion in Q4 2020, up 6% from $19.3 billion in Q3 2020 and up 71% from $11.9 billion in Q4 2019. | |
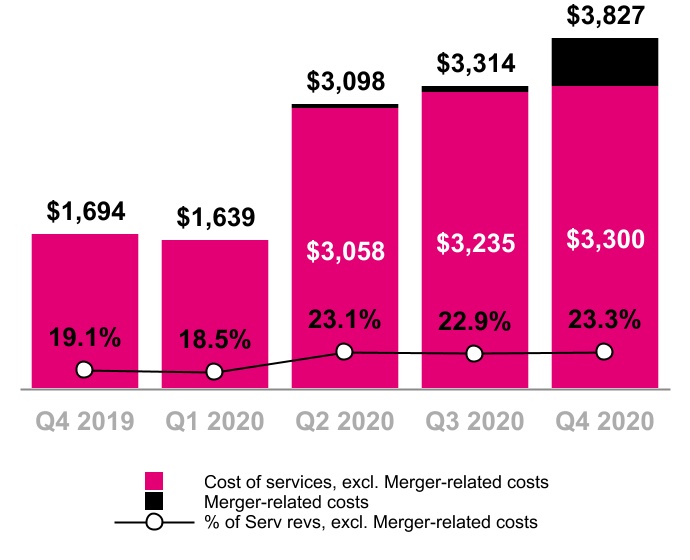
Cost of Services, exclusive of D&A
($ in millions, % of Service revs excl. Merger-related costs)
Cost of services, exclusive of depreciation and amortization (D&A), was $3.8 billion in Q4 2020, up 15% from $3.3 billion in Q3 2020 and up 126% from $1.7 billion in Q4 2019.
▪Sequentially, the increase was primarily due to Merger-related costs and higher lease expenses related to a new tower master lease agreement.
▪Year-over-year, the increase was primarily due to an increase in expenses associated with leases, backhaul agreements and other network expenses acquired in the Merger, higher lease expenses related to a new tower master lease agreement and the continued build-out of our nationwide 5G network.
▪Merger-related costs primarily related to network decommissioning and integration were $527 million in Q4 2020 compared to $79 million in Q3 2020 and $0 in Q4 2019.
▪As a percentage of Service revenues, Cost of Services, exclusive of D&A, and excluding Merger-related costs, increased by 40 basis points sequentially, primarily driven by network build-out, and increased by 420 basis points year-over-year.
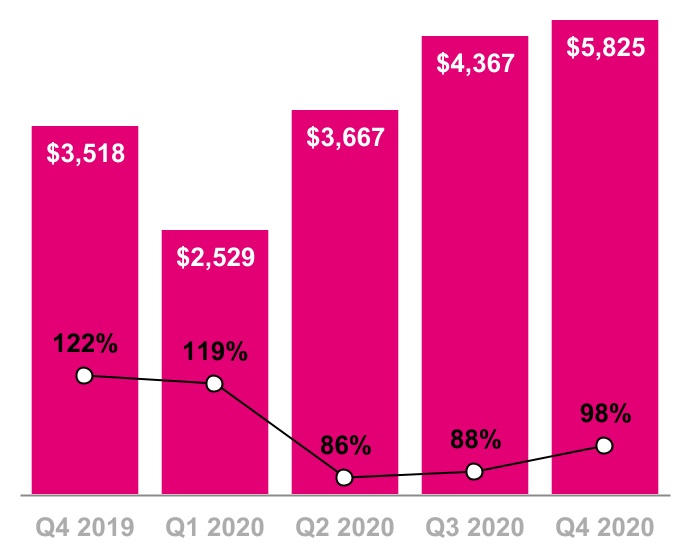
Cost of equipment sales, exclusive of D&A, was $5.8 billion in Q4 2020, up 33% from $4.4 billion in Q3 2020 and up 66% from $3.5 billion in Q4 2019.
▪Sequentially, the increase was primarily due to:
▪Higher average cost per device sold, excluding purchased leased devices and devices sold through educational programs, driven by an increase in the high-end device mix;
▪An increase in number of devices sold driven by seasonality and iconic device launches; and
▪A continued shift in device financing from leasing to equipment installment plans.
▪Year-over-year, the increase was primarily due to:
▪An increase in the number of devices sold primarily due to an increased customer base as a result of the Merger; and
▪A higher average cost per device sold, excluding purchased leased devices and devices sold through educational programs, primarily due to an increase in the high-end device mix primarily driven by a larger postpaid customer base as a result of the Merger and iconic device launches.
Cost of Equipment Sales, exclusive of D&A
($ in millions, % of Equipment Revs)
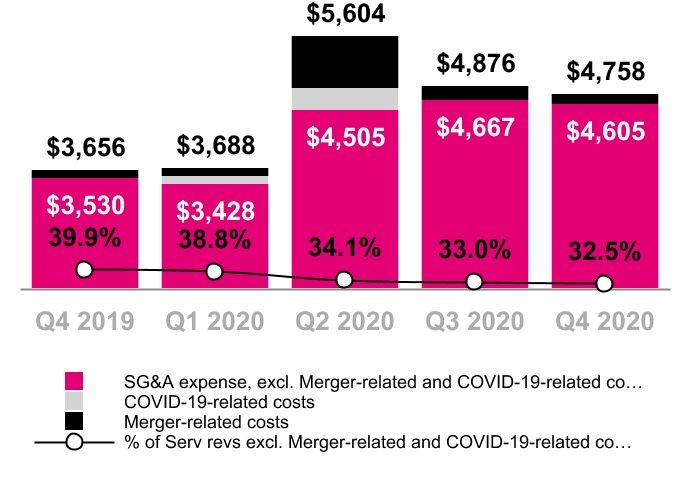
Selling, General and Administrative (SG&A) Expense
($ in millions, % of Service revs excl. Merger-related and COVID-19-related costs)
Selling, general and administrative (SG&A) expense was $4.8 billion in Q4 2020, down 2% from $4.9 billion in Q3 2020 and up 30% from $3.7 billion in Q4 2019.
▪Sequentially, the decrease was primarily driven by lower Merger-related costs, business taxes and employee-related costs.
▪Year-over-year, the increase was primarily due to the Merger including higher employee-related costs, external labor and professional services, and commissions expense.
▪Merger-related costs were $153 million in Q4 2020 compared to $209 million in Q3 2020 and $126 million in Q4 2019.
▪As a percentage of Service revenues, SG&A expense, excluding Merger-related and COVID-19-related costs, decreased 50 basis points sequentially and decreased 740 basis points year-over-year.
▪Total bad debt expense and losses from sales of receivables (reported within SG&A expense) was $112 million in Q4 2020, compared to $125 million in Q3 2020 and $128 million in Q4 2019. As a percentage of Total revenues, total bad debt expense and losses from sales of receivables was 0.55% in Q4 2020, compared to 0.65% in Q3 2020 and 1.07% in Q4 2019.
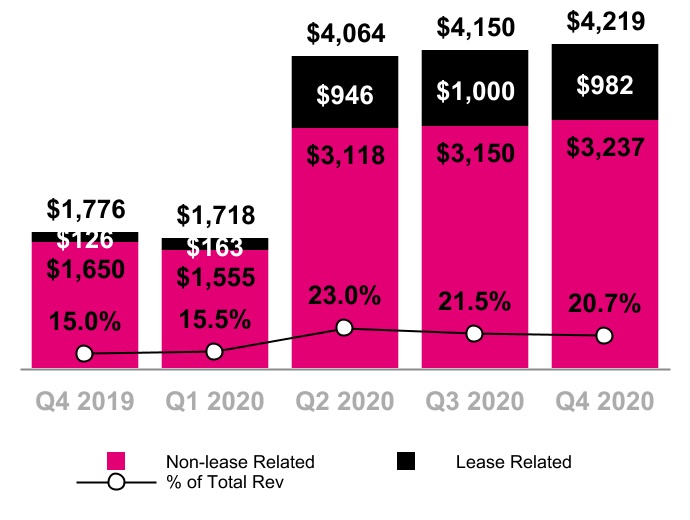
D&A was $4.2 billion in Q4 2020, up 2% from $4.2 billion in Q3 2020 and up 138% from $1.8 billion in Q4 2019. This includes D&A related to leased devices of $982 million in Q4 2020, compared to $1.0 billion in Q3 2020 and $126 million in Q4 2019.
▪Sequentially, the increase was primarily driven by higher depreciation expense from the continued build-out of our nationwide 5G network.
▪Year-over-year, the increase was primarily due to higher depreciation expense from assets acquired in the Merger, excluding leased devices, and expansion from the continued build-out of our nationwide 5G network, higher depreciation expense on leased devices resulting from a higher total number of customer devices under lease primarily from customers acquired in the Merger, and higher amortization from intangible assets acquired in the Merger.
Depreciation & Amortization
($ in millions, % of Total Revs)
Net Income
($ in millions)
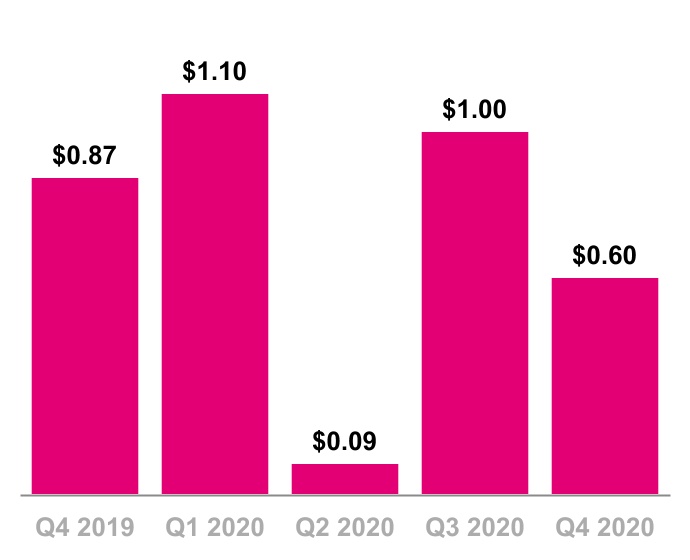
Diluted Earnings Per Share (Diluted EPS)
Net income was $750 million in Q4 2020, down 40% from $1.3 billion in Q3 2020 and essentially flat from $751 million in Q4 2019. Diluted EPS was $0.60 in Q4 2020, down from $1.00 in Q3 2020 and down from $0.87 in Q4 2019.
▪Sequentially, the decrease in Net income and diluted EPS was primarily due to higher Cost of equipment sales and Cost of services, partially offset by higher Equipment revenues and lower Income tax expense.
▪Year-over-year, Net income was essentially flat. Higher D&A, Cost of equipment sales, Cost of services, SG&A and interest expense were offset by higher Service and Equipment revenues. The decrease in diluted EPS was also impacted by an increase in outstanding shares as the result of the Merger.
▪Net income and diluted EPS, respectively, were impacted by Merger-related costs, net of tax, for Q4 2020 of $506 million and $0.40, compared to $208 million and $0.17 in Q3 2020 and $105 million and $0.12 in Q4 2019.
▪Net income margin was 5.3% in Q4 2020, compared to 8.9% in Q3 2020 and 8.5% in Q4 2019. Net income margin is calculated as Net income divided by Service revenues.
Adjusted EBITDA
($ in millions, % of Service Revs)
Adjusted EBITDA was $6.7 billion in Q4 2020, down 5% from $7.1 billion in Q3 2020 and up 108% from $3.2 billion in Q4 2019.
▪Sequentially, the decrease was primarily due to higher Cost of equipment sales and Cost of services, excluding Merger-related costs, partially offset by higher Equipment revenues and lower SG&A expenses, excluding Merger-related costs.
▪Year-over-year, the increase was primarily due to higher Service and Equipment revenues, partially offset by higher Cost of equipment sales, higher Cost of services, excluding Merger-related costs, and higher SG&A expense, excluding Merger-related costs.
▪Adjusted EBITDA excludes Merger-related costs of $686 million in Q4 2020 compared to $288 million in Q3 2020 and $126 million in Q4 2019.
▪Adjusted EBITDA margin was 47.6% in Q4 2020, compared to 50.4% in Q3 2020 and 36.6% in Q4 2019.
Net cash provided by operating activities was $3.5 billion in Q4 2020, compared to $2.8 billion in Q3 2020 and $1.5 billion in Q4 2019.
▪Sequentially, the increase was primarily due to a decrease in net cash outflows from changes in working capital, partially offset by lower Net income, excluding non-cash income and expenses. The change in working capital was primarily due to lower use of cash from Accounts payable and accrued liabilities and Accounts receivable, partially offset by higher use of cash from Equipment installment plan receivables.
▪Year-over-year, the increase was primarily due to higher Net income, excluding non-cash income and expenses, partially offset by an increase in net cash outflows from changes in working capital. The change in working capital was primarily due to higher use of cash from Equipment installment plan receivables, partially offset by lower use of cash from Accounts receivable.
▪The impact of payments for Merger-related costs on Net cash provided by operating activities was $583 million in Q4 2020 compared to $379 million in Q3 2020 and $133 million in Q4 2019.
Net Cash Provided by Operating Activities
($ in millions)
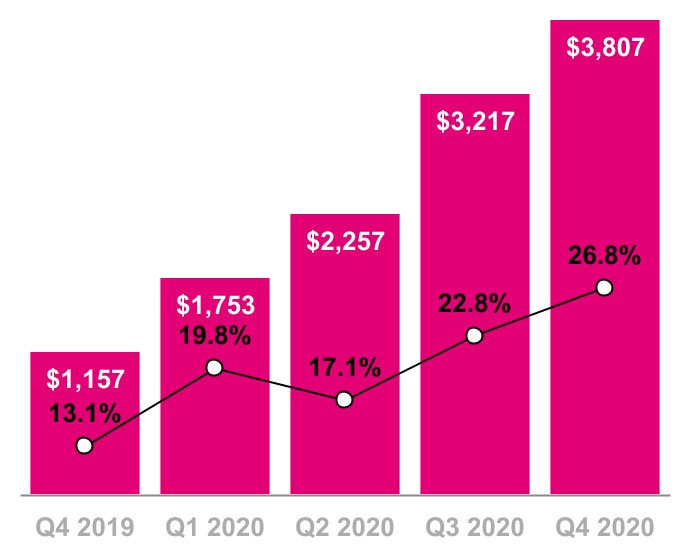
Cash Purchases of Property and Equipment
($ in millions, % of Service Revenues)
Cash purchases of property and equipment were $3.8 billion in Q4 2020, compared to $3.2 billion in Q3 2020 and $1.2 billion in Q4 2019. Capitalized interest included in cash purchases of property and equipment was $101 million in Q4 2020, compared to $108 million in Q3 2020 and $112 million in Q4 2019.
▪Sequentially and year-over-year, the increase was primarily driven by network integration related to the Merger and the continued build-out of our nationwide 5G network.
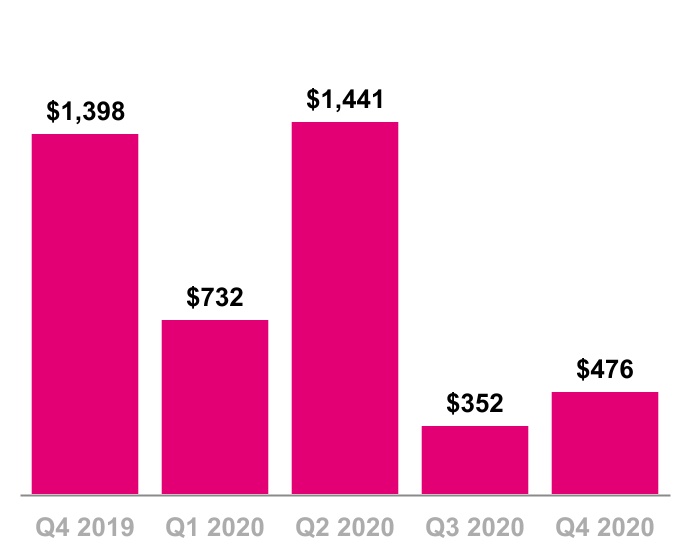
Free Cash Flow, excluding gross payments for the settlement of interest rate swaps related to Merger financing, was $476 million in Q4 2020, compared to $352 million in Q3 2020 and $1.4 billion in Q4 2019.
▪Sequentially, the increase was primarily due to higher Net cash provided by operating activities, partially offset by higher cash purchases of property and equipment, including capitalized interest.
▪Year-over-year, the decrease was primarily due to higher cash purchases of property and equipment, including capitalized interest, partially offset by higher Net cash provided by operating activities.
▪The impact of payments for Merger-related costs on Free Cash Flow, excluding gross payments for the settlement of interest rate swaps related to Merger financing, was $583 million in Q4 2020 compared to $379 million in Q3 2020 and $133 million in Q4 2019.
Free Cash Flow, Excluding Gross Payments for the Settlement of Interest Rate Swaps
($ in millions)
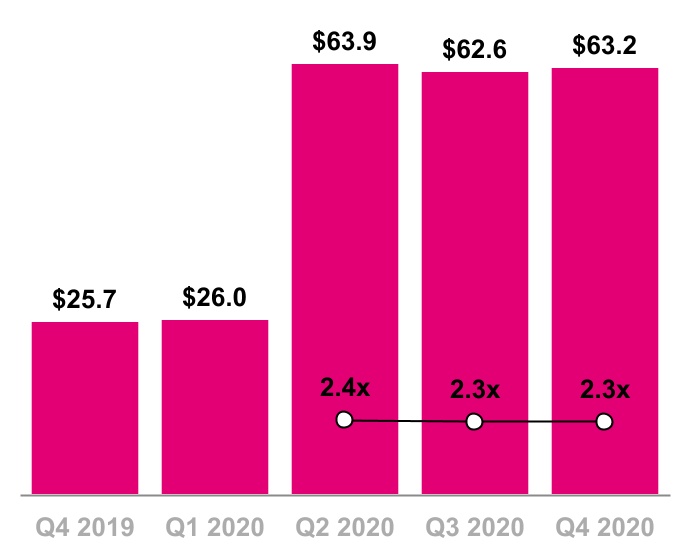
Net Debt (Excluding Tower Obligations) & Net Debt to LTM Pro Forma Adj. EBITDA Ratio
($ in billions)
Total debt, excluding tower obligations, at the end of Q4 2020 was $73.6 billion.
Net debt, excluding tower obligations, at the end of Q4 2020 was $63.2 billion.
▪The ratio of net debt, excluding tower obligations, to Pro Forma Adjusted EBITDA for the trailing last twelve months (“LTM”) period was 2.3x at the end of Q4 2020 compared to 2.3x at the end of Q3 2020.
▪Since closing the Merger on April 1, 2020, we have issued approximately $39 billion of debt ($36.0 billion of secured debt and $3.0 billion of unsecured high yield debt) at an average interest rate of approximately 3.47%, excluding amortization of the costs for the settlement of interest rate swaps, and an average tenor of approximately 13.8 years.
▪Since closing the Merger on April 1, 2020, we utilized these proceeds to retire approximately $28 billion of debt, including Sprint debt repaid at close, which allowed us to double the average maturity of our debt portfolio from 4.3 years to 9.0 years, and lower the average cost of debt from approximately 5.7% to approximately 5.0%, excluding amortization of the costs for the settlement of interest rate swaps.
Financing activity since the close of Q3 2020 includes:
▪On October 6, we issued Senior Secured Notes in an aggregate amount of $4.0 billion;
▪On October 9, we repaid our $4.0 billion New Secured Term Loan Facility;
▪On October 28, we issued Senior Secured Notes in an aggregate amount of $4.75 billion;
▪On October 30, we entered into a $5.0 billion senior secured term loan commitment with certain financial institutions. The commitment was reduced to $2.0 billion, concurrent with the issuance of $3.0 billion unsecured debt on January 14, 2021. Up to $2.0 billion of loans under the commitment may be drawn at any time (subject to customary conditions precedent) through June 30, 2021; and
▪On January 14, 2021, we issued Senior Notes in an aggregate amount of $3.0 billion at an average interest rate of approximately 2.58%, setting record low yields for 5-year, 8-year and 10-year tranches in the high yield market.

| | | | | | | | | | | | | | |
| T-Mobile remains highly confident in its ability to deliver the Sprint Merger synergies and achieve the annualized savings from a combination of expense reductions and cost avoidance. | |
| | | | |
| Improvements for Sprint customers | | We delivered $1.3 billion of synergies in full-year 2020, exceeding our guidance from last quarter. ▪Approximately $700 million of network synergies with about two thirds coming from avoided new site builds and the remainder from early site decommissioning. ▪More than $600 million of sales, marketing, and administrative synergies primarily from accelerated rationalization of retail stores, marketing consolidation and organizational redesign.
Merger-related costs in Q4 2020 were $686 million compared to $288 million in Q3 2020 and $126 million in Q4 2019.
Merger-related costs include: ▪Integration costs to achieve efficiencies in network, retail, information technology and back office operations; ▪Transaction costs, including legal and professional services related to the completion of the Merger; and ▪Restructuring costs, including severance, store rationalization and network decommissioning.
| |
| 25% | | |
| of Sprint’s postpaid customer traffic has already been moved over to the T-Mobile network | | |
| ————————— | | |
| More than | | |
| 4M | | |
| Sprint customer network migrations completed | | |
| | | |
| | | | |
| | | | |
| | | | | | | | | | | | | | | | | | | | | | | | | | | | | | | | | | | | | | | | | | | | | | | | | | | | | |
| Merger-Related Costs |
| (in millions) |
| | | | | | | | | | | Sequential Change | | Year-over-year Change |
| Q4 2019 | | Q1 2020 | | Q2 2020 | | Q3 2020 | | Q4 2020 | | $ | | % | | $ | | % |
| Cost of services | $ | — | | | $ | — | | | $ | 40 | | | $ | 79 | | | $ | 527 | | | $ | 448 | | | 567 | % | | $ | 527 | | | NM |
| Cost of equipment sales | — | | | — | | | — | | | — | | | 6 | | | 6 | | | NM | | 6 | | | NM |
| Selling, general & administrative | 126 | | | 143 | | | 758 | | | 209 | | | 153 | | | (56) | | | (27) | % | | 27 | | | 21 | % |
| Total Merger-related costs | $ | 126 | | | $ | 143 | | | $ | 798 | | | $ | 288 | | | $ | 686 | | | $ | 398 | | | 138 | % | | $ | 560 | | | 444 | % |
| | | | | | | | | | | | | | | | | |
| Cash payments for Merger-related costs | $ | 133 | | | $ | 161 | | | $ | 370 | | | $ | 379 | | | $ | 583 | | | $ | 204 | | | 54 | % | | $ | 450 | | | 338 | % |
| | | | | | | | | | | | | | | | | |
NM - Not Meaningful
2021 Outlook
| | | | | |
| Postpaid net customer additions | 4.0 to 4.7 million |
Net income (1) | N/A |
Core Adjusted EBITDA (2) | $22.6 to $23.1 billion |
| Adjusted EBITDA | $26.5 to $27.0 billion |
| Lease revenues | $3.8 to $4.0 billion |
Capital expenditures (3) | $11.7 to $12.0 billion |
Merger-related costs (4) | $2.5 to $3.0 billion |
| Net cash provided by operating activities | $13.0 to $13.5 billion |
Free Cash Flow (5) | $4.9 to $5.4 billion |
(1)We are not able to forecast Net income on a forward-looking basis without unreasonable efforts due to the high variability and difficulty in predicting certain items that affect GAAP Net income, including, but not limited to, Income tax expense, stock-based compensation expense and Interest expense. Core Adjusted EBITDA and Adjusted EBITDA should not be used to predict Net income as the difference between these measures and Net Income is variable.
(2)We will provide guidance for Core Adjusted EBITDA beginning with fiscal year 2021. Management uses Core Adjusted EBITDA as a measure to monitor the financial performance of our operations, excluding the impact of lease revenues from our related device financing programs. Our guidance range is calculated using the midpoint of the guidance range for lease revenues of $3.9 billion.
(3)Capital expenditures means cash purchases of property and equipment, including capitalized interest.
(4)Merger-related costs are excluded from Core Adjusted EBITDA and Adjusted EBITDA but will impact Net income and cash flows.
(5)Free Cash Flow guidance does not assume any material net cash inflows from securitization in 2021.
Investor Relations
investor.relations@t-mobile.com
http://investor.t-mobile.com
T-Mobile US, Inc.
Consolidated Balance Sheets
(Unaudited)
| | | | | | | | | | | |
| (in millions, except share and per share amounts) | December 31, 2020 | | December 31, 2019 |
| Assets | | | |
| Current assets | | | |
| | | |
| Cash and cash equivalents | $ | 10,385 | | | $ | 1,528 | |
| Accounts receivable, net of allowance for credit losses of $194 and $61 | 4,254 | | | 1,888 | |
| Equipment installment plan receivables, net of allowance for credit losses and imputed discount of $478 and $333 | 3,577 | | | 2,600 | |
| Accounts receivable from affiliates | 22 | | | 20 | |
| Inventory | 2,527 | | | 964 | |
| | | |
| Prepaid expenses | 624 | | | 333 | |
| | | |
| Other current assets | 2,496 | | | 1,972 | |
| | | |
| Total current assets | 23,885 | | | 9,305 | |
| | | |
| Property and equipment, net | 41,175 | | | 21,984 | |
| Operating lease right-of-use assets | 28,021 | | | 10,933 | |
| Financing lease right-of-use assets | 3,028 | | | 2,715 | |
| Goodwill | 11,117 | | | 1,930 | |
| Spectrum licenses | 82,828 | | | 36,465 | |
| Other intangible assets, net | 5,298 | | | 115 | |
| Equipment installment plan receivables due after one year, net of allowance for credit losses and imputed discount of $127 and $66 | 2,031 | | | 1,583 | |
| | | |
| Other assets | 2,779 | | | 1,891 | |
| | | |
| Total assets | $ | 200,162 | | | $ | 86,921 | |
| Liabilities and Stockholders' Equity | | | |
| Current liabilities | | | |
| | | |
| Accounts payable and accrued liabilities | $ | 10,196 | | | $ | 6,746 | |
| Payables to affiliates | 157 | | | 187 | |
| Short-term debt | 4,579 | | | 25 | |
| | | |
| Deferred revenue | 1,030 | | | 631 | |
| Short-term operating lease liabilities | 3,868 | | | 2,287 | |
| Short-term financing lease liabilities | 1,063 | | | 957 | |
| | | |
| Other current liabilities | 810 | | | 1,673 | |
| | | |
| Total current liabilities | 21,703 | | | 12,506 | |
| | | |
| Long-term debt | 61,830 | | | 10,958 | |
| Long-term debt to affiliates | 4,716 | | | 13,986 | |
| Tower obligations | 3,028 | | | 2,236 | |
| Deferred tax liabilities | 9,966 | | | 5,607 | |
| Operating lease liabilities | 26,719 | | | 10,539 | |
| Financing lease liabilities | 1,444 | | | 1,346 | |
| | | |
| | | |
| Other long-term liabilities | 5,412 | | | 954 | |
| | | |
| Total long-term liabilities | 113,115 | | | 45,626 | |
| Commitments and contingencies | | | |
| Stockholders' equity | | | |
| | | |
| | | |
| Common Stock, par value $0.00001 per share, 2,000,000,000 shares authorized; 1,243,345,584 and 858,418,615 shares issued, 1,241,805,706 and 856,905,400 shares outstanding | — | | | — | |
| Additional paid-in capital | 72,772 | | | 38,498 | |
| Treasury stock, at cost, 1,539,878 and 1,513,215 shares issued | (11) | | | (8) | |
| Accumulated other comprehensive loss | (1,581) | | | (868) | |
| Accumulated deficit | (5,836) | | | (8,833) | |
| | | |
| Total stockholders' equity | 65,344 | | | 28,789 | |
| Total liabilities and stockholders' equity | $ | 200,162 | | | $ | 86,921 | |
| | | |
| | | |
| | | |
| | | |
| | | |
| | | |
| | | |
| | | |
| | | |
| | | |
| | | |
| | | |
| | | |
| | | |
| | | |
| | | |
| | | |
| | | |
| | | |
| | | |
T-Mobile US, Inc.
Consolidated Statements of Comprehensive Income
(Unaudited)
| | | | | | | | | | | | | | | | | | | | | | | | | | | | | |
| Three Months Ended | | Year Ended December 31, |
| (in millions, except share and per share amounts) | December 31,
2020 | | September 30,
2020 | | December 31, 2019 | | 2020 | | 2019 |
| Revenues | | | | | | | | | |
| | | | | | | | | |
| Postpaid revenues | $ | 10,251 | | | $ | 10,209 | | | $ | 5,821 | | | $ | 36,306 | | | $ | 22,673 | |
| Prepaid revenues | 2,354 | | | 2,383 | | | 2,393 | | | 9,421 | | | 9,543 | |
| Wholesale revenues | 927 | | | 930 | | | 341 | | | 2,590 | | | 1,279 | |
| Roaming and other service revenues | 648 | | | 617 | | | 295 | | | 2,078 | | | 1,005 | |
| | | | | | | | | |
| Total service revenues | 14,180 | | | 14,139 | | | 8,850 | | | 50,395 | | | 34,500 | |
| | | | | | | | | |
| Equipment revenues | 5,973 | | | 4,953 | | | 2,875 | | | 17,312 | | | 9,840 | |
| Other revenues | 188 | | | 180 | | | 153 | | | 690 | | | 658 | |
| | | | | | | | | |
| Total revenues | 20,341 | | | 19,272 | | | 11,878 | | | 68,397 | | | 44,998 | |
| | | | | | | | | |
| Operating expenses | | | | | | | | | |
| | | | | | | | | |
| Cost of services, exclusive of depreciation and amortization shown separately below | 3,827 | | | 3,314 | | | 1,694 | | | 11,878 | | | 6,622 | |
| Cost of equipment sales, exclusive of depreciation and amortization shown separately below | 5,825 | | | 4,367 | | | 3,518 | | | 16,388 | | | 11,899 | |
| Selling, general and administrative | 4,758 | | | 4,876 | | | 3,656 | | | 18,926 | | | 14,139 | |
| Impairment expense | — | | | — | | | — | | | 418 | | | — | |
| Depreciation and amortization | 4,219 | | | 4,150 | | | 1,776 | | | 14,151 | | | 6,616 | |
| | | | | | | | | |
| | | | | | | | | |
| Total operating expenses | 18,629 | | | 16,707 | | | 10,644 | | | 61,761 | | | 39,276 | |
| | | | | | | | | |
| Operating income | 1,712 | | | 2,565 | | | 1,234 | | | 6,636 | | | 5,722 | |
| | | | | | | | | |
| Other income (expense) | | | | | | | | | |
| | | | | | | | | |
| Interest expense | (757) | | | (765) | | | (182) | | | (2,483) | | | (727) | |
| Interest expense to affiliates | (41) | | | (44) | | | (98) | | | (247) | | | (408) | |
| Interest income | 8 | | | 3 | | | 7 | | | 29 | | | 24 | |
| Other expense, net | (101) | | | (99) | | | 4 | | | (405) | | | (8) | |
| Total other expense, net | (891) | | | (905) | | | (269) | | | (3,106) | | | (1,119) | |
| Income from continuing operations before income taxes | 821 | | | 1,660 | | | 965 | | | 3,530 | | | 4,603 | |
| Income tax expense | (71) | | | (407) | | | (214) | | | (786) | | | (1,135) | |
| | | | | | | | | |
| Income from continuing operations | 750 | | | 1,253 | | | 751 | | | 2,744 | | | 3,468 | |
| Income from discontinued operations, net of tax | — | | | — | | | — | | | 320 | | | — | |
| Net income | $ | 750 | | | $ | 1,253 | | | $ | 751 | | | $ | 3,064 | | | $ | 3,468 | |
| | | | | | | | | |
| | | | | | | | | |
| | | | | | | | | |
| Net income | $ | 750 | | | $ | 1,253 | | | $ | 751 | | | $ | 3,064 | | | $ | 3,468 | |
| Other comprehensive income (loss), net of tax | | | | | | | | | |
| | | | | | | | | |
| | | | | | | | | |
| Unrealized gain (loss) on cash flow hedges, net of tax effect of $11, $12, $69, ($250), ($187) | 34 | | | 33 | | | 202 | | | (723) | | | (536) | |
| Unrealized gain on foreign currency translation adjustment, net of tax effect of $0, $1, $0, $1, and $0 | — | | | 4 | | | — | | | 4 | | | — | |
| | | | | | | | | |
| Net unrecognized gain (loss) on pension and other postretirement benefits, net of tax effect of $2, $0, $0, $2 and $0 | 6 | | | — | | | — | | | 6 | | | — | |
| | | | | | | | | |
| Other comprehensive income (loss) | 40 | | | 37 | | | 202 | | | (713) | | | (536) | |
| | | | | | | | | |
| Total comprehensive income | $ | 790 | | | $ | 1,290 | | | $ | 953 | | | $ | 2,351 | | | $ | 2,932 | |
| Earnings per share | | | | | | | | | |
| Basic earnings per share: | | | | | | | | | |
| Continuing operations | $ | 0.60 | | | $ | 1.01 | | | $ | 0.88 | | | $ | 2.40 | | | $ | 4.06 | |
| Discontinued operations | — | | | — | | | — | | | 0.28 | | | — | |
| Basic | $ | 0.60 | | | $ | 1.01 | | | $ | 0.88 | | | $ | 2.68 | | | $ | 4.06 | |
| Diluted earnings per share: | | | | | | | | | |
| Continuing operations | $ | 0.60 | | | $ | 1.00 | | | $ | 0.87 | | | $ | 2.37 | | | $ | 4.02 | |
| Discontinued operations | — | | | — | | | — | | | 0.28 | | | — | |
| Diluted | $ | 0.60 | | | $ | 1.00 | | | $ | 0.87 | | | $ | 2.65 | | | $ | 4.02 | |
| Weighted average shares outstanding | | | | | | | | | |
| Basic | 1,241,578,615 | | | 1,238,450,665 | | | 856,294,467 | | | 1,144,206,326 | | | 854,143,751 | |
| Diluted | 1,251,566,899 | | | 1,249,798,740 | | | 864,158,739 | | | 1,154,749,428 | | | 863,433,511 | |
| | | | | | | | | |
| | | | | | | | | |
| | | | | | | | | |
| | | | | | | | | |
| | | | | | | | | |
| | | | | | | | | |
| | | | | | | | | |
| | | | | | | | | |
| | | | | | | | | |
| | | | | | | | | |
| | | | | | | | | |
| | | | | | | | | |
| | | | | | | | | |
| | | | | | | | | |
| | | | | | | | | |
| | | | | | | | | |
| | | | | | | | | |
| | | | | | | | | |
| | | | | | | | | |
| | | | | | | | | |
| | | | | | | | | |
| | | | | | | | | |
| | | | | | | | | |
| | | | | | | | | |
| | | | | | | | | |
| | | | | | | | | |
| | | | | | | | | |
| | | | | | | | | |
| | | | | | | | | |
| | | | | | | | | |
T-Mobile US, Inc.
Consolidated Statements of Cash Flows
(Unaudited)
| | | | | | | | | | | | | | | | | | | | | | | | | | | | | |
| Three Months Ended | | Year Ended December 31, |
| (in millions) | December 31,
2020 | | September 30,
2020 | | December 31,
2019 | | 2020 | | 2019 |
| Operating activities | | | | | | | | | |
| Net income | $ | 750 | | | $ | 1,253 | | | $ | 751 | | | $ | 3,064 | | | $ | 3,468 | |
| Adjustments to reconcile net income to net cash provided by operating activities | | | | | | | | | |
| | | | | | | | | |
| Depreciation and amortization | 4,219 | | | 4,150 | | | 1,776 | | | 14,151 | | | 6,616 | |
| Stock-based compensation expense | 136 | | | 161 | | | 129 | | | 694 | | | 495 | |
| Deferred income tax expense | 79 | | | 335 | | | 242 | | | 822 | | | 1,091 | |
| Bad debt expense | 113 | | | 143 | | | 89 | | | 602 | | | 307 | |
| Losses from sales of receivables | (1) | | | (18) | | | 39 | | | 36 | | | 130 | |
| | | | | | | | | |
| Losses on redemption of debt | 100 | | | 108 | | | — | | | 371 | | | 19 | |
| | | | | | | | | |
| | | | | | | | | |
| Impairment expense | — | | | — | | | — | | | 418 | | | — | |
| Changes in operating assets and liabilities | | | | | | | | | |
| Accounts receivable | (489) | | | (1,538) | | | (1,016) | | | (3,273) | | | (3,709) | |
| Equipment installment plan receivables | (1,343) | | | (306) | | | (537) | | | (1,453) | | | (1,015) | |
| Inventories | (609) | | | (549) | | | (478) | | | (2,222) | | | (617) | |
| Operating lease right-of-use assets | 939 | | | 1,062 | | | 501 | | | 3,465 | | | 1,896 | |
| Other current and long-term assets | (296) | | | (8) | | | 144 | | | (402) | | | (144) | |
| Accounts payable and accrued liabilities | 507 | | | (964) | | | 356 | | | (2,123) | | | 17 | |
| Short and long-term operating lease liabilities | (752) | | | (1,145) | | | (539) | | | (3,699) | | | (2,131) | |
| Other current and long-term liabilities | (16) | | | (51) | | | 8 | | | (2,178) | | | 144 | |
| Other, net | 137 | | | 139 | | | 72 | | | 367 | | | 257 | |
| | | | | | | | | |
| Net cash provided by operating activities | 3,474 | | | 2,772 | | | 1,537 | | | 8,640 | | | 6,824 | |
| Investing activities | | | | | | | | | |
| | | | | | | | | |
| Purchases of property and equipment, including capitalized interest of ($101), ($108), ($112), ($440) and ($473) | (3,807) | | | (3,217) | | | (1,157) | | | (11,034) | | | (6,391) | |
| (Purchases) refunds of spectrum licenses and other intangible assets, including deposits | (506) | | | 17 | | | (104) | | | (1,333) | | | (967) | |
| Proceeds from sales of tower sites | — | | | — | | | 38 | | | — | | | 38 | |
| Proceeds related to beneficial interests in securitization transactions | 809 | | | 855 | | | 980 | | | 3,134 | | | 3,876 | |
| Net cash related to derivative contracts under collateral exchange arrangements | — | | | — | | | (632) | | | 632 | | | (632) | |
| Acquisition of companies, net of cash and restricted cash acquired | — | | | — | | | — | | | (5,000) | | | (31) | |
| Proceeds from the divestiture of prepaid business | (14) | | | 1,238 | | | — | | | 1,224 | | | — | |
| Other, net | (129) | | | (25) | | | (12) | | | (338) | | | (18) | |
| | | | | | | | | |
| Net cash used in investing activities | (3,647) | | | (1,132) | | | (887) | | | (12,715) | | | (4,125) | |
| Financing activities | | | | | | | | | |
| | | | | | | | | |
| Proceeds from issuance of long-term debt | 8,643 | | | — | | | — | | | 35,337 | | | — | |
| Payments of consent fees related to long-term debt | — | | | — | | | — | | | (109) | | | — | |
| Proceeds from borrowing on revolving credit facility | — | | | — | | | — | | | — | | | 2,340 | |
| Repayments of revolving credit facility | — | | | — | | | — | | | — | | | (2,340) | |
| Repayments of financing lease obligations | (257) | | | (246) | | | (248) | | | (1,021) | | | (798) | |
| Repayments of short-term debt for purchases of inventory, property and equipment and other financial liabilities | (74) | | | (231) | | | (475) | | | (481) | | | (775) | |
| Repayments of long-term debt | (4,209) | | | (5,678) | | | — | | | (20,416) | | | (600) | |
| | | | | | | | | |
| Issuance of common stock | — | | | 2,550 | | | — | | | 19,840 | | | — | |
| Repurchases of common stock | — | | | (2,546) | | | — | | | (19,536) | | | — | |
| Proceeds from issuance of short-term debt | — | | | — | | | — | | | 18,743 | | | — | |
| Repayments of short-term debt | — | | | — | | | — | | | (18,929) | | | — | |
| Tax withholdings on share-based awards | (88) | | | (72) | | | (48) | | | (439) | | | (156) | |
| | | | | | | | | |
| Cash payments for debt prepayment or debt extinguishment costs | — | | | (58) | | | — | | | (82) | | | (28) | |
| Other, net | (36) | | | 137 | | | (4) | | | 103 | | | (17) | |
| | | | | | | | | |
| Net cash provided by (used in) financing activities | 3,979 | | | (6,144) | | | (775) | | | 13,010 | | | (2,374) | |
| Change in cash and cash equivalents, including restricted cash | 3,806 | | | (4,504) | | | (125) | | | 8,935 | | | 325 | |
| Cash and cash equivalents, including restricted cash | | | | | | | | | |
| Beginning of period | 6,657 | | | 11,161 | | | 1,653 | | | 1,528 | | | 1,203 | |
| End of period | $ | 10,463 | | | $ | 6,657 | | | $ | 1,528 | | | $ | 10,463 | | | $ | 1,528 | |
| | | | | | | | | |
| | | | | | | | | |
| | | | | | | | | |
| | | | | | | | | |
| | | | | | | | | |
| | | | | | | | | |
| | | | | | | | | |
| | | | | | | | | |
| | | | | | | | | |
| | | | | | | | | |
| | | | | | | | | |
| | | | | | | | | |
| | | | | | | | | |
| | | | | | | | | |
| | | | | | | | | |
| | | | | | | | | |
| | | | | | | | | |
| | | | | | | | | |
| | | | | | | | | |
| | | | | | | | | |
| | | | | | | | | |
| | | | | | | | | |
| | | | | | | | | |
| | | | | | | | | |
| | | | | | | | | |
| | | | | | | | | |
| | | | | | | | | |
| | | | | | | | | |
T-Mobile US, Inc.
Consolidated Statements of Cash Flows (Continued)
(Unaudited)
| | | | | | | | | | | | | | | | | | | | | | | | | | | | | |
| Three Months Ended | | Year Ended December 31, |
| (in millions) | December 31,
2020 | | September 30,
2020 | | December 31,
2019 | | 2020 | | 2019 |
| Supplemental disclosure of cash flow information | | | | | | | | | |
| Interest payments, net of amounts capitalized | $ | 844 | | | $ | 940 | | | $ | 216 | | | $ | 2,733 | | | $ | 1,128 | |
| Operating lease payments | 1,126 | | | 1,349 | | | 689 | | | 4,619 | | | 2,783 | |
| Income tax payments | 100 | | | 63 | | | 11 | | | 218 | | | 88 | |
| Non-cash investing and financing activities | | | | | | | | | |
| Non-cash beneficial interest obtained in exchange for securitized receivables | $ | 1,560 | | | $ | 1,535 | | | $ | 1,647 | | | $ | 6,194 | | | $ | 6,509 | |
| Non-cash consideration for the acquisition of Sprint | — | | | — | | | — | | | 33,533 | | | — | |
| Change in accounts payable and accrued liabilities for purchases of property and equipment | 1,144 | | | (216) | | | (29) | | | 589 | | | (935) | |
| Leased devices transferred from inventory to property and equipment | 443 | | | 599 | | | 394 | | | 2,795 | | | 1,006 | |
| Returned leased devices transferred from property and equipment to inventory | (430) | | | (433) | | | (78) | | | (1,460) | | | (267) | |
| Short-term debt assumed for financing of property and equipment | — | | | — | | | 25 | | | 38 | | | 800 | |
| Operating lease right-of-use assets obtained in exchange for lease obligations | 1,083 | | | 11,833 | | | 538 | | | 14,129 | | | 3,621 | |
| Financing lease right-of-use assets obtained in exchange for lease obligations | 361 | | | 219 | | | 98 | | | 1,273 | | | 1,041 | |
T-Mobile US, Inc.
Supplementary Operating and Financial Data
(Unaudited)
| | | | | | | | | | | | | | | | | | | | | | | | | | | | | | | | | | | | | | | | | | | | | | | | | | | | | | | | | | | |
| Quarter | | Year Ended December 31, |
| (in thousands) | Q1 2019 | | Q2 2019 | | Q3 2019 | | Q4 2019 | | Q1 2020 | | Q2 2020 | | Q3 2020 | | Q4 2020 | | 2019 | | 2020 |
| Customers, end of period | | | | | | | | | | | | | | | | | | | |
| | | | | | | | | | | | | | | | | | | |
Postpaid phone customers (1) | 37,880 | | | 38,590 | | | 39,344 | | | 40,345 | | | 40,797 | | | 65,105 | | | 65,794 | | | 66,618 | | | 40,345 | | | 66,618 | |
Postpaid other customers (1) | 5,658 | | | 6,056 | | | 6,376 | | | 6,689 | | | 7,014 | | | 12,648 | | | 13,938 | | | 14,732 | | | 6,689 | | | 14,732 | |
| | | | | | | | | | | | | | | | | | | |
| Total postpaid customers | 43,538 | | | 44,646 | | | 45,720 | | | 47,034 | | | 47,811 | | | 77,753 | | | 79,732 | | | 81,350 | | | 47,034 | | | 81,350 | |
| | | | | | | | | | | | | | | | | | | |
Prepaid customers (1) (2) | 21,206 | | | 21,337 | | | 20,783 | | | 20,860 | | | 20,732 | | | 20,574 | | | 20,630 | | | 20,714 | | | 20,860 | | | 20,714 | |
| | | | | | | | | | | | | | | | | | | |
| Total customers | 64,744 | | | 65,983 | | | 66,503 | | | 67,894 | | | 68,543 | | | 98,327 | | | 100,362 | | | 102,064 | | | 67,894 | | | 102,064 | |
| | | | | | | | | | | | | | | | | | | |
| | | | | | | | | | | | | | | | | | | |
| | | | | | | | | | | | | | | | | | | |
| | | | | | | | | | | | | | | | | | | |
Adjustment to prepaid customers (2) | — | | | — | | | (616) | | | — | | | — | | | — | | | — | | | — | | | (616) | | | — | |
| | | | | | | | | | | | | | | | | | | |
| | | | | | | | | | | | | | | | | | | |
| | | | | | | | | | | | | | | | | | | |
| | | | | | | | | | | | | | | | | | | |
| | | | | | | | | | | | | | | | | | | |
| | | | | | | | | | | | | | | | | | | |
| | | | | | | | | | | | | | | | | | | |
| | | | | | | | | | | | | | | | | | | |
| | | | | | | | | | | | | | | | | | | |
| | | | | | | | | | | | | | | | | | | |
| | | | | | | | | | | | | | | | | | | |
| | | | | | | | | | | | | | | | | | | |
| | | | | | | | | | | | | | | | | | | |
| | | | | | | | | | | | | | | | | | | |
| | | | | | | | | | | | | | | | | | | |
| | | | | | | | | | | | | | | | | | | |
| | | | | | | | | | | | | | | | | | | |
| | | | | | | | | | | | | | | | | | | |
| | | | | | | | | | | | | | | | | | | |
| | | | | | | | | | | | | | | | | | | |
| | | | | | | | | | | | | | | | | | | |
| | | | | | | | | | | | | | | | | | | |
| | | | | | | | | | | | | | | | | | | |
| | | | | | | | | | | | | | | | | | | |
| | | | | | | | | | | | | | | | | | | |
| | | | | | | | | | | | | | | | | | | |
| | | | | | | | | | | | | | | | | | | |
| | | | | | | | | | | | | | | | | | | |
| | | | | | | | | | | | | | | | | | | |
| | | | | | | | | | | | | | | | | | | |
| | | | | | | | | | | | | | | | | | | |
| | | | | | | | | | | | | | | | | | | |
(1)Includes customers acquired in connection with the Merger and certain customer base adjustments. See Customer Base Adjustments and Net Customer Additions (Losses) tables.
(2)On July 18, 2019, we entered into an agreement whereby certain T-Mobile prepaid products will now be offered and distributed by a current MVNO partner. As a result, we included a base adjustment in Q3 2019 to reduce prepaid customers by 616,000.
| | | | | | | | | | | | | | | | | | | | | | | | | | | | | | | | | | | | | | | | | | | | | | | | | | | | | | | | | | | |
| Quarter | | Year Ended December 31, |
| (in thousands) | Q1 2019 | | Q2 2019 | | Q3 2019 | | Q4 2019 | | Q1 2020 | | Q2 2020 | | Q3 2020 | | Q4 2020 | | 2019 | | 2020 |
| Net customer additions (losses) | | | | | | | | | | | | | | | | | | | |
| | | | | | | | | | | | | | | | | | | |
| Postpaid phone customers | 656 | | | 710 | | | 754 | | | 1,001 | | | 452 | | | 253 | | | 689 | | | 824 | | | 3,121 | | | 2,218 | |
| Postpaid other customers | 363 | | | 398 | | | 320 | | | 313 | | | 325 | | | 859 | | | 1,290 | | | 794 | | | 1,394 | | | 3,268 | |
| | | | | | | | | | | | | | | | | | | |
| Total postpaid customers | 1,019 | | | 1,108 | | | 1,074 | | | 1,314 | | | 777 | | | 1,112 | | | 1,979 | | | 1,618 | | | 4,515 | | | 5,486 | |
| | | | | | | | | | | | | | | | | | | |
Prepaid customers (1) | 69 | | | 131 | | | 62 | | | 77 | | | (128) | | | 133 | | | 56 | | | 84 | | | 339 | | | 145 | |
| | | | | | | | | | | | | | | | | | | |
| Total customers | 1,088 | | | 1,239 | | | 1,136 | | | 1,391 | | | 649 | | | 1,245 | | | 2,035 | | | 1,702 | | | 4,854 | | | 5,631 | |
| Acquired customers, net of base adjustments | — | | | — | | | — | | | — | | | — | | | 29,228 | | | — | | | — | | | — | | | 29,228 | |
| | | | | | | | | | | | | | | | | | | |
| | | | | | | | | | | | | | | | | | | |
| | | | | | | | | | | | | | | | | | | |
| | | | | | | | | | | | | | | | | | | |
| | | | | | | | | | | | | | | | | | | |
| | | | | | | | | | | | | | | | | | | |
| | | | | | | | | | | | | | | | | | | |
| | | | | | | | | | | | | | | | | | | |
| | | | | | | | | | | | | | | | | | | |
| | | | | | | | | | | | | | | | | | | |
| | | | | | | | | | | | | | | | | | | |
| | | | | | | | | | | | | | | | | | | |
| | | | | | | | | | | | | | | | | | | |
| | | | | | | | | | | | | | | | | | | |
| | | | | | | | | | | | | | | | | | | |
| | | | | | | | | | | | | | | | | | | |
| | | | | | | | | | | | | | | | | | | |
| | | | | | | | | | | | | | | | | | | |
| | | | | | | | | | | | | | | | | | | |
| | | | | | | | | | | | | | | | | | | |
| | | | | | | | | | | | | | | | | | | |
| | | | | | | | | | | | | | | | | | | |
| | | | | | | | | | | | | | | | | | | |
| | | | | | | | | | | | | | | | | | | |
| | | | | | | | | | | | | | | | | | | |
| | | | | | | | | | | | | | | | | | | |
| | | | | | | | | | | | | | | | | | | |
| | | | | | | | | | | | | | | | | | | |
| | | | | | | | | | | | | | | | | | | |
| | | | | | | | | | | | | | | | | | | |
| | | | | | | | | | | | | | | | | | | |
| | | | | | | | | | | | | | | | | | | |
| | | | | | | | | | | | | | | | | | | |
| | | | | | | | | | | | | | | | | | | |
| | | | | | | | | | | | | | | | | | | |
| | | | | | | | | | | | | | | | | | | |
| | | | | | | | | | | | | | | | | | | |
| | | | | | | | | | | | | | | | | | | |
| | | | | | | | | | | | | | | | | | | |
| | | | | | | | | | | | | | | | | | | |
| | | | | | | | | | | | | | | | | | | |
| | | | | | | | | | | | | | | | | | | |
(1)On July 18, 2019, we entered into an agreement whereby certain T-Mobile prepaid products will now be offered and distributed by a current MVNO partner. As a result, we included a base adjustment in Q3 2019 to reduce prepaid customers by 616,000.
| | | | | | | | | | | | | | | | | | | | | | | | | | | | | | | | | | | | | | | | | | | | | | | | | | | | | | | | | | | |
| Quarter | | Year Ended December 31, |
| (in millions, except percentages) | Q1 2019 | | Q2 2019 | | Q3 2019 | | Q4 2019 | | Q1 2020 | | Q2 2020 | | Q3 2020 | | Q4 2020 | | 2019 | | 2020 |
| Devices sold or leased | | | | | | | | | | | | | | | | | | | |
| Phones | 7.4 | | 6.5 | | 7.4 | | 8.3 | | 6.4 | | 8.9 | | 9.2 | | 10.1 | | 29.6 | | 34.6 |
| Mobile broadband and IoT devices | 0.6 | | 0.6 | | 0.6 | | 0.8 | | 0.8 | | 1.2 | | 2.2 | | 1.6 | | 2.6 | | 5.8 |
| Total | 8.0 | | 7.1 | | 8.0 | | 9.1 | | 7.2 | | 10.1 | | 11.4 | | 11.7 | | 32.2 | | 40.4 |
| | | | | | | | | | | | | | | | | | | |
| Postpaid upgrade rate | 4.9 | % | | 4.5 | % | | 4.7 | % | | 5.6 | % | | 3.8 | % | | 4.5 | % | | 4.3 | % | | 5.7 | % | | 21.0 | % | | 18.7 | % |
| | | | | | | | | | | | | | | | | | | | | | | | | | | | | | | | | | | | | | | | | | | | | | | | | | | | | | | | | | | |
| Quarter | | Year Ended December 31, |
| Q1 2019 | | Q2 2019 | | Q3 2019 | | Q4 2019 | | Q1 2020 | | Q2 2020 | | Q3 2020 | | Q4 2020 | | 2019 | | 2020 |
| Churn | | | | | | | | | | | | | | | | | | | |
| Postpaid phone churn | 0.88 | % | | 0.78 | % | | 0.89 | % | | 1.01 | % | | 0.86 | % | | 0.80 | % | | 0.90 | % | | 1.03 | % | | 0.89 | % | | 0.90 | % |
| Prepaid churn | 3.85 | % | | 3.49 | % | | 3.98 | % | | 3.97 | % | | 3.52 | % | | 2.81 | % | | 2.86 | % | | 2.92 | % | | 3.82 | % | | 3.03 | % |
| | | | | | | | | | | | | | | | | | | | | | | | | | | | | | | | | | | | | | | | | | | | | | | | | | | | | | | | | | | |
| Quarter | | Year Ended December 31, |
| (in thousands) | Q1 2019 | | Q2 2019 | | Q3 2019 | | Q4 2019 | | Q1 2020 | | Q2 2020 | | Q3 2020 | | Q4 2020 | | 2019 | | 2020 |
| Accounts, end of period | | | | | | | | | | | | | | | | | | | |
Total postpaid customer accounts (1) | 14,234 | | 14,480 | | 14,734 | | 15,047 | | 15,244 | | 25,486 | | 25,623 | | 25,754 | | 15,047 | | 25,754 |
| | | | | | | | | | | | | | | | | | | |
| | | | | | | | | | | | | | | | | | | |
(1)Includes accounts acquired in connection with the Merger and certain account base adjustments. See Reconciliations to Beginning Customers and Accounts in this Investor Factbook.
T-Mobile US, Inc.
Supplementary Operating and Financial Data (continued)
(Unaudited)
| | | | | | | | | | | | | | | | | | | | | | | | | | | | | | | | | | | | | | | | | | | | | | | | | | | | | | | | | | | |
| Quarter | | Year Ended December 31, |
| (in millions, except percentages) | Q1 2019 | | Q2 2019 | | Q3 2019 | | Q4 2019 | | Q1 2020 | | Q2 2020 | | Q3 2020 | | Q4 2020 | | 2019 | | 2020 |
| Financial Measures | | | | | | | | | | | | | | | | | | | |
| | | | | | | | | | | | | | | | | | | |
| Service revenues | $ | 8,391 | | | $ | 8,546 | | | $ | 8,713 | | | $ | 8,850 | | | $ | 8,846 | | | $ | 13,230 | | | $ | 14,139 | | | $ | 14,180 | | | $ | 34,500 | | | $ | 50,395 | |
| Total revenues | 11,080 | | | 10,979 | | | 11,061 | | | 11,878 | | | 11,113 | | | 17,671 | | | 19,272 | | | 20,341 | | | 44,998 | | | 68,397 | |
| | | | | | | | | | | | | | | | | | | |
| Net income | $ | 908 | | | $ | 939 | | | $ | 870 | | | $ | 751 | | | $ | 951 | | | $ | 110 | | | $ | 1,253 | | | $ | 750 | | | $ | 3,468 | | | $ | 3,064 | |
| Net income margin | 10.8 | % | | 11.0 | % | | 10.0 | % | | 8.5 | % | | 10.8 | % | | 0.8 | % | | 8.9 | % | | 5.3 | % | | 10.1 | % | | 6.1 | % |
| | | | | | | | | | | | | | | | | | | |
| Adjusted EBITDA | $ | 3,284 | | | $ | 3,461 | | | $ | 3,396 | | | $ | 3,242 | | | $ | 3,665 | | | $ | 7,017 | | | $ | 7,129 | | | $ | 6,746 | | | $ | 13,383 | | | $ | 24,557 | |
| Adjusted EBITDA margin | 39.1 | % | | 40.5 | % | | 39.0 | % | | 36.6 | % | | 41.4 | % | | 53.0 | % | | 50.4 | % | | 47.6 | % | | 38.8 | % | | 48.7 | % |
| | | | | | | | | | | | | | | | | | | |
| Cost of services | $ | 1,546 | | | $ | 1,649 | | | $ | 1,733 | | | $ | 1,694 | | | $ | 1,639 | | | $ | 3,098 | | | $ | 3,314 | | | $ | 3,827 | | | $ | 6,622 | | | $ | 11,878 | |
| Merger-related costs | — | | | — | | | — | | | — | | | — | | | 40 | | | 79 | | | 527 | | | — | | | 646 | |
| Cost of services excluding Merger-related costs | $ | 1,546 | | | $ | 1,649 | | | $ | 1,733 | | | $ | 1,694 | | | $ | 1,639 | | | $ | 3,058 | | | $ | 3,235 | | | $ | 3,300 | | | $ | 6,622 | | | $ | 11,232 | |
| | | | | | | | | | | | | | | | | | | |
| Selling, general and administrative | $ | 3,442 | | | $ | 3,543 | | | $ | 3,498 | | | $ | 3,656 | | | $ | 3,688 | | | $ | 5,604 | | | $ | 4,876 | | | $ | 4,758 | | | $ | 14,139 | | | $ | 18,926 | |
| Merger-related costs | 113 | | | 222 | | | 159 | | | 126 | | | 143 | | | 758 | | | 209 | | | 153 | | | 620 | | | 1,263 | |
COVID-19-related costs (1) | — | | | — | | | — | | | — | | | 117 | | | 341 | | | — | | | — | | | — | | | 458 | |
| Selling, general and administrative excluding Merger-related costs and COVID-19-related costs | $ | 3,329 | | | $ | 3,321 | | | $ | 3,339 | | | $ | 3,530 | | | $ | 3,428 | | | $ | 4,505 | | | $ | 4,667 | | | $ | 4,605 | | | $ | 13,519 | | | $ | 17,205 | |
| | | | | | | | | | | | | | | | | | | |
| Total bad debt expense and losses from sales of receivables | $ | 108 | | | $ | 99 | | | $ | 102 | | | $ | 128 | | | $ | 138 | | | $ | 263 | | | $ | 125 | | | $ | 112 | | | $ | 437 | | | $ | 638 | |
| Bad debt and losses from sales of receivables as a percentage of Total revenues | 0.98 | % | | 0.90 | % | | 0.92 | % | | 1.07 | % | | 1.24 | % | | 1.49 | % | | 0.65 | % | | 0.55 | % | | 0.97 | % | | 0.93 | % |
| | | | | | | | | | | | | | | | | | | |
| Cash purchases of property and equipment including capitalized interest | $ | 1,931 | | | $ | 1,789 | | | $ | 1,514 | | | $ | 1,157 | | | $ | 1,753 | | | $ | 2,257 | | | $ | 3,217 | | | $ | 3,807 | | | $ | 6,391 | | | $ | 11,034 | |
| Capitalized interest | 118 | | | 125 | | | 118 | | | 112 | | | 112 | | | 119 | | | 108 | | | 101 | | | 473 | | | 440 | |
| | | | | | | | | | | | | | | | | | | |
| Net cash proceeds from securitization | (18) | | | 95 | | | (3) | | | (9) | | | (5) | | | (99) | | | 5 | | | (130) | | | 65 | | | (229) | |
(1)Supplemental employee payroll, third-party commissions and cleaning-related COVID-19 costs were not significant for Q3 and Q4 2020.
| | | | | | | | | | | | | | | | | | | | | | | | | | | | | | | | | | | | | | | | | | | | | | | | | | | | | | | | | | | |
| Quarter | | Year Ended December 31, |
| (in millions, except percentages) | Q1 2019 | | Q2 2019 | | Q3 2019 | | Q4 2019 | | Q1 2020 | | Q2 2020 | | Q3 2020 | | Q4 2020 | | 2019 | | 2020 |
| Device Financing - Equipment Installment Plans | | | | | | | | | | | | | | | | | | | |
| Gross EIP financed | $ | 1,742 | | | $ | 1,625 | | | $ | 1,535 | | | $ | 2,235 | | | $ | 1,440 | | | $ | 1,825 | | | $ | 2,356 | | | $ | 4,126 | | | $ | 7,137 | | | $ | 9,747 | |
| EIP billings | 1,663 | | | 1,645 | | | 1,688 | | | 1,762 | | | 1,790 | | | 2,217 | | | 2,130 | | | 2,285 | | | 6,758 | | | 8,422 | |
| EIP receivables, net | 4,128 | | | 4,050 | | | 3,894 | | | 4,183 | | | 3,773 | | | 4,593 | | | 4,481 | | | 5,608 | | | 4,183 | | | 5,608 | |
| EIP receivables classified as prime | 46 | % | | 50 | % | | 51 | % | | 53 | % | | 52 | % | | 48 | % | | 53 | % | | 57 | % | | 53 | % | | 57 | % |
| EIP receivables classified as prime (including EIP receivables sold) | 52 | % | | 52 | % | | 52 | % | | 53 | % | | 53 | % | | 50 | % | | 54 | % | | 57 | % | | 53 | % | | 57 | % |
| | | | | | | | | | | | | | | | | | | |
| Device Financing - Leased Devices | | | | | | | | | | | | | | | | | | | |
| Lease revenues | $ | 161 | | | $ | 143 | | | $ | 142 | | | $ | 153 | | | $ | 165 | | | $ | 1,421 | | | $ | 1,350 | | | $ | 1,245 | | | $ | 599 | | | $ | 4,181 | |
| Leased device depreciation | 184 | | | 125 | | | 108 | | | 126 | | | 163 | | | 946 | | | 1,000 | | | 982 | | | 543 | | | 3,091 | |
| Leased devices transferred from inventory to property and equipment | 147 | | | 167 | | | 298 | | | 394 | | | 309 | | | 1,444 | | | 599 | | | 443 | | | 1,006 | | | 2,795 | |
| Returned leased devices transferred from property and equipment to inventory | (57) | | | (67) | | | (65) | | | (78) | | | (59) | | | (538) | | | (433) | | | (430) | | | (267) | | | (1,460) | |
| Leased devices included in property and equipment, net | 442 | | | 418 | | | 543 | | | 732 | | | 819 | | | 6,621 | | | 5,788 | | | 4,819 | | | 732 | | | 4,819 | |
| Leased devices (units) included in property and equipment, net | 2.4 | | 2.0 | | 2.0 | | 2.1 | | 2.1 | | 17.0 | | 15.8 | | 14.2 | | 2.1 | | 14.2 |
T-Mobile US, Inc.
Calculation of Operating Measures
(Unaudited)
The following table illustrates the calculation of our operating measures ARPA and ARPU from the related service revenues:
| | | | | | | | | | | | | | | | | | | | | | | | | | | | | | | | | | | | | | | | | | | | | | | | | | | | | | | | | | | |
| (in millions, except average number of accounts and customers, ARPA and ARPU) | Quarter | | Year Ended December 31, |
| Q1 2019 | | Q2 2019 | | Q3 2019 | | Q4 2019 | | Q1 2020 | | Q2 2020 | | Q3 2020 | | Q4 2020 | | 2019 | | 2020 |
| Calculation of Postpaid ARPA | | | | | | | | | | | | | | | | | | | |
| Postpaid service revenues | $ | 5,493 | | | $ | 5,613 | | | $ | 5,746 | | | $ | 5,821 | | | $ | 5,887 | | | $ | 9,959 | | | $ | 10,209 | | | $ | 10,251 | | | $ | 22,673 | | | $ | 36,306 | |
| Divided by: Average number of postpaid accounts (in thousands) and number of months in period | 14,108 | | | 14,354 | | | 14,602 | | | 14,881 | | | 15,155 | | | 25,424 | | | 25,582 | | | 25,677 | | | 14,486 | | | 22,959 | |
| Postpaid ARPA | $ | 129.77 | | | $ | 130.36 | | | $ | 131.15 | | | $ | 130.39 | | | $ | 129.47 | | | $ | 130.57 | | | $ | 133.03 | | | $ | 133.08 | | | $ | 130.43 | | | $ | 131.78 | |
| Calculation of Postpaid Phone ARPU | | | | | | | | | | | | | | | | | | | |
| | | | | | | | | | | | | | | | | | | |
| Postpaid service revenues | $ | 5,493 | | | $ | 5,613 | | | $ | 5,746 | | | $ | 5,821 | | | $ | 5,887 | | | $ | 9,959 | | | $ | 10,209 | | | $ | 10,251 | | | $ | 22,673 | | | $ | 36,306 | |
| Less: Postpaid other revenues | (310) | | | (326) | | | (346) | | | (362) | | | (310) | | | (618) | | | (677) | | | (762) | | | (1,344) | | | (2,367) | |
| | | | | | | | | | | | | | | | | | | |
| Postpaid phone service revenues | 5,183 | | | 5,287 | | | 5,400 | | | 5,459 | | | 5,577 | | | 9,341 | | | 9,532 | | | 9,489 | | | 21,329 | | | 33,939 | |
| Divided by: Average number of postpaid phone customers (in thousands) and number of months in period | 37,504 | | 38,226 | | 38,944 | | 39,736 | | 40,585 | | 64,889 | | 65,437 | | 66,084 | | 38,602 | | 59,249 |
| Postpaid phone ARPU | $ | 46.07 | | | $ | 46.10 | | | $ | 46.22 | | | $ | 45.79 | | | $ | 45.80 | | | $ | 47.99 | | | $ | 48.55 | | | $ | 47.86 | | | $ | 46.04 | | | $ | 47.74 | |
| Calculation of Prepaid ARPU | | | | | | | | | | | | | | | | | | | |
| | | | | | | | | | | | | | | | | | | |
| Prepaid service revenues | $ | 2,386 | | | $ | 2,379 | | | $ | 2,385 | | | $ | 2,393 | | | $ | 2,373 | | | $ | 2,311 | | | $ | 2,383 | | | $ | 2,354 | | | $ | 9,543 | | | $ | 9,421 | |
| Divided by: Average number of prepaid customers (in thousands) and number of months in period | 21,122 | | | 21,169 | | | 20,837 | | | 20,691 | | | 20,759 | | | 20,380 | | | 20,632 | | | 20,605 | | | 20,955 | | | 20,594 | |
| | | | | | | | | | | | | | | | | | | |
| Prepaid ARPU | $ | 37.65 | | | $ | 37.46 | | | $ | 38.16 | | | $ | 38.54 | | | $ | 38.11 | | | $ | 37.80 | | | $ | 38.49 | | | $ | 38.08 | | | $ | 37.95 | | | $ | 38.12 | |
| | | | | | | | | | | | | | | | | | | |
| | | | | | | | | | | | | | | | | | | |
| | | | | | | | | | | | | | | | | | | |
| | | | | | | | | | | | | | | | | | | |
| | | | | | | | | | | | | | | | | | | |
| | | | | | | | | | | | | | | | | | | |
| | | | | | | | | | | | | | | | | | | |
| | | | | | | | | | | | | | | | | | | |
| | | | | | | | | | | | | | | | | | | |
| | | | | | | | | | | | | | | | | | | |
| | | | | | | | | | | | | | | | | | | |
| | | | | | | | | | | | | | | | | | | |
| | | | | | | | | | | | | | | | | | | |
| | | | | | | | | | | | | | | | | | | |
| | | | | | | | | | | | | | | | | | | |
| | | | | | | | | | | | | | | | | | | |
| | | | | | | | | | | | | | | | | | | |
| | | | | | | | | | | | | | | | | | | |
| | | | | | | | | | | | | | | | | | | |
| | | | | | | | | | | | | | | | | | | |
| | | | | | | | | | | | | | | | | | | |
T-Mobile US, Inc.
Reconciliation of Non-GAAP Financial Measures to GAAP Financial Measures
(Unaudited)
This Investor Factbook includes non-GAAP financial measures. The non-GAAP financial measures should be considered in addition to, but not as a substitute for, the information provided in accordance with GAAP. Reconciliations for the non-GAAP financial measures to the most directly comparable GAAP financial measures are provided below. T-Mobile is not able to forecast Net income on a forward-looking basis without unreasonable efforts due to the high variability and difficulty in predicting certain items that affect GAAP net income including, but not limited to, Income tax expense, stock-based compensation expense and Interest expense. Core Adjusted EBITDA and Adjusted EBITDA should not be used to predict Net income as the difference between these measures and Net income is variable.
The following table includes the impact of the Sprint merger on a prospective basis from the close date of April 1, 2020. Historical results have not been restated and reflect standalone T-Mobile.
Adjusted EBITDA is reconciled to Net income as follows:
| | | | | | | | | | | | | | | | | | | | | | | | | | | | | | | | | | | | | | | | | | | | | | | | | | | | | | | | | | | | | | | |
| Quarter | | Year Ended December 31, | | | | |
| (in millions) | Q1 2019 | | Q2 2019 | | Q3 2019 | | Q4 2019 | | Q1 2020 | | Q2 2020 | | Q3 2020 | | Q4 2020 | | 2019 | | 2020 | | | | |
| Net income | $ | 908 | | | $ | 939 | | | $ | 870 | | | $ | 751 | | | $ | 951 | | | $ | 110 | | | $ | 1,253 | | | $ | 750 | | | $ | 3,468 | | | $ | 3,064 | | | | | |
| Adjustments: | | | | | | | | | | | | | | | | | | | | | | | |
| Income from discontinued operations, net of tax | — | | | — | | | — | | | — | | | — | | | (320) | | | — | | | — | | | — | | | (320) | | | | | |
| Income from continuing operations | 908 | | | 939 | | | 870 | | | 751 | | | 951 | | | (210) | | | 1,253 | | | 750 | | | 3,468 | | | 2,744 | | | | | |
| Interest expense | 179 | | | 182 | | | 184 | | | 182 | | | 185 | | | 776 | | | 765 | | | 757 | | | 727 | | | 2,483 | | | | | |
| Interest expense to affiliates | 109 | | | 101 | | | 100 | | | 98 | | | 99 | | | 63 | | | 44 | | | 41 | | | 408 | | | 247 | | | | | |
| Interest income | (8) | | | (4) | | | (5) | | | (7) | | | (12) | | | (6) | | | (3) | | | (8) | | | (24) | | | (29) | | | | | |
| Other (income) expense, net | (7) | | | 22 | | | (3) | | | (4) | | | 10 | | | 195 | | | 99 | | | 101 | | | 8 | | | 405 | | | | | |
| Income tax expense | 295 | | | 301 | | | 325 | | | 214 | | | 306 | | | 2 | | | 407 | | | 71 | | | 1,135 | | | 786 | | | | | |
| | | | | | | | | | | | | | | | | | | | | | | |
| Operating income | 1,476 | | | 1,541 | | | 1,471 | | | 1,234 | | | 1,539 | | | 820 | | | 2,565 | | | 1,712 | | | 5,722 | | | 6,636 | | | | | |
| Depreciation and amortization | 1,600 | | | 1,585 | | | 1,655 | | | 1,776 | | | 1,718 | | | 4,064 | | | 4,150 | | | 4,219 | | | 6,616 | | | 14,151 | | | | | |
Operating income from discontinued operations (1) | — | | | — | | | — | | | — | | | — | | | 432 | | | — | | | — | | | — | | | 432 | | | | | |
Stock-based compensation (2) | 93 | | | 111 | | | 108 | | | 111 | | | 123 | | | 139 | | | 125 | | | 129 | | | 423 | | | 516 | | | | | |
| Merger-related costs | 113 | | | 222 | | | 159 | | | 126 | | | 143 | | | 798 | | | 288 | | | 686 | | | 620 | | | 1,915 | | | | | |
COVID-19-related costs (3) | — | | | — | | | — | | | — | | | 117 | | | 341 | | | — | | | — | | | — | | | 458 | | | | | |
| Impairment expense | — | | | — | | | — | | | — | | | — | | | 418 | | | — | | | — | | | — | | | 418 | | | | | |
Other, net (4) | 2 | | | 2 | | | 3 | | | (5) | | | 25 | | | 5 | | | 1 | | | — | | | 2 | | | 31 | | | | | |
| | | | | | | | | | | | | | | | | | | | | | | |
| Adjusted EBITDA | $ | 3,284 | | | $ | 3,461 | | | $ | 3,396 | | | $ | 3,242 | | | $ | 3,665 | | | $ | 7,017 | | | $ | 7,129 | | | $ | 6,746 | | | $ | 13,383 | | | $ | 24,557 | | | | | |
| | | | | | | | | | | | | | | | | | | | | | | |
| | | | | | | | | | | | | | | | | | | | | | | |
| | | | | | | | | | | | | | | | | | | | | | | |
| | | | | | | | | | | | | | | | | | | | | | | |
| | | | | | | | | | | | | | | | | | | | | | | |
| | | | | | | | | | | | | | | | | | | | | | | |
| | | | | | | | | | | | | | | | | | | | | | | |
| | | | | | | | | | | | | | | |
| | | | | | | | | | | | | | | | | | | | | | | |
| | | | | | | | | | | | | | | | | | | | | | | |
| | | | | | | | | | | | | | | | | | | | | | | |
| | | | | | | | | | | | | | | | | | | | | | | |
| | | | | | | | | | | | | | | | | | | | | | | |
| | | | | | | | | | | | | | | | | | | | | | | |
| | | | | | | | | | | | | | | | | | | | | | | |
| | | | | | | | | | | | | | | | | | | | | | | |
| | | | | | | | | | | | | | | | | | | | | | | |
| | | | | | | | | | | | | | | | | | | | | | | |
| | | | | | | | | | | | | | | | | | | | | | | |
| | | | | | | | | | | | | | | | | | | | | | | |
| | | | | | | | | | | | | | | | | | | | | | | |
| | | | | | | | | | | | | | | | | | | | | | | |
| | | | | | | | | | | | | | | | | | | | | | | |
| | | | | | | | | | | | | | | | | | | | | | | |
| | | | | | | | | | | | | | | | | | | | | | | |
| | | | | | | | | | | | | | | | | | | | | | | |
| | | | | | | | | | | | | | | | | | | | | | | |
| | | | | | | | | | | | | | | | | | | | | | | |
| | | | | | | | | | | | | | | | | | | | | | | |
| | | | | | | | | | | | | | | | | | | | | | | |
| | | | | | | | | | | | | | | | | | | | | | | |
| | | | | | | | | | | | | | | | | | | | | | | |
| | | | | | | | | | | | | | | | | | | | | | | |
| | | | | | | | | | | | | | | | | | | | | | | |
| | | | | | | | | | | | | | | | | | | | | | | |
| | | | | | | | | | | | | | | | | | | | | | | |
| | | | | | | | | | | | | | | | | | | | | | | |
| | | | | | | | | | | | | | | | | | | | | | | |
| | | | | | | | | | | | | | | | | | | | | | | |
(1)Following the Prepaid Transaction (as defined below), starting on July 1, 2020, we will provide MVNO services to DISH. We have included the operating income from discontinued operations in our determination of the Adjusted EBITDA to reflect contributions of the Prepaid Business that will be replaced by the MVNO Agreement beginning on July 1, 2020 in order to enable management, analysts and investors to better assess ongoing operating performance and trends.
(2)Stock-based compensation includes payroll tax impacts and may not agree to stock-based compensation expense in the Condensed Consolidated Financial Statements. Additionally, certain stock-based compensation expenses associated with the Sprint merger have been included in Merger-related costs.
(3)Supplemental employee payroll, third-party commissions and cleaning-related COVID-19 costs were not significant for Q3 and Q4 2020.
(4)Other, net may not agree to the Consolidated Statements of Comprehensive Income primarily due to certain non-routine operating activities, such as other special items that would not be expected to reoccur or are not reflective of T-Mobile’s ongoing operating performance, and are therefore excluded in Adjusted EBITDA.
T-Mobile US, Inc.
Reconciliation of Non-GAAP Financial Measures to GAAP Financial Measures (continued)
(Unaudited)
Net debt (excluding tower obligations) to the last twelve months Adjusted EBITDA ratios is calculated as follows:
| | | | | | | | | | | | | | | | | | | | | | | | | | | | | | | | | | | | | | | | | | | | | | | |
| (in millions, except net debt ratios) | Mar 31,
2019 | | Jun 30,
2019 | | Sep 30,
2019 | | Dec 31,
2019 | | Mar 31,
2020 | | Jun 30,
2020 | | Sep 30,
2020 | | Dec 31,
2020 |
| | | | | | | | | | | | | | | |
| Short-term debt | $ | 250 | | | $ | 300 | | | $ | 475 | | | $ | 25 | | | $ | — | | | $ | 3,818 | | | $ | 3,713 | | | $ | 4,579 | |
| Short-term debt to affiliates | 598 | | | — | | | — | | | — | | | 2,000 | | | 1,235 | | | — | | | — | |
| Short-term financing lease liabilities | 911 | | | 963 | | | 1,013 | | | 957 | | | 918 | | | 1,040 | | | 1,050 | | | 1,063 | |
| Long-term debt | 10,952 | | | 10,954 | | | 10,956 | | | 10,958 | | | 10,959 | | | 62,783 | | | 58,345 | | | 61,830 | |
| Long-term debt to affiliates | 13,985 | | | 13,985 | | | 13,986 | | | 13,986 | | | 11,987 | | | 4,706 | | | 4,711 | | | 4,716 | |
| Financing lease liabilities | 1,224 | | | 1,314 | | | 1,440 | | | 1,346 | | | 1,276 | | | 1,416 | | | 1,373 | | | 1,444 | |
| Less: Cash and cash equivalents | (1,439) | | | (1,105) | | | (1,653) | | | (1,528) | | | (1,112) | | | (11,076) | | | (6,571) | | | (10,385) | |
| | | | | | | | | | | | | | | |
| Net debt (excluding tower obligations) | $ | 26,481 | | | $ | 26,411 | | | $ | 26,217 | | | $ | 25,744 | | | $ | 26,028 | | | $ | 63,922 | | | $ | 62,621 | | | $ | 63,247 | |
| | | | | | | | | | | | | | | |
| | | | | | | | | | | | | | | |
| | | | | | | | | | | | | | | |
| | | | | | | | | | | | | | | |
| Divided by: Last twelve months Pro Forma Adjusted EBITDA | | | | | | | | | | | $ | 26,250 | | | $ | 26,975 | | | $ | 27,543 | |
| Net debt (excluding tower obligations) to last twelve months Pro Forma Adjusted EBITDA Ratio | | | | | | | | | | | 2.4 | | | 2.3 | | | 2.3 | |
| | | | | | | | | | | | | | | |
| | | | | | | | | | | | | | | |
| | | | | | | | | | | | | | | |
| | | | | | | | | | | | | | | |
| | | | | | | | | | | | | | | |
| | | | | | | | | | | | | | | |
| | | | | | | | | | | | | | | |
| | | | | | | | | | | | | | | |
| | | | | | | | | | | | | | | |
| | | | | | | | | | | | | | | |
| | | | | | | | | | | | | | | |
| | | | | | | | | | | | | | | |
| | | | | | | | | | | | | | | |
LTM Adjusted EBITDA reflects combined company results of New T-Mobile for Q4 2020, Q3 2020 and Q2 2020 and standalone T-Mobile for prior periods. To illustrate the twelve month results of the combined company as if the Merger had closed on January 1, 2019, we have presented pro forma LTM Adjusted EBITDA ratios. Pro forma LTM Adjusted EBITDA for the LTM period ended December 31, 2020 is calculated as the sum of Q4 2020, Q3 2020 and Q2 2020 actual Adjusted EBITDA of $6.7 billion, $7.1 billion and $7.0 billion, respectively, plus the Pro forma Adjusted EBITDA from Q1 2020 of $6.7 billion. The same method applies to Pro forma LTM Adjusted EBITDA for the LTM periods ended September 30 and June 30, 2020. These metrics are provided for illustrative purposes only and do not purport to represent what the actual consolidated results would have been had the Merger actually occurred on the date indicated, nor do they purport to project the future consolidated results of operations or consolidated financial condition for any future period or as of any future date. Additional information regarding pro forma adjustments is provided in Pro Forma Income Statement Metrics within this Investor Factbook.
Free Cash Flow and Free Cash Flow, excluding gross payments for the settlement of interest rate swaps, are calculated as follows:
| | | | | | | | | | | | | | | | | | | | | | | | | | | | | | | | | | | | | | | | | | | | | | | | | | | | | | | | | | | |
| Quarter | | Year Ended December 31, |
| (in millions) | Q1 2019 | | Q2 2019 | | Q3 2019 | | Q4 2019 | | Q1 2020 | | Q2 2020 | | Q3 2020 | | Q4 2020 | | 2019 | | 2020 |
| | | | | | | | | | | | | | | | | | | |
| Net cash provided by operating activities | $ | 1,392 | | | $ | 2,147 | | | $ | 1,748 | | | $ | 1,537 | | | $ | 1,617 | | | $ | 777 | | | $ | 2,772 | | | $ | 3,474 | | | $ | 6,824 | | | $ | 8,640 | |
| Cash purchases of property and equipment | (1,931) | | | (1,789) | | | (1,514) | | | (1,157) | | | (1,753) | | | (2,257) | | | (3,217) | | | (3,807) | | | (6,391) | | | (11,034) | |
| Proceeds related to beneficial interests in securitization transactions | 1,157 | | | 839 | | | 900 | | | 980 | | | 868 | | | 602 | | | 855 | | | 809 | | | 3,876 | | | 3,134 | |
| Proceeds from sales of tower sites | — | | | — | | | — | | | 38 | | | — | | | — | | | — | | | — | | | 38 | | | — | |
| Cash payments for debt prepayment or debt extinguishment costs | — | | | (28) | | | — | | | — | | | — | | | (24) | | | (58) | | | — | | | (28) | | | (82) | |
| | | | | | | | | | | | | | | | | | | |
| Free Cash Flow | 618 | | | 1,169 | | | 1,134 | | | 1,398 | | | 732 | | | (902) | | | 352 | | | 476 | | | 4,319 | | | 658 | |
| Gross cash paid for the settlement of interest rate swaps | — | | | — | | | — | | | — | | | — | | | 2,343 | | | — | | | — | | | — | | | 2,343 | |
| Free Cash Flow, excluding gross payments for the settlement of interest rate swaps | $ | 618 | | | $ | 1,169 | | | $ | 1,134 | | | $ | 1,398 | | | $ | 732 | | | $ | 1,441 | | | $ | 352 | | | $ | 476 | | | $ | 4,319 | | | $ | 3,001 | |
| | | | | | | | | | | | | | | | | | | |
| | | | | | | | | | | | | | | | | | | |
| | | | | | | | | | | | | | | | | | | |
| | | | | | | | | | | | | | | | | | | |
| | | | | | | | | | | | | | | | | | | |
| | | | | | | | | | | | | | | | | | | |
| | | | | | | | | | | | | | | | | | | |
| | | | | | | | | | | | | | | | | | | |
| | | | | | | | | | | | | | | | | | | |
| | | | | | | | | | | | | | | | | | | |
| | | | | | | | | | | | | | | | | | | |
| | | | | | | | | | | | | | | | | | | |
| | | | | | | | | | | | | | | | | | | |
| | | | | | | | | | | | | | | | | | | |
| | | | | | | | | | | | | | | | | | | |
| | | | | | | | | | | | | | | | | | | |
| | | | | | | | | | | | | | | | | | | |
| | | | | | | | | | | | | | | | | | | |
| | | | | | | | | | | | | | | | | | | |
| | | | | | | | | | | | | | | | | | | |
| | | | | | | | | | | | | | | | | | | |
| | | | | | | | | | | | | | | | | | | |
| | | | | | | | | | | | | | | | | | | |
| | | | | | | | | | | | | | | | | | | |
| | | | | | | | | | | | | | | | | | | |
| | | | | | | | | | | | | | | | | | | |
| | | | | | | | | | | | | | | | | | | |
| | | | | | | | | | | | | | | | | | | |
T-Mobile US, Inc.
Reconciliation of Non-GAAP Financial Measures to GAAP Financial Measures (continued)
(Unaudited)
Our current guidance range for Free Cash Flow is calculated as follows:
| | | | | | | | | | | |
| FY 2021 |
| (in millions) | Current Guidance Range |
| | | |
| Net cash provided by operating activities | $ | 13,000 | | | $ | 13,500 | |
| | | |
| Cash purchases of property and equipment | (11,700) | | | (12,000) | |
Proceeds related to beneficial interests in securitization transactions (1) | 3,700 | | | 3,900 | |
| Cash payments for debt prepayment or debt extinguishment costs | (100) | | | — | |
| | | |
| Free Cash Flow | $ | 4,900 | | | $ | 5,400 | |
| | | |
| | | |
| | | |
| | | |
| | | |
| | | |
(1)Free Cash Flow guidance does not assume any material net cash inflows from securitization in 2021.
T-Mobile US, Inc.
Reconciliations to Beginning Customers and Accounts
(Unaudited)
| | | | | | | | | | | | | | | | | | | | | | | | | | | | | |
| (in thousands) | Postpaid phone customers | | Postpaid other customers | | Total postpaid customers | | Prepaid customers | | Total customers |
| Reconciliation to beginning customers | | | | | | | | | |
| T-Mobile customers as reported, end of period March 31, 2020 | 40,797 | | | 7,014 | | | 47,811 | | | 20,732 | | | 68,543 | |
| Sprint customers as reported, end of period March 31, 2020 | 25,916 | | | 8,428 | | | 34,344 | | | 8,256 | | | 42,600 | |
| Total combined customers, end of period March 31, 2020 | 66,713 | | | 15,442 | | | 82,155 | | | 28,988 | | | 111,143 | |
| Adjustments | | | | | | | | | |
Reseller reclassification to wholesale customers (1) | (199) | | | (2,872) | | | (3,071) | | | — | | | (3,071) | |
EIP reclassification from postpaid to prepaid (2) | (963) | | | — | | | (963) | | | 963 | | | — | |
Divested prepaid customers (3) | — | | | — | | | — | | | (9,207) | | | (9,207) | |
Rate plan threshold (4) | (182) | | | (918) | | | (1,100) | | | — | | | (1,100) | |
Customers with non-phone devices (5) | (226) | | | 226 | | | — | | | — | | | — | |
Collection policy alignment (6) | (150) | | | (46) | | | (196) | | | — | | | (196) | |
Miscellaneous adjustments (7) | (141) | | | (43) | | | (184) | | | (302) | | | (486) | |
| Total Adjustments | (1,861) | | | (3,653) | | | (5,514) | | | (8,546) | | | (14,060) | |
| Adjusted beginning customers as of April 1, 2020 | 64,852 | | | 11,789 | | | 76,641 | | | 20,442 | | | 97,083 | |
| | | | | | | | | |
(1)In connection with the closing of the Merger, we refined our definition of wholesale customers resulting in the reclassification of certain postpaid and prepaid reseller customers to wholesale customers. Starting with the three months ended March 31, 2020, we discontinued reporting wholesale customers to focus on postpaid and prepaid customers and wholesale revenues, which we consider more relevant than the number of wholesale customers given the expansion of M2M and IoT products.
(2)Prepaid customers with a device installment billing plan historically included as Sprint postpaid customers have been reclassified to prepaid customers to align with New T-Mobile policy.
(3)Customers associated with the Sprint wireless prepaid and Boost brands that were divested on July 1, 2020, have been excluded from our reported customers.
(4)Customers who have rate plans with monthly recurring charges which are considered insignificant have been excluded from our reported customers.
(5)Customers with postpaid phone rate plans without a phone (e.g., non-phone device) have been reclassified from postpaid phone to postpaid other customers to align with New T-Mobile policy.
(6)Certain Sprint customers subjected to collection activity for an extended period of time have been excluded from our reported customers to align with New T-Mobile policy.
(7)Miscellaneous insignificant adjustments to align with New T-Mobile policy.
| | | | | | | | |
| (in thousands) | | Postpaid Accounts |
| Reconciliation to beginning accounts | | |
| T-Mobile accounts as reported, end of period March 31, 2020 | | 15,244 | |
| Sprint accounts, end of period March 31, 2020 | | 11,246 | |
| Total combined accounts, end of period March 31, 2020 | | 26,490 | |
| Adjustments | | |
Reseller reclassification to wholesale accounts (1) | | (1) | |
EIP reclassification from postpaid to prepaid (2) | | (963) | |
Rate plan threshold (3) | | (18) | |
Collection policy alignment (4) | | (76) | |
Miscellaneous adjustments (5) | | (47) | |
| Total Adjustments | | (1,105) | |
| Adjusted beginning accounts as of April 1, 2020 | | 25,385 | |
(1)In connection with the closing of the Merger, we refined our definition of wholesale accounts resulting in the reclassification of certain postpaid and prepaid reseller accounts to wholesale accounts.
(2)Prepaid accounts with a customer with a device installment billing plan historically included as Sprint postpaid accounts have been reclassified to prepaid accounts to align with T-Mobile policy.
(3)Accounts with customers who have rate plans with monthly recurring charges which are considered insignificant have been excluded from our reported accounts.
(4)Certain Sprint accounts subjected to collection activity for an extended period of time have been excluded from our reported accounts to align with T-Mobile policy.
(5)Miscellaneous insignificant adjustments to align with T-Mobile policy.
T-Mobile US, Inc.
Pro Forma Income Statement Metrics
(Unaudited)
The following tables present certain income statement metrics on a pro forma basis as though the Merger had been completed on January 1, 2019. The unaudited pro forma income statement metrics have been prepared in accordance with Article 11 of Regulation S-X (“Article 11”) which is a different basis than the unaudited pro forma financial information included in Note 2 - Business Combinations in our Annual Report on Form 10-K for the year ended December 31, 2020. The primary difference between the Article 11 pro forma financial information and the ASC 805 pro forma financial information prepared by us is the treatment of certain one-time transaction costs, which are removed from all periods under Article 11 but are recognized as if they had been incurred in their entirety during Q1 2019 under ASC 805. The unaudited pro forma income statement metrics are provided for illustrative purposes only and do not purport to represent what the actual consolidated results of operations or consolidated financial condition would have been had the Merger actually occurred on the date indicated, nor do they purport to project the future consolidated results of operations or consolidated financial condition for any future period or as of any future date. For the purposes of this section, “Combined” means the summation of historically reported standalone GAAP amounts of T-Mobile and Sprint. “Pro forma adjustments” means adjustments to combined metrics to give effect to matters that are directly attributable to the Merger, factually supportable, and expected to have a continuing impact on the results of the combined company. “Pro forma” metrics are those that have been adjusted as required for the presentation of Article 11 pro forma information.
We are re-presenting the pro forma metrics for the three months ended September 30, 2019, December 31, 2019, and March 31, 2020, as previously disclosed in the Q2 2020 Investor Factbook, to support the reconciliation of our last twelve months pro forma Adjusted EBITDA calculations included in the Reconciliation of Non-GAAP Financial Measures to GAAP Financial Measures section of this Investor Factbook.
| | | | | | | | | | | | | | | | | |
| Three Months Ended |
| (in millions) | September 30, 2019 | | December 31, 2019 | | March 31, 2020 |
| Service revenues | | | | | |
Combined service revenues (1) | $ | 13,856 | | | $ | 14,124 | | | $ | 14,065 | |
| | | | | |
Pro forma adjustments (2) | (946) | | | (916) | | | (868) | |
| Pro forma service revenues | $ | 12,910 | | | $ | 13,208 | | | $ | 13,197 | |
| Equipment revenues (including equipment rentals) | | | | | |
Combined equipment revenues (including equipment rentals) (1) | $ | 4,708 | | | $ | 5,539 | | | $ | 4,569 | |
| | | | | |
Pro forma adjustments (2)(3) | (734) | | | (835) | | | (693) | |
| Pro forma equipment revenues (including equipment rentals) | $ | 3,974 | | | $ | 4,704 | | | $ | 3,876 | |
| Other revenues | | | | | |
Combined other revenues (1) | $ | 292 | | | $ | 295 | | | $ | 283 | |
Pro forma adjustments (4) | 67 | | | 78 | | | 52 | |
| Pro forma other revenues | $ | 359 | | | $ | 373 | | | $ | 335 | |
| Total Revenues | | | | | |
Combined total revenues (1) | $ | 18,856 | | | $ | 19,958 | | | $ | 18,917 | |
| | | | | |
| Pro forma adjustments | (1,613) | | | (1,673) | | | (1,509) | |
| Pro forma total revenues | $ | 17,243 | | | $ | 18,285 | | | $ | 17,408 | |
| Cost of services, exclusive of depreciation and amortization | | | | | |
Combined cost of services, exclusive of depreciation and amortization (1) | $ | 3,508 | | | $ | 3,412 | | | $ | 3,288 | |
| | | | | |
Pro forma adjustments (5) | (142) | | | (115) | | | (88) | |
| Pro forma cost of services, exclusive of depreciation and amortization | $ | 3,366 | | | $ | 3,297 | | | $ | 3,200 | |
| Cost of equipment sales, exclusive of depreciation and amortization | | | | | |
Combined cost of equipment sales, exclusive of depreciation and amortization (1) | $ | 4,063 | | | $ | 5,164 | | | $ | 3,947 | |
Pro forma adjustments (2)(3) | (733) | | | (823) | | | (679) | |
| Pro forma cost of equipment sales, exclusive of depreciation and amortization | $ | 3,330 | | | $ | 4,341 | | | $ | 3,268 | |
| Selling, general and administrative | | | | | |
Combined selling, general and administrative (1) | $ | 5,434 | | | $ | 5,701 | | | $ | 5,709 | |
| | | | | |
Pro forma adjustments (2)(3)(4) | (455) | | | (673) | | | (429) | |
| Pro forma selling, general and administrative | $ | 4,979 | | | $ | 5,028 | | | $ | 5,280 | |
| | | | | |
| | | | | |
T-Mobile US, Inc.
Pro Forma Income Statement Metrics (Continued)
(Unaudited)
| | | | | | | | | | | | | | | | | |
| Three Months Ended |
| (in millions) | September 30, 2019 | | December 31, 2019 | | March 31, 2020 |
| Depreciation and amortization | | | | | |
Combined depreciation and amortization (1) | $ | 3,882 | | | $ | 4,332 | | | $ | 4,061 | |
Pro forma adjustments (5) | 202 | | | (210) | | | (47) | |
| Pro forma depreciation and amortization | $ | 4,084 | | | $ | 4,122 | | | $ | 4,014 | |
| Operating Expenses | | | | | |
Combined operating expenses (1) | $ | 17,148 | | | $ | 18,658 | | | $ | 17,205 | |
| | | | | |
| Pro forma adjustments | (1,389) | | | (1,870) | | | (1,443) | |
| Pro forma operating expenses | $ | 15,759 | | | $ | 16,788 | | | $ | 15,762 | |
| Operating Income | | | | | |
Combined operating income (1) | $ | 1,708 | | | $ | 1,300 | | | $ | 1,712 | |
| | | | | |
| Pro forma adjustments | (224) | | | 197 | | | (66) | |
| Pro forma operating income | $ | 1,484 | | | $ | 1,497 | | | $ | 1,646 | |
| Interest expense | | | | | |
Combined interest expense (1) | $ | (778) | | | $ | (771) | | | $ | (775) | |
Pro forma adjustments (6) | (64) | | | (69) | | | (60) | |
| Pro forma interest expense | $ | (842) | | | $ | (840) | | | $ | (835) | |
| Interest expense to affiliates | | | | | |
Combined interest expense to affiliates (1) | $ | (100) | | | $ | (98) | | | $ | (99) | |
Pro forma adjustments (6) | 91 | | | 86 | | | 104 | |
| Pro forma interest expense to affiliates | $ | (9) | | | $ | (12) | | | $ | 5 | |
| Interest income | | | | | |
Combined interest income (1) | $ | 5 | | | $ | 7 | | | $ | 12 | |
Pro forma adjustments (4) | 16 | | | 18 | | | 14 | |
| Pro forma interest income | $ | 21 | | | $ | 25 | | | $ | 26 | |
| Other income (expense), net | | | | | |
Combined other income (expense), net (1) | $ | 17 | | | $ | (2) | | | $ | (5) | |
Pro forma adjustments (4) | (16) | | | (18) | | | (14) | |
| Pro forma other income (expense), net | $ | 1 | | | $ | (20) | | | $ | (19) | |
| | | | | |
| Pro forma income from continuing operations before tax | $ | 655 | | | $ | 650 | | | $ | 823 | |
| | | | | |
| Income tax (expense) benefit | | | | | |
Combined income tax (expense) benefit (1) | $ | (261) | | | $ | 194 | | | $ | 273 | |
| | | | | |
Pro forma adjustments (7) | 57 | | | (51) | | | 9 | |
| Pro forma income tax (expense) benefit | $ | (204) | | | $ | 143 | | | $ | 282 | |
| Income from continuing operations, net of tax | | | | | |
Combined income from continuing operations, net of tax (1) | $ | 591 | | | $ | 630 | | | $ | 1,118 | |
| | | | | |
| Pro forma adjustments | (140) | | | 163 | | | (13) | |
| Pro forma income from continuing operations, net of tax | $ | 451 | | | $ | 793 | | | $ | 1,105 | |
| Income from discontinued operations, net of tax | | | | | |
Combined income from discontinued operations, net of tax (1) | $ | — | | | $ | — | | | $ | — | |
Pro forma adjustments (2) | 393 | | | 355 | | | 357 | |
| Pro forma income from discontinued operations, net of tax | $ | 393 | | | $ | 355 | | | $ | 357 | |
| Net income | | | | | |
Combined net income (1) | $ | 591 | | | $ | 630 | | | $ | 1,118 | |
| Pro forma adjustments | 253 | | | 518 | | | 344 | |
| Pro forma net income | $ | 844 | | | $ | 1,148 | | | $ | 1,462 | |
| | | | | |
| | | | | |
| | | | | |
| | | | | |
| | | | | |
| | | | | |
| | | | | |
T-Mobile US, Inc.
Pro Forma Income Statement Metrics (Continued)
(Unaudited)
(1) Represents the sum of historically filed T-Mobile and Sprint standalone GAAP reported amounts. Please reference the T-Mobile Quarterly Reports on Form 10-Q for the quarterly periods ended September 30, 2019, and March 31, 2020, the Sprint Quarterly Reports on Form 10-Q for the quarterly periods ended September 30, 2019, and December 31, 2019, the T-Mobile Annual Report on Form 10-K for the year ended December 31, 2019 and the Current Report on Form 8-K containing Sprint financial results for the year ended March 31, 2020, filed on May 18, 2020.
(2) Significant pro forma adjustments include the removal of the activity of the Prepaid Business which is assumed to have been reclassified to discontinued operations as of January 1, 2019.
(3) Significant pro forma adjustments include adjustments to the timing and recognition of certain revenues and costs to align the historical revenue recognition policies of Sprint with the revenue recognition policies of T-Mobile.
(4) Significant pro forma adjustments include the reclassification among line items of historical Sprint activity to align with T-Mobile’s financial statement presentation.
(5) Significant pro forma adjustments include changes to depreciation and amortization from revalued and newly recognized property, equipment, and intangibles in purchase price accounting.
(6) Significant pro forma adjustments include changes to interest expense resulting from new debt issuances and modifications, as well as additional amortization expense associated with the revaluation of debt in purchase price accounting.
(7) Represents the pro forma tax impact of pro forma adjustments, which have been tax-effected at a blended rate of 26%.
Pro forma Net income is reconciled to Pro forma Adjusted EBITDA as follows:
| | | | | | | | | | | | | | | | | |
| Three Months Ended |
| (in millions) | September 30, 2019 | | December 31, 2019 | | March 31, 2020 |
| Pro forma net income | $ | 844 | | | $ | 1,148 | | | $ | 1,462 | |
| Adjustments: | | | | | |
| Pro forma income from discontinued operations, net of tax | (393) | | | (355) | | | (357) | |
| Pro forma income from continuing operations, net of tax | 451 | | | 793 | | | 1,105 | |
| Pro forma income tax expense (benefit) | 204 | | | (143) | | | (282) | |
| Pro forma other (income) expense, net | (1) | | | 20 | | | 19 | |
| Pro forma interest income | (21) | | | (25) | | | (26) | |
| Pro forma interest expense to affiliates | 9 | | | 12 | | | (5) | |
| Pro forma interest expense | 842 | | | 840 | | | 835 | |
| Pro forma operating income | 1,484 | | | 1,497 | | | 1,646 | |
| Pro forma depreciation and amortization | 4,084 | | | 4,122 | | | 4,014 | |
Pro forma operating income from discontinued operations (1) | 531 | | | 480 | | | 482 | |
Stock-based compensation, as adjusted (2) | 117 | | | 119 | | | 124 | |
Merger-related costs, as adjusted (3) | 165 | | | 117 | | | 136 | |
COVID-19-related costs (4) | — | | | — | | | 174 | |
Other, net (5) | 24 | | | (157) | | | 75 | |
| Pro forma Adjusted EBITDA | $ | 6,405 | | | $ | 6,178 | | | $ | 6,651 | |
(1) Following the Prepaid Transaction, starting on July 1, 2020, we provide MVNO services to customers of the divested brands. We have included the operating income from discontinued operations in our determination of Adjusted EBITDA to reflect EBITDA contributions of the Prepaid Business that were replaced by the MVNO Agreement beginning on July 1, 2020, in order to enable management, analysts and investors to better assess the ongoing operating performance and trends.
(2) Represents the sum of historically filed T-Mobile and Sprint standalone GAAP reported amounts, adjusted for the fair value of certain Sprint share-based compensation and the acceleration of certain executive compensation related to the Merger.
(3) Represents remaining Merger-related costs other than one-time transaction costs directly attributable to the Merger, which have been adjusted out of the pro forma calculations.
(4) Represents the sum of historically filed T-Mobile and Sprint standalone GAAP reported amounts.
(5) Other, net contains the sum of historical T-Mobile adjustments to EBITDA as well as historical Sprint adjustments that are not otherwise included as a named reconciling item.
Definitions of Terms
Operating and financial measures are utilized by T-Mobile’s management to evaluate its operating performance and, in certain cases, its ability to meet liquidity requirements. Although companies in the wireless industry may not define measures in precisely the same way, T-Mobile believes the measures facilitate key operating performance comparisons with other companies in the wireless industry to provide management, investors and analysts with useful information to assess and evaluate past performance and assist in forecasting future performance.
1.Customer - SIM number with a unique T-Mobile mobile identifier which is associated with an account that generates revenue. Customers generally are qualified either for postpaid service, where they generally pay after incurring service, or prepaid service, where they generally pay in advance.
2.Churn - The number of customers whose service was disconnected as a percentage of the average number of customers during the specified period. The number of customers whose service was disconnected is presented net of customers that subsequently have their service restored within a certain period of time.
3.Customers per account - The number of postpaid customers as of the end of the period divided by the number of postpaid accounts as of the end of the period. An account may include postpaid phone, mobile broadband, and DIGITS customers.
4.Average Revenue Per Account (ARPA) - Average monthly postpaid service revenue earned per account. Postpaid service revenues for the specified period divided by the average number of postpaid accounts during the period, further divided by the number of months in the period.
Average Revenue Per User (ARPU) - Average monthly service revenue earned from customers. Service revenues for the specified period divided by the average number of customers during the period, further divided by the number of months in the period.
Postpaid phone ARPU excludes postpaid other customers and related revenues.
Service revenues - Postpaid, including handset insurance, prepaid, wholesale, and roaming and other service revenues.
5.Cost of services - Costs directly attributable to providing wireless service through the operation of T-Mobile’s network, including direct switch and cell site costs, such as rent, network access and transport costs, utilities, maintenance, associated labor costs, long distance costs, regulatory program costs, roaming fees paid to other carriers and data content costs.
Cost of equipment sales - Costs of devices and accessories sold to customers and dealers, device costs to fulfill insurance and warranty claims, write-downs of inventory related to shrinkage and obsolescence, and shipping and handling costs.
Selling, general and administrative expenses - Costs not directly attributable to providing wireless service for the operation of sales, customer care and corporate activities. These include all commissions paid to dealers and retail employees for activations and upgrades, labor and facilities costs associated with retail sales force and administrative space, marketing and promotional costs, customer support and billing, bad debt expense and administrative support activities.
6.Net income margin - Margin % calculated as net income divided by service revenues.
7.Adjusted EBITDA and Core Adjusted EBITDA - Adjusted EBITDA represents earnings before Interest expense, net of Interest income, Income tax expense, Depreciation and amortization expense, non-cash Stock-based compensation and certain expenses not reflective of T-Mobile’s ongoing operating performance, such as Merger-related costs, COVID-19-related costs and Impairment expense. Core Adjusted EBITDA represents Adjusted EBITDA less Lease Revenues. Core Adjusted EBITDA and Adjusted EBITDA are non-GAAP financial measures utilized by T-Mobile’s management to monitor the financial performance of our operations. T-Mobile uses Core Adjusted EBITDA and Adjusted EBITDA as benchmarks to evaluate T-Mobile’s operating performance in comparison to its competitors. T-Mobile also uses Adjusted EBITDA internally as a measure to evaluate and compensate its personnel and management for their performance. Management believes analysts and investors use Core Adjusted EBITDA and Adjusted EBITDA as supplemental measures to evaluate overall operating performance and facilitate comparisons with other wireless communications companies because they are indicative of T-Mobile’s ongoing operating performance and trends by excluding the impact of Interest expense from financing, non-cash depreciation and amortization from capital investments, non-cash stock-based compensation, Merger-related costs including network decommissioning costs, incremental costs directly attributable to COVID-19 and impairment expense, as they are not indicative of T-Mobile’s ongoing operating performance, as well as certain other nonrecurring income and expenses. Management believes analysts and investors use Core Adjusted EBITDA because it normalizes for the transition in the company’s device financing strategy, by excluding the impact of lease revenues from Adjusted EBITDA, to align with the related depreciation expense on leased devices, which is excluded from the definition of Adjusted EBITDA. Core Adjusted EBITDA and Adjusted EBITDA have limitations as analytical tools and should not be considered in isolation or as a substitute for income from operations, Net income or any other measure of financial performance reported in accordance with U.S. Generally Accepted Accounting Principles (“GAAP”).
8.Adjusted EBITDA Margin - Margin % calculated as Adjusted EBITDA divided by service revenues.
9.Free Cash Flow - Net cash provided by operating activities less cash purchases of property and equipment, including proceeds from sales of tower sites and proceeds related to beneficial interests in securitization transactions and less cash payments for debt prepayment or debt extinguishment costs. Free Cash Flow is utilized by T-Mobile’s management, investors, and analysts to evaluate cash available to pay debt and provide further investment in the business. The reconciliation of Free Cash Flow to net cash provided by operating activities is detailed in the Reconciliation of Non-GAAP Financial Measures to GAAP Financial Measures schedule.
10.Net debt - Short-term debt, short-term debt to affiliates, long-term debt, and long-term debt (excluding tower obligations) to affiliates, short-term financing lease liabilities and financing lease liabilities, less cash and cash equivalents.
Cautionary Statement Regarding Forward-Looking Statements
This communication includes forward-looking statements within the meaning of the Private Securities Litigation Reform Act of 1995. All statements other than statements of historical fact, including information concerning T-Mobile US, Inc.’s future results of operations, are forward-looking statements. These forward-looking statements are generally identified by the words “anticipate,” “believe,” “estimate,” “expect,” “intend,” “may,” “could” or similar expressions. Forward-looking statements are based on current expectations and assumptions, which are subject to risks and uncertainties and may cause actual results to differ materially from the forward-looking statements. Important factors that could affect future results and cause those results to differ materially from those expressed in the forward-looking statements include, among others, the following: the failure to realize the expected benefits and synergies of the Merger with Sprint, pursuant to the Business Combination Agreement with Sprint and the other parties named therein (as amended, the "Business Combination Agreement") and the other transactions contemplated by the Business Combination Agreement (collectively, the "Transactions") in the expected timeframes, in part or at all; adverse economic, political or market conditions in the U.S. and international markets, including those caused by the COVID-19 Pandemic, and the impact that any of the foregoing may have on us and our customers and other stakeholders; costs of or difficulties in integrating Sprint's network and operations into our network and operations, including intellectual property and communications systems, administrative and information technology infrastructure and accounting, financial reporting and internal control systems; changes in key customers, suppliers, employees or other business relationships as a result of the consummation of the Transactions; the risk that our business, investor confidence in our financial results and stock price may be adversely affected if our internal controls are not effective; the risk of future material weaknesses resulting from the differences between T-Mobile’s and Sprint’s internal controls environments as we work to integrate and align policies and practices; the impacts of the actions we have taken and conditions we have agreed to in connection with the regulatory proceedings and approvals of the Transactions including the acquisition of Sprint’s prepaid wireless business by DISH (excluding the Assurance brand Lifeline customers and the prepaid wireless customers of Shenandoah Telecommunications Company and Swiftel Communications, Inc.), including customer accounts, inventory, contracts, intellectual property and certain other specified assets (the “Prepaid Transaction”), the complaint and proposed final judgment agreed to by us, DT, Sprint, SoftBank and DISH with the U.S. District Court for the District of Columbia, which was approved by the Court on April 1, 2020, the proposed commitments filed with the Secretary of the FCC, which we announced on May 20, 2019, certain national security commitments and undertakings, and any other commitments or undertakings entered into, including but not limited to those we have made to certain states and nongovernmental organizations; the acquisition of Sprint’s prepaid wireless business by DISH (excluding the Assurance brand Lifeline customers and the prepaid wireless customers of Shenandoah Telecommunications Company and Swiftel Communications, Inc.), including customer accounts, inventory, contracts, intellectual property and certain other specified assets (the “Prepaid Transaction”), the complaint and proposed final judgment agreed to by us, DT, Sprint, SoftBank and DISH with the U.S. District Court for the District of Columbia, which was approved by the Court on April 1, 2020, the proposed commitments filed with the Secretary of the FCC, which we announced on May 20, 2019, certain national security commitments and undertakings, and any other commitments or undertakings entered into, including but not limited to those we have made to certain states and nongovernmental organizations; the ongoing commercial and transition services arrangements that we entered into with DISH in connection with such Prepaid Transaction, which we completed on July 1, 2020; the assumption of significant liabilities, including the liabilities of Sprint in connection with, and significant costs, including financing costs, related to the Transactions; our ability to make payments on debt or to repay existing or future indebtedness when due or to comply with the covenants contained therein; adverse changes in the ratings of our debt securities or adverse conditions in the credit markets; natural disasters, public health crises, including the COVID-19 Pandemic, terrorist attacks or similar incidents; competition, industry consolidation and changes in the market for wireless services, which could negatively affect our ability to attract and retain customers; the effects of any future merger, investment, or acquisition involving us, as well as the effects of mergers, investments or acquisitions in the technology, media and telecommunications industry; breaches of our and/or our third-party vendors' networks, information technology and data security, resulting in unauthorized access to customer confidential information; the inability to implement and maintain effective cybersecurity measures over critical business systems; challenges in implementing our business strategies or funding our operations, including payment for additional spectrum or network upgrades; the impact on our networks and business from major system and network failures; difficulties in managing growth in wireless data services, including network quality; material changes in available technology and the effects of such changes, including product substitutions and deployment costs and performance; the timing, scope and financial impact of our deployment of advanced network and business technologies; the occurrence of high fraud rates related to device financing, customer credit cards, dealers, subscriptions or account take over fraud; our inability to retain and hire key personnel; any changes in the regulatory environments in which we operate, including any increase in restrictions on the ability to operate our networks and changes in data privacy laws; unfavorable outcomes of existing or future litigation or regulatory actions, including litigation or regulatory actions related to the Transactions; the possibility that we may be unable to adequately protect our intellectual property rights or be accused of infringing the intellectual property rights of others; changes in tax laws, regulations and existing standards and the resolution of disputes with any taxing jurisdictions; the possibility that we may be unable to renew our spectrum leases on attractive terms or acquire new spectrum licenses or leases at reasonable costs and terms; any disruption or failure of third parties' (including key suppliers') ability to provide products or services; material adverse changes in labor matters, including labor campaigns, negotiations or additional organizing activity, and any resulting financial, operational and/or reputational impact; changes in accounting assumptions that regulatory agencies, including the U.S. Securities and Exchange Commission, may require, which could result in an impact on earnings; and interests of our significant stockholders that may differ from the interests of other stockholders. Given these risks and uncertainties, readers are cautioned not to place undue reliance on such forward-looking statements. We undertake no obligation to revise or publicly release the results of any revision to these forward-looking statements, except as required by law.
About T-Mobile US, Inc.
T-Mobile US, Inc. (NASDAQ: TMUS) is America’s supercharged Un-carrier, delivering an advanced 4G LTE and transformative nationwide 5G network that will offer reliable connectivity for all. T-Mobile’s customers benefit from its unmatched combination of value and quality, unwavering obsession with offering them the best possible service experience and undisputable drive for disruption that creates competition and innovation in wireless and beyond. Based in Bellevue, Wash., T-Mobile provides services through its subsidiaries and operates its flagship brands, T-Mobile and Metro by T-Mobile. For more information please visit: http://www.t-mobile.com.