EXHIBIT 99.2
| | | | | | | | |
| | Highlights |
| | Customer Metrics |
| | Financial Metrics |
| | Capital Structure |
| | 5G Network Leadership |
| | Merger & Integration |
| | Guidance |
| | Contacts |
| | Financial and Operational Tables |
Unless otherwise noted, historical results for T-Mobile from the close of the merger (“Merger”) with Sprint Corporation (“Sprint”) on April 1, 2020 reflect the Merger transactions and are inclusive of the results and operations of Sprint, while historical results prior to April 1, 2020 do not reflect the Merger transactions and are inclusive of the results and operations of stand-alone T-Mobile only. As such, the year-over-year changes may not be meaningful as further detailed in this Investor Factbook.
T-Mobile Raises 2021 Guidance as Network Leadership Fuels
Industry-Leading Growth with Strong First Quarter 2021 Results
Industry-Leading Customer Growth
•Total net additions of 1.4 million, best in industry
•Postpaid net additions of 1.2 million, best in industry and raising 2021 guidance
•Postpaid phone net additions of 773 thousand, best in industry
Strong Financial Results Drive Guidance Raise
•Total revenues of $19.8 billion and service revenues of $14.2 billion
•Net income of $933 million, diluted earnings per share (“EPS”) of $0.74 and Adjusted EBITDA(1) of $6.9 billion
•Core Adjusted EBITDA(1) of $5.9 billion, raising 2021 guidance
•Net cash provided by operating activities of $3.7 billion and Free Cash Flow(1) of $1.3 billion, raising 2021 guidance
Raising 2021 Merger Synergies Guidance on Continued Integration Progress
•Expect Merger synergies of $2.8 billion to $3.1 billion
•Approximately 50 percent of Sprint customer traffic is now carried on the T-Mobile network, 2x more than last quarter
•Approximately 20 percent of Sprint customers have been moved to the T-Mobile network
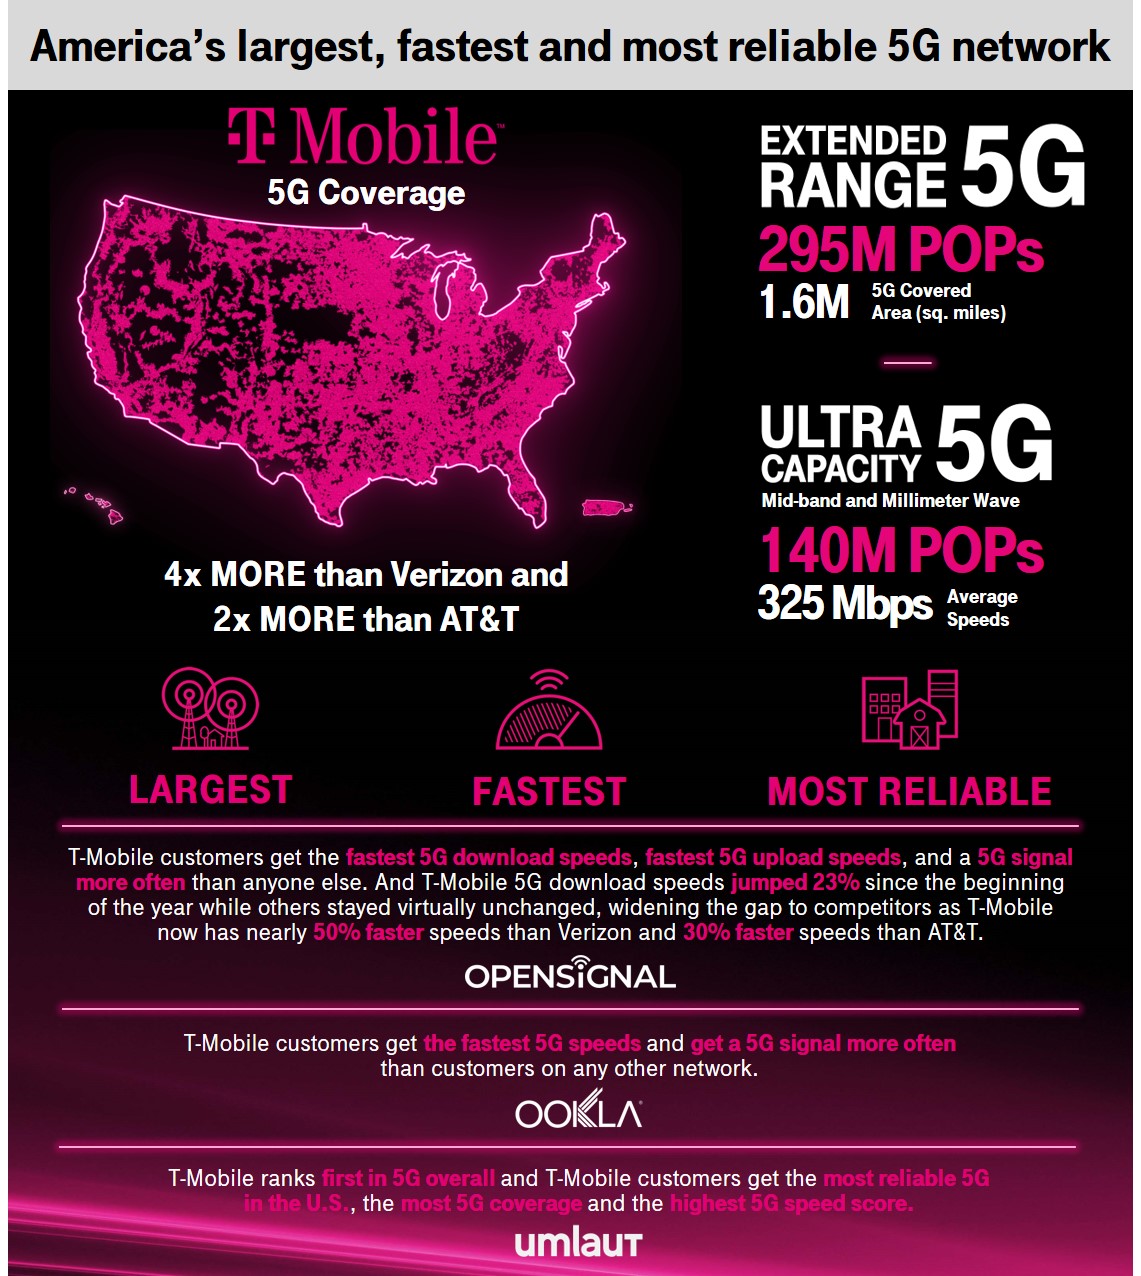
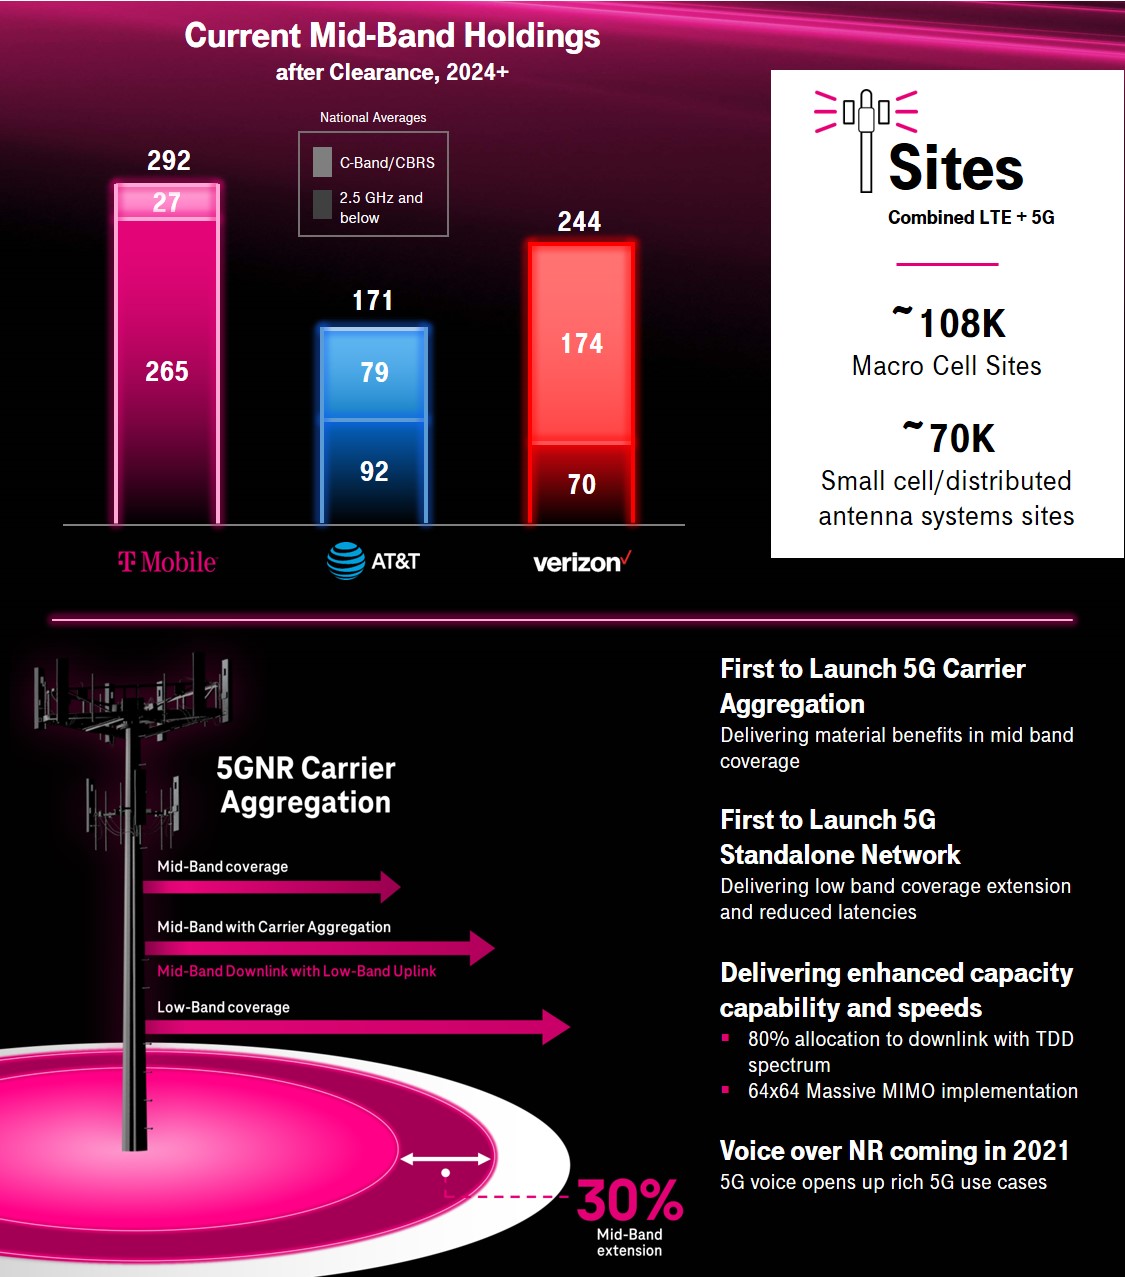
America’s Largest, Fastest and Most Reliable 5G Network Extends its Lead
•Extended Range 5G covers 295 million people across 1.6 million square miles, 4x more than Verizon and 2x more than AT&T
•Ultra Capacity 5G covers 140 million people and on track to cover 200 million people nationwide by the end of 2021
•Majority of independent third-party network benchmarking reports show T-Mobile as the clear leader in 5G speed and availability
•Network perception catching up to reality with a nearly 120 percent increase in consumers who view T-Mobile as “The 5G Company” since Q3 2019
| | | | | | | | | | | |
| | | |
| | “T-Mobile puts customers at the center of everything we do by giving them the best network, value and experience all at once – and this quarter’s stellar, industry-leading results prove that they’re noticing. We just keep pushing further ahead of the competition. Our network leadership is fueling customer momentum, delivering merger synergies and expanding our addressable markets for growth. We have so much confidence that we are raising 2021 guidance just one quarter into the year. Our mission is to be the very best at connecting customers to their world and we’re delivering on it.” | |
| | Mike Sievert, CEO | |
(1)Adjusted EBITDA, Core Adjusted EBITDA and Free Cash Flow are non-GAAP financial measures. These non-GAAP financial measures should be considered in addition to, but not as a substitute for, the information provided in accordance with GAAP. Reconciliations for these non-GAAP financial measures to the most directly comparable GAAP financial measures are provided in the Reconciliation of Non-GAAP Financial Measures to GAAP Financial Measures tables. We are not able to forecast Net income on a forward-looking basis without unreasonable efforts due to the high variability and difficulty in predicting certain items that affect Net income including, but not limited to, Income tax expense, stock-based compensation expense and Interest expense. Adjusted EBITDA and Core Adjusted EBITDA should not be used to predict Net income as the difference between either of the two measures and Net Income is variable.
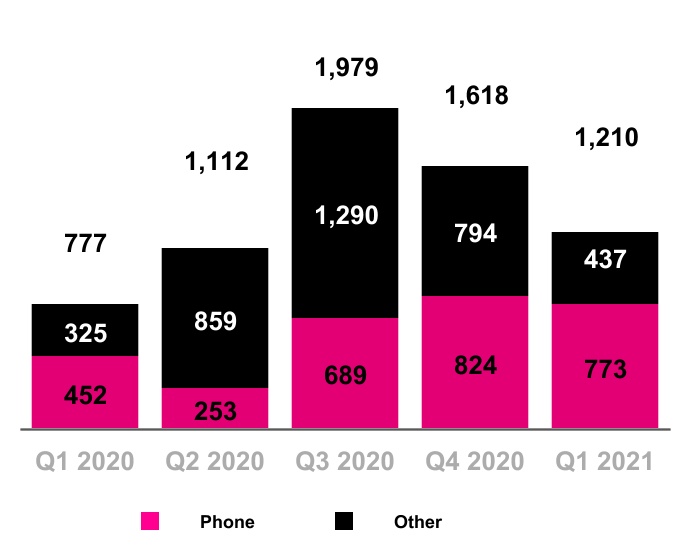
Total Postpaid Net Additions
(in thousands)
Postpaid phone net customer additions were 773 thousand in Q1 2021, compared to 824 thousand in Q4 2020 and 452 thousand in Q1 2020.
▪Sequentially, the decrease was primarily due to lower gross customer additions driven by seasonality, partially offset by lower churn.
▪Year-over-year, the increase was primarily due to expanded retail presence as a result of the Merger and increased retail store traffic due to closures arising from the COVID-19 pandemic (the “Pandemic”) in the prior period, as well as increased growth from T-Mobile for Business, partially offset by higher churn from customers acquired in the Merger.
Postpaid other net customer additions were 437 thousand in Q1 2021, compared to 794 thousand in Q4 2020 and 325 thousand in Q1 2020.
▪Sequentially, the decrease was primarily due to lower additions in the public and educational sector, as well as higher churn.
▪Year-over-year, the increase was primarily due to expanded retail presence as a result of the Merger, higher gross additions from connected devices, increased retail store traffic due to closures arising from the Pandemic in the prior year period and lower churn.
Total postpaid net customer additions were 1.2 million in Q1 2021, compared to 1.6 million in Q4 2020 and 777 thousand in Q1 2020.
The postpaid upgrade rate was approximately 4.8% in Q1 2021, compared to 5.7% in Q4 2020 and 3.8% in Q1 2020.
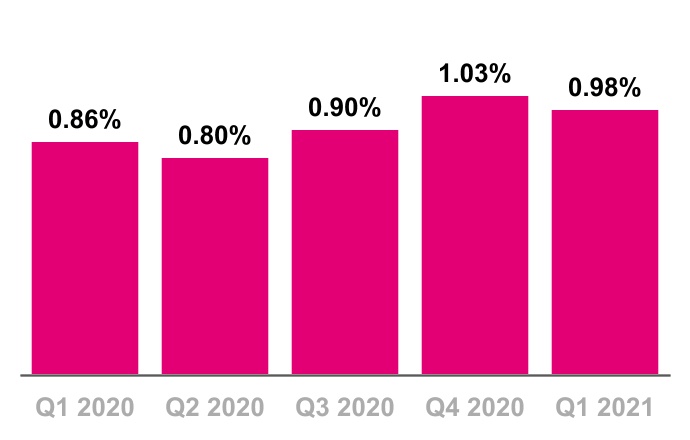
Postpaid phone churn was 0.98% in Q1 2021, down 5 basis points from 1.03% in Q4 2020 and up 12 basis points from 0.86% in Q1 2020.
▪Sequentially, the decrease was primarily due to continued network improvement, and the continued enhancement of the value proposition and network experience of Sprint customers.
▪Year-over-year, the increase was primarily driven by the inclusion of the customer base acquired in the Merger with higher churn.
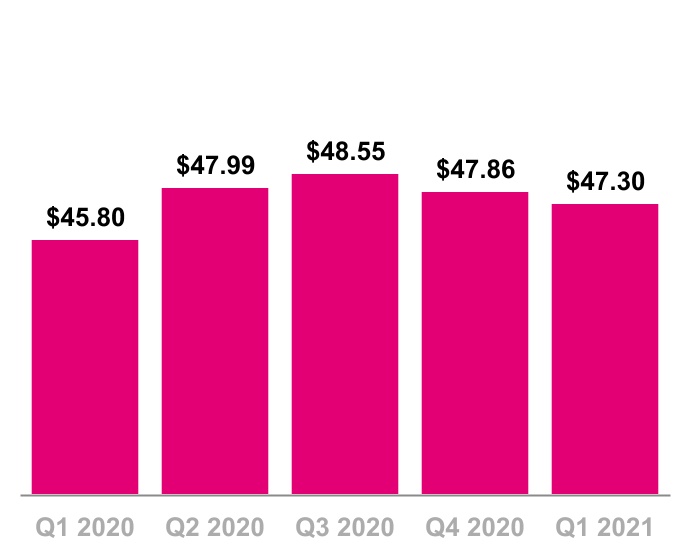
Postpaid phone ARPU was $47.30 in Q1 2021, down 1.2% from $47.86 in Q4 2020 and up 3.3% from $45.80 in Q1 2020.
▪Sequentially, the decrease was primarily due to lower recurring charges from customers acquired in the Merger including from the impact of rate plan migrations, an increase in average customers per account and a decrease in late and restore fees associated with improved collections activity.
▪Year-over-year, the increase was primarily due to the net impact of customers acquired in the Merger, which have higher ARPU, and higher premium service revenues, partially offset by ongoing promotional activity.
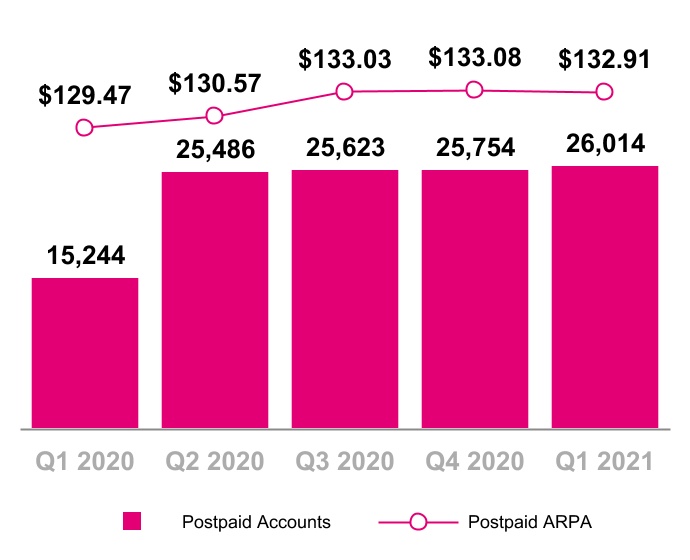
Total postpaid accounts were 26.0 million at the end of Q1 2021, compared to 25.8 million at the end of Q4 2020 and 15.2 million at the end of Q1 2020.
Postpaid ARPA was $132.91 in Q1 2021, essentially flat compared to $133.08 in Q4 2020 and up 2.7% compared to $129.47 in Q1 2020.
▪Sequentially, postpaid ARPA was essentially flat. A decrease in late and restore fees associated with improved collections activity, lower recurring charges from customers acquired in the Merger including rate plan migrations and ongoing promotional activity were mostly offset by an increase in average customers per account.
▪Year-over-year, the increase was primarily due to an increase in customers per account, including further penetration in connected devices, higher premium service revenues, and the net impact of customers acquired in the Merger, partially offset by ongoing promotional activity.
Postpaid Accounts & Postpaid ARPA
(Accounts in thousands)
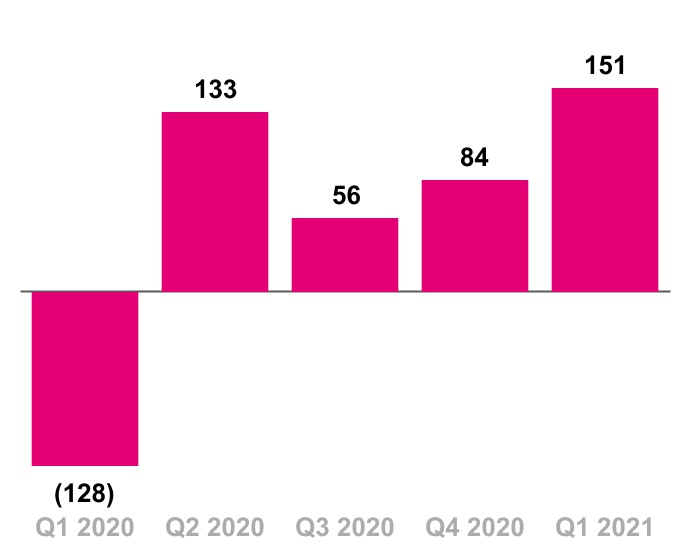
Total Prepaid Net (Losses) Additions
(in thousands)
Prepaid net customer additions were 151 thousand in Q1 2021, compared to net additions of 84 thousand in Q4 2020 and net losses of 128 thousand in Q1 2020.
▪Sequentially and year-over-year, the increase was primarily due to lower churn.
▪Migrations to postpaid plans reduced prepaid net customer additions in Q1 2021 by approximately 170 thousand, up from 165 thousand in Q4 2020 and 115 thousand in Q1 2020.
Prepaid churn was 2.78% in Q1 2021, compared to 2.92% in Q4 2020 and 3.52% in Q1 2020.
▪Sequentially and year-over-year, the decrease was primarily due to lower switching activity and the improved quality of recently acquired customers.
Prepaid ARPU was $37.81 in Q1 2021, down 0.7% from $38.08 in Q4 2020 and down 0.8% from $38.11 in Q1 2020, primarily driven by ongoing promotional activities.
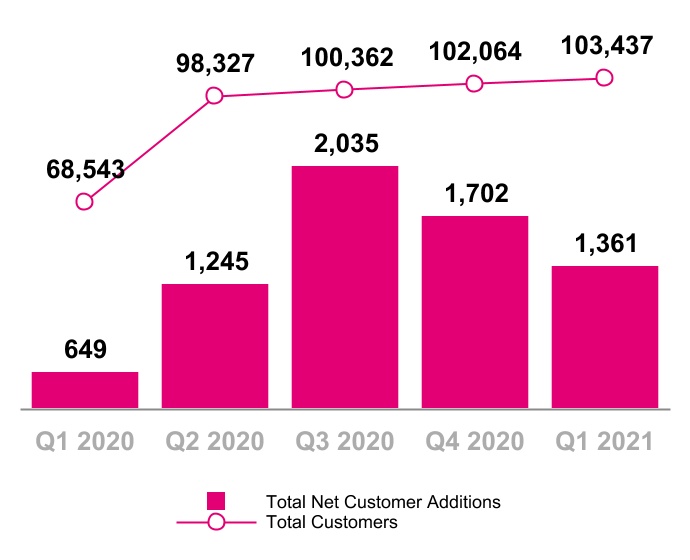
Total net customer additions were 1.4 million in Q1 2021, compared to 1.7 million in Q4 2020 and 649 thousand in Q1 2020.
Total customers were 103.4 million at the end of Q1 2021, compared to 102.1 million at the end of Q4 2020 and 68.5 million at the end of Q1 2020.
Total devices sold or leased were 10.6 million units in Q1 2021, compared to 11.7 million units in Q4 2020 and 7.2 million units in Q1 2020.
▪Total phones sold or leased were 9.6 million units in Q1 2021, compared to 10.1 million units in Q4 2020 and 6.4 million units in Q1 2020.
▪Mobile broadband and IoT devices sold or leased were 1.0 million units in Q1 2021, compared to 1.6 million units in Q4 2020 and 758 thousand units in Q1 2020.
Total Customers
(in thousands)
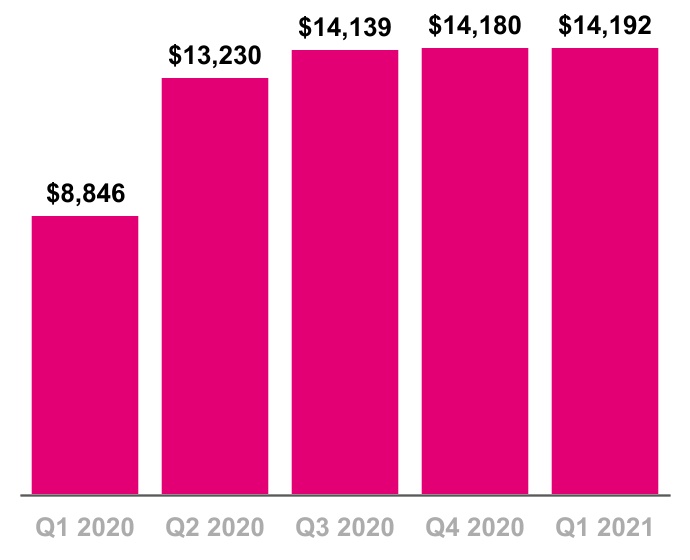
Service Revenues
($ in millions)
Service revenues were $14.2 billion in Q1 2021, essentially flat compared to $14.2 billion in Q4 2020 and up 60% from $8.8 billion in Q1 2020.
▪Sequentially, an increase in Postpaid service revenues was partially offset by seasonally lower Wholesale revenues.
▪Year-over-year, the increase was primarily due to an increase in Postpaid service revenues, primarily due to customers acquired in the Merger and continued Postpaid customer growth, an increase in Wholesale revenues primarily driven by our Master Network Service Agreement with DISH, which went into effect on July 1, 2020, and higher Roaming and other service revenues, primarily from the inclusion of wireline and Lifeline operations acquired in the Merger.
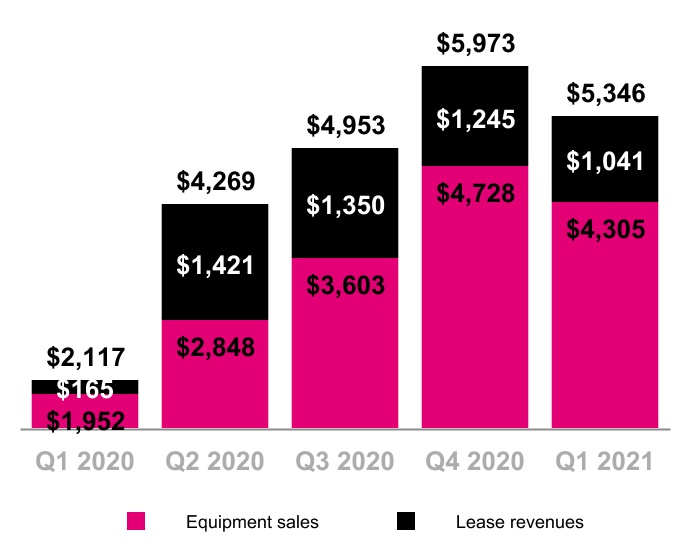
Equipment revenues were $5.3 billion in Q1 2021, down 10% from $6.0 billion in Q4 2020 and up 153% from $2.1 billion in Q1 2020. Lease revenues included in equipment revenues were $1.0 billion in Q1 2021 compared to $1.2 billion in Q4 2020 and $165 million in Q1 2020.
▪Sequentially, the decrease was primarily due to:
▪A decrease in the number of devices sold, driven by seasonality and iconic device launches in the prior quarter;
▪Lower average revenue per device sold, excluding purchased leased devices, driven by a decrease in the high-end device mix; and
▪A decrease in lease revenues due to the continued planned shift in device financing from leasing to equipment installation plans.
▪Year-over-year, the increase was primarily due to:
▪An increase in the number of devices sold, excluding purchased leased devices, due to an increased customer base as the result of the Merger;
▪Higher average revenue per device sold, excluding purchased leased devices, due to an increase in the high-end device mix primarily driven by a larger postpaid customer base as a result of the Merger;
▪An increase in lease revenues due to a higher number of customer devices under lease, primarily from leases acquired in the Merger; and
▪An increase in purchased leased devices, primarily due to a larger base of leased devices as a result of the Merger.
Equipment Revenues
($ in millions)
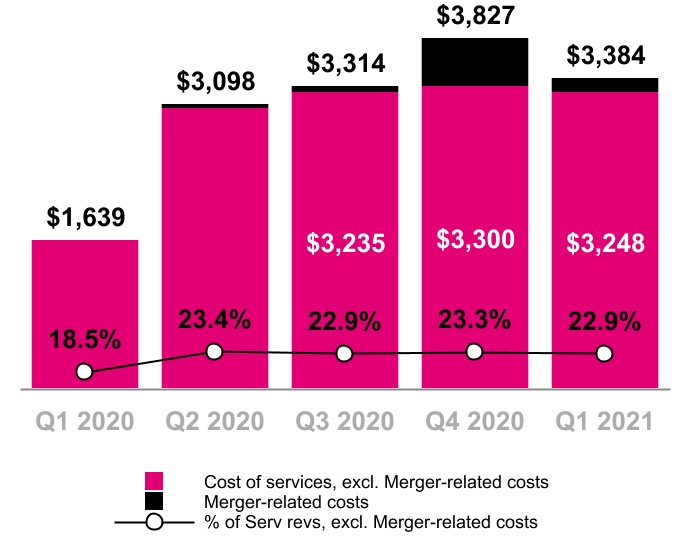
Cost of Services, exclusive of D&A
($ in millions, % of Service revs excl. Merger-related costs)
Cost of services, exclusive of depreciation and amortization (D&A), was $3.4 billion in Q1 2021, down 12% from $3.8 billion in Q4 2020 and up 106% from $1.6 billion in Q1 2020.
▪Sequentially, the decrease was primarily due to lower Merger-related costs in the current quarter, as well as higher realized Merger synergies, which were partially offset by increased costs related to site upgrades.
▪Year-over-year, the increase was primarily due to an increase in expenses associated with leases, backhaul agreements, other network expenses, the continued build-out of our nationwide 5G network, and higher employee-related and benefit-related costs, primarily due to the Merger.
▪Merger-related costs primarily related to incremental costs associated with network decommissioning and integration were $136 million in Q1 2021 compared to $527 million in Q4 2020 and $0 in Q1 2020.
▪As a percentage of Service revenues, Cost of Services, exclusive of D&A, and excluding Merger-related costs, decreased by 40 basis points sequentially, and increased by 440 basis points year-over-year.
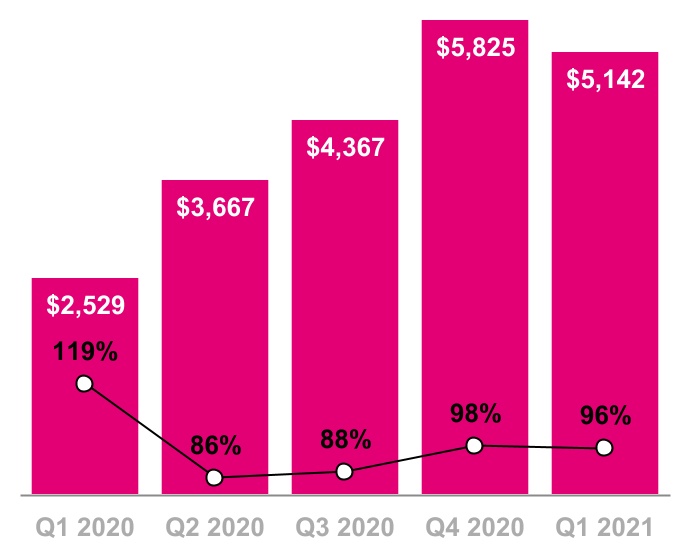
Cost of equipment sales, exclusive of D&A, was $5.1 billion in Q1 2021, down 12% from $5.8 billion in Q4 2020 and up 103% from $2.5 billion in Q1 2020.
▪Sequentially, the decrease was primarily due to:
▪A decrease in the number of devices sold, driven by seasonality and iconic device launches in the prior quarter; and
▪A lower average cost per device sold, excluding purchased leased devices, primarily driven by a decrease in the high-end device mix.
▪Year-over-year, the increase was primarily due to:
▪An increase in the number of devices sold, excluding purchased leased devices, primarily due to an increased customer base as a result of the Merger;
▪A higher average cost per device sold, excluding purchased leased devices, primarily driven by an increase in the high-end device mix, primarily driven by a larger postpaid customer base as a result of the Merger; and
▪An increase in purchased leased devices, primarily due to a larger base of leased devices as a result of the Merger.
Cost of Equipment Sales, exclusive of D&A
($ in millions, % of Equipment Revs)
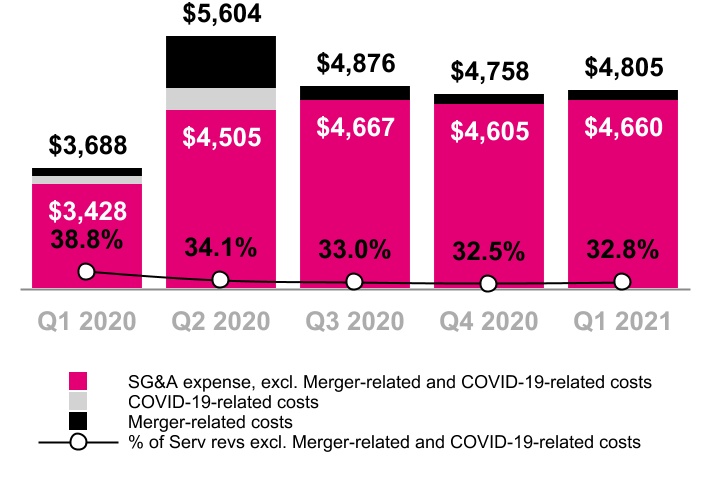
Selling, General and Administrative (SG&A) Expense
($ in millions, % of Service revs excl. Merger-related and COVID-19-related costs)
Selling, general and administrative (SG&A) expense was $4.8 billion in Q1 2021, essentially flat compared to $4.8 billion in Q4 2020 and up 30% from $3.7 billion in Q1 2020.
▪Sequentially, the slight increase was primarily driven by higher employee-related costs, including expenses associated with annual stock-based compensation vesting, which were mostly offset by lower bad debt expense and Merger synergies realized.
▪Year-over-year, the increase was primarily due to higher external labor and professional services, advertising, lease expense and employee-related costs, primarily from the Merger, as well as higher commission expense, primarily due to higher gross customer additions, partially offset by lower bad debt expense.
▪Supplemental employee payroll, third-party commissions and cleaning-related COVID-19 costs were insignificant in Q1 2021 and Q4 2020 and $117 million in Q1 2020.
▪Merger-related costs were $145 million in Q1 2021 compared to $153 million in Q4 2020 and $143 million in Q1 2020.
▪As a percentage of Service revenues, SG&A expense, excluding Merger-related and COVID-19-related costs, increased 30 basis points sequentially and decreased 600 basis points year-over-year.
▪Total bad debt expense and losses from sales of receivables (reported within SG&A expense) was $64 million in Q1 2021, compared to $112 million in Q4 2020 and $138 million in Q1 2020. As a percentage of Total revenues, total bad debt expense and losses from sales of receivables was 0.32% in Q1 2021, compared to 0.55% in Q4 2020 and 1.24% in Q1 2020.
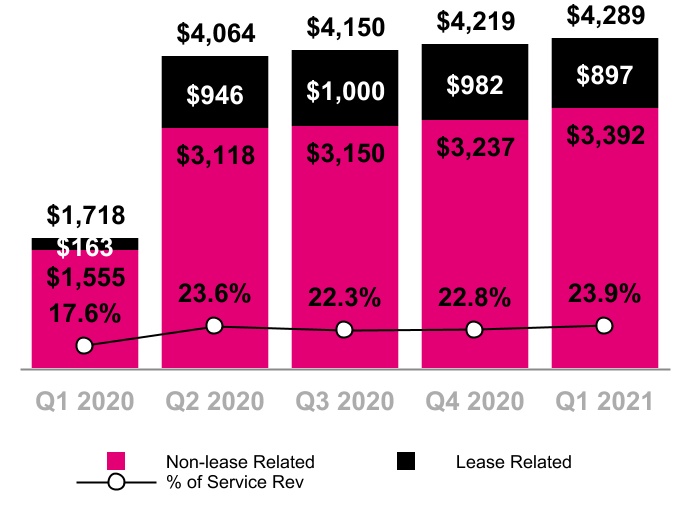
D&A was $4.3 billion in Q1 2021, up 2% from $4.2 billion in Q4 2020 and up 150% from $1.7 billion in Q1 2020. This includes D&A related to Leased devices of $897 million in Q1 2021, compared to $982 million in Q4 2020 and $163 million in Q1 2020.
▪Sequentially, the increase was primarily driven by higher depreciation expense from the continued build-out of our nationwide 5G network, partially offset by lower depreciation expense on leased devices resulting from a lower total number of customer devices under lease.
▪Year-over-year, the increase was primarily due to higher depreciation expense from assets acquired in the Merger, excluding leased devices, and network expansion from the continued build-out of our nationwide 5G network, higher depreciation expense on leased devices, primarily due to a larger base of leased devices as a result of the Merger and higher amortization from intangible assets acquired in the Merger.
Depreciation & Amortization
($ in millions, Non-lease D&A % of Service Revs)
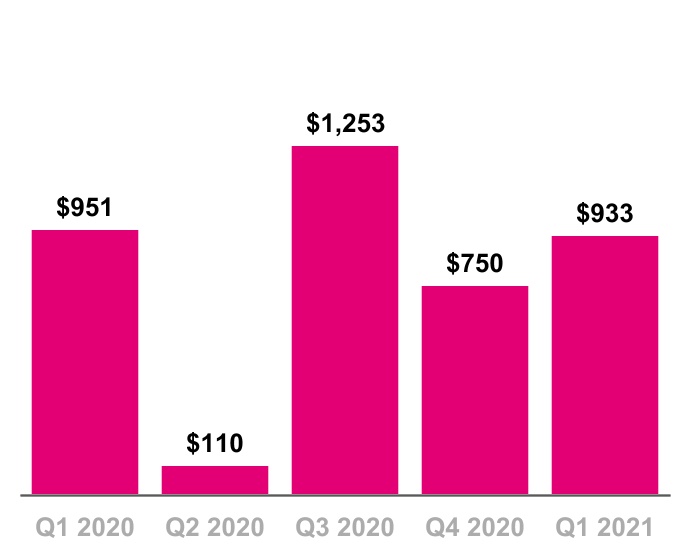
Net Income
($ in millions)
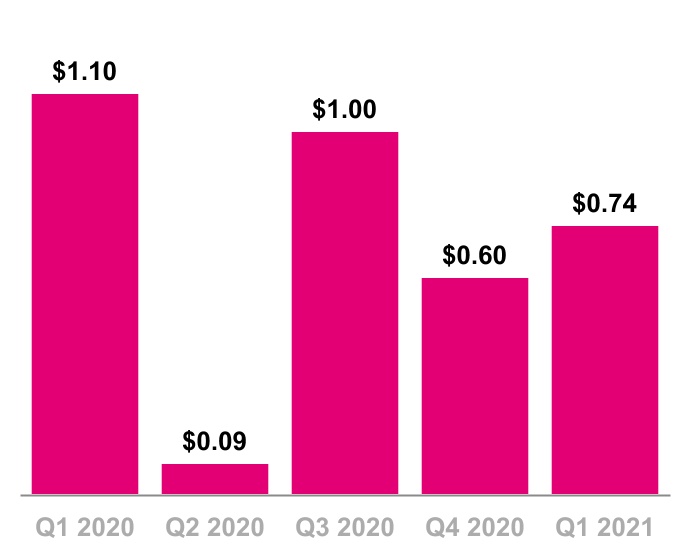
Diluted Earnings Per Share (Diluted EPS)
Net income was $933 million in Q1 2021, up 24% from $750 million in Q4 2020 and down 2% from $951 million in Q1 2020. Diluted EPS was $0.74 in Q1 2021, up from $0.60 in Q4 2020 and down from $1.10 in Q1 2020.
▪Sequentially, the increase in Net income and diluted EPS was primarily due to lower Cost of equipment sales and Cost of services, partially offset by lower Equipment revenues and higher Income tax expense.
▪Year-over-year, the decrease in Net income was driven by higher Cost of equipment sales, D&A, Cost of services, SG&A and interest expense, partially offset by higher Service and Equipment revenues. Diluted EPS also decreased due to an increase in outstanding shares as a result of the Merger.
▪Net income and diluted EPS, respectively, were impacted by Merger-related costs, net of tax, for Q1 2021 of $220 million and $0.18, compared to $506 million and $0.40 in Q4 2020 and $117 million and $0.14 in Q1 2020.
▪Net income margin was 6.6% in Q1 2021, compared to 5.3% in Q4 2020 and 10.8% in Q1 2020. Net income margin is calculated as Net income divided by Service revenues.
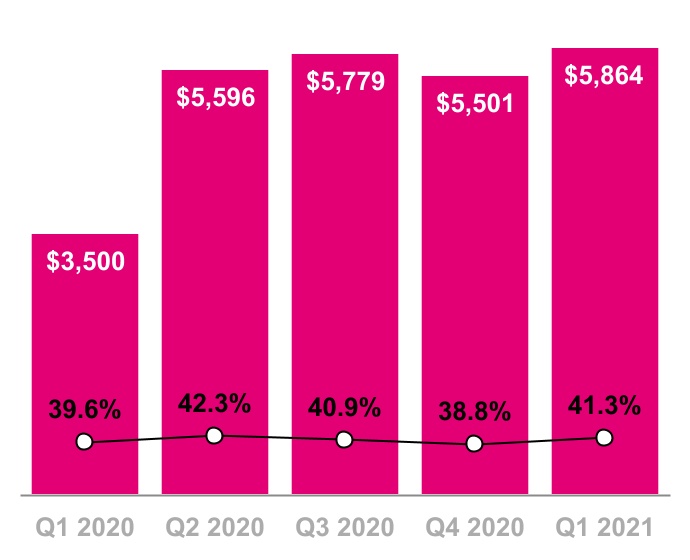
Core Adjusted EBITDA
($ in millions, % of Service Revs)
Core Adjusted EBITDA was $5.9 billion in Q1 2021, up 7% from $5.5 billion in Q4 2020 and up 68% from $3.5 billion in Q1 2020.
▪Sequentially, the increase was primarily due to lower Cost of equipment sales and lower Cost of services, excluding Merger-related costs, partially offset by lower Equipment revenues, excluding lease revenues, and higher SG&A expense, excluding Merger-related costs.
▪Year-over-year, the increase was primarily due to higher Service revenues and Equipment revenues, excluding lease revenues, partially offset by higher Cost of equipment sales, higher Cost of services, both excluding Merger-related costs, and higher SG&A expense, excluding Merger-related and COVID-related costs.
▪Core Adjusted EBITDA excludes Merger-related costs of $298 million in Q1 2021 compared to $686 million in Q4 2020 and $143 million in Q1 2020, as well as COVID-related costs of $117 million in Q1 2020.
▪Core Adjusted EBITDA margin was 41.3% in Q1 2021, compared to 38.8% in Q4 2020 and 39.6% in Q1 2020.
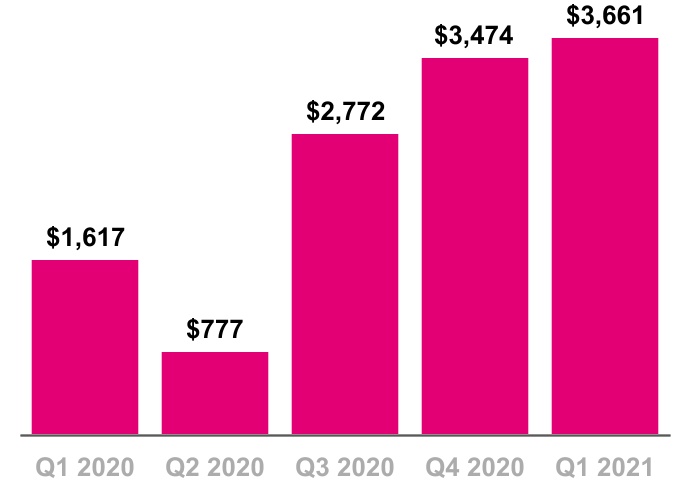
Net cash provided by operating activities was $3.7 billion in Q1 2021, compared to $3.5 billion in Q4 2020 and $1.6 billion in Q1 2020.
▪Sequentially, the increase was primarily due to an increase in Net income, adjusted for non-cash income and expenses, partially offset by an increase in net cash outflows from changes in working capital. The change in working capital was primarily due to higher use of cash from Accounts payable and accrued liabilities and Other current and long-term liabilities, mostly offset by lower use of cash from Accounts and Equipment installment plan receivables, Inventories and Other current and long-term assets.
▪Year-over-year, the increase was primarily due to an increase in Net income, adjusted for non-cash income and expense, partially offset by an increase in net cash outflows from changes in working capital. The change in working capital was primarily due to higher use of cash from Accounts payable and accrued liabilities, Equipment installment plan receivables and Other current and long-term liabilities, partially offset by lower use from Accounts receivable and Inventories.
▪The impact of payments for Merger-related costs on Net cash provided by operating activities was $277 million in Q1 2021 compared to $583 million in Q4 2020 and $161 million in Q1 2020.
Net Cash Provided by Operating Activities
($ in millions)
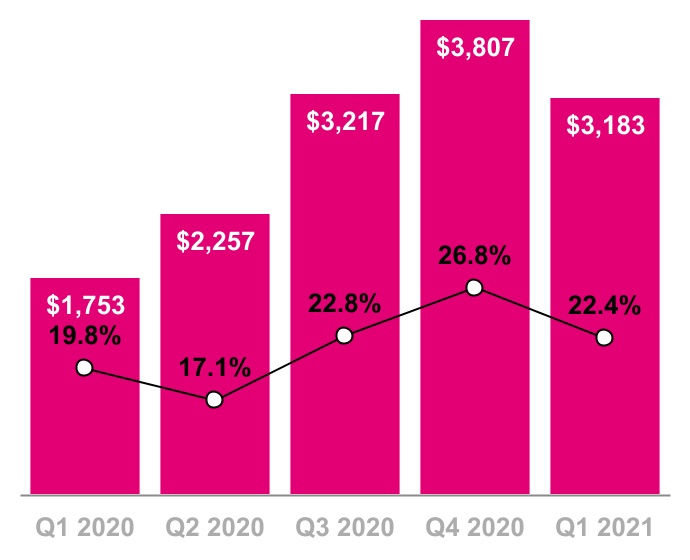
Cash Purchases of Property and Equipment
($ in millions, % of Service Revenues)
Cash purchases of property and equipment were $3.2 billion in Q1 2021, compared to $3.8 billion in Q4 2020 and $1.8 billion in Q1 2020. Capitalized interest included in cash purchases of property and equipment was $84 million in Q1 2021, compared to $101 million in Q4 2020 and $112 million in Q1 2020.
▪Sequentially the decrease was primarily driven by the timing of network capital spending.
▪Year-over-year, the increase was primarily driven by network integration related to the Merger and the continued build-out of our nationwide 5G network.
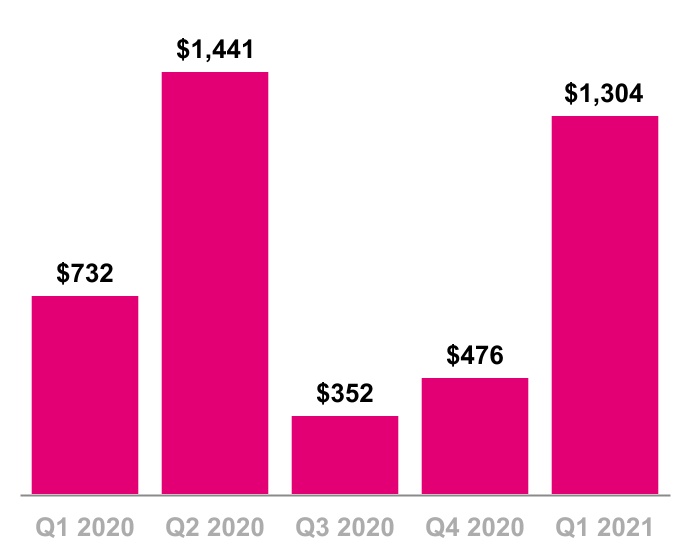
Free Cash Flow was $1.3 billion in Q1 2021, compared to $476 million in Q4 2020 and $732 million in Q1 2020.
▪Sequentially, the increase was primarily due to lower cash purchases of property and equipment, including capitalized interest, and higher Net cash provided by operating activities.
▪Year-over-year, the increase was primarily due to higher Net cash provided by operating activities, partially offset by higher cash purchases of property and equipment, including capitalized interest, from network integration related to the Merger and the continued build-out of our nationwide 5G network.
▪The impact of payments for Merger-related costs on Free Cash Flow was $277 million in Q1 2021 compared to $583 million in Q4 2020 and $161 million in Q1 2020.
Free Cash Flow, Excluding Gross Payments for the Settlement of Interest Rate Swaps
($ in millions)
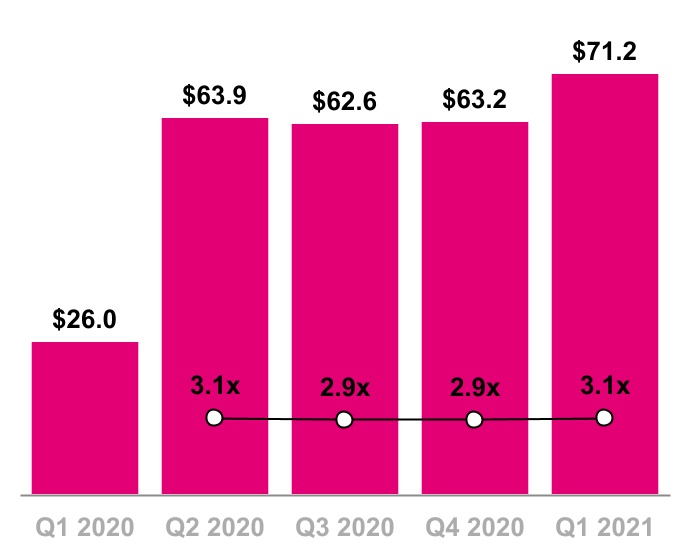
Net Debt (Excluding Tower Obligations) & Net Debt to LTM Pro Forma Core Adj. EBITDA Ratio
($ in billions)
Total debt, excluding tower obligations, at the end of Q1 2021 was $77.9 billion.
Net debt, excluding tower obligations, at the end of Q1 2021 was $71.2 billion.
▪The ratio of net debt, excluding tower obligations, to Pro Forma Core Adjusted EBITDA for the last twelve months (“LTM”) period was 3.1x at the end of Q1 2021 compared to 2.9x at the end of Q4 2020.
▪The ratio of net debt, excluding tower obligations, to Pro Forma Adjusted EBITDA for the LTM period was 2.6x at the end of Q1 2021 compared to 2.3x at the end of Q4 2020.
Financing activity in Q1 2021 includes:
▪On January 14, 2021, we issued Senior Notes in an aggregate amount of $3.0 billion at an average interest rate of approximately 2.58%, setting record low yields for 5-year, 8-year and 10-year tranches in the high yield market; and
▪On March 23, 2021, we issued Senior Notes in an aggregate amount of $3.8 billion at an average interest rate of 3.18%.
▪On March 27, 2021, we redeemed $2.0 billion of 6.50% Senior Notes due 2026.
| | | | | | | | | | | | | | |
| T-Mobile expects the total net present value of Merger synergies to be more than $70 billion – up more than 60 percent from the original Merger guidance of $43 billion. | |
| | | | |
| Improvements for Sprint customers | | The company expects Merger synergies to be $2.8 billion to $3.1 billion in 2021, more than doubling the $1.3 billion delivered in 2020 and an increase from its prior guidance of $2.7 billion to 3.0 billion. ▪Approximately $1.35 billion to $1.5 billion of sales, general, and administrative (SG&A) synergies achieved through SG&A expense reductions ▪Approximately $450 million to $600 million of network synergies achieved through cost of service expense reductions ▪Approximately $1 billion of network synergies related to avoided costs from new site builds
Merger-related costs in Q1 2021 were $298 million compared to $686 million in Q4 2020 and $143 million in Q1 2020.
Merger-related costs include: ▪Integration costs to achieve efficiencies in network, retail, information technology and back office operations; ▪Restructuring costs, including severance, store rationalization and network decommissioning; and ▪Transaction costs, including legal and professional services related to the completion of the Merger and the acquisitions of affiliates.
| |
| ~50% | | |
| of Sprint customer traffic has already been moved over to the T-Mobile network | | |
| ————————— | | |
| | | |
| ~20% | | |
| Sprint customer network migrations completed | | |
| | | |
| | | |
| | | | |
| | | | |
| | | | | | | | | | | | | | | | | | | | | | | | | | | | | | | | | | | | | | | | | | | | | | | | | | | | | |
| Merger-Related Costs |
| (in millions) |
| | | | | | | | | | | Sequential Change | | Year-over-year Change |
| Q1 2020 | | Q2 2020 | | Q3 2020 | | Q4 2020 | | Q1 2021 | | $ | | % | | $ | | % |
| Cost of services | $ | — | | | $ | 40 | | | $ | 79 | | | $ | 527 | | | $ | 136 | | | $ | (391) | | | (74) | % | | $ | 136 | | | NM |
| Cost of equipment sales | — | | | — | | | — | | | 6 | | | 17 | | | 11 | | | 183 | % | | 17 | | | NM |
| Selling, general & administrative | 143 | | | 758 | | | 209 | | | 153 | | | 145 | | | (8) | | | (5) | % | | 2 | | | 1 | % |
| Total Merger-related costs | $ | 143 | | | $ | 798 | | | $ | 288 | | | $ | 686 | | | $ | 298 | | | $ | (388) | | | (57) | % | | $ | 155 | | | 108 | % |
| | | | | | | | | | | | | | | | | |
| Cash payments for Merger-related costs | $ | 161 | | | $ | 370 | | | $ | 379 | | | $ | 583 | | | $ | 277 | | | $ | (306) | | | (52) | % | | $ | 116 | | | 72 | % |
| | | | | | | | | | | | | | | | | |
NM - Not Meaningful
2021 Outlook
| | | | | | | | | | | |
| Metric | Previous | Revised | Change at Midpoint |
| Postpaid net customer additions | 4.0 to 4.7 million | 4.4 to 4.9 million | 300 thousand |
Net income (1) | N/A | N/A | N/A |
Core Adjusted EBITDA (2) | $22.6 to $23.1 billion | $22.8 to $23.2 billion | $150 million |
Capital expenditures (3) | $11.7 to $12.0 billion | $11.7 to $12.0 billion | No change |
Merger-related costs (4) | $2.5 to $3.0 billion | $2.7 to $3.0 billion | $100 million |
| Net cash provided by operating activities | $13.0 to $13.5 billion | $13.2 to $13.6 billion | $150 million |
Free Cash Flow (5) | $4.9 to $5.4 billion | $5.1 to $5.5 billion | $150 million |
(1)We are not able to forecast Net income on a forward-looking basis without unreasonable efforts due to the high variability and difficulty in predicting certain items that affect GAAP Net income, including, but not limited to, Income tax expense, stock-based compensation expense and Interest expense. Core Adjusted EBITDA should not be used to predict Net income as the difference between these measures and Net Income is variable.
(2)Management uses Core Adjusted EBITDA as a measure to monitor the financial performance of our operations, excluding the impact of lease revenues from our related device financing programs. Our guidance ranges assume a continued reduction in lease revenues to $3.7 to $3.9 billion for 2021.
(3)Capital expenditures means cash purchases of property and equipment, including capitalized interest.
(4)Merger-related costs are excluded from Core Adjusted EBITDA but will impact Net income and cash flows.
(5)Free Cash Flow guidance does not assume any material net cash inflows from securitization in 2021.
Investor Relations
| | | | | | | | | | | | | | | | | | | | |
| | | | | | |
| | | | | | |
| Jud Henry | | Justin Taiber | | Trina Schurman | |
| Senior Vice President | | Senior Director | | Senior Director | |
| Investor Relations | | Investor Relations | | Investor Relations | |
| | | | | | | | | | | | | | | | | | | | | | | | | | |
| | | | | | | | |
| | | | | | | | |
| Samia Bhatti | | Zach Witterstaetter | | Rose Kopecky | | Jacob Marks | |
| Investor Relations | | Investor Relations | | Investor Relations | | Investor Relations | |
| Manager | | Manager | | Manager | | Manager | |
investor.relations@t-mobile.com
http://investor.t-mobile.com
T-Mobile US, Inc.
Condensed Consolidated Balance Sheets
(Unaudited)
| | | | | | | | | | | |
| (in millions, except share and per share amounts) | March 31, 2021 | | December 31, 2020 |
| Assets | | | |
| Current assets | | | |
| | | |
| Cash and cash equivalents | $ | 6,677 | | | $ | 10,385 | |
| Accounts receivable, net of allowance for credit losses of $143 and $194 | 3,592 | | | 4,254 | |
| Equipment installment plan receivables, net of allowance for credit losses and imputed discount of $512 and $478 | 3,841 | | | 3,577 | |
| Accounts receivable from affiliates | 20 | | | 22 | |
| Inventory | 2,209 | | | 2,527 | |
| | | |
| Prepaid expenses | 670 | | | 624 | |
| | | |
| Other current assets | 1,770 | | | 2,496 | |
| | | |
| Total current assets | 18,779 | | | 23,885 | |
| | | |
| Property and equipment, net | 40,549 | | | 41,175 | |
| Operating lease right-of-use assets | 27,793 | | | 28,021 | |
| Financing lease right-of-use assets | 2,899 | | | 3,028 | |
| Goodwill | 11,158 | | | 11,117 | |
| Spectrum licenses | 82,901 | | | 82,828 | |
| Other intangible assets, net | 4,892 | | | 5,298 | |
| Equipment installment plan receivables due after one year, net of allowance for credit losses and imputed discount of $124 and $127 | 2,221 | | | 2,031 | |
| | | |
| Other assets | 12,140 | | | 2,779 | |
| | | |
| Total assets | $ | 203,332 | | | $ | 200,162 | |
| Liabilities and Stockholders' Equity | | | |
| Current liabilities | | | |
| | | |
| Accounts payable and accrued liabilities | $ | 8,712 | | | $ | 10,196 | |
| Payables to affiliates | 108 | | | 157 | |
| Short-term debt | 4,423 | | | 4,579 | |
| | | |
| Deferred revenue | 972 | | | 1,030 | |
| Short-term operating lease liabilities | 3,498 | | | 3,868 | |
| Short-term financing lease liabilities | 1,013 | | | 1,063 | |
| | | |
| Other current liabilities | 769 | | | 810 | |
| | | |
| Total current liabilities | 19,495 | | | 21,703 | |
| | | |
| Long-term debt | 66,395 | | | 61,830 | |
| Long-term debt to affiliates | 4,721 | | | 4,716 | |
| Tower obligations | 2,974 | | | 3,028 | |
| Deferred tax liabilities | 10,154 | | | 9,966 | |
| Operating lease liabilities | 26,602 | | | 26,719 | |
| Financing lease liabilities | 1,316 | | | 1,444 | |
| | | |
| | | |
| Other long-term liabilities | 5,298 | | | 5,412 | |
| | | |
| Total long-term liabilities | 117,460 | | | 113,115 | |
| Commitments and contingencies | | | |
| Stockholders' equity | | | |
| | | |
| | | |
| Common Stock, par value $0.00001 per share, 2,000,000,000 shares authorized; 1,248,334,491 and 1,243,345,584 shares issued, 1,246,773,175 and 1,241,805,706 shares outstanding | — | | | — | |
| Additional paid-in capital | 72,839 | | | 72,772 | |
| Treasury stock, at cost, 1,561,316 and 1,539,878 shares issued | (14) | | | (11) | |
| Accumulated other comprehensive loss | (1,545) | | | (1,581) | |
| Accumulated deficit | (4,903) | | | (5,836) | |
| | | |
| Total stockholders' equity | 66,377 | | | 65,344 | |
| Total liabilities and stockholders' equity | $ | 203,332 | | | $ | 200,162 | |
| | | |
| | | |
| | | |
| | | |
| | | |
| | | |
| | | |
| | | |
| | | |
| | | |
| | | |
| | | |
| | | |
| | | |
| | | |
| | | |
| | | |
| | | |
| | | |
| | | |
T-Mobile US, Inc.
Condensed Consolidated Statements of Comprehensive Income
(Unaudited)
| | | | | | | | | | | | | | | | | | | | | |
| Three Months Ended | | |
| (in millions, except share and per share amounts) | March 31,
2021 | | December 31,
2020 | | March 31,
2020 | | | | |
| Revenues | | | | | | | | | |
| | | | | | | | | |
| Postpaid revenues | $ | 10,303 | | | $ | 10,251 | | | $ | 5,887 | | | | | |
| Prepaid revenues | 2,351 | | | 2,354 | | | 2,373 | | | | | |
| Wholesale revenues | 897 | | | 927 | | | 325 | | | | | |
| Roaming and other service revenues | 641 | | | 648 | | | 261 | | | | | |
| | | | | | | | | |
| Total service revenues | 14,192 | | | 14,180 | | | 8,846 | | | | | |
| | | | | | | | | |
| Equipment revenues | 5,346 | | | 5,973 | | | 2,117 | | | | | |
| Other revenues | 221 | | | 188 | | | 150 | | | | | |
| | | | | | | | | |
| Total revenues | 19,759 | | | 20,341 | | | 11,113 | | | | | |
| | | | | | | | | |
| Operating expenses | | | | | | | | | |
| | | | | | | | | |
| Cost of services, exclusive of depreciation and amortization shown separately below | 3,384 | | | 3,827 | | | 1,639 | | | | | |
| Cost of equipment sales, exclusive of depreciation and amortization shown separately below | 5,142 | | | 5,825 | | | 2,529 | | | | | |
| Selling, general and administrative | 4,805 | | | 4,758 | | | 3,688 | | | | | |
| | | | | | | | | |
| Depreciation and amortization | 4,289 | | | 4,219 | | | 1,718 | | | | | |
| | | | | | | | | |
| | | | | | | | | |
| Total operating expenses | 17,620 | | | 18,629 | | | 9,574 | | | | | |
| | | | | | | | | |
| Operating income | 2,139 | | | 1,712 | | | 1,539 | | | | | |
| | | | | | | | | |
| Other income (expense) | | | | | | | | | |
| | | | | | | | | |
| Interest expense | (792) | | | (757) | | | (185) | | | | | |
| Interest expense to affiliates | (46) | | | (41) | | | (99) | | | | | |
| Interest income | 3 | | | 8 | | | 12 | | | | | |
| Other expense, net | (125) | | | (101) | | | (10) | | | | | |
| Total other expense, net | (960) | | | (891) | | | (282) | | | | | |
| Income before income taxes | 1,179 | | | 821 | | | 1,257 | | | | | |
| Income tax expense | (246) | | | (71) | | | (306) | | | | | |
| | | | | | | | | |
| | | | | | | | | |
| | | | | | | | | |
| Net income | $ | 933 | | | $ | 750 | | | $ | 951 | | | | | |
| | | | | | | | | |
| | | | | | | | | |
| | | | | | | | | |
| Net income | $ | 933 | | | $ | 750 | | | $ | 951 | | | | | |
| Other comprehensive income (loss), net of tax | | | | | | | | | |
| | | | | | | | | |
| | | | | | | | | |
| Unrealized gain (loss) on cash flow hedges, net of tax effect of $12, $11 and ($276) | 34 | | | 34 | | | (792) | | | | | |
| Unrealized gain on foreign currency translation adjustment, net of tax effect of $0, $0 and $0 | 2 | | | — | | | — | | | | | |
| | | | | | | | | |
| Net unrecognized gain (loss) on pension and other postretirement benefits, net of tax effect of $0, $2 and $0 | — | | | 6 | | | — | | | | | |
| | | | | | | | | |
| Other comprehensive income (loss) | 36 | | | 40 | | | (792) | | | | | |
| | | | | | | | | |
| Total comprehensive income | $ | 969 | | | $ | 790 | | | $ | 159 | | | | | |
| Earnings per share | | | | | | | | | |
| | | | | | | | | |
| | | | | | | | | |
| | | | | | | | | |
| Basic | $ | 0.75 | | | $ | 0.60 | | | $ | 1.11 | | | | | |
| | | | | | | | | |
| | | | | | | | | |
| | | | | | | | | |
| Diluted | $ | 0.74 | | | $ | 0.60 | | | $ | 1.10 | | | | | |
| Weighted average shares outstanding | | | | | | | | | |
| Basic | 1,243,520,026 | | | 1,241,578,615 | | | 858,148,284 | | | | | |
| Diluted | 1,252,783,564 | | | 1,251,566,899 | | | 865,998,532 | | | | | |
| | | | | | | | | |
| | | | | | | | | |
| | | | | | | | | |
| | | | | | | | | |
| | | | | | | | | |
| | | | | | | | | |
| | | | | | | | | |
| | | | | | | | | |
| | | | | | | | | |
| | | | | | | | | |
| | | | | | | | | |
| | | | | | | | | |
| | | | | | | | | |
| | | | | | | | | |
| | | | | | | | | |
| | | | | | | | | |
| | | | | | | | | |
| | | | | | | | | |
| | | | | | | | | |
| | | | | | | | | |
| | | | | | | | | |
| | | | | | | | | |
| | | | | | | | | |
| | | | | | | | | |
| | | | | | | | | |
| | | | | | | | | |
| | | | | | | | | |
| | | | | | | | | |
| | | | | | | | | |
| | | | | | | | | |
T-Mobile US, Inc.
Condensed Consolidated Statements of Cash Flows
(Unaudited)
| | | | | | | | | | | | | | | | | | | | | |
| Three Months Ended | | |
| (in millions) | March 31,
2021 | | December 31,
2020 | | March 31,
2020 | | | | |
| Operating activities | | | | | | | | | |
| Net income | $ | 933 | | | $ | 750 | | | $ | 951 | | | | | |
| Adjustments to reconcile net income to net cash provided by operating activities | | | | | | | | | |
| | | | | | | | | |
| Depreciation and amortization | 4,289 | | | 4,219 | | | 1,718 | | | | | |
| Stock-based compensation expense | 138 | | | 136 | | | 138 | | | | | |
| Deferred income tax expense | 211 | | | 79 | | | 310 | | | | | |
| Bad debt expense | 82 | | | 113 | | | 113 | | | | | |
| (Gains) losses from sales of receivables | (18) | | | (1) | | | 25 | | | | | |
| | | | | | | | | |
| Losses on redemption of debt | 101 | | | 100 | | | — | | | | | |
| | | | | | | | | |
| | | | | | | | | |
| | | | | | | | | |
| Changes in operating assets and liabilities | | | | | | | | | |
| Accounts receivable | 96 | | | (489) | | | (748) | | | | | |
| Equipment installment plan receivables | (727) | | | (1,343) | | | 69 | | | | | |
| Inventories | 279 | | | (609) | | | (511) | | | | | |
| Operating lease right-of-use assets | 1,124 | | | 939 | | | 527 | | | | | |
| Other current and long-term assets | 54 | | | (296) | | | 6 | | | | | |
| Accounts payable and accrued liabilities | (1,384) | | | 507 | | | (405) | | | | | |
| Short and long-term operating lease liabilities | (1,369) | | | (752) | | | (725) | | | | | |
| Other current and long-term liabilities | (217) | | | (16) | | | 79 | | | | | |
| Other, net | 69 | | | 137 | | | 70 | | | | | |
| | | | | | | | | |
| Net cash provided by operating activities | 3,661 | | | 3,474 | | | 1,617 | | | | | |
| Investing activities | | | | | | | | | |
| | | | | | | | | |
| Purchases of property and equipment, including capitalized interest of ($84), ($101) and ($112) | (3,183) | | | (3,807) | | | (1,753) | | | | | |
| Purchases of spectrum licenses and other intangible assets, including deposits | (8,922) | | | (506) | | | (99) | | | | | |
| | | | | | | | | |
| Proceeds related to beneficial interests in securitization transactions | 891 | | | 809 | | | 868 | | | | | |
| Net cash related to derivative contracts under collateral exchange arrangements | — | | | — | | | (580) | | | | | |
| Acquisition of companies, net of cash and restricted cash acquired | (29) | | | — | | | — | | | | | |
| Proceeds from the divestiture of prepaid business | — | | | (14) | | | — | | | | | |
| Other, net | 4 | | | (129) | | | (16) | | | | | |
| | | | | | | | | |
| Net cash used in investing activities | (11,239) | | | (3,647) | | | (1,580) | | | | | |
| Financing activities | | | | | | | | | |
| | | | | | | | | |
| Proceeds from issuance of long-term debt | 6,763 | | | 8,643 | | | — | | | | | |
| | | | | | | | | |
| | | | | | | | | |
| | | | | | | | | |
| Repayments of financing lease obligations | (287) | | | (257) | | | (282) | | | | | |
| Repayments of short-term debt for purchases of inventory, property and equipment and other financial liabilities | (55) | | | (74) | | | (25) | | | | | |
| Repayments of long-term debt | (2,219) | | | (4,209) | | | — | | | | | |
| | | | | | | | | |
| | | | | | | | | |
| | | | | | | | | |
| | | | | | | | | |
| | | | | | | | | |
| Tax withholdings on share-based awards | (218) | | | (88) | | | (141) | | | | | |
| | | | | | | | | |
| Cash payments for debt prepayment or debt extinguishment costs | (65) | | | — | | | — | | | | | |
| Other, net | (45) | | | (36) | | | (5) | | | | | |
| | | | | | | | | |
| Net cash provided by (used in) financing activities | 3,874 | | | 3,979 | | | (453) | | | | | |
| Change in cash and cash equivalents, including restricted cash | (3,704) | | | 3,806 | | | (416) | | | | | |
| Cash and cash equivalents, including restricted cash | | | | | | | | | |
| Beginning of period | 10,463 | | | 6,657 | | | 1,528 | | | | | |
| End of period | $ | 6,759 | | | $ | 10,463 | | | $ | 1,112 | | | | | |
| | | | | | | | | |
| | | | | | | | | |
| | | | | | | | | |
| | | | | | | | | |
| | | | | | | | | |
| | | | | | | | | |
| | | | | | | | | |
| | | | | | | | | |
| | | | | | | | | |
| | | | | | | | | |
| | | | | | | | | |
| | | | | | | | | |
| | | | | | | | | |
| | | | | | | | | |
| | | | | | | | | |
| | | | | | | | | |
| | | | | | | | | |
| | | | | | | | | |
| | | | | | | | | |
| | | | | | | | | |
| | | | | | | | | |
| | | | | | | | | |
| | | | | | | | | |
| | | | | | | | | |
| | | | | | | | | |
| | | | | | | | | |
| | | | | | | | | |
| | | | | | | | | |
T-Mobile US, Inc.
Condensed Consolidated Statements of Cash Flows (Continued)
(Unaudited)
| | | | | | | | | | | | | | | | | | | | | |
| Three Months Ended | | |
| (in millions) | March 31,
2021 | | December 31,
2020 | | March 31,
2020 | | | | |
| Supplemental disclosure of cash flow information | | | | | | | | | |
| Interest payments, net of amounts capitalized | $ | 945 | | | $ | 844 | | | $ | 341 | | | | | |
| Operating lease payments | 1,651 | | | 1,126 | | | 875 | | | | | |
| Income tax payments | 22 | | | 100 | | | 24 | | | | | |
| Non-cash investing and financing activities | | | | | | | | | |
| Non-cash beneficial interest obtained in exchange for securitized receivables | $ | 1,381 | | | $ | 1,560 | | | $ | 1,613 | | | | | |
| | | | | | | | | |
| Change in accounts payable and accrued liabilities for purchases of property and equipment | (173) | | | 1,144 | | | (301) | | | | | |
| Leased devices transferred from inventory to property and equipment | 485 | | | 443 | | | 309 | | | | | |
| Returned leased devices transferred from property and equipment to inventory | (445) | | | (430) | | | (59) | | | | | |
| | | | | | | | | |
| Operating lease right-of-use assets obtained in exchange for lease obligations | 911 | | | 1,083 | | | 555 | | | | | |
| Financing lease right-of-use assets obtained in exchange for lease obligations | 109 | | | 361 | | | 178 | | | | | |
n.gT-Mobile US, Inc.
Supplementary Operating and Financial Data
(Unaudited)
| | | | | | | | | | | | | | | | | | | | | | | | | | | | | | | | | | | | | | | |
| | | | | | | Quarter | | |
| (in thousands) | | | | | | | Q1 2020 | | Q2 2020 | | Q3 2020 | | Q4 2020 | | Q1 2021 | | | | |
| Customers, end of period | | | | | | | | | | | | | | | | | | | |
| | | | | | | | | | | | | | | | | | | |
Postpaid phone customers (1) | | | | | | | 40,797 | | | 65,105 | | | 65,794 | | | 66,618 | | | 67,402 | | | | | |
Postpaid other customers (1) | | | | | | | 7,014 | | | 12,648 | | | 13,938 | | | 14,732 | | | 15,170 | | | | | |
| | | | | | | | | | | | | | | | | | | |
| Total postpaid customers | | | | | | | 47,811 | | | 77,753 | | | 79,732 | | | 81,350 | | | 82,572 | | | | | |
| | | | | | | | | | | | | | | | | | | |
Prepaid customers (1) | | | | | | | 20,732 | | | 20,574 | | | 20,630 | | | 20,714 | | | 20,865 | | | | | |
| | | | | | | | | | | | | | | | | | | |
| Total customers | | | | | | | 68,543 | | | 98,327 | | | 100,362 | | | 102,064 | | | 103,437 | | | | | |
| | | | | | | | | | | | | | | | | | | |
| | | | | | | | | | | | | | | | | | | |
| | | | | | | | | | | | | | | | | | | |
| | | | | | | | | | | | | | | | | | | |
| | | | | | | | | | | | | | | | | | | |
Acquired customers, net of base adjustments (1)(2) | | | | | | | — | | | 29,228 | | | — | | | — | | | 12 | | | | | |
| | | | | | | | | | | | | | | | | | | |
| | | | | | | | | | | | | | | | | | | |
| | | | | | | | | | | | | | | | | | | |
| | | | | | | | | | | | | | | | | | | |
| | | | | | | | | | | | | | | | | | | |
| | | | | | | | | | | | | | | | | | | |
| | | | | | | | | | | | | | | | | | | |
| | | | | | | | | | | | | | | | | | | |
| | | | | | | | | | | | | | | | | | | |
| | | | | | | | | | | | | | | | | | | |
| | | | | | | | | | | | | | | | | | | |
| | | | | | | | | | | | | | | | | | | |
| | | | | | | | | | | | | | | | | | | |
| | | | | | | | | | | | | | | | | | | |
| | | | | | | | | | | | | | | | | | | |
| | | | | | | | | | | | | | | | | | | |
| | | | | | | | | | | | | | | | | | | |
| | | | | | | | | | | | | | | | | | | |
| | | | | | | | | | | | | | | | | | | |
| | | | | | | | | | | | | | | | | | | |
| | | | | | | | | | | | | | | | | | | |
| | | | | | | | | | | | | | | | | | | |
| | | | | | | | | | | | | | | | | | | |
| | | | | | | | | | | | | | | | | | | |
| | | | | | | | | | | | | | | | | | | |
| | | | | | | | | | | | | | | | | | | |
| | | | | | | | | | | | | | | | | | | |
| | | | | | | | | | | | | | | | | | | |
| | | | | | | | | | | | | | | | | | | |
| | | | | | | | | | | | | | | | | | | |
| | | | | | | | | | | | | | | | | | | |
| | | | | | | | | | | | | | | | | | | |
(1)Includes customers acquired in connection with the Merger and certain customer base adjustments. See Reconciliations to Beginning Customers.
(2)In the first quarter of 2021, we acquired 11,000 postpaid phone customers and 1,000 postpaid other customers through an acquisition of an affiliate.
| | | | | | | | | | | | | | | | | | | | | | | | | | | | | | | | | | | | | | | |
| | | | | | | Quarter | | |
| (in thousands) | | | | | | | Q1 2020 | | Q2 2020 | | Q3 2020 | | Q4 2020 | | Q1 2021 | | | | |
| Net customer additions (losses) | | | | | | | | | | | | | | | | | | | |
| | | | | | | | | | | | | | | | | | | |
| Postpaid phone customers | | | | | | | 452 | | | 253 | | | 689 | | | 824 | | | 773 | | | | | |
| Postpaid other customers | | | | | | | 325 | | | 859 | | | 1,290 | | | 794 | | | 437 | | | | | |
| | | | | | | | | | | | | | | | | | | |
| Total postpaid customers | | | | | | | 777 | | | 1,112 | | | 1,979 | | | 1,618 | | | 1,210 | | | | | |
| | | | | | | | | | | | | | | | | | | |
| Prepaid customers | | | | | | | (128) | | | 133 | | | 56 | | | 84 | | | 151 | | | | | |
| | | | | | | | | | | | | | | | | | | |
| Total customers | | | | | | | 649 | | | 1,245 | | | 2,035 | | | 1,702 | | | 1,361 | | | | | |
| | | | | | | | | | | | | | | | | | | |
| | | | | | | | | | | | | | | | | | | |
| | | | | | | | | | | | | | | | | | | |
| | | | | | | | | | | | | | | | | | | |
| | | | | | | | | | | | | | | | | | | |
| | | | | | | | | | | | | | | | | | | |
| | | | | | | | | | | | | | | | | | | |
| | | | | | | | | | | | | | | | | | | |
| | | | | | | | | | | | | | | | | | | |
| | | | | | | | | | | | | | | | | | | |
| | | | | | | | | | | | | | | | | | | |
| | | | | | | | | | | | | | | | | | | |
| | | | | | | | | | | | | | | | | | | |
| | | | | | | | | | | | | | | | | | | |
| | | | | | | | | | | | | | | | | | | |
| | | | | | | | | | | | | | | | | | | |
| | | | | | | | | | | | | | | | | | | |
| | | | | | | | | | | | | | | | | | | |
| | | | | | | | | | | | | | | | | | | |
| | | | | | | | | | | | | | | | | | | |
| | | | | | | | | | | | | | | | | | | |
| | | | | | | | | | | | | | | | | | | |
| | | | | | | | | | | | | | | | | | | |
| | | | | | | | | | | | | | | | | | | |
| | | | | | | | | | | | | | | | | | | |
| | | | | | | | | | | | | | | | | | | |
| | | | | | | | | | | | | | | | | | | |
| | | | | | | | | | | | | | | | | | | |
| | | | | | | | | | | | | | | | | | | |
| | | | | | | | | | | | | | | | | | | |
| | | | | | | | | | | | | | | | | | | |
| | | | | | | | | | | | | | | | | | | |
| | | | | | | | | | | | | | | | | | | |
| | | | | | | | | | | | | | | | | | | |
| | | | | | | | | | | | | | | | | | | |
| | | | | | | | | | | | | | | | | | | |
| | | | | | | | | | | | | | | | | | | |
| | | | | | | | | | | | | | | | | | | |
| | | | | | | | | | | | | | | | | | | |
| | | | | | | | | | | | | | | | | | | |
| | | | | | | | | | | | | | | | | | | |
| | | | | | | | | | | | | | | | | | | |
| | | | | | | | | | | | | | | | | | | |
| | | | | | | | | | | | | | | | | | | | | | | | | | | | | | | | | | | | | | | |
| | | | | | | Quarter |
| (in millions, except percentages) | | | | | | | Q1 2020 | | Q2 2020 | | Q3 2020 | | Q4 2020 | | Q1 2021 | | | | |
| Devices sold or leased | | | | | | | | | | | | | | | | | | | |
| Phones | | | | | | | 6.4 | | 8.9 | | 9.2 | | 10.1 | | 9.6 | | | | |
| Mobile broadband and IoT devices | | | | | | | 0.8 | | 1.2 | | 2.2 | | 1.6 | | 1.0 | | | | |
| Total | | | | | | | 7.2 | | 10.1 | | 11.4 | | 11.7 | | 10.6 | | | | |
| | | | | | | | | | | | | | | | | | | |
| Postpaid upgrade rate | | | | | | | 3.8 | % | | 4.5 | % | | 4.3 | % | | 5.7 | % | | 4.8 | % | | | | |
| | | | | | | | | | | | | | | | | | | | | | | | | | | | | | | | | | | | | | | |
| | | | | | | Quarter | | |
| | | | | | | Q1 2020 | | Q2 2020 | | Q3 2020 | | Q4 2020 | | Q1 2021 | | | | |
| Churn | | | | | | | | | | | | | | | | | | | |
| Postpaid phone churn | | | | | | | 0.86 | % | | 0.80 | % | | 0.90 | % | | 1.03 | % | | 0.98 | % | | | | |
| Prepaid churn | | | | | | | 3.52 | % | | 2.81 | % | | 2.86 | % | | 2.92 | % | | 2.78 | % | | | | |
| | | | | | | | | | | | | | | | | | | | | | | | | | | | | | | | | | | | | | | |
| | | | | | | Quarter | | |
| (in thousands) | | | | | | | Q1 2020 | | Q2 2020 | | Q3 2020 | | Q4 2020 | | Q1 2021 | | | | |
| Accounts, end of period | | | | | | | | | | | | | | | | | | | |
Total postpaid customer accounts (1) | | | | | | | 15,244 | | 25,486 | | 25,623 | | 25,754 | | 26,014 | | | | |
| | | | | | | | | | | | | | | | | | | |
| | | | | | | | | | | | | | | | | | | |
(1)Includes accounts acquired in connection with the Merger and certain account base adjustments. See Reconciliations to Beginning Customers and Accounts in this Investor Factbook.
T-Mobile US, Inc.
Supplementary Operating and Financial Data (continued)
(Unaudited)
| | | | | | | | | | | | | | | | | | | | | | | | | | | | | | | | | | | | | | | |
| | | | | | | Quarter | | |
| (in millions, except percentages) | | | | | | | Q1 2020 | | Q2 2020 | | Q3 2020 | | Q4 2020 | | Q1 2021 | | | | |
| Financial Measures | | | | | | | | | | | | | | | | | | | |
| | | | | | | | | | | | | | | | | | | |
| Service revenues | | | | | | | $ | 8,846 | | | $ | 13,230 | | | $ | 14,139 | | | $ | 14,180 | | | $ | 14,192 | | | | | |
| Total revenues | | | | | | | 11,113 | | | 17,671 | | | 19,272 | | | 20,341 | | | 19,759 | | | | | |
| | | | | | | | | | | | | | | | | | | |
| Net income | | | | | | | $ | 951 | | | $ | 110 | | | $ | 1,253 | | | $ | 750 | | | $ | 933 | | | | | |
| Net income margin | | | | | | | 10.8 | % | | 0.8 | % | | 8.9 | % | | 5.3 | % | | 6.6 | % | | | | |
| | | | | | | | | | | | | | | | | | | |
| Adjusted EBITDA | | | | | | | $ | 3,665 | | | $ | 7,017 | | | $ | 7,129 | | | $ | 6,746 | | | $ | 6,905 | | | | | |
| Adjusted EBITDA margin | | | | | | | 41.4 | % | | 53.0 | % | | 50.4 | % | | 47.6 | % | | 48.7 | % | | | | |
| Core Adjusted EBITDA | | | | | | | $ | 3,500 | | | $ | 5,596 | | | $ | 5,779 | | | $ | 5,501 | | | $ | 5,864 | | | | | |
| Core Adjusted EBITDA margin | | | | | | | 39.6 | % | | 42.3 | % | | 40.9 | % | | 38.8 | % | | 41.3 | % | | | | |
| | | | | | | | | | | | | | | | | | | |
| Cost of services | | | | | | | $ | 1,639 | | | $ | 3,098 | | | $ | 3,314 | | | $ | 3,827 | | | $ | 3,384 | | | | | |
| Merger-related costs | | | | | | | — | | | 40 | | | 79 | | | 527 | | | 136 | | | | | |
| Cost of services excluding Merger-related costs | | | | | | | $ | 1,639 | | | $ | 3,058 | | | $ | 3,235 | | | $ | 3,300 | | | $ | 3,248 | | | | | |
| | | | | | | | | | | | | | | | | | | |
| Selling, general and administrative | | | | | | | $ | 3,688 | | | $ | 5,604 | | | $ | 4,876 | | | $ | 4,758 | | | $ | 4,805 | | | | | |
| Merger-related costs | | | | | | | 143 | | | 758 | | | 209 | | | 153 | | | 145 | | | | | |
COVID-19-related costs (1) | | | | | | | 117 | | | 341 | | | — | | | — | | | — | | | | | |
| Selling, general and administrative excluding Merger-related costs and COVID-19-related costs | | | | | | | $ | 3,428 | | | $ | 4,505 | | | $ | 4,667 | | | $ | 4,605 | | | $ | 4,660 | | | | | |
| | | | | | | | | | | | | | | | | | | |
| Total bad debt expense and losses from sales of receivables | | | | | | | $ | 138 | | | $ | 263 | | | $ | 125 | | | $ | 112 | | | $ | 64 | | | | | |
| Bad debt and losses from sales of receivables as a percentage of Total revenues | | | | | | | 1.24 | % | | 1.49 | % | | 0.65 | % | | 0.55 | % | | 0.32 | % | | | | |
| | | | | | | | | | | | | | | | | | | |
| Cash purchases of property and equipment including capitalized interest | | | | | | | $ | 1,753 | | | $ | 2,257 | | | $ | 3,217 | | | $ | 3,807 | | | $ | 3,183 | | | | | |
| Capitalized interest | | | | | | | 112 | | | 119 | | | 108 | | | 101 | | | 84 | | | | | |
| | | | | | | | | | | | | | | | | | | |
| Net cash proceeds from securitization | | | | | | | (5) | | | (99) | | | 5 | | | (130) | | | 22 | | | | | |
(1)Supplemental employee payroll, third-party commissions and cleaning-related COVID-19 costs were not significant for Q3 and Q4 2020 and Q1 2021.
| | | | | | | | | | | | | | | | | | | | | | | | | | | | | | | | | | | | | | | |
| | | | | | | Quarter | | |
| (in millions, except percentages) | | | | | | | Q1 2020 | | Q2 2020 | | Q3 2020 | | Q4 2020 | | Q1 2021 | | | | |
| Device Financing - Equipment Installment Plans | | | | | | | | | | | | | | | | | | | |
| Gross EIP financed | | | | | | | $ | 1,440 | | | $ | 1,825 | | | $ | 2,356 | | | $ | 4,126 | | | $ | 3,379 | | | | | |
| EIP billings | | | | | | | 1,790 | | | 2,217 | | | 2,130 | | | 2,285 | | | 2,556 | | | | | |
| EIP receivables, net | | | | | | | 3,773 | | | 4,593 | | | 4,481 | | | 5,608 | | | 6,062 | | | | | |
| EIP receivables classified as prime | | | | | | | 52 | % | | 48 | % | | 53 | % | | 57 | % | | 57 | % | | | | |
| EIP receivables classified as prime (including EIP receivables sold) | | | | | | | 53 | % | | 50 | % | | 54 | % | | 57 | % | | 56 | % | | | | |
| | | | | | | | | | | | | | | | | | | |
| Device Financing - Leased Devices | | | | | | | | | | | | | | | | | | | |
| Lease revenues | | | | | | | $ | 165 | | | $ | 1,421 | | | $ | 1,350 | | | $ | 1,245 | | | $ | 1,041 | | | | | |
| Leased device depreciation | | | | | | | 163 | | | 946 | | | 1,000 | | | 982 | | | 897 | | | | | |
| Leased devices transferred from inventory to property and equipment | | | | | | | 309 | | | 1,444 | | | 599 | | | 443 | | | 485 | | | | | |
| Returned leased devices transferred from property and equipment to inventory | | | | | | | (59) | | | (538) | | | (433) | | | (430) | | | (445) | | | | | |
| Leased devices included in property and equipment, net | | | | | | | 819 | | | 6,621 | | | 5,788 | | | 4,819 | | | 3,962 | | | | | |
| Leased devices (units) included in property and equipment, net | | | | | | | 2.1 | | 17.0 | | 15.8 | | 14.2 | | 12.4 | | | | |
T-Mobile US, Inc.
Calculation of Operating Measures
(Unaudited)
The following table illustrates the calculation of our operating measures ARPA and ARPU from the related service revenues:
| | | | | | | | | | | | | | | | | | | | | | | | | | | | | | | | | | | | | | | |
| (in millions, except average number of accounts and customers, ARPA and ARPU) | | | | | | | Quarter | | |
| | | | | | Q1 2020 | | Q2 2020 | | Q3 2020 | | Q4 2020 | | Q1 2021 | | | | |
| Calculation of Postpaid ARPA | | | | | | | | | | | | | | | | | | | |
| Postpaid service revenues | | | | | | | $ | 5,887 | | | $ | 9,959 | | | $ | 10,209 | | | $ | 10,251 | | | $ | 10,303 | | | | | |
| | | | | | | | | | | | | | | | | | | |
| | | | | | | | | | | | | | | | | | | |
| Divided by: Average number of postpaid accounts (in thousands) and number of months in period | | | | | | | 15,155 | | | 25,424 | | | 25,582 | | | 25,677 | | | 25,840 | | | | | |
| Postpaid ARPA | | | | | | | $ | 129.47 | | | $ | 130.57 | | | $ | 133.03 | | | $ | 133.08 | | | $ | 132.91 | | | | | |
| Calculation of Postpaid Phone ARPU | | | | | | | | | | | | | | | | | | | |
| | | | | | | | | | | | | | | | | | | |
| Postpaid service revenues | | | | | | | $ | 5,887 | | | $ | 9,959 | | | $ | 10,209 | | | $ | 10,251 | | | $ | 10,303 | | | | | |
| Less: Postpaid other revenues | | | | | | | (310) | | | (618) | | | (677) | | | (762) | | | (820) | | | | | |
| | | | | | | | | | | | | | | | | | | |
| Postpaid phone service revenues | | | | | | | 5,577 | | | 9,341 | | | 9,532 | | | 9,489 | | | 9,483 | | | | | |
| Divided by: Average number of postpaid phone customers (in thousands) and number of months in period | | | | | | | 40,585 | | 64,889 | | 65,437 | | 66,084 | | 66,834 | | | | |
| Postpaid phone ARPU | | | | | | | $ | 45.80 | | | $ | 47.99 | | | $ | 48.55 | | | $ | 47.86 | | | $ | 47.30 | | | | | |
| Calculation of Prepaid ARPU | | | | | | | | | | | | | | | | | | | |
| | | | | | | | | | | | | | | | | | | |
| Prepaid service revenues | | | | | | | $ | 2,373 | | | $ | 2,311 | | | $ | 2,383 | | | $ | 2,354 | | | $ | 2,351 | | | | | |
| Divided by: Average number of prepaid customers (in thousands) and number of months in period | | | | | | | 20,759 | | | 20,380 | | | 20,632 | | | 20,605 | | | 20,728 | | | | | |
| | | | | | | | | | | | | | | | | | | |
| Prepaid ARPU | | | | | | | $ | 38.11 | | | $ | 37.80 | | | $ | 38.49 | | | $ | 38.08 | | | $ | 37.81 | | | | | |
| | | | | | | | | | | | | | | | | | | |
| | | | | | | | | | | | | | | | | | | |
| | | | | | | | | | | | | | | | | | | |
| | | | | | | | | | | | | | | | | | | |
| | | | | | | | | | | | | | | | | | | |
| | | | | | | | | | | | | | | | | | | |
| | | | | | | | | | | | | | | | | | | |
| | | | | | | | | | | | | | | | | | | |
| | | | | | | | | | | | | | | | | | | |
| | | | | | | | | | | | | | | | | | | |
| | | | | | | | | | | | | | | | | | | |
| | | | | | | | | | | | | | | | | | | |
| | | | | | | | | | | | | | | | | | | |
| | | | | | | | | | | | | | | | | | | |
| | | | | | | | | | | | | | | | | | | |
| | | | | | | | | | | | | | | | | | | |
| | | | | | | | | | | | | | | | | | | |
| | | | | | | | | | | | | | | | | | | |
| | | | | | | | | | | | | | | | | | | |
| | | | | | | | | | | | | | | | | | | |
| | | | | | | | | | | | | | | | | | | |
T-Mobile US, Inc.
Reconciliation of Non-GAAP Financial Measures to GAAP Financial Measures
(Unaudited)
This Investor Factbook includes non-GAAP financial measures. The non-GAAP financial measures should be considered in addition to, but not as a substitute for, the information provided in accordance with GAAP. Reconciliations for the non-GAAP financial measures to the most directly comparable GAAP financial measures are provided below. T-Mobile is not able to forecast Net income on a forward-looking basis without unreasonable efforts due to the high variability and difficulty in predicting certain items that affect GAAP net income including, but not limited to, Income tax expense, stock-based compensation expense and Interest expense. Adjusted EBITDA and Core Adjusted EBITDA should not be used to predict Net income as the difference between these measures and Net income is variable.
The following table includes the impact of the Sprint Merger on a prospective basis from the close date of April 1, 2020. Historical results have not been restated and reflect standalone T-Mobile.
Adjusted EBITDA and Core Adjusted EBITDA are reconciled to Net income as follows:
| | | | | | | | | | | | | | | | | | | | | | | | | | | | | | | | | | | | | | | | | | | |
| | | | | | | Quarter | | | | | | |
| (in millions) | | | | | | | Q1 2020 | | Q2 2020 | | Q3 2020 | | Q4 2020 | | Q1 2021 | | | | | | | | |
| Net income | | | | | | | $ | 951 | | | $ | 110 | | | $ | 1,253 | | | $ | 750 | | | $ | 933 | | | | | | | | | |
| Adjustments: | | | | | | | | | | | | | | | | | | | | | | | |
| Income from discontinued operations, net of tax | | | | | | | — | | | (320) | | | — | | | — | | | — | | | | | | | | | |
| Income from continuing operations | | | | | | | 951 | | | (210) | | | 1,253 | | | 750 | | | 933 | | | | | | | | | |
| Interest expense | | | | | | | 185 | | | 776 | | | 765 | | | 757 | | | 792 | | | | | | | | | |
| Interest expense to affiliates | | | | | | | 99 | | | 63 | | | 44 | | | 41 | | | 46 | | | | | | | | | |
| Interest income | | | | | | | (12) | | | (6) | | | (3) | | | (8) | | | (3) | | | | | | | | | |
| Other (income) expense, net | | | | | | | 10 | | | 195 | | | 99 | | | 101 | | | 125 | | | | | | | | | |
| Income tax expense | | | | | | | 306 | | | 2 | | | 407 | | | 71 | | | 246 | | | | | | | | | |
| | | | | | | | | | | | | | | | | | | | | | | |
| Operating income | | | | | | | 1,539 | | | 820 | | | 2,565 | | | 1,712 | | | 2,139 | | | | | | | | | |
| Depreciation and amortization | | | | | | | 1,718 | | | 4,064 | | | 4,150 | | | 4,219 | | | 4,289 | | | | | | | | | |
Operating income from discontinued operations (1) | | | | | | | — | | | 432 | | | — | | | — | | | — | | | | | | | | | |
Stock-based compensation (2) | | | | | | | 123 | | | 139 | | | 125 | | | 129 | | | 130 | | | | | | | | | |
| Merger-related costs | | | | | | | 143 | | | 798 | | | 288 | | | 686 | | | 298 | | | | | | | | | |
COVID-19-related costs (3) | | | | | | | 117 | | | 341 | | | — | | | — | | | — | | | | | | | | | |
| Impairment expense | | | | | | | — | | | 418 | | | — | | | — | | | — | | | | | | | | | |
Other, net (4) | | | | | | | 25 | | | 5 | | | 1 | | | — | | | 49 | | | | | | | | | |
| | | | | | | | | | | | | | | | | | | | | | | |
| Adjusted EBITDA | | | | | | | 3,665 | | | 7,017 | | | 7,129 | | | 6,746 | | | 6,905 | | | | | | | | | |
| Lease revenues | | | | | | | (165) | | | (1,421) | | | (1,350) | | | (1,245) | | | (1,041) | | | | | | | | | |
| Core Adjusted EBITDA | | | | | | | $ | 3,500 | | | $ | 5,596 | | | $ | 5,779 | | | $ | 5,501 | | | $ | 5,864 | | | | | | | | | |
| | | | | | | | | | | | | | | | | | | | | | | |
| | | | | | | | | | | | | | | | | | | | | | | |
| | | | | | | | | | | | | | | | | | | | | | | |
| | | | | | | | | | | | | | | | | | | | | | | |
| | | | | | | | | | | | | | | | | | | | | | | |
| | | | | | | | | | | | | | | | | | | | | | | |
| | | | | | | | | | | | | | | | | | | | | | | |
| | | | | | | | | | | | | | | |
| | | | | | | | | | | | | | | | | | | | | | | |
| | | | | | | | | | | | | | | | | | | | | | | |
| | | | | | | | | | | | | | | | | | | | | | | |
| | | | | | | | | | | | | | | | | | | | | | | |
| | | | | | | | | | | | | | | | | | | | | | | |
| | | | | | | | | | | | | | | | | | | | | | | |
| | | | | | | | | | | | | | | | | | | | | | | |
| | | | | | | | | | | | | | | | | | | | | | | |
| | | | | | | | | | | | | | | | | | | | | | | |
| | | | | | | | | | | | | | | | | | | | | | | |
| | | | | | | | | | | | | | | | | | | | | | | |
| | | | | | | | | | | | | | | | | | | | | | | |
| | | | | | | | | | | | | | | | | | | | | | | |
| | | | | | | | | | | | | | | | | | | | | | | |
| | | | | | | | | | | | | | | | | | | | | | | |
| | | | | | | | | | | | | | | | | | | | | | | |
| | | | | | | | | | | | | | | | | | | | | | | |
| | | | | | | | | | | | | | | | | | | | | | | |
| | | | | | | | | | | | | | | | | | | | | | | |
| | | | | | | | | | | | | | | | | | | | | | | |
| | | | | | | | | | | | | | | | | | | | | | | |
| | | | | | | | | | | | | | | | | | | | | | | |
| | | | | | | | | | | | | | | | | | | | | | | |
| | | | | | | | | | | | | | | | | | | | | | | |
| | | | | | | | | | | | | | | | | | | | | | | |
| | | | | | | | | | | | | | | | | | | | | | | |
| | | | | | | | | | | | | | | | | | | | | | | |
| | | | | | | | | | | | | | | | | | | | | | | |
| | | | | | | | | | | | | | | | | | | | | | | |
| | | | | | | | | | | | | | | | | | | | | | | |
| | | | | | | | | | | | | | | | | | | | | | | |
(1)Following the Prepaid Transaction (as defined below), starting on July 1, 2020, we provide MVNO services to DISH. We have included the operating income from discontinued operations in our determination of the Adjusted EBITDA to reflect contributions of the Prepaid Business that has been replaced by the MVNO Agreement beginning on July 1, 2020 in order to enable management, analysts and investors to better assess ongoing operating performance and trends.
(2)Stock-based compensation includes payroll tax impacts and may not agree to stock-based compensation expense in the Condensed Consolidated Financial Statements. Additionally, certain stock-based compensation expenses associated with the Sprint Merger have been included in Merger-related costs.
(3)Supplemental employee payroll, third-party commissions and cleaning-related COVID-19 costs were not significant for Q3 and Q4 2020 and Q1 2021.
(4)Other, net may not agree to the Condensed Consolidated Statements of Comprehensive Income, primarily due to certain non-routine operating activities, such as other special items that would not be expected to reoccur or are not reflective of T-Mobile’s ongoing operating performance, and are therefore excluded in Adjusted EBITDA and Core Adjusted EBITDA.
T-Mobile US, Inc.
Reconciliation of Non-GAAP Financial Measures to GAAP Financial Measures (continued)
(Unaudited)
Net debt (excluding tower obligations) to the LTM Pro Forma Adjusted EBITDA and Pro Forma Core Adjusted EBITDA ratios are calculated as follows:
| | | | | | | | | | | | | | | | | | | | | | | | | | | | | | | | | | | |
| (in millions, except net debt ratios) | | | | | | | Mar 31,
2020 | | Jun 30,
2020 | | Sep 30,
2020 | | Dec 31,
2020 | | Mar 31,
2021 |
| | | | | | | | | | | | | | | |
| Short-term debt | | | | | | | $ | — | | | $ | 3,818 | | | $ | 3,713 | | | $ | 4,579 | | | $ | 4,423 | |
| Short-term debt to affiliates | | | | | | | 2,000 | | | 1,235 | | | — | | | — | | | — | |
| Short-term financing lease liabilities | | | | | | | 918 | | | 1,040 | | | 1,050 | | | 1,063 | | | 1,013 | |
| Long-term debt | | | | | | | 10,959 | | | 62,783 | | | 58,345 | | | 61,830 | | | 66,395 | |
| Long-term debt to affiliates | | | | | | | 11,987 | | | 4,706 | | | 4,711 | | | 4,716 | | | 4,721 | |
| Financing lease liabilities | | | | | | | 1,276 | | | 1,416 | | | 1,373 | | | 1,444 | | | 1,316 | |
| Less: Cash and cash equivalents | | | | | | | (1,112) | | | (11,076) | | | (6,571) | | | (10,385) | | | (6,677) | |
| | | | | | | | | | | | | | | |
| Net debt (excluding tower obligations) | | | | | | | $ | 26,028 | | | $ | 63,922 | | | $ | 62,621 | | | $ | 63,247 | | | $ | 71,191 | |
| | | | | | | | | | | | | | | |
| | | | | | | | | | | | | | | |
| | | | | | | | | | | | | | | |
| | | | | | | | | | | | | | | |
| Divided by: Last twelve months Pro Forma Adjusted EBITDA | | | | | | | | | $ | 26,250 | | | $ | 26,975 | | | $ | 27,543 | | | $ | 27,797 | |
| Net debt (excluding tower obligations) to LTM Pro Forma Adjusted EBITDA Ratio | | | | | | | | | 2.4 | | | 2.3 | | | 2.3 | | | 2.6 | |
| Divided by: Last twelve months Pro Forma Core Adjusted EBITDA | | | | | | | | | $ | 20,511 | | | $ | 21,357 | | | $ | 22,125 | | | $ | 22,740 | |
| Net debt (excluding tower obligations) LTM Pro Forma Core Adjusted EBITDA Ratio | | | | | | | | | 3.1 | | | 2.9 | | | 2.9 | | | 3.1 | |
| | | | | | | | | | | | | | | |
| | | | | | | | | | | | | | | |
| | | | | | | | | | | | | | | |
| | | | | | | | | | | | | | | |
| | | | | | | | | | | | | | | |
| | | | | | | | | | | | | | | |
| | | | | | | | | | | | | | | |
| | | | | | | | | | | | | | | |
| | | | | | | | | | | | | | | |
| | | | | | | | | | | | | | | |
| | | | | | | | | | | | | | | |
| | | | | | | | | | | | | | | |
| | | | | | | | | | | | | | | |
LTM Adjusted EBITDA and LTM Core Adjusted EBITDA reflect combined company results of New T-Mobile for Q1 2021, Q4 2020, Q3 2020 and Q2 2020 and standalone T-Mobile for prior periods. To illustrate the twelve month results of the combined company as if the Merger had closed on January 1, 2019, we have presented pro forma LTM Adjusted EBITDA and pro forma LTM Core Adjusted EBITDA ratios through December 31, 2020. Pro forma LTM Adjusted EBITDA for the LTM period ended December 31, 2020 is calculated as the sum of Q4 2020, Q3 2020 and Q2 2020 actual Adjusted EBITDA of $6.7 billion, $7.1 billion and $7.0 billion, respectively, plus the pro forma Adjusted EBITDA from Q1 2020 of $6.7 billion. Pro forma LTM Core Adjusted EBITDA for the LTM period ended December 31, 2020 is calculated as the sum of Q4 2020, Q3 2020 and Q2 2020 actual Core Adjusted EBITDA of $5.5 billion, $5.8 billion and $5.6 billion plus the pro forma Core Adjusted EBITDA from Q1 2020 of $5.2 billion. The same method applies to pro forma LTM Adjusted EBITDA and pro forma LTM Core Adjusted EBITDA for the LTM periods ended September 30 and June 30, 2020. These metrics are provided for illustrative purposes only and do not purport to represent what the actual consolidated results would have been had the Merger actually occurred on the date indicated, nor do they purport to project the future consolidated results of operations or consolidated financial condition for any future period or as of any future date. Additional information regarding pro forma adjustments is provided in Pro Forma Income Statement Metrics within this Investor Factbook. LTM Adjusted EBITDA and LTM Core Adjusted EBITDA for Q1 2021 represent the sum of actual Adjusted EBITDA and Core Adjusted EBITDA, respectively, for Q2 2020, Q3 2020, Q4 2020, and Q1 2021 and were not prepared on a pro forma basis.
Free Cash Flow and Free Cash Flow, excluding gross payments for the settlement of interest rate swaps, are calculated as follows:
| | | | | | | | | | | | | | | | | | | | | | | | | | | | | | | | | | | | | | | |
| | | | | | | Quarter | | |
| (in millions) | | | | | | | Q1 2020 | | Q2 2020 | | Q3 2020 | | Q4 2020 | | Q1 2021 | | | | |
| | | | | | | | | | | | | | | | | | | |
| Net cash provided by operating activities | | | | | | | $ | 1,617 | | | $ | 777 | | | $ | 2,772 | | | $ | 3,474 | | | $ | 3,661 | | | | | |
| Cash purchases of property and equipment | | | | | | | (1,753) | | | (2,257) | | | (3,217) | | | (3,807) | | | (3,183) | | | | | |
| Proceeds related to beneficial interests in securitization transactions | | | | | | | 868 | | | 602 | | | 855 | | | 809 | | | 891 | | | | | |
| | | | | | | | | | | | | | | | | | | |
| Cash payments for debt prepayment or debt extinguishment costs | | | | | | | — | | | (24) | | | (58) | | | — | | | (65) | | | | | |
| | | | | | | | | | | | | | | | | | | |
| Free Cash Flow | | | | | | | 732 | | | (902) | | | 352 | | | 476 | | | 1,304 | | | | | |
| Gross cash paid for the settlement of interest rate swaps | | | | | | | — | | | 2,343 | | | — | | | — | | | — | | | | | |
| Free Cash Flow, excluding gross payments for the settlement of interest rate swaps | | | | | | | $ | 732 | | | $ | 1,441 | | | $ | 352 | | | $ | 476 | | | $ | 1,304 | | | | | |
| | | | | | | | | | | | | | | | | | | |
| | | | | | | | | | | | | | | | | | | |
| | | | | | | | | | | | | | | | | | | |
| | | | | | | | | | | | | | | | | | | |
| | | | | | | | | | | | | | | | | | | |
| | | | | | | | | | | | | | | | | | | |
| | | | | | | | | | | | | | | | | | | |
| | | | | | | | | | | | | | | | | | | |
| | | | | | | | | | | | | | | | | | | |
| | | | | | | | | | | | | | | | | | | |
| | | | | | | | | | | | | | | | | | | |
| | | | | | | | | | | | | | | | | | | |
| | | | | | | | | | | | | | | | | | | |
| | | | | | | | | | | | | | | | | | | |
| | | | | | | | | | | | | | | | | | | |
| | | | | | | | | | | | | | | | | | | |
| | | | | | | | | | | | | | | | | | | |
| | | | | | | | | | | | | | | | | | | |
| | | | | | | | | | | | | | | | | | | |
| | | | | | | | | | | | | | | | | | | |
| | | | | | | | | | | | | | | | | | | |
| | | | | | | | | | | | | | | | | | | |
| | | | | | | | | | | | | | | | | | | |
| | | | | | | | | | | | | | | | | | | |
| | | | | | | | | | | | | | | | | | | |
| | | | | | | | | | | | | | | | | | | |
| | | | | | | | | | | | | | | | | | | |
| | | | | | | | | | | | | | | | | | | |
T-Mobile US, Inc.
Reconciliation of Non-GAAP Financial Measures to GAAP Financial Measures (continued)
(Unaudited)
Our current guidance range for Free Cash Flow is calculated as follows:
| | | | | | | | | | | |
| FY 2021 |
| (in millions) | Current Guidance Range |
| | | |
| Net cash provided by operating activities | $ | 13,200 | | | $ | 13,600 | |
| | | |
| Cash purchases of property and equipment | (11,700) | | | (12,000) | |
Proceeds related to beneficial interests in securitization transactions (1) | 3,700 | | | 3,900 | |
| Cash payments for debt prepayment or debt extinguishment costs | (100) | | | — | |
| | | |
| Free Cash Flow | $ | 5,100 | | | $ | 5,500 | |
| | | |
| | | |
| | | |
| | | |
| | | |
| | | |
(1)Free Cash Flow guidance does not assume any material net cash inflows from securitization in 2021.
Our previous guidance range for Free Cash Flow is calculated as follows:
| | | | | | | | | | | |
| FY 2021 |
| (in millions) | Previous Guidance Range |
| | | |
| Net cash provided by operating activities | $ | 13,000 | | | $ | 13,500 | |
| | | |
| Cash purchases of property and equipment | (11,700) | | | (12,000) | |
Proceeds related to beneficial interests in securitization transactions (1) | 3,700 | | | 3,900 | |
| Cash payments for debt prepayment or debt extinguishment costs | (100) | | | — | |
| | | |
| Free Cash Flow | $ | 4,900 | | | $ | 5,400 | |
| | | |
| | | |
| | | |
| | | |
| | | |
| | | |
(1)Free Cash Flow guidance does not assume any material net cash inflows from securitization in 2021.
T-Mobile US, Inc.
Reconciliations to Beginning Customers and Accounts
(Unaudited)
| | | | | | | | | | | | | | | | | | | | | | | | | | | | | |
| (in thousands) | Postpaid phone customers | | Postpaid other customers | | Total postpaid customers | | Prepaid customers | | Total customers |
| Reconciliation to beginning customers | | | | | | | | | |
| T-Mobile customers as reported, end of period March 31, 2020 | 40,797 | | | 7,014 | | | 47,811 | | | 20,732 | | | 68,543 | |
| Sprint customers as reported, end of period March 31, 2020 | 25,916 | | | 8,428 | | | 34,344 | | | 8,256 | | | 42,600 | |
| Total combined customers, end of period March 31, 2020 | 66,713 | | | 15,442 | | | 82,155 | | | 28,988 | | | 111,143 | |
| Adjustments | | | | | | | | | |
Reseller reclassification to wholesale customers (1) | (199) | | | (2,872) | | | (3,071) | | | — | | | (3,071) | |
EIP reclassification from postpaid to prepaid (2) | (963) | | | — | | | (963) | | | 963 | | | — | |
Divested prepaid customers (3) | — | | | — | | | — | | | (9,207) | | | (9,207) | |
Rate plan threshold (4) | (182) | | | (918) | | | (1,100) | | | — | | | (1,100) | |
Customers with non-phone devices (5) | (226) | | | 226 | | | — | | | — | | | — | |
Collection policy alignment (6) | (150) | | | (46) | | | (196) | | | — | | | (196) | |
Miscellaneous adjustments (7) | (141) | | | (43) | | | (184) | | | (302) | | | (486) | |
| Total Adjustments | (1,861) | | | (3,653) | | | (5,514) | | | (8,546) | | | (14,060) | |
| Adjusted beginning customers as of April 1, 2020 | 64,852 | | | 11,789 | | | 76,641 | | | 20,442 | | | 97,083 | |
| | | | | | | | | |
(1)In connection with the closing of the Merger, we refined our definition of wholesale customers resulting in the reclassification of certain postpaid and prepaid reseller customers to wholesale customers. Starting with the three months ended March 31, 2020, we discontinued reporting wholesale customers to focus on postpaid and prepaid customers and wholesale revenues, which we consider more relevant than the number of wholesale customers given the expansion of M2M and IoT products.
(2)Prepaid customers with a device installment billing plan historically included as Sprint postpaid customers have been reclassified to prepaid customers to align with New T-Mobile policy.
(3)Customers associated with the Sprint wireless prepaid and Boost brands that were divested on July 1, 2020, have been excluded from our reported customers.
(4)Customers who have rate plans with monthly recurring charges which are considered insignificant have been excluded from our reported customers.
(5)Customers with postpaid phone rate plans without a phone (e.g., non-phone device) have been reclassified from postpaid phone to postpaid other customers to align with New T-Mobile policy.
(6)Certain Sprint customers subjected to collection activity for an extended period of time have been excluded from our reported customers to align with New T-Mobile policy.
(7)Miscellaneous insignificant adjustments to align with New T-Mobile policy.
| | | | | | | | |
| (in thousands) | | Postpaid Accounts |
| Reconciliation to beginning accounts | | |
| T-Mobile accounts as reported, end of period March 31, 2020 | | 15,244 | |
| Sprint accounts, end of period March 31, 2020 | | 11,246 | |
| Total combined accounts, end of period March 31, 2020 | | 26,490 | |
| Adjustments | | |
Reseller reclassification to wholesale accounts (1) | | (1) | |
EIP reclassification from postpaid to prepaid (2) | | (963) | |
Rate plan threshold (3) | | (18) | |
Collection policy alignment (4) | | (76) | |
Miscellaneous adjustments (5) | | (47) | |
| Total Adjustments | | (1,105) | |
| Adjusted beginning accounts as of April 1, 2020 | | 25,385 | |
(1)In connection with the closing of the Merger, we refined our definition of wholesale accounts resulting in the reclassification of certain postpaid and prepaid reseller accounts to wholesale accounts.
(2)Prepaid accounts with a customer with a device installment billing plan historically included as Sprint postpaid accounts have been reclassified to prepaid accounts to align with T-Mobile policy.
(3)Accounts with customers who have rate plans with monthly recurring charges which are considered insignificant have been excluded from our reported accounts.
(4)Certain Sprint accounts subjected to collection activity for an extended period of time have been excluded from our reported accounts to align with T-Mobile policy.
(5)Miscellaneous insignificant adjustments to align with T-Mobile policy.
T-Mobile US, Inc.
Pro Forma Income Statement Metrics
(Unaudited)
The following tables present certain income statement metrics on a pro forma basis as though the Merger had been completed on January 1, 2019. The unaudited pro forma income statement metrics have been prepared in accordance with Article 11 of Regulation S-X (“Article 11”) which is a different basis than the unaudited pro forma financial information included in Note 2 - Business Combinations in our Annual Report on Form 10-K for the year ended December 31, 2020. The primary difference between the Article 11 pro forma financial information and the ASC 805 pro forma financial information prepared by us is the treatment of certain one-time transaction costs, which are removed from all periods under Article 11 but are recognized as if they had been incurred in their entirety during Q1 2019 under ASC 805. The unaudited pro forma income statement metrics are provided for illustrative purposes only and do not purport to represent what the actual consolidated results of operations or consolidated financial condition would have been had the Merger actually occurred on the date indicated, nor do they purport to project the future consolidated results of operations or consolidated financial condition for any future period or as of any future date. For the purposes of this section, “Combined” means the summation of historically reported standalone GAAP amounts of T-Mobile and Sprint. “Pro forma adjustments” means adjustments to combined metrics to give effect to matters that are directly attributable to the Merger, factually supportable, and expected to have a continuing impact on the results of the combined company. “Pro forma” metrics are those that have been adjusted as required for the presentation of Article 11 pro forma information.
We are presenting the pro forma metrics for the three months ended September 30, 2019, December 31, 2019 and March 31, 2020 to support the reconciliation of our LTM pro forma Adjusted EBITDA and pro forma Core Adjusted EBITDA calculations included in the Reconciliation of Non-GAAP Financial Measures to GAAP Financial Measures of this presentation.
| | | | | | | | | | | | | | | | | |
| Three Months Ended |
| (in millions) | September 30, 2019 | | December 31, 2019 | |
March 31, 2020 |
| Service revenues | | | | | |
Combined service revenues (1) | $ | 13,856 | | | $ | 14,124 | | | $ | 14,065 | |
| | | | | |
Pro forma adjustments (2) | (946) | | | (916) | | | (868) | |
| Pro forma service revenues | $ | 12,910 | | | $ | 13,208 | | | $ | 13,197 | |
| Equipment revenues (including equipment rentals) | | | | | |
Combined equipment revenues (including equipment rentals) (1) | $ | 4,708 | | | $ | 5,539 | | | $ | 4,569 | |
| | | | | |
Pro forma adjustments (2)(3) | (734) | | | (835) | | | (693) | |
| Pro forma equipment revenues (including equipment rentals) | $ | 3,974 | | | $ | 4,704 | | | $ | 3,876 | |
| Other revenues | | | | | |
Combined other revenues (1) | $ | 292 | | | $ | 295 | | | $ | 283 | |
Pro forma adjustments (4) | 67 | | | 78 | | | 52 | |
| Pro forma other revenues | $ | 359 | | | $ | 373 | | | $ | 335 | |
| Total Revenues | | | | | |
Combined total revenues (1) | $ | 18,856 | | | $ | 19,958 | | | $ | 18,917 | |
| | | | | |
| Pro forma adjustments | (1,613) | | | (1,673) | | | (1,509) | |
| Pro forma total revenues | $ | 17,243 | | | $ | 18,285 | | | $ | 17,408 | |
| Cost of services, exclusive of depreciation and amortization | | | | | |
Combined cost of services, exclusive of depreciation and amortization (1) | $ | 3,508 | | | $ | 3,412 | | | $ | 3,288 | |
| | | | | |
Pro forma adjustments (5) | (142) | | | (115) | | | (88) | |
| Pro forma cost of services, exclusive of depreciation and amortization | $ | 3,366 | | | $ | 3,297 | | | $ | 3,200 | |
| Cost of equipment sales, exclusive of depreciation and amortization | | | | | |
Combined cost of equipment sales, exclusive of depreciation and amortization (1) | $ | 4,063 | | | $ | 5,164 | | | $ | 3,947 | |
Pro forma adjustments (2)(3) | (733) | | | (823) | | | (679) | |
| Pro forma cost of equipment sales, exclusive of depreciation and amortization | $ | 3,330 | | | $ | 4,341 | | | $ | 3,268 | |
| Selling, general and administrative | | | | | |
Combined selling, general and administrative (1) | $ | 5,434 | | | $ | 5,701 | | | $ | 5,709 | |
| | | | | |
Pro forma adjustments (2)(3)(4) | (455) | | | (673) | | | (429) | |
| Pro forma selling, general and administrative | $ | 4,979 | | | $ | 5,028 | | | $ | 5,280 | |
| | | | | |
| | | | | |
T-Mobile US, Inc.
Pro Forma Income Statement Metrics (Continued)
(Unaudited)
| | | | | | | | | | | | | | | | | |
| Three Months Ended |
| (in millions) | September 30, 2019 | | December 31, 2019 | |
March 31, 2020 |
| Depreciation and amortization | | | | | |
Combined depreciation and amortization (1) | $ | 3,882 | | | $ | 4,332 | | | $ | 4,061 | |
Pro forma adjustments (5) | 202 | | | (210) | | | (47) | |
| Pro forma depreciation and amortization | $ | 4,084 | | | $ | 4,122 | | | $ | 4,014 | |
| Operating Expenses | | | | | |
Combined operating expenses (1) | $ | 17,148 | | | $ | 18,658 | | | $ | 17,205 | |
| | | | | |
| Pro forma adjustments | (1,389) | | | (1,870) | | | (1,443) | |
| Pro forma operating expenses | $ | 15,759 | | | $ | 16,788 | | | $ | 15,762 | |
| Operating Income | | | | | |
Combined operating income (1) | $ | 1,708 | | | $ | 1,300 | | | $ | 1,712 | |
| | | | | |
| Pro forma adjustments | (224) | | | 197 | | | (66) | |
| Pro forma operating income | $ | 1,484 | | | $ | 1,497 | | | $ | 1,646 | |
| Interest expense | | | | | |
Combined interest expense (1) | $ | (778) | | | $ | (771) | | | $ | (775) | |
Pro forma adjustments (6) | (64) | | | (69) | | | (60) | |
| Pro forma interest expense | $ | (842) | | | $ | (840) | | | $ | (835) | |
| Interest expense to affiliates | | | | | |
Combined interest expense to affiliates (1) | $ | (100) | | | $ | (98) | | | $ | (99) | |
Pro forma adjustments (6) | 91 | | | 86 | | | 104 | |
| Pro forma interest expense to affiliates | $ | (9) | | | $ | (12) | | | $ | 5 | |
| Interest income | | | | | |
Combined interest income (1) | $ | 5 | | | $ | 7 | | | $ | 12 | |
Pro forma adjustments (4) | 16 | | | 18 | | | 14 | |
| Pro forma interest income | $ | 21 | | | $ | 25 | | | $ | 26 | |
| Other income (expense), net | | | | | |
Combined other income (expense), net (1) | $ | 17 | | | $ | (2) | | | $ | (5) | |
Pro forma adjustments (4) | (16) | | | (18) | | | (14) | |
| Pro forma other income (expense), net | $ | 1 | | | $ | (20) | | | $ | (19) | |
| | | | | |
| Pro forma income from continuing operations before tax | $ | 655 | | | $ | 650 | | | $ | 823 | |
| | | | | |
| Income tax (expense) benefit | | | | | |
Combined income tax (expense) benefit (1) | $ | (261) | | | $ | 194 | | | $ | 273 | |
| | | | | |
Pro forma adjustments (7) | 57 | | | (51) | | | 9 | |
| Pro forma income tax (expense) benefit | $ | (204) | | | $ | 143 | | | $ | 282 | |
| Income from continuing operations, net of tax | | | | | |
Combined income from continuing operations, net of tax (1) | $ | 591 | | | $ | 630 | | | $ | 1,118 | |
| | | | | |
| Pro forma adjustments | (140) | | | 163 | | | (13) | |
| Pro forma income from continuing operations, net of tax | $ | 451 | | | $ | 793 | | | $ | 1,105 | |
| Income from discontinued operations, net of tax | | | | | |
Combined income from discontinued operations, net of tax (1) | $ | — | | | $ | — | | | $ | — | |
Pro forma adjustments (2) | 393 | | | 355 | | | 357 | |
| Pro forma income from discontinued operations, net of tax | $ | 393 | | | $ | 355 | | | $ | 357 | |
| Net income | | | | | |
Combined net income (1) | $ | 591 | | | $ | 630 | | | $ | 1,118 | |
| Pro forma adjustments | 253 | | | 518 | | | 344 | |
| Pro forma net income | $ | 844 | | | $ | 1,148 | | | $ | 1,462 | |
| | | | | |
| | | | | |
| | | | | |
| | | | | |
| | | | | |
| | | | | |
| | | | | |
T-Mobile US, Inc.
Pro Forma Income Statement Metrics (Continued)
(Unaudited)
(1) Represents the sum of historically filed T-Mobile and Sprint standalone GAAP reported amounts. Please reference the T-Mobile Quarterly Reports on Form 10-Q for the quarterly period ended March 31, 2020 and the Current Report on Form 8-K containing Sprint financial results for the year ended March 31, 2020, filed on May 18, 2020.
(2) Significant pro forma adjustments include the removal of the activity of the Prepaid Business which is assumed to have been reclassified to discontinued operations as of January 1, 2019.
(3) Significant pro forma adjustments include adjustments to the timing and recognition of certain revenues and costs to align the historical revenue recognition policies of Sprint with the revenue recognition policies of T-Mobile.
(4) Significant pro forma adjustments include the reclassification among line items of historical Sprint activity to align with T-Mobile’s financial statement presentation.
(5) Significant pro forma adjustments include changes to depreciation and amortization from revalued and newly recognized property, equipment, and intangibles in purchase price accounting.
(6) Significant pro forma adjustments include changes to interest expense resulting from new debt issuances and modifications, as well as additional amortization expense associated with the revaluation of debt in purchase price accounting.
(7) Represents the pro forma tax impact of pro forma adjustments, which have been tax-effected at a blended rate of 26%.
Pro forma Net income is reconciled to Pro forma Adjusted EBITDA and Pro forma Core Adjusted EBITDA as follows:
| | | | | | | | | | | | | | | | | |
| Three Months Ended |
| (in millions) | September 30, 2019 | | December 31, 2019 | |
March 31, 2020 |
| Pro forma net income | $ | 844 | | | $ | 1,148 | | | $ | 1,462 | |
| Adjustments: | | | | | |
| Pro forma income from discontinued operations, net of tax | (393) | | | (355) | | | (357) | |
| Pro forma income from continuing operations, net of tax | 451 | | | 793 | | | 1,105 | |
| Pro forma income tax expense (benefit) | 204 | | | (143) | | | (282) | |
| Pro forma other (income) expense, net | (1) | | | 20 | | | 19 | |
| Pro forma interest income | (21) | | | (25) | | | (26) | |
| Pro forma interest expense to affiliates | 9 | | | 12 | | | (5) | |
| Pro forma interest expense | 842 | | | 840 | | | 835 | |
| Pro forma operating income | 1,484 | | | 1,497 | | | 1,646 | |
| Pro forma depreciation and amortization | 4,084 | | | 4,122 | | | 4,014 | |
Pro forma operating income from discontinued operations (1) | 531 | | | 480 | | | 482 | |
Stock-based compensation, as adjusted (2) | 117 | | | 119 | | | 124 | |
Merger-related costs, as adjusted (3) | 165 | | | 117 | | | 136 | |
COVID-19-related costs (4) | — | | | — | | | 174 | |
Other, net (5) | 24 | | | (157) | | | 75 | |
| Pro forma Adjusted EBITDA | 6,405 | | | 6,178 | | | 6,651 | |
Less: Pro forma Lease Revenues (6) | 1,472 | | | 1,445 | | | 1,402 | |
| Pro forma Core Adjusted EBITDA | $ | 4,933 | | | $ | 4,733 | | | $ | 5,249 | |
(1) Following the Prepaid Transaction, starting on July 1, 2020, we provide MVNO services to customers of the divested brands. We have included the operating income from discontinued operations in our determination of Adjusted EBITDA to reflect EBITDA contributions of the Prepaid Business that were replaced by the MVNO Agreement beginning on July 1, 2020, in order to enable management, analysts and investors to better assess the ongoing operating performance and trends.
(2) Represents the sum of historically filed T-Mobile and Sprint standalone GAAP reported amounts, adjusted for the fair value of certain Sprint share-based compensation and the acceleration of certain executive compensation related to the Merger.
(3) Represents remaining Merger-related costs other than one-time transaction costs directly attributable to the Merger, which have been adjusted out of the pro forma calculations.
(4) Represents the sum of historically filed T-Mobile and Sprint standalone GAAP reported amounts.
(5) Other, net contains the sum of historical T-Mobile adjustments to EBITDA as well as historical Sprint adjustments that are not otherwise included as a named reconciling item.
(6) Represents the sum of historically filed T-Mobile lease revenues and Sprint equipment rentals.
Definitions of Terms
Operating and financial measures are utilized by T-Mobile’s management to evaluate its operating performance and, in certain cases, its ability to meet liquidity requirements. Although companies in the wireless industry may not define measures in precisely the same way, T-Mobile believes the measures facilitate key operating performance comparisons with other companies in the wireless industry to provide management, investors and analysts with useful information to assess and evaluate past performance and assist in forecasting future performance.
1.Customer - SIM number with a unique T-Mobile mobile identifier which is associated with an account that generates revenue. Customers generally are qualified either for postpaid service, where they generally pay after incurring service, or prepaid service, where they generally pay in advance.
2.Churn - The number of customers whose service was disconnected as a percentage of the average number of customers during the specified period further divided by the number of months in the period. The number of customers whose service was disconnected is presented net of customers that subsequently have their service restored within a certain period of time.
3.Customers per account - The number of postpaid customers as of the end of the period divided by the number of postpaid accounts as of the end of the period. An account may include postpaid phone, mobile broadband, and DIGITS customers.
4.Average Revenue Per Account (ARPA) - Average monthly postpaid service revenue earned per account. Postpaid service revenues for the specified period divided by the average number of postpaid accounts during the period, further divided by the number of months in the period.
Average Revenue Per User (ARPU) - Average monthly service revenue earned from customers. Service revenues for the specified period divided by the average number of customers during the period, further divided by the number of months in the period.
Postpaid phone ARPU excludes postpaid other customers and related revenues.
Service revenues - Postpaid, including handset insurance, prepaid, wholesale, and roaming and other service revenues.
5.Cost of services - Costs directly attributable to providing wireless service through the operation of T-Mobile’s network, including direct switch and cell site costs, such as rent, network access and transport costs, utilities, maintenance, associated labor costs, long distance costs, regulatory program costs, roaming fees paid to other carriers and data content costs.
Cost of equipment sales - Costs of devices and accessories sold to customers and dealers, device costs to fulfill insurance and warranty claims, write-downs of inventory related to shrinkage and obsolescence, and shipping and handling costs.
Selling, general and administrative expenses - Costs not directly attributable to providing wireless service for the operation of sales, customer care and corporate activities. These include all commissions paid to dealers and retail employees for activations and upgrades, labor and facilities costs associated with retail sales force and administrative space, marketing and promotional costs, customer support and billing, bad debt expense and administrative support activities.
6.Net income margin - Net income margin % calculated as net income divided by service revenues.
7.Adjusted EBITDA and Core Adjusted EBITDA - Adjusted EBITDA represents earnings before Interest expense, net of Interest income, Income tax expense, Depreciation and amortization expense, Stock-based compensation and certain expenses not reflective of T-Mobile’s ongoing operating performance, such as Merger-related costs, COVID-19-related costs and Impairment expense. Core Adjusted EBITDA represents Adjusted EBITDA less lease revenues. Core Adjusted EBITDA and Adjusted EBITDA are non-GAAP financial measures utilized by T-Mobile’s management to monitor the financial performance of our operations. T-Mobile uses Core Adjusted EBITDA and Adjusted EBITDA as benchmarks to evaluate T-Mobile’s operating performance in comparison to its competitors. T-Mobile also uses Adjusted EBITDA internally as a measure to evaluate and compensate its personnel and management for their performance. Management believes analysts and investors use Core Adjusted EBITDA and Adjusted EBITDA as supplemental measures to evaluate overall operating performance and facilitate comparisons with other wireless communications companies because they are indicative of T-Mobile’s ongoing operating performance and trends by excluding the impact of Interest expense from financing, non-cash depreciation and amortization from capital investments, stock-based compensation, Merger-related costs including network decommissioning costs, incremental costs directly attributable to COVID-19 and impairment expense, as they are not indicative of T-Mobile’s ongoing operating performance, as well as certain other nonrecurring income and expenses. Management believes analysts and investors use Core Adjusted EBITDA because it normalizes for the transition in the company’s device financing strategy, by excluding the impact of lease revenues from Adjusted EBITDA, to align with the related depreciation expense on leased devices, which is excluded from the definition of Adjusted EBITDA. Core Adjusted EBITDA and Adjusted EBITDA have limitations as analytical tools and should not be considered in isolation or as a substitute for income from operations, Net income or any other measure of financial performance reported in accordance with U.S. Generally Accepted Accounting Principles (“GAAP”).
8.Adjusted EBITDA Margin and Core Adjusted EBITDA Margin - Adjusted EBITDA margin % calculated as Adjusted EBITDA divided by service revenues. Core Adjusted EBITDA margin % calculated as Core Adjusted EBITDA divided by service revenues.
9.Free Cash Flow - Net cash provided by operating activities less cash purchases of property and equipment, including proceeds from sales of tower sites and proceeds related to beneficial interests in securitization transactions and less cash payments for debt prepayment or debt extinguishment costs. Free Cash Flow is utilized by T-Mobile’s management, investors, and analysts to evaluate cash available to pay debt and provide further investment in the business. The reconciliation of Free Cash Flow to net cash provided by operating activities is detailed in the Reconciliation of Non-GAAP Financial Measures to GAAP Financial Measures schedule.
10.Net debt - Short-term debt, short-term debt to affiliates, long-term debt, and long-term debt (excluding tower obligations) to affiliates, short-term financing lease liabilities and financing lease liabilities, less cash and cash equivalents.
Cautionary Statement Regarding Forward-Looking Statements
This communication includes forward-looking statements within the meaning of the Private Securities Litigation Reform Act of 1995. All statements other than statements of historical fact, including information concerning T-Mobile US, Inc.’s future results of operations, are forward-looking statements. These forward-looking statements are generally identified by the words “anticipate,” “believe,” “estimate,” “expect,” “intend,” “may,” “could” or similar expressions. Forward-looking statements are based on current expectations and assumptions, which are subject to risks and uncertainties and may cause actual results to differ materially from the forward-looking statements. Important factors that could affect future results and cause those results to differ materially from those expressed in the forward-looking statements include, among others, the following: natural disasters, public health crises, including the COVID-19 pandemic (the “Pandemic”), terrorist attacks or similar incidents; adverse economic, political or market conditions in the U.S. and international markets, including those caused by the Pandemic; competition, industry consolidation and changes in the market condition for wireless services; data loss or other security breaches; the scarcity and cost of additional wireless spectrum, and regulations relating to spectrum use; our inability to retain or motivate key personnel, hire qualified personnel or maintain our corporate culture; our inability to take advantage of technological developments on a timely basis; system failures and business disruptions, allowing for unauthorized use of or interference with our network and other systems; the impacts of the actions we have taken and conditions we have agreed to in connection with the regulatory proceedings and approvals of the Transactions (as defined below), including the acquisition by DISH Network Corporation (“DISH”) of the prepaid wireless business operated under the Boost Mobile and Sprint prepaid brands (excluding the Assurance brand Lifeline customers and the prepaid wireless customers of Shenandoah Personal Communications Company LLC (“Shentel”) and Swiftel Communications, Inc.), including customer accounts, inventory, contracts, intellectual property and certain other specified assets (the “Prepaid Business”), and the assumption of certain related liabilities (the “Prepaid Transaction”), the complaint and proposed final judgment (the “Consent Decree”) agreed to by us, Deutsche Telekom AG (“DT”), Sprint Corporation (“Sprint”), SoftBank Group Corp. (“SoftBank”) and DISH with the U.S. District Court for the District of Columbia, which was approved by the Court on April 1, 2020, the proposed commitments filed with the Secretary of the Federal Communications Commission (“FCC”), which we announced on May 20, 2019, certain national security commitments and undertakings, and any other commitments or undertakings entered into including but not limited to those we have made to certain states and nongovernmental organizations (collectively, the “Government Commitments”), and the challenges in satisfying the Government Commitments in the required time frames and the significant cumulative cost incurred in tracking, monitoring and complying with them; our inability to manage the ongoing commercial and transition services arrangements that we entered into with DISH in connection with the Prepaid Transaction, which we completed on July 1, 2020 (collectively, the “Divestiture Transaction”), and known or unknown liabilities arising in connection therewith; the effects of any future acquisition, investment, or merger involving us; any disruption or failure of our third parties (including key suppliers) to provide products or services for the operation of our business; the occurrence of high fraud rates or volumes related to device financing, customer payment cards, third-party dealers, employees, subscriptions, identities or account takeover fraud; our substantial level of indebtedness and our inability to service our debt obligations in accordance with their terms or to comply with the restrictive covenants contained therein; adverse changes in the ratings of our debt securities or adverse conditions in the credit markets; the risk of future material weaknesses we may identify while we work to integrate and align policies, principles and practices of the two companies following the Merger (as defined below), or any other failure by us to maintain effective internal controls, and the resulting significant costs and reputational damage; any changes in regulations or in the regulatory framework under which we operate; laws and regulations relating to the handling of privacy and data protection; unfavorable outcomes of existing or future legal proceedings; our offering of regulated financial services products and exposure to a wide variety of state and federal regulations; new or amended tax laws or regulations or administrative interpretations and judicial decisions affecting the scope or application of tax laws or regulations; the possibility that we may be unable to renew our spectrum leases on attractive terms or the possible revocation of our existing licenses in the event that we violate applicable laws; interests of our significant stockholders that may differ from the interests of other stockholders; future sales of our common stock by DT and SoftBank and our inability to attract additional equity financing outside the United States due to foreign ownership limitations by the FCC; the volatility of our stock price and our lack of plan to pay cash dividends in the foreseeable future; failure to realize the expected benefits and synergies of the merger (the “Merger”) with Sprint, pursuant to the Business Combination Agreement with Sprint and the other parties named therein (as amended, the “Business Combination Agreement”) and the other transactions contemplated by the Business Combination Agreement (collectively, the “Transactions”) in the expected timeframes or in the amounts anticipated; any delay and costs of, or difficulties in, integrating our business and Sprint’s business and operations, and unexpected additional operating costs, customer loss and business disruption, including maintaining relationships with employees, customers, suppliers or vendors; unanticipated difficulties, disruption, or significant delays in our long-term strategy to migrate Sprint’s legacy customers onto T-Mobile’s existing billing platforms; and changes to existing or the issuance of new accounting standards by the Financial Accounting Standards Board or other regulatory agencies. Given these risks and uncertainties, readers are cautioned not to place undue reliance on such forward-looking statements. We undertake no obligation to revise or publicly release the results of any revision to these forward-looking statements, except as required by law.
About T-Mobile US, Inc.
T-Mobile US, Inc. (NASDAQ: TMUS) is America’s supercharged Un-carrier, delivering an advanced 4G LTE and transformative nationwide 5G network that will offer reliable connectivity for all. T-Mobile’s customers benefit from its unmatched combination of value and quality, unwavering obsession with offering them the best possible service experience and undisputable drive for disruption that creates competition and innovation in wireless and beyond. Based in Bellevue, Wash., T-Mobile provides services through its subsidiaries and operates its flagship brands, T-Mobile and Metro by T-Mobile. For more information please visit: http://www.t-mobile.com.