EXHIBIT 99.2
| | | | | | | | |
| | Highlights |
| | Customer Metrics |
| | Financial Metrics |
| | Capital Structure |
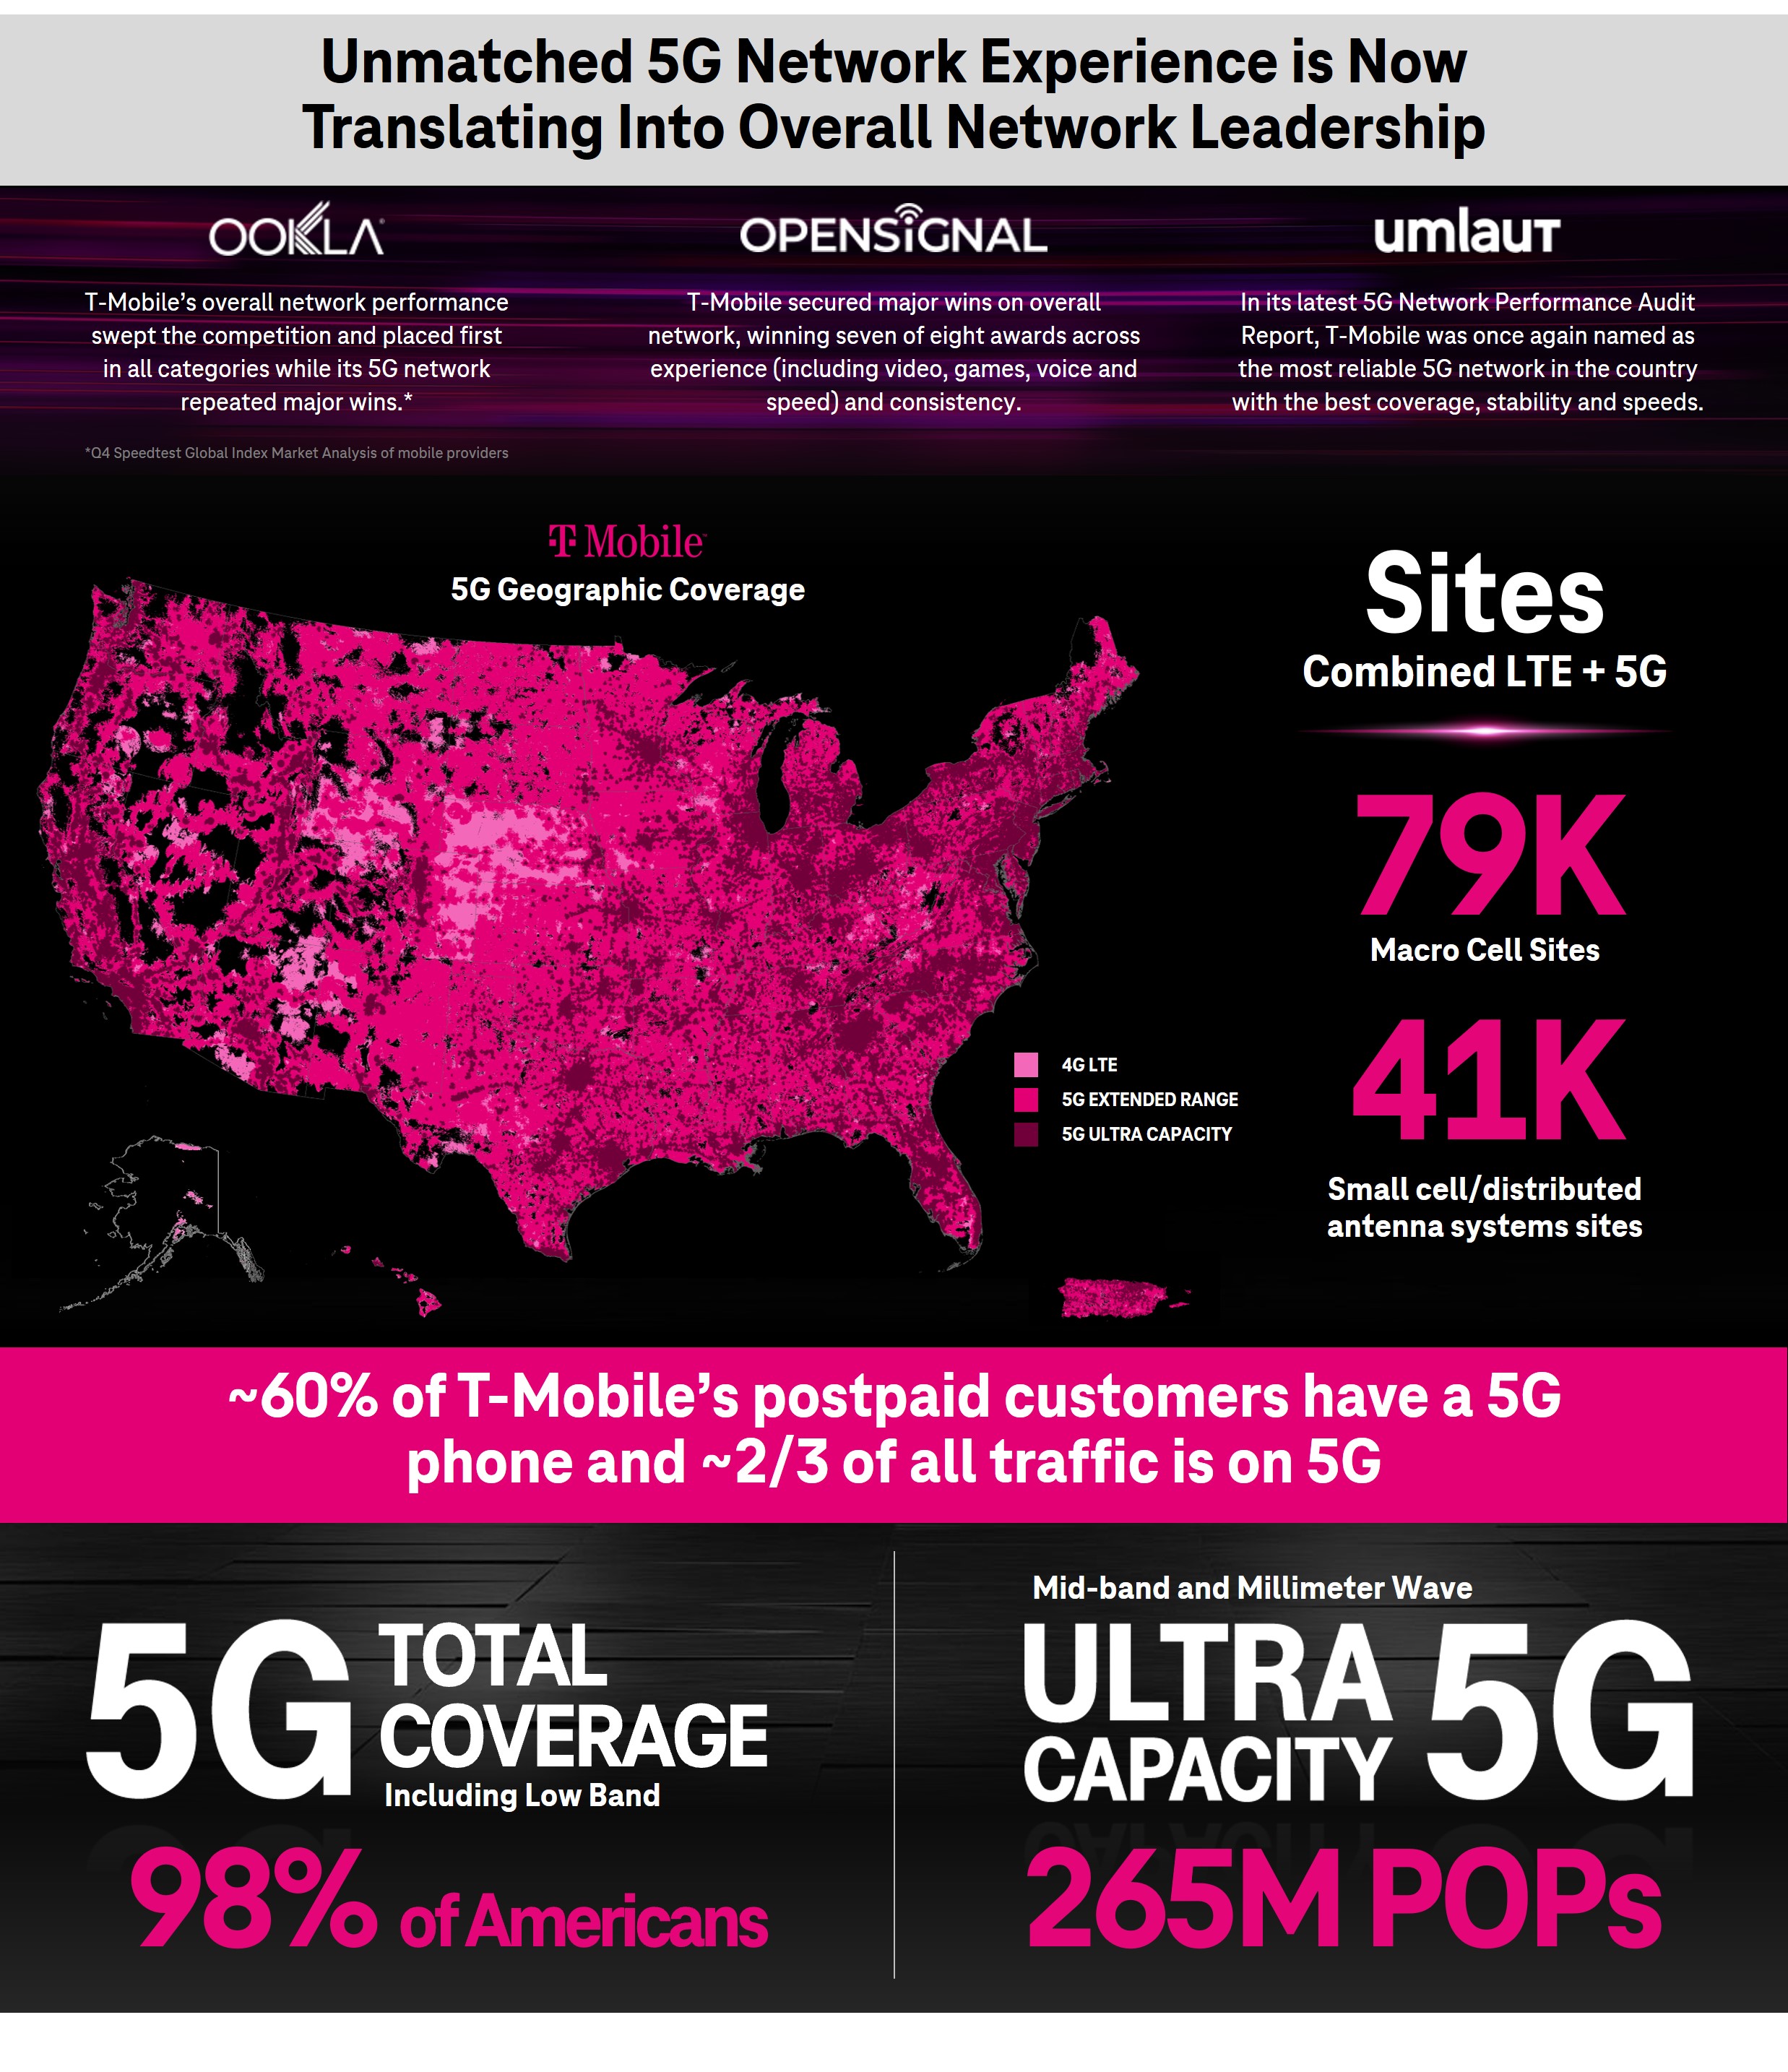
| | Network Leadership |
| | Merger & Integration |
| | Guidance |
| | Contacts |
| | Financial and Operational Tables |
| | | | | | | | | | | | | | | | | | | | |
| | | | | | |
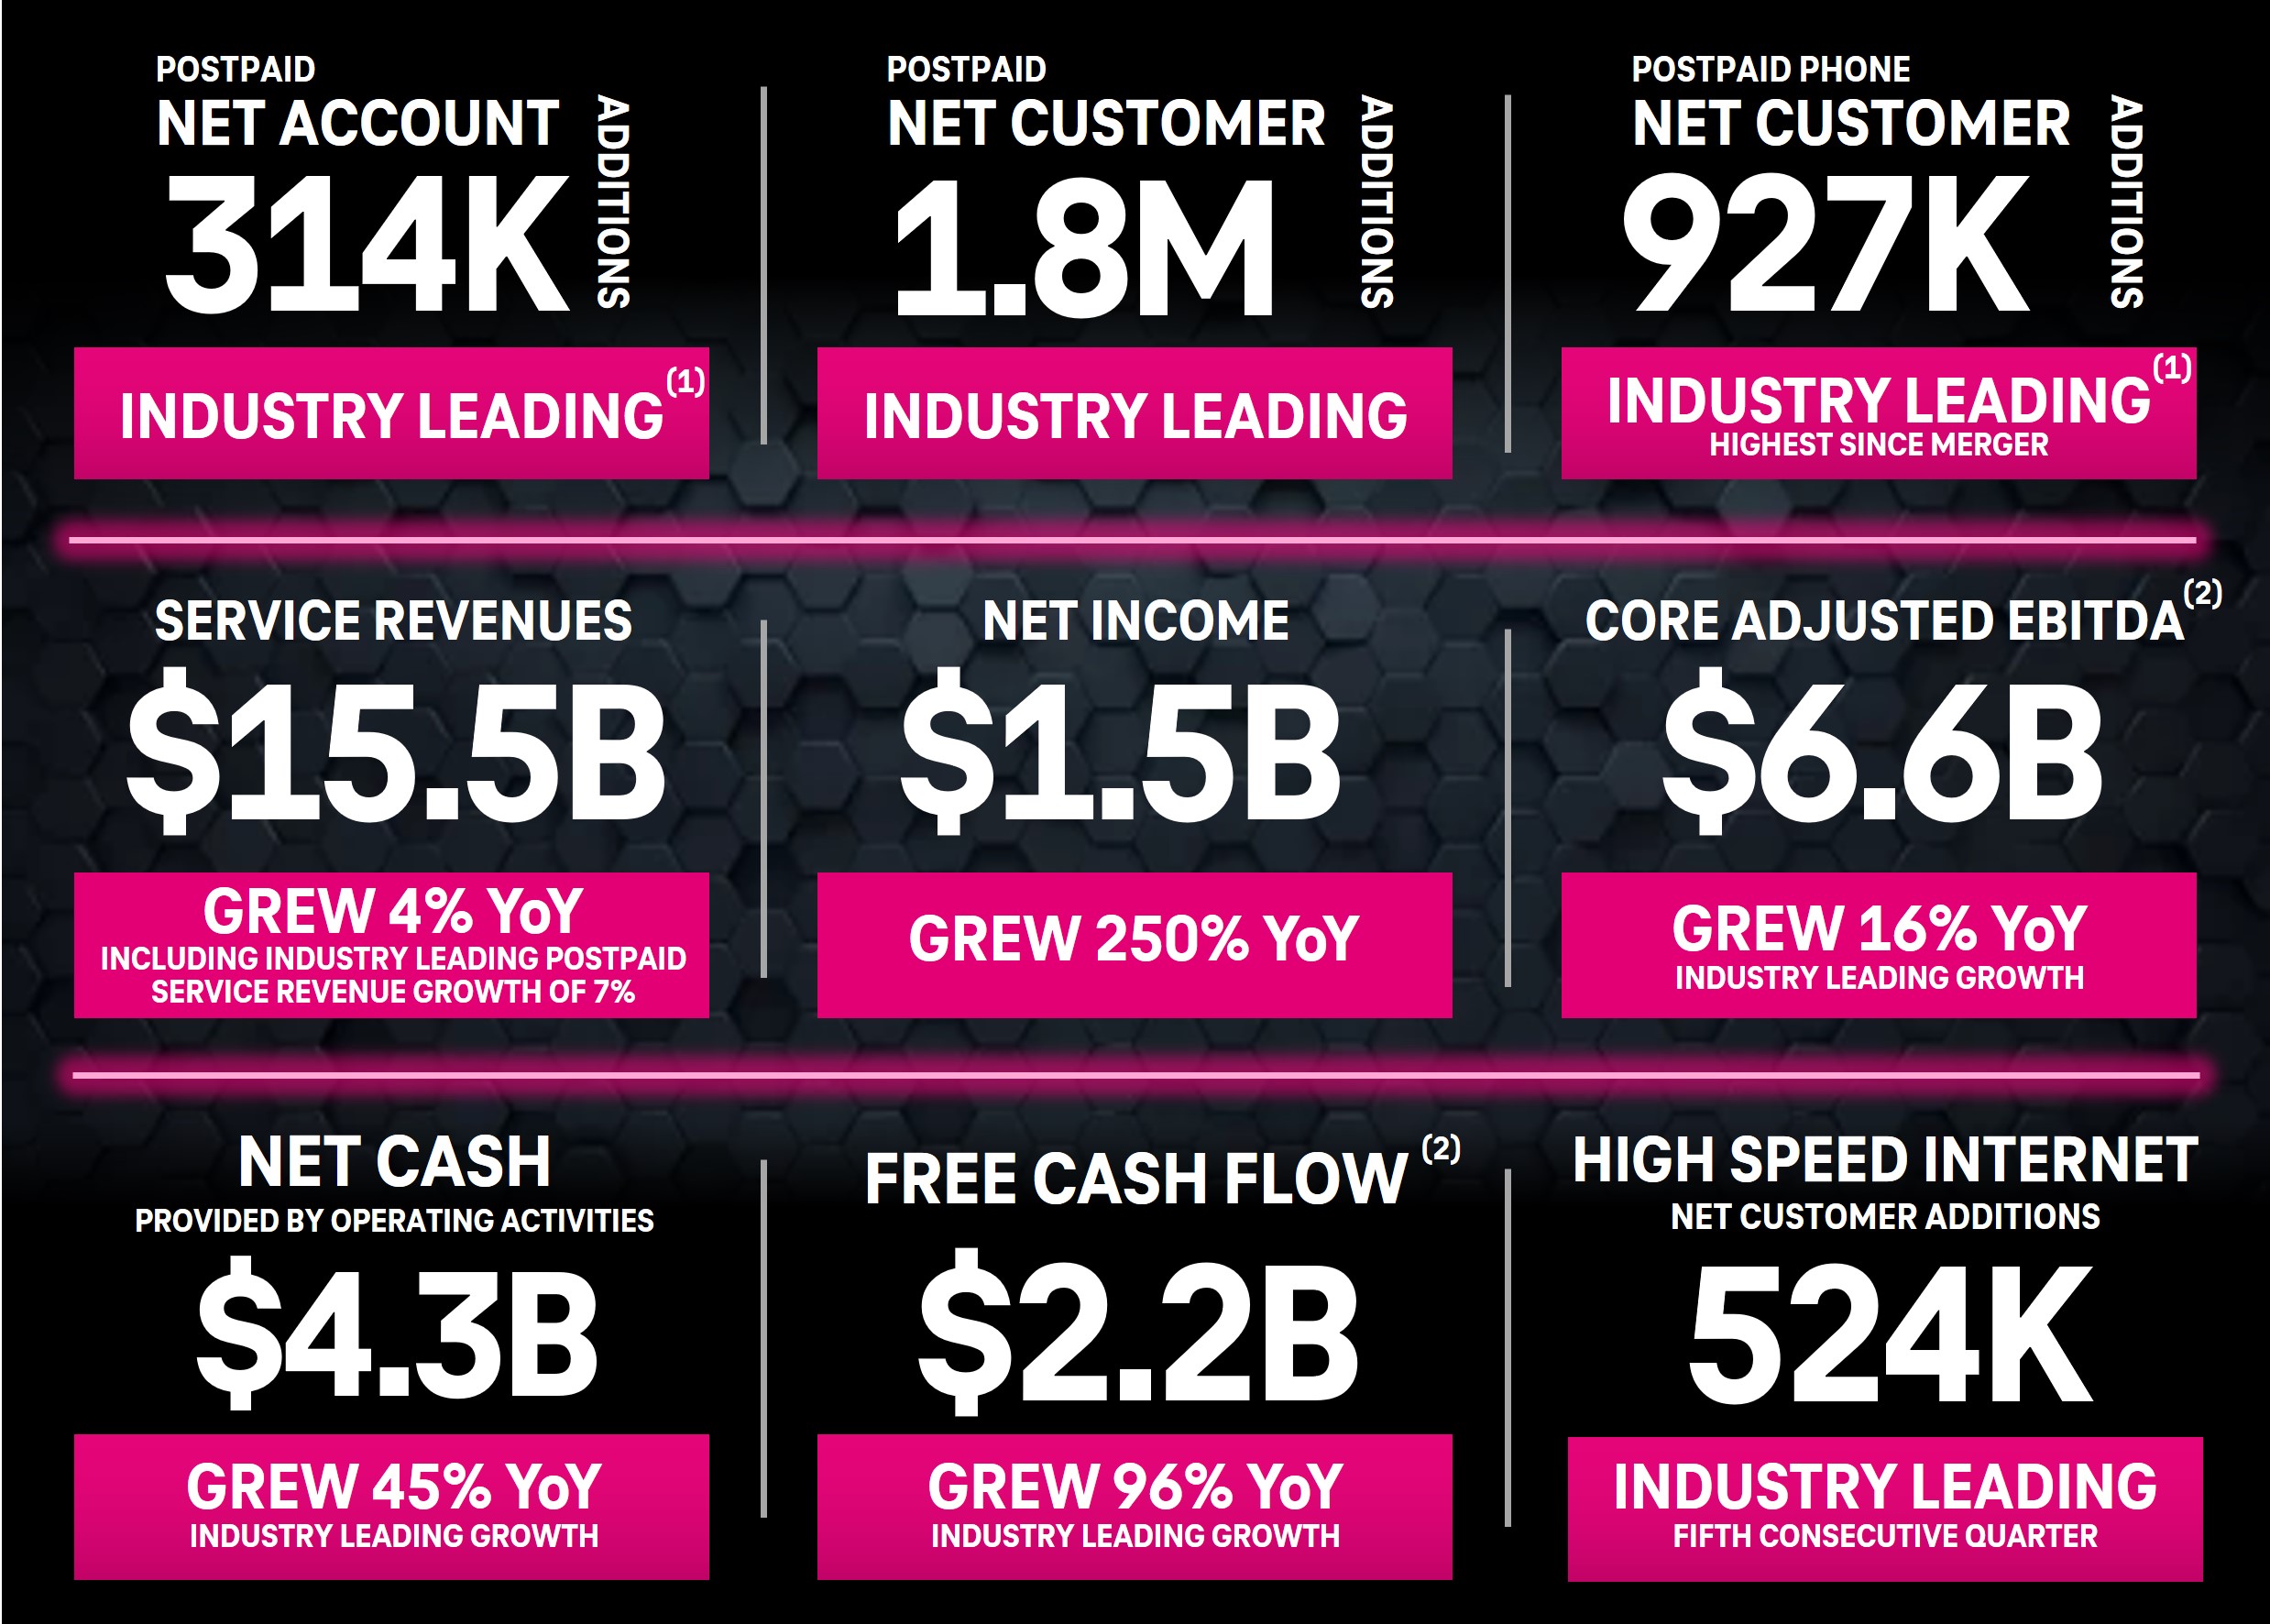
| T-Mobile Delivers Industry-Leading Customer, Postpaid Service Revenue and Cash Flow Growth in Q4 2022 | |
|
| | | | | | |
| | “With record postpaid account and customer net adds that translated into industry-leading postpaid service revenue and cash flow growth, T-Mobile absolutely smashed 2022 by once again focusing on putting customers first. In true Un-carrier fashion, we have no plans to slow down in 2023. Now that we are being recognized as not only the 5G leader but the clear overall network leader in the U.S., our differentiated and sustainable growth strategy is opening up even bigger pathways for our future!”
| | |
| | | | Mike Sievert, CEO | | |
| | | | | | |
(1) AT&T Inc. historically does not disclose postpaid net account additions. Comcast and Charter do not disclose postpaid phone net additions.
(2) Core Adjusted EBITDA and Free Cash Flow are non-GAAP financial measures. These non-GAAP financial measures should be considered in addition to, but not as a substitute for, the information provided in accordance with GAAP. Reconciliations for these non-GAAP financial measures to the most directly comparable GAAP financial measures are provided in the Reconciliation of Non-GAAP Financial Measures to GAAP Financial Measures tables. We are not able to forecast Net income on a forward-looking basis without unreasonable efforts due to the high variability and difficulty in predicting certain items that affect Net income including, but not limited to, Income tax expense and Interest expense. Core Adjusted EBITDA should not be used to predict Net income as the difference between this measure and Net income is variable.
| | | | | |
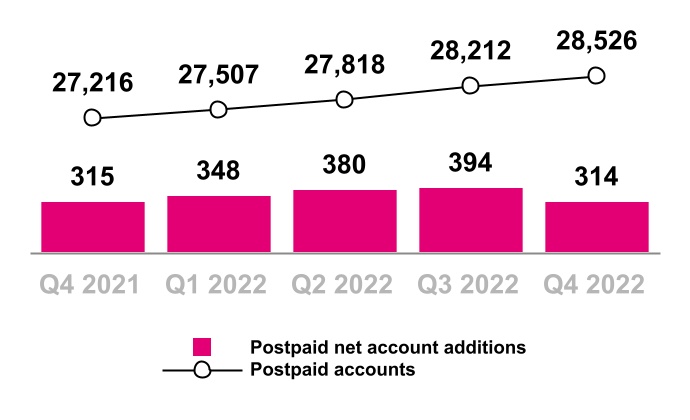
| Postpaid Accounts (in thousands) |
Postpaid net account additions were relatively flat primarily due to:
■Lower switching activity as industry growth begins to normalize closer to pre COVID-19 pandemic levels
■Offset by an increased share of new customer relationships driven by the company’s differentiated growth strategy in new and under-penetrated markets, including continued growth in High Speed Internet
Postpaid net account additions decreased primarily due to:
■Seasonally fewer High Speed Internet only additions
■Focus on deepening existing customer relationships during holiday period
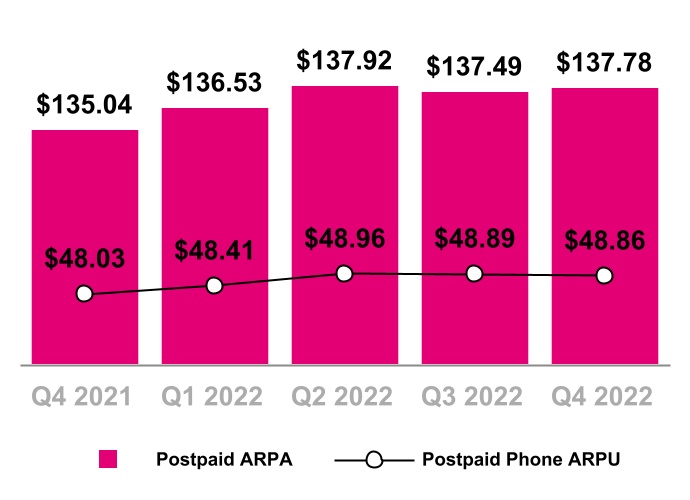
Postpaid ARPA increased 2.0% primarily due to:
■Higher premium services, including Magenta MAX
■Higher non-recurring charges relative to muted COVID-19 pandemic levels
■An increase in customers per account, including continued adoption of High Speed Internet from existing accounts
■Partially offset by an increase in High Speed Internet only accounts and increased promotional activity including growth in rate plans for specific customer cohorts (Business, Military, First Responders, etc.)
Postpaid phone ARPU increased 1.7% primarily due to:
■Higher premium services, including Magenta MAX
■Higher non-recurring charges relative to muted COVID-19 pandemic levels
■Partially offset by increased promotional activity including growth in rate plans for specific customer cohorts (Business, Military, First Responders, etc.)
Postpaid ARPA increased 0.2% primarily due to:
■Higher premium services, including Magenta MAX
■An increase in customers per account, including continued adoption of High Speed Internet from existing accounts
■Partially offset by seasonally higher promotional activity
■Growth in rate plans for specific customer cohorts (Business, Military, First Responders, etc.)
Postpaid phone ARPU was relatively flat primarily due to:
■Seasonally higher promotional activity
■Growth in rate plans for specific customer cohorts (Business, Military, First Responders, etc.)
■Mostly offset by higher premium services, including Magenta MAX
| | | | | |
| Postpaid ARPA & Postpaid Phone ARPU |
| | | | | |
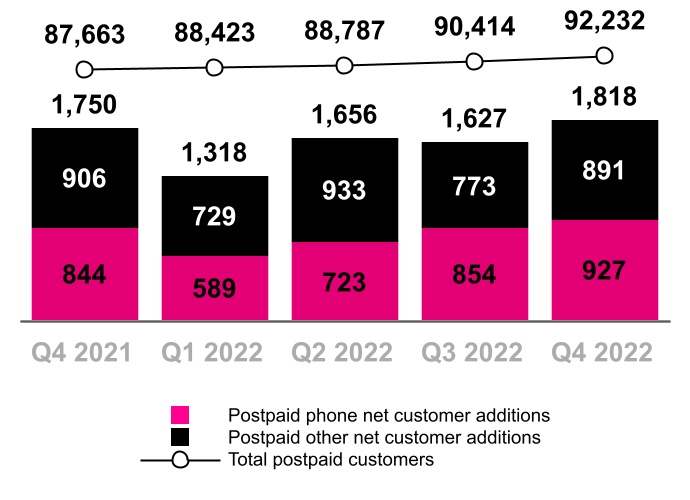
| Postpaid Customers (in thousands) |
Postpaid phone net customer additions increased primarily due to:
■Lower churn
■Partially offset by lower gross additions driven by industry switching activity normalizing closer to pre COVID-19 pandemic levels
Postpaid other net customer additions decreased primarily due to:
■Lower net additions from mobile internet devices
■Mostly offset by growth in High Speed Internet
Postpaid phone net customer additions increased primarily due to:
■Seasonally higher gross additions
■Partially offset by seasonally higher churn
Postpaid other net customer additions increased primarily due to:
■Seasonally higher net additions from wearables
■Partially offset by lower net additions from mobile internet devices
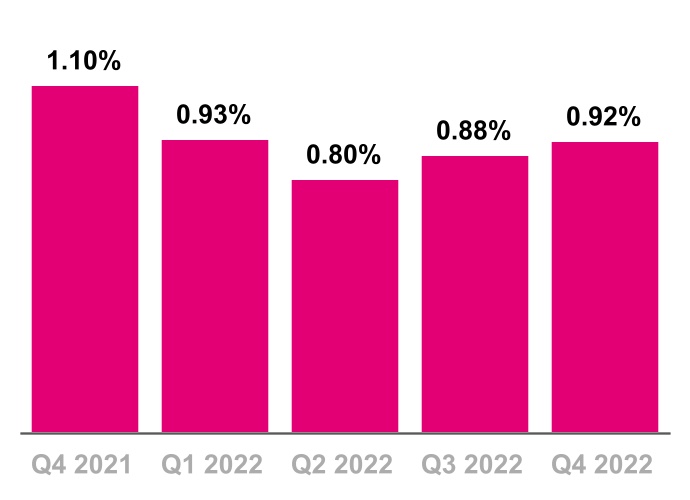
Postpaid phone churn decreased 18 basis points primarily due to:
■Reduced Sprint churn as we progress through the integration process
■Partially offset by more normalized payment performance relative to muted Pandemic-driven conditions a year ago
Postpaid phone churn increased 4 basis points primarily due to:
■Seasonally higher switching activity
■Partially offset by slight improvement in payment performance trends
| | | | | |
| Prepaid Customers (in thousands) |
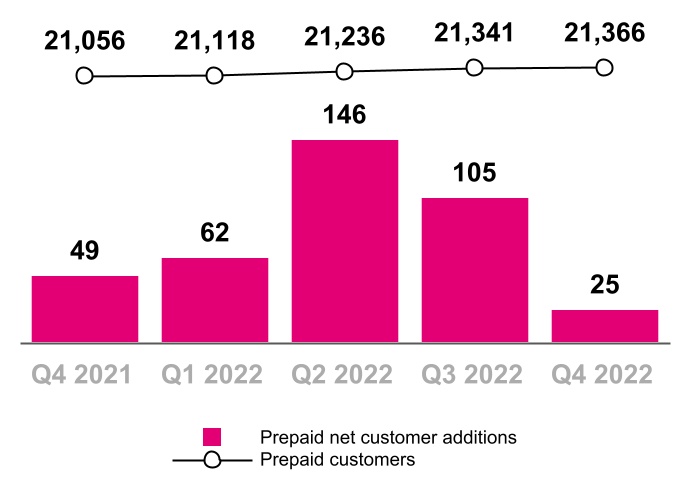
Prepaid net customer additions decreased primarily due to:
■Lower gross additions driven by industry switching activity
■Partially offset by growth in High Speed Internet
Prepaid net customer additions decreased primarily due to:
■Lower gross additions driven by industry switching activity
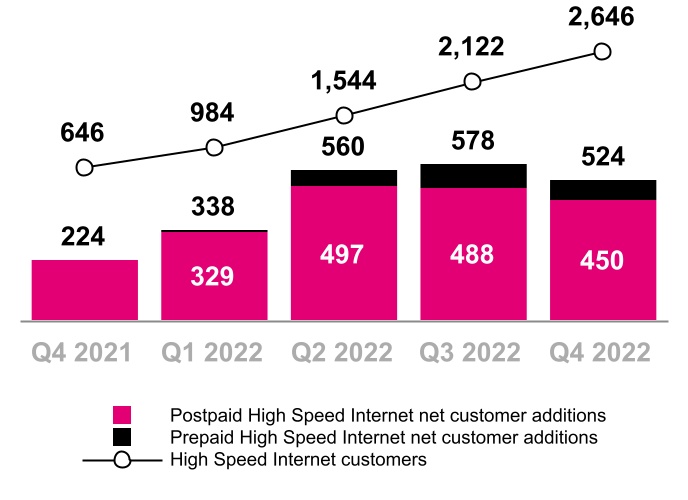
High Speed Internet net customer additions increased primarily due to:
■Continued growth in customer demand driven by increasing awareness
■Partially offset by increased deactivations from a growing customer base
High Speed Internet net customer additions decreased primarily due to:
■Increased deactivations from a growing customer base
■Partially offset by continued growth in customer demand driven by increasing awareness
| | | | | |
| High Speed Internet Customers (in thousands) |
| | | | | |
| Service Revenues ($ in millions) |
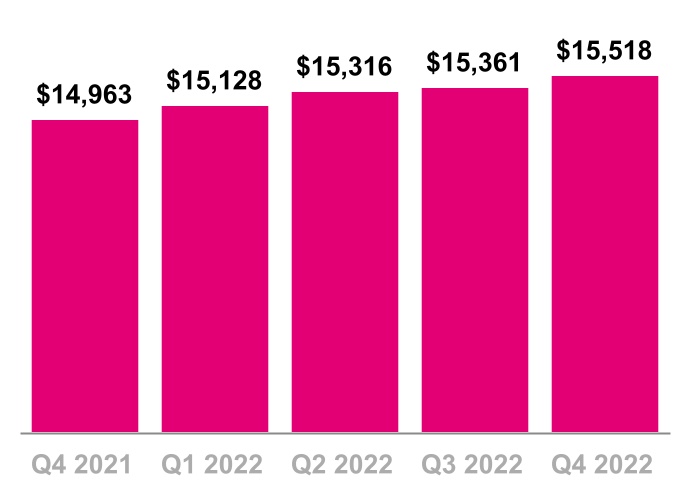
Service revenues increased 4% primarily due to:
■Increase in Postpaid service revenues
■Partially offset by a decrease in Wholesale and other service revenues
Service revenues increased slightly primarily due to:
■Increase in Postpaid service revenues
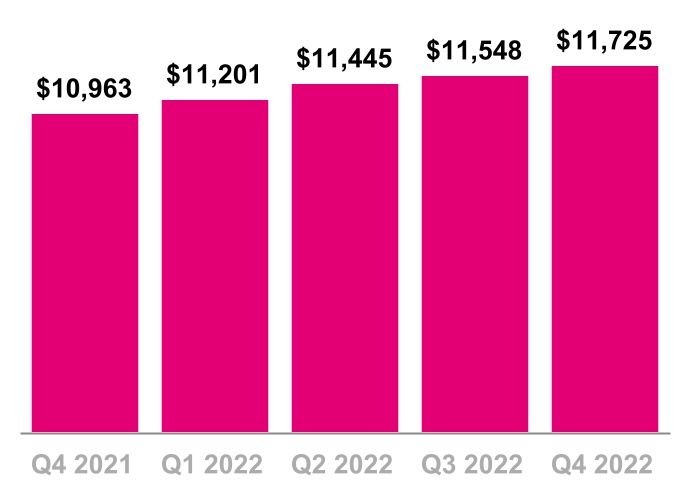
Postpaid service revenues increased 7% primarily due to:
■Higher average postpaid accounts
■Higher postpaid ARPA
Postpaid service revenues increased 2% primarily due to:
■Higher average postpaid accounts
| | | | | |
| Postpaid Service Revenues ($ in millions) |
| | | | | |
| Equipment Revenues ($ in millions) |
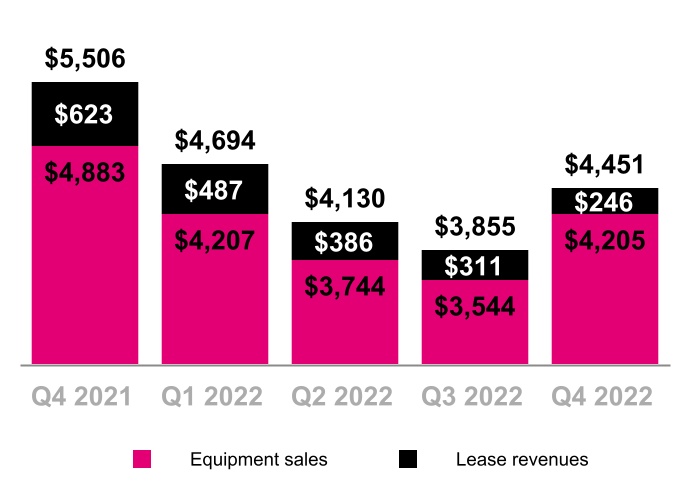
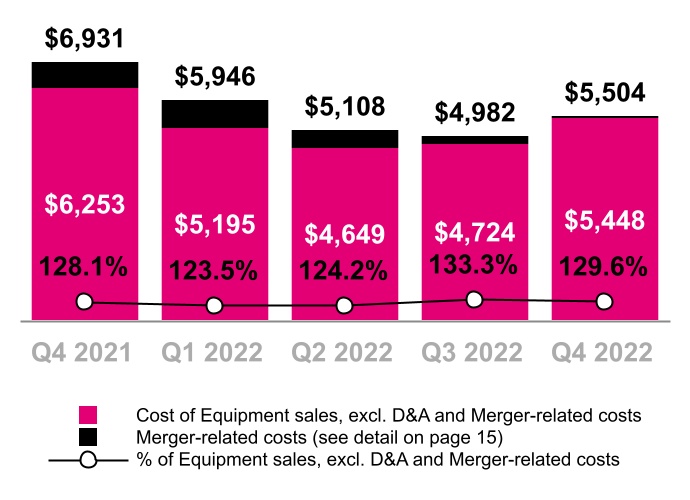
Equipment revenues decreased 19% primarily due to:
■Lower lease revenues
■A lower number of devices sold primarily driven by fewer postpaid upgrades and prepaid sales
■An increase in contra revenue primarily driven by higher imputed interest rates on equipment installment plans, which is recognized in other revenues over the device financing term
■Partially offset by higher average revenue per device sold
Equipment revenues increased 15% primarily due to:
■A higher average revenue per device sold, driven by an increase in the high-end phone mix
■A seasonally higher number of devices sold
■Partially offset by lower lease revenues, as well as an increase in contra revenue primarily driven by higher imputed interest rates on equipment installment plans, which is recognized in other revenues over the device financing term
Cost of equipment sales, exclusive of Depreciation and Amortization (D&A), decreased 21% primarily due to:
■A lower number of devices sold primarily driven by fewer postpaid upgrades and prepaid sales
■Lower Merger-related costs of devices primarily related to the network migration of Sprint customers
■The average cost per device sold was relatively in-line with the prior year
Cost of equipment sales, exclusive of D&A, increased 10% primarily due to:
■A higher average cost per device sold, driven by an increase in the high-end phone mix
■A seasonally higher number of devices sold
| | | | | |
| Cost of Equipment Sales, exclusive of D&A ($ in millions) |
| | | | | |
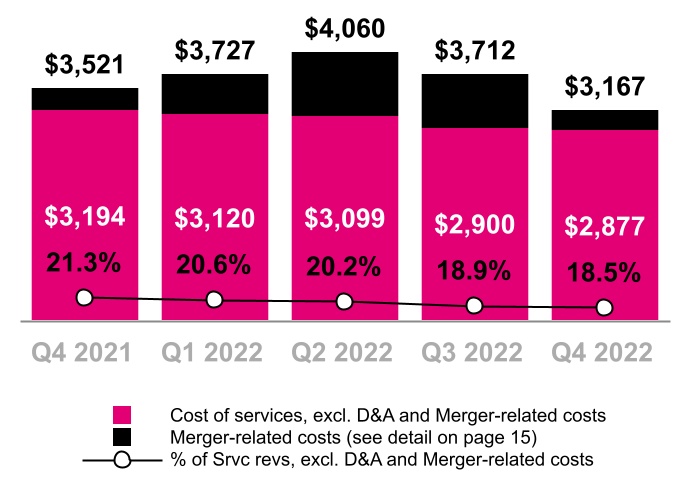
| Cost of Services, exclusive of D&A ($ in millions, % of Service revenues) |
Cost of services, exclusive of D&A, decreased 10% primarily due to:
■Higher realized Merger synergies
■Partially offset by higher site costs related to the continued build-out of our nationwide 5G network
Cost of services, exclusive of D&A, decreased 15% primarily due to:
■Lower Merger-related costs related to network decommissioning and integration
■Partially offset by higher site costs related to the continued build-out of our nationwide 5G network
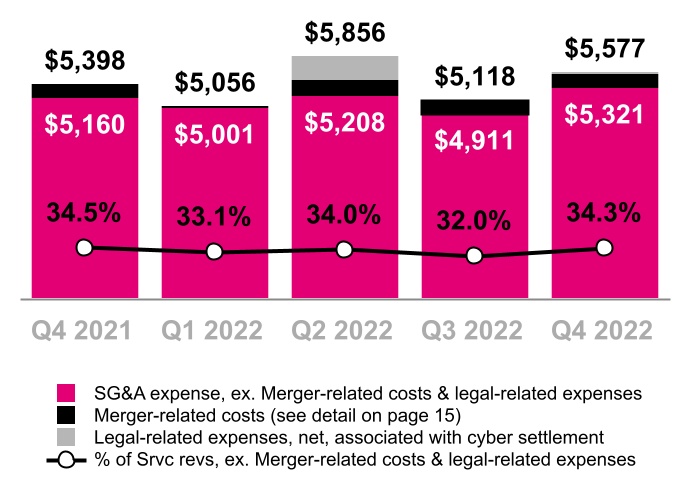
SG&A expense increased 3% primarily due to:
■Higher bad debt expense driven by higher receivable balances as well as normalization relative to muted COVID-19 pandemic levels
■Higher severance, restructuring and other expenses
■Partially offset by higher realized Merger synergies
SG&A expense increased 9% primarily due to:
■Seasonally higher advertising and other selling expenses
■Gains in the prior quarter from the sale of IP addresses
| | | | | |
| Selling, General and Administrative (SG&A) Expense ($ in millions, % of Service revenues) |
| | | | | |
| Net Income (Loss) ($ in millions, % of Service revenues) |
| | | | | |
| Diluted Earnings (Loss) Per Share (Diluted EPS) |
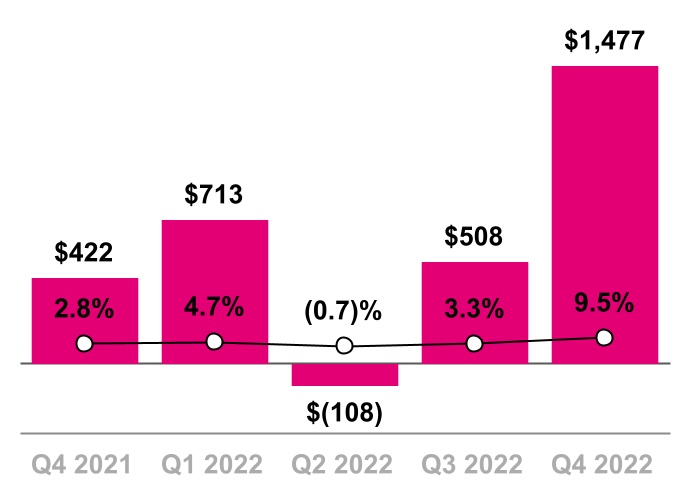
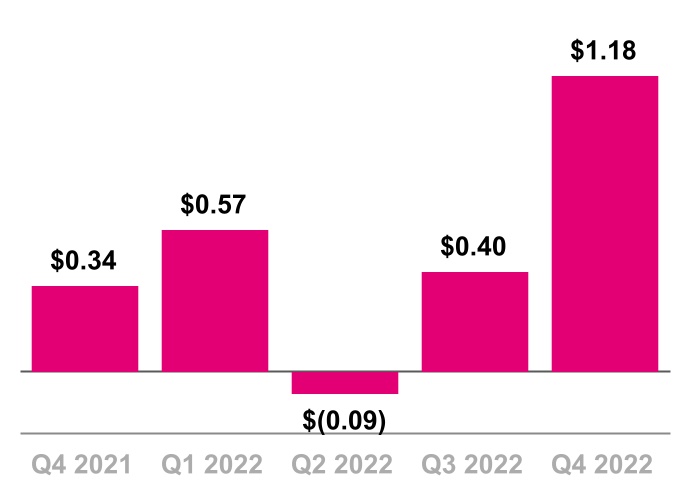
Net income was $1.5 billion and Diluted earnings per share was $1.18 in Q4 2022, compared to $422 million and $0.34 in Q4 2021, primarily due to the factors described above and included the following, net of tax:
■Merger-related costs in Q4 2022 of $444 million or $0.36 per share, compared to $950 million, or $0.76 per share, in Q4 2021
Net income was $1.5 billion and Diluted earnings per share was $1.18 in Q4 2022, compared to $508 million and $0.40 in Q3 2022, primarily due to the factors described above and included the following, net of tax:
■Merger-related costs in Q4 2022 of $444 million, or $0.36 per share, compared to $972 million, or $0.77 per share, in Q3 2022
■Loss related to the anticipated sale of the wireline business of $803 million, or $0.64 per share, in Q3 2022
| | | | | |
| Core Adjusted EBITDA* ($ in millions, % of Service revenues) |
*Excludes Merger-related costs (see detail on page 15) and other special items
Core Adjusted EBITDA increased 16% primarily due to:
■Lower Cost of equipment sales, excluding Merger-related costs
■Higher Service revenues
■Lower Cost of services, excluding Merger-related costs
■Partially offset by lower Equipment revenues, excluding Lease revenues
Core Adjusted EBITDA decreased 2% primarily due to:
■Higher Cost of equipment sales, excluding Merger-related costs
■Higher SG&A expenses, excluding Merger-related costs, and other special items, such as gains in the prior quarter from the sale of IP addresses
■Partially offset by higher Equipment revenues, excluding Lease revenues and higher Service revenues
Net cash provided by operating activities increased 45% primarily due to:
■Higher Net income, adjusted for non-cash income and expenses
■Lower net cash outflows from changes in working capital
Net cash provided by operating activities decreased 1% primarily due to:
■Higher net cash outflows from changes in working capital
■Mostly offset by higher Net income, adjusted for non-cash income and expenses
The impact of payments for Merger-related costs on Net cash provided by operating activities was $622 million in Q4 2022 compared to $942 million in Q3 2022 and $1.1 billion in Q4 2021.
| | | | | |
| Net Cash Provided by Operating Activities ($ in millions) |
| | | | | |
| Cash Purchases of Property and Equipment ($ in millions, % of Service revenues) |
Cash purchases of property and equipment, including capitalized interest, increased 16% primarily due to:
■Accelerated nationwide 5G network build-out
Cash purchases of property and equipment, including capitalized interest, decreased 7% primarily due to:
■Increased capital efficiency following accelerated nationwide 5G network build-out
Free Cash Flow increased 96% primarily due to:
■Higher Net cash provided by operating activities
■Higher proceeds related to securitization transactions, which were offset in Net cash provided by operating activities. There were no significant net cash proceeds during the quarter from securitization.
■Partially offset by higher Cash purchases of property and equipment
Free Cash Flow increased 6% primarily due to:
■Lower Cash purchases of property and equipment
■Partially offset by lower Net cash provided by operating activities, as well as lower proceeds related to securitization transactions, which were offset in Net cash provided by operating activities. There were no significant net cash proceeds during the quarter from securitization.
The impact of payments for Merger-related costs on Free Cash Flow was $622 million in Q4 2022 compared to $942 million in Q3 2022 and $1.1 billion in Q4 2021.
| | | | | |
| Free Cash Flow ($ in millions) |
| | | | | |
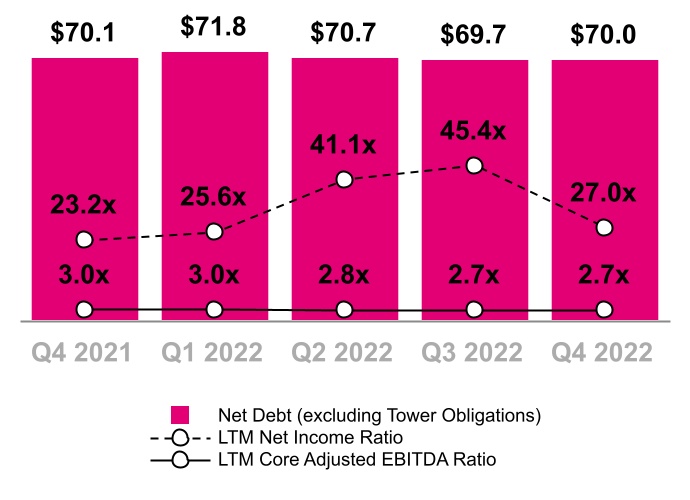
| Net Debt (Excluding Tower Obligations) & Net Debt to LTM Net Income and Core Adj. EBITDA Ratios ($ in billions) |
Total debt, excluding tower obligations, at the end of Q4 2022 was $74.5 billion.
Net debt, excluding tower obligations, at the end of Q4 2022 was $70.0 billion.
■On September 8, 2022, T-Mobile’s Board of Directors authorized a share repurchase program for up to $14.0 billion of the company’s common stock through September 30, 2023, including up to $3.0 billion in 2022.
■During Q4 2022, 16.5 million shares were repurchased for $2.3 billion
■During 2022, 21.4 million shares were repurchased for $3.0 billion
■On October 12, 2022, T-Mobile closed its first issuance of asset backed securities related to equipment installment plan receivables of $750 million.
■On October 17, 2022, T-Mobile entered into a $7.5 billion unsecured revolving credit facility, which replaced the previous $5.5 billion secured credit facility.
| | | | | | | | | | | | | | |
| | | | |
| T-Mobile delivered ~$6 billion in Merger synergies in 2022, increasing nearly 60% from 2021, primarily driven by accelerated network integration | |
| | | | |
The company realized full-year 2022 Merger synergies during the year of approximately $6.0 billion, comprised of the following: ▪$2.5 billion of SG&A expense reductions. ▪$2.2 billion of cost of service expense reductions achieved through network efficiencies ▪$1.3 billion of savings related to avoided network site builds
The company expects full-year 2023 Merger synergies to be between $7.2 billion to $7.5 billion: ▪$2.5 billion to $2.7 billion of SG&A expense reductions. ▪$3.1 billion to $3.2 billion of cost of service expense reductions achieved through network efficiencies ▪Approximately $1.6 billion of savings related to avoided network site builds
Merger-related costs in full-year 2022 were $5.0 billion compared to $3.1 billion in full-year 2021.
|
|
|
|
|
|
|
| | | | |
| | | | | | | | | | | | | | | | | | | | | | | | | | | | | | | | | | | | | | | | | | | | | | | | | | | | | |
| Merger-Related Costs |
| (in millions, excl. EPS) |
| | | | | | | | | | | | | | | | | |
| | | | | | | | | | | Sequential Change | | Year-Over-Year Change |
| Q4 2021 | | Q1 2022 | | Q2 2022 | | Q3 2022 | | Q4 2022 | | $ | | % | | $ | | % |
| Cost of services | $ | 327 | | | $ | 607 | | | $ | 961 | | | $ | 812 | | | $ | 290 | | | $ | (522) | | | (64) | % | | $ | (37) | | | (11) | % |
| Cost of equipment sales | 678 | | | 751 | | | 459 | | | 258 | | | 56 | | | (202) | | | (78) | % | | (622) | | | (92) | % |
| Selling, general & administrative | 238 | | | 55 | | | 248 | | | 226 | | | 246 | | | 20 | | | 9 | % | | 8 | | | 3 | % |
| Total Merger-related costs | $ | 1,243 | | | $ | 1,413 | | | $ | 1,668 | | | $ | 1,296 | | | $ | 592 | | | $ | (704) | | | (54) | % | | $ | (651) | | | (52) | % |
| | | | | | | | | | | | | | | | | |
Total Merger-related costs,
net of tax | $ | 950 | | | $ | 1,059 | | | $ | 1,252 | | | $ | 972 | | | $ | 444 | | | $ | (528) | | | (54) | % | | $ | (506) | | | (53) | % |
| Diluted EPS impact of Merger-related costs | $0.76 | | $0.84 | | $1.00 | | $0.77 | | $0.36 | | $ | (0.41) | | | (53) | % | | $ | (0.40) | | | (53) | % |
| | | | | | | | | | | | | | | | | |
Net cash payments for
Merger-related costs | $ | 1,086 | | | $ | 893 | | | $ | 907 | | | $ | 942 | | | $ | 622 | | | $ | (320) | | | (34) | % | | $ | (464) | | | (43) | % |
| | | | | | | | | | | | | | | | | |
2023 Outlook
| | | | | | | |
| | | |
| Postpaid net customer additions | | 5.0 to 5.5 million | |
Net income (1) | | N/A | |
Core Adjusted EBITDA (2) | | $28.7 to $29.2 billion | |
| Merger synergies | | $7.2 to $7.5 billion | |
Merger-related costs (3) | | ~$1.0 billion | |
| Net cash provided by operating activities | | $17.8 to $18.3 billion | |
Capital expenditures (4) | | $9.4 to $9.7 billion | |
Free Cash Flow (5) | | $13.1 to $13.6 billion | |
(1)We are not able to forecast Net income on a forward-looking basis without unreasonable efforts due to the high variability and difficulty in predicting certain items that affect GAAP Net income, including, but not limited to, Income tax expense and Interest expense. Core Adjusted EBITDA should not be used to predict Net income as the difference between this measure and Net income is variable.
(2)Management uses Core Adjusted EBITDA as a measure to monitor the financial performance of our operations, excluding the impact of lease revenues from our related device financing programs. Our guidance ranges assume lease revenues of approximately $300 million for 2023.
(3)Merger-related costs are excluded from Core Adjusted EBITDA but will impact Net income, Net cash provided by operating activities and Free Cash Flow.
(4)Capital expenditures means cash purchases of property and equipment, including capitalized interest.
(5)Free Cash Flow guidance does not assume any material net cash inflows from securitization in 2023.
Investor Relations
| | | | | | | | | | | | | | | | | | | | |
| | | | | | |
| | | | | | |
| Jud Henry | | Justin Taiber | | Trina Schurman | |
| Senior Vice President | | Senior Director | | Senior Director | |
| Investor Relations | | Investor Relations | | Investor Relations | |
| | | | | | | | | | | | | | | | | | | | | | | | | | |
| | | | | | | | |
| | | | | | | | |
| Samia Bhatti | | Zach Witterstaetter | | Rose Kopecky | | Jacob Marks | |
| Investor Relations | | Investor Relations | | Investor Relations | | Investor Relations | |
| Manager | | Manager | | Manager | | Manager | |
investor.relations@t-mobile.com
http://investor.t-mobile.com
T-Mobile US, Inc.
Consolidated Balance Sheets
(Unaudited)
| | | | | | | | | | | |
| (in millions, except share and per share amounts) | December 31,
2022 | | December 31,
2021 |
| Assets | | | |
| Current assets | | | |
| | | |
| Cash and cash equivalents | $ | 4,507 | | | $ | 6,631 | |
| Accounts receivable, net of allowance for credit losses of $167 and $146 | 4,445 | | | 4,194 | |
| Equipment installment plan receivables, net of allowance for credit losses and imputed discount of $667 and $494 | 5,123 | | | 4,748 | |
| | | |
| Inventory | 1,884 | | | 2,567 | |
| | | |
| Prepaid expenses | 673 | | | 746 | |
| | | |
| Other current assets | 2,435 | | | 2,005 | |
| | | |
| Total current assets | 19,067 | | | 20,891 | |
| | | |
| Property and equipment, net | 42,086 | | | 39,803 | |
| Operating lease right-of-use assets | 28,715 | | | 26,959 | |
| Financing lease right-of-use assets | 3,257 | | | 3,322 | |
| Goodwill | 12,234 | | | 12,188 | |
| Spectrum licenses | 95,798 | | | 92,606 | |
| Other intangible assets, net | 3,508 | | | 4,733 | |
| Equipment installment plan receivables due after one year, net of allowance for credit losses and imputed discount of $144 and $136 | 2,546 | | | 2,829 | |
| | | |
| Other assets | 4,127 | | | 3,232 | |
| | | |
| Total assets | $ | 211,338 | | | $ | 206,563 | |
| Liabilities and Stockholders' Equity | | | |
| Current liabilities | | | |
| | | |
| Accounts payable and accrued liabilities | $ | 12,275 | | | $ | 11,405 | |
| | | |
| Short-term debt | 5,164 | | | 3,378 | |
| Short-term debt to affiliates | — | | | 2,245 | |
| Deferred revenue | 780 | | | 856 | |
| Short-term operating lease liabilities | 3,512 | | | 3,425 | |
| Short-term financing lease liabilities | 1,161 | | | 1,120 | |
| | | |
| Other current liabilities | 1,850 | | | 1,070 | |
| | | |
| Total current liabilities | 24,742 | | | 23,499 | |
| | | |
| Long-term debt | 65,301 | | | 67,076 | |
| Long-term debt to affiliates | 1,495 | | | 1,494 | |
| Tower obligations | 3,934 | | | 2,806 | |
| Deferred tax liabilities | 10,884 | | | 10,216 | |
| Operating lease liabilities | 29,855 | | | 25,818 | |
| Financing lease liabilities | 1,370 | | | 1,455 | |
| | | |
| | | |
| Other long-term liabilities | 4,101 | | | 5,097 | |
| | | |
| Total long-term liabilities | 116,940 | | | 113,962 | |
| Commitments and contingencies | | | |
| Stockholders' equity | | | |
| | | |
| | | |
| Common Stock, par value $0.00001 per share, 2,000,000,000 shares authorized; 1,256,876,527 and 1,250,751,148 shares issued, 1,233,960,078 and 1,249,213,681 shares outstanding | — | | | — | |
| Additional paid-in capital | 73,941 | | | 73,292 | |
| Treasury stock, at cost, 22,916,449 and 1,537,468 shares issued | (3,016) | | | (13) | |
| Accumulated other comprehensive loss | (1,046) | | | (1,365) | |
| Accumulated deficit | (223) | | | (2,812) | |
| | | |
| Total stockholders' equity | 69,656 | | | 69,102 | |
| Total liabilities and stockholders' equity | $ | 211,338 | | | $ | 206,563 | |
| | | |
| | | |
| | | |
| | | |
| | | |
| | | |
| | | |
| | | |
| | | |
| | | |
| | | |
| | | |
| | | |
| | | |
| | | |
| | | |
| | | |
| | | |
| | | |
| | | |
T-Mobile US, Inc.
Consolidated Statements of Comprehensive Income
(Unaudited)
| | | | | | | | | | | | | | | | | | | | | | | | | | | | | |
| Three Months Ended | | Year Ended December 31, |
| (in millions, except share and per share amounts) | December 31,
2022 | | September 30,
2022 | | December 31,
2021 | | 2022 | | 2021 |
| Revenues | | | | | | | | | |
| | | | | | | | | |
| Postpaid revenues | $ | 11,725 | | | $ | 11,548 | | | $ | 10,963 | | | $ | 45,919 | | | $ | 42,562 | |
| Prepaid revenues | 2,449 | | | 2,484 | | | 2,474 | | | 9,857 | | | 9,733 | |
| Wholesale and other service revenues | 1,344 | | | 1,329 | | | 1,526 | | | 5,547 | | | 6,074 | |
| | | | | | | | | |
| | | | | | | | | |
| Total service revenues | 15,518 | | | 15,361 | | | 14,963 | | | 61,323 | | | 58,369 | |
| | | | | | | | | |
| Equipment revenues | 4,451 | | | 3,855 | | | 5,506 | | | 17,130 | | | 20,727 | |
| Other revenues | 304 | | | 261 | | | 316 | | | 1,118 | | | 1,022 | |
| | | | | | | | | |
| Total revenues | 20,273 | | | 19,477 | | | 20,785 | | | 79,571 | | | 80,118 | |
| | | | | | | | | |
| Operating expenses | | | | | | | | | |
| | | | | | | | | |
| Cost of services, exclusive of depreciation and amortization shown separately below | 3,167 | | | 3,712 | | | 3,521 | | | 14,666 | | | 13,934 | |
| Cost of equipment sales, exclusive of depreciation and amortization shown separately below | 5,504 | | | 4,982 | | | 6,931 | | | 21,540 | | | 22,671 | |
| Selling, general and administrative | 5,577 | | | 5,118 | | | 5,398 | | | 21,607 | | | 20,238 | |
| Impairment expense | — | | | — | | | — | | | 477 | | | — | |
| Loss on disposal group held for sale | 16 | | | 1,071 | | | — | | | 1,087 | | | — | |
| Depreciation and amortization | 3,262 | | | 3,313 | | | 3,872 | | | 13,651 | | | 16,383 | |
| | | | | | | | | |
| | | | | | | | | |
| Total operating expenses | 17,526 | | | 18,196 | | | 19,722 | | | 73,028 | | | 73,226 | |
| | | | | | | | | |
| Operating income | 2,747 | | | 1,281 | | | 1,063 | | | 6,543 | | | 6,892 | |
| | | | | | | | | |
| Other expense, net | | | | | | | | | |
| | | | | | | | | |
| Interest expense, net | (822) | | | (827) | | | (821) | | | (3,364) | | | (3,342) | |
| | | | | | | | | |
| | | | | | | | | |
| Other income (expense), net | 2 | | | (3) | | | (13) | | | (33) | | | (199) | |
| Total other expense, net | (820) | | | (830) | | | (834) | | | (3,397) | | | (3,541) | |
| Income before income taxes | 1,927 | | | 451 | | | 229 | | | 3,146 | | | 3,351 | |
| Income tax (expense) benefit | (450) | | | 57 | | | 193 | | | (556) | | | (327) | |
| | | | | | | | | |
| | | | | | | | | |
| | | | | | | | | |
| Net income | $ | 1,477 | | | $ | 508 | | | $ | 422 | | | $ | 2,590 | | | $ | 3,024 | |
| | | | | | | | | |
| | | | | | | | | |
| | | | | | | | | |
| Net income | $ | 1,477 | | | $ | 508 | | | $ | 422 | | | $ | 2,590 | | | $ | 3,024 | |
| Other comprehensive income, net of tax | | | | | | | | | |
| | | | | | | | | |
| | | | | | | | | |
| Reclassification of loss from cash flow hedges, net of tax effect of $13, $13, $13, $52, and $49 | 38 | | | 39 | | | 37 | | | 151 | | | 140 | |
| Unrealized gain (loss) on foreign currency translation adjustment, net of tax effect of $0, $0, $0, $(1) and $0 | 2 | | | (7) | | | (4) | | | (9) | | | (4) | |
| | | | | | | | | |
| Net unrecognized gain on pension and other postretirement benefits, net of tax effect of $61, $0, $28, $61 and $28 | 177 | | | — | | | 80 | | | 177 | | | 80 | |
| | | | | | | | | |
| Other comprehensive income | 217 | | | 32 | | | 113 | | | 319 | | | 216 | |
| | | | | | | | | |
| Total comprehensive income | $ | 1,694 | | | $ | 540 | | | $ | 535 | | | $ | 2,909 | | | $ | 3,240 | |
| Earnings per share | | | | | | | | | |
| | | | | | | | | |
| | | | | | | | | |
| | | | | | | | | |
| Basic | $ | 1.19 | | | $ | 0.40 | | | $ | 0.34 | | | $ | 2.07 | | | $ | 2.42 | |
| | | | | | | | | |
| | | | | | | | | |
| | | | | | | | | |
| Diluted | $ | 1.18 | | | $ | 0.40 | | | $ | 0.34 | | | $ | 2.06 | | | $ | 2.41 | |
| Weighted-average shares outstanding | | | | | | | | | |
| Basic | 1,240,827,732 | | | 1,253,873,429 | | | 1,249,272,296 | | | 1,249,763,934 | | | 1,247,154,988 | |
| Diluted | 1,246,880,141 | | | 1,259,210,271 | | | 1,254,289,170 | | | 1,255,376,769 | | | 1,254,769,926 | |
| | | | | | | | | |
| | | | | | | | | |
| | | | | | | | | |
| | | | | | | | | |
| | | | | | | | | |
| | | | | | | | | |
| | | | | | | | | |
| | | | | | | | | |
| | | | | | | | | |
| | | | | | | | | |
| | | | | | | | | |
| | | | | | | | | |
| | | | | | | | | |
| | | | | | | | | |
| | | | | | | | | |
| | | | | | | | | |
| | | | | | | | | |
| | | | | | | | | |
| | | | | | | | | |
| | | | | | | | | |
| | | | | | | | | |
| | | | | | | | | |
| | | | | | | | | |
| | | | | | | | | |
| | | | | | | | | |
| | | | | | | | | |
| | | | | | | | | |
| | | | | | | | | |
| | | | | | | | | |
| | | | | | | | | |
T-Mobile US, Inc.
Consolidated Statements of Cash Flows
(Unaudited)
| | | | | | | | | | | | | | | | | | | | | | | | | | | | | |
| Three Months Ended | | Year Ended December 31, |
| (in millions) | December 31,
2022 | | September 30,
2022 | | December 31,
2021 | | 2022 | | 2021 |
| Operating activities | | | | | | | | | |
| Net income | $ | 1,477 | | | $ | 508 | | | $ | 422 | | | $ | 2,590 | | | $ | 3,024 | |
| Adjustments to reconcile net income to net cash provided by operating activities | | | | | | | | | |
| | | | | | | | | |
| Depreciation and amortization | 3,262 | | | 3,313 | | | 3,872 | | | 13,651 | | | 16,383 | |
| Stock-based compensation expense | 150 | | | 150 | | | 137 | | | 595 | | | 540 | |
| Deferred income tax expense (benefit) | 419 | | | (36) | | | (213) | | | 492 | | | 197 | |
| Bad debt expense | 266 | | | 239 | | | 193 | | | 1,026 | | | 452 | |
| Losses from sales of receivables | 46 | | | 60 | | | 41 | | | 214 | | | 15 | |
| | | | | | | | | |
| Losses on redemption of debt | — | | | — | | | — | | | — | | | 184 | |
| | | | | | | | | |
| | | | | | | | | |
| Impairment expense | — | | | — | | | — | | | 477 | | | — | |
| Loss on remeasurement of disposal group held for sale | 6 | | | 371 | | | — | | | 377 | | | — | |
| Changes in operating assets and liabilities | | | | | | | | | |
| Accounts receivable | (1,377) | | | (1,224) | | | (1,028) | | | (5,158) | | | (3,225) | |
| Equipment installment plan receivables | (383) | | | (77) | | | (1,316) | | | (1,184) | | | (3,141) | |
| Inventories | 360 | | | (7) | | | (703) | | | 744 | | | 201 | |
| Operating lease right-of-use assets | 952 | | | 1,113 | | | 1,234 | | | 5,227 | | | 4,964 | |
| Other current and long-term assets | (304) | | | (334) | | | (385) | | | (754) | | | (573) | |
| Accounts payable and accrued liabilities | 239 | | | 342 | | | 1,794 | | | 558 | | | 549 | |
| Short- and long-term operating lease liabilities | (729) | | | (700) | | | (947) | | | (2,947) | | | (5,358) | |
| Other current and long-term liabilities | (128) | | | 550 | | | (180) | | | 459 | | | (531) | |
| Other, net | 80 | | | 123 | | | 79 | | | 414 | | | 236 | |
| | | | | | | | | |
| Net cash provided by operating activities | 4,336 | | | 4,391 | | | 3,000 | | | 16,781 | | | 13,917 | |
| Investing activities | | | | | | | | | |
| | | | | | | | | |
| Purchases of property and equipment, including capitalized interest of $(17), $(16), $(23), $(61) and $(210) | (3,383) | | | (3,634) | | | (2,929) | | | (13,970) | | | (12,326) | |
| Purchases of spectrum licenses and other intangible assets, including deposits | (12) | | | (360) | | | (29) | | | (3,331) | | | (9,366) | |
| Proceeds from sales of tower sites | 9 | | | — | | | 9 | | | 9 | | | 40 | |
| Proceeds related to beneficial interests in securitization transactions | 1,222 | | | 1,308 | | | 1,032 | | | 4,836 | | | 4,131 | |
| | | | | | | | | |
| Acquisition of companies, net of cash and restricted cash acquired | — | | | — | | | — | | | (52) | | | (1,916) | |
| | | | | | | | | |
| Other, net | 11 | | | 131 | | | 5 | | | 149 | | | 51 | |
| | | | | | | | | |
| Net cash used in investing activities | (2,153) | | | (2,555) | | | (1,912) | | | (12,359) | | | (19,386) | |
| Financing activities | | | | | | | | | |
| | | | | | | | | |
| Proceeds from issuance of long-term debt | 742 | | | 2,972 | | | 2,969 | | | 3,714 | | | 14,727 | |
| | | | | | | | | |
| | | | | | | | | |
| | | | | | | | | |
| Repayments of financing lease obligations | (338) | | | (311) | | | (289) | | | (1,239) | | | (1,111) | |
| Repayments of short-term debt for purchases of inventory, property and equipment and other financial liabilities | — | | | — | | | (17) | | | — | | | (184) | |
| Repayments of long-term debt | (2,411) | | | (132) | | | (1,131) | | | (5,556) | | | (11,100) | |
| | | | | | | | | |
| | | | | | | | | |
| Repurchases of common stock | (2,443) | | | (557) | | | — | | | (3,000) | | | — | |
| | | | | | | | | |
| | | | | | | | | |
| Tax withholdings on share-based awards | (18) | | | (10) | | | (8) | | | (243) | | | (316) | |
| | | | | | | | | |
| Cash payments for debt prepayment or debt extinguishment costs | — | | | — | | | — | | | — | | | (116) | |
| Other, net | (30) | | | (35) | | | (52) | | | (127) | | | (191) | |
| | | | | | | | | |
| Net cash (used in) provided by financing activities | (4,498) | | | 1,927 | | | 1,472 | | | (6,451) | | | 1,709 | |
| Change in cash and cash equivalents, including restricted cash and cash held for sale | (2,315) | | | 3,763 | | | 2,560 | | | (2,029) | | | (3,760) | |
| Cash and cash equivalents, including restricted cash and cash held for sale | | | | | | | | | |
| Beginning of period | 6,989 | | | 3,226 | | | 4,143 | | | 6,703 | | | 10,463 | |
| End of period | $ | 4,674 | | | $ | 6,989 | | | $ | 6,703 | | | $ | 4,674 | | | $ | 6,703 | |
| | | | | | | | | |
| | | | | | | | | |
| | | | | | | | | |
| | | | | | | | | |
| | | | | | | | | |
| | | | | | | | | |
| | | | | | | | | |
| | | | | | | | | |
| | | | | | | | | |
| | | | | | | | | |
| | | | | | | | | |
| | | | | | | | | |
| | | | | | | | | |
| | | | | | | | | |
| | | | | | | | | |
| | | | | | | | | |
| | | | | | | | | |
| | | | | | | | | |
| | | | | | | | | |
| | | | | | | | | |
| | | | | | | | | |
| | | | | | | | | |
| | | | | | | | | |
| | | | | | | | | |
| | | | | | | | | |
| | | | | | | | | |
| | | | | | | | | |
| | | | | | | | | |
T-Mobile US, Inc.
Consolidated Statements of Cash Flows (Continued)
(Unaudited)
| | | | | | | | | | | | | | | | | | | | | | | | | | | | | |
| Three Months Ended | | Year Ended December 31, |
| (in millions) | December 31,
2022 | | September 30,
2022 | | December 31,
2021 | | 2022 | | 2021 |
| Supplemental disclosure of cash flow information | | | | | | | | | |
| Interest payments, net of amounts capitalized | $ | 937 | | | $ | 781 | | | $ | 981 | | | $ | 3,485 | | | $ | 3,723 | |
| Operating lease payments | 1,042 | | | 1,073 | | | 1,083 | | | 4,205 | | | 6,248 | |
| Income tax payments | 1 | | | 12 | | | 44 | | | 76 | | | 167 | |
| Non-cash investing and financing activities | | | | | | | | | |
| Non-cash beneficial interest obtained in exchange for securitized receivables | $ | 1,003 | | | $ | 1,181 | | | $ | 876 | | | $ | 4,192 | | | $ | 4,237 | |
| | | | | | | | | |
| Change in accounts payable and accrued liabilities for purchases of property and equipment | (6) | | | 390 | | | 793 | | | 133 | | | 366 | |
| Leased devices transferred from inventory to property and equipment | 57 | | | 67 | | | 166 | | | 336 | | | 1,198 | |
| Returned leased devices transferred from property and equipment to inventory | (53) | | | (65) | | | (267) | | | (396) | | | (1,437) | |
| | | | | | | | | |
| Increase in Tower obligations from contract modification | — | | | — | | | — | | | 1,158 | | | — | |
| Operating lease right-of-use assets obtained in exchange for lease obligations | 417 | | | 479 | | | 834 | | | 7,462 | | | 3,773 | |
| Financing lease right-of-use assets obtained in exchange for lease obligations | 59 | | | 348 | | | 152 | | | 1,256 | | | 1,261 | |
T-Mobile US, Inc.
Supplementary Operating and Financial Data
(Unaudited)
| | | | | | | | | | | | | | | | | | | | | | | | | | | | | | | | | | | | | | | | | | | | | | | | | | | | | | | | | | | |
| Quarter | | Year Ended December 31, |
| (in thousands) | Q1 2021 | | Q2 2021 | | Q3 2021 | | Q4 2021 | | Q1 2022 | | Q2 2022 | | Q3 2022 | | Q4 2022 | | 2021 | | 2022 |
| Customers, end of period | | | | | | | | | | | | | | | | | | | |
| | | | | | | | | | | | | | | | | | | |
Postpaid phone customers (1)(2) | 67,402 | | | 68,029 | | | 69,418 | | | 70,262 | | | 70,656 | | | 71,053 | | | 71,907 | | | 72,834 | | | 70,262 | | | 72,834 | |
Postpaid other customers (1)(2) | 15,170 | | | 15,819 | | | 16,495 | | | 17,401 | | | 17,767 | | | 17,734 | | | 18,507 | | | 19,398 | | | 17,401 | | | 19,398 | |
| | | | | | | | | | | | | | | | | | | |
| Total postpaid customers | 82,572 | | | 83,848 | | | 85,913 | | | 87,663 | | | 88,423 | | | 88,787 | | | 90,414 | | | 92,232 | | | 87,663 | | | 92,232 | |
| | | | | | | | | | | | | | | | | | | |
Prepaid customers (1) | 20,865 | | | 20,941 | | | 21,007 | | | 21,056 | | | 21,118 | | | 21,236 | | | 21,341 | | | 21,366 | | | 21,056 | | | 21,366 | |
| | | | | | | | | | | | | | | | | | | |
| Total customers | 103,437 | | | 104,789 | | | 106,920 | | | 108,719 | | | 109,541 | | | 110,023 | | | 111,755 | | | 113,598 | | | 108,719 | | | 113,598 | |
| | | | | | | | | | | | | | | | | | | |
| | | | | | | | | | | | | | | | | | | |
| | | | | | | | | | | | | | | | | | | |
| | | | | | | | | | | | | | | | | | | |
| | | | | | | | | | | | | | | | | | | |
Adjustments to customers (1)(2) | 12 | | | — | | | 806 | | | — | | | (558) | | | (1,320) | | | — | | | — | | | 818 | | | (1,878) | |
| | | | | | | | | | | | | | | | | | | |
| | | | | | | | | | | | | | | | | | | |
| | | | | | | | | | | | | | | | | | | |
| | | | | | | | | | | | | | | | | | | |
| | | | | | | | | | | | | | | | | | | |
| | | | | | | | | | | | | | | | | | | |
| | | | | | | | | | | | | | | | | | | |
| | | | | | | | | | | | | | | | | | | |
| | | | | | | | | | | | | | | | | | | |
| | | | | | | | | | | | | | | | | | | |
| | | | | | | | | | | | | | | | | | | |
| | | | | | | | | | | | | | | | | | | |
| | | | | | | | | | | | | | | | | | | |
| | | | | | | | | | | | | | | | | | | |
| | | | | | | | | | | | | | | | | | | |
| | | | | | | | | | | | | | | | | | | |
| | | | | | | | | | | | | | | | | | | |
| | | | | | | | | | | | | | | | | | | |
| | | | | | | | | | | | | | | | | | | |
| | | | | | | | | | | | | | | | | | | |
| | | | | | | | | | | | | | | | | | | |
| | | | | | | | | | | | | | | | | | | |
| | | | | | | | | | | | | | | | | | | |
| | | | | | | | | | | | | | | | | | | |
| | | | | | | | | | | | | | | | | | | |
| | | | | | | | | | | | | | | | | | | |
| | | | | | | | | | | | | | | | | | | |
| | | | | | | | | | | | | | | | | | | |
| | | | | | | | | | | | | | | | | | | |
| | | | | | | | | | | | | | | | | | | |
| | | | | | | | | | | | | | | | | | | |
| | | | | | | | | | | | | | | | | | | |
(1)Customers impacted by the decommissioning of the legacy Sprint CDMA and LTE and T-Mobile UMTS networks have been excluded from our customer base resulting in the removal of 212,000 postpaid phone customers and 349,000 postpaid other customers in the first quarter of 2022 and 284,000 postpaid phone customers, 946,000 postpaid other customers and 28,000 prepaid customers in the second quarter of 2022. In connection with our acquisition of companies, we included a base adjustment in the first quarter of 2022 to increase postpaid phone customers by 17,000 and reduce postpaid other customers by 14,000. Certain customers now serviced through reseller contracts were removed from our reported postpaid customer base resulting in the removal of 42,000 postpaid phone customers and 20,000 postpaid other customers in the second quarter of 2022.
(2) In the first quarter of 2021, we acquired 11,000 postpaid phone customers and 1,000 postpaid other customers through our acquisition of an affiliate. In the third quarter of 2021, we acquired 716,000 postpaid phone customers and 90,000 postpaid other customers through our acquisition of the Wireless Assets from Shentel.
| | | | | | | | | | | | | | | | | | | | | | | | | | | | | | | | | | | | | | | | | | | | | | | | | | | | | | | | | | | |
| Quarter | | Year Ended December 31, |
| (in thousands) | Q1 2021 | | Q2 2021 | | Q3 2021 | | Q4 2021 | | Q1 2022 | | Q2 2022 | | Q3 2022 | | Q4 2022 | | 2021 | | 2022 |
| Net customer additions | | | | | | | | | | | | | | | | | | | |
| | | | | | | | | | | | | | | | | | | |
| Postpaid phone customers | 773 | | | 627 | | | 673 | | | 844 | | | 589 | | | 723 | | | 854 | | | 927 | | | 2,917 | | | 3,093 | |
| Postpaid other customers | 437 | | | 649 | | | 586 | | | 906 | | | 729 | | | 933 | | | 773 | | | 891 | | | 2,578 | | | 3,326 | |
| | | | | | | | | | | | | | | | | | | |
| Total postpaid customers | 1,210 | | | 1,276 | | | 1,259 | | | 1,750 | | | 1,318 | | | 1,656 | | | 1,627 | | | 1,818 | | | 5,495 | | | 6,419 | |
| | | | | | | | | | | | | | | | | | | |
| Prepaid customers | 151 | | | 76 | | | 66 | | | 49 | | | 62 | | | 146 | | | 105 | | | 25 | | | 342 | | | 338 | |
| | | | | | | | | | | | | | | | | | | |
| Total customers | 1,361 | | | 1,352 | | | 1,325 | | | 1,799 | | | 1,380 | | | 1,802 | | | 1,732 | | | 1,843 | | | 5,837 | | | 6,757 | |
| | | | | | | | | | | | | | | | | | | |
| Migrations from prepaid to postpaid plans | 170 | | | 190 | | | 175 | | | 205 | | | 165 | | | 155 | | | 155 | | | 175 | | | 740 | | | 650 | |
| | | | | | | | | | | | | | | | | | | |
| | | | | | | | | | | | | | | | | | | |
| | | | | | | | | | | | | | | | | | | |
| | | | | | | | | | | | | | | | | | | |
| | | | | | | | | | | | | | | | | | | |
| | | | | | | | | | | | | | | | | | | |
| | | | | | | | | | | | | | | | | | | |
| | | | | | | | | | | | | | | | | | | |
| | | | | | | | | | | | | | | | | | | |
| | | | | | | | | | | | | | | | | | | |
| | | | | | | | | | | | | | | | | | | |
| | | | | | | | | | | | | | | | | | | |
| | | | | | | | | | | | | | | | | | | |
| | | | | | | | | | | | | | | | | | | |
| | | | | | | | | | | | | | | | | | | |
| | | | | | | | | | | | | | | | | | | |
| | | | | | | | | | | | | | | | | | | |
| | | | | | | | | | | | | | | | | | | |
| | | | | | | | | | | | | | | | | | | |
| | | | | | | | | | | | | | | | | | | |
| | | | | | | | | | | | | | | | | | | |
| | | | | | | | | | | | | | | | | | | |
| | | | | | | | | | | | | | | | | | | |
| | | | | | | | | | | | | | | | | | | |
| | | | | | | | | | | | | | | | | | | |
| | | | | | | | | | | | | | | | | | | |
| | | | | | | | | | | | | | | | | | | |
| | | | | | | | | | | | | | | | | | | |
| | | | | | | | | | | | | | | | | | | |
| | | | | | | | | | | | | | | | | | | |
| | | | | | | | | | | | | | | | | | | |
| | | | | | | | | | | | | | | | | | | |
| | | | | | | | | | | | | | | | | | | |
| | | | | | | | | | | | | | | | | | | |
| | | | | | | | | | | | | | | | | | | |
| | | | | | | | | | | | | | | | | | | |
| | | | | | | | | | | | | | | | | | | |
| | | | | | | | | | | | | | | | | | | |
| | | | | | | | | | | | | | | | | | | |
| | | | | | | | | | | | | | | | | | | |
| | | | | | | | | | | | | | | | | | | |
| | | | | | | | | | | | | | | | | | | |
| | | | | | | | | | | | | | | | | | | |
| | | | | | | | | | | | | | | | | | | | | | | | | | | | | | | | | | | | | | | | | | | | | | | | | | | | | | | | | | | |
| Quarter | | Year Ended December 31, |
| (in millions, except percentages) | Q1 2021 | | Q2 2021 | | Q3 2021 | | Q4 2021 | | Q1 2022 | | Q2 2022 | | Q3 2022 | | Q4 2022 | | 2021 | | 2022 |
| Devices sold or leased | | | | | | | | | | | | | | | | | | | |
| Phones | 9.6 | | 9.6 | | 9.8 | | 11.6 | | 9.7 | | 8.8 | | 8.4 | | 8.3 | | 40.6 | | 35.2 |
| Mobile broadband and IoT devices | 1.0 | | 1.4 | | 1.5 | | 2.2 | | 1.8 | | 1.9 | | 2.0 | | 2.2 | | 6.1 | | 7.9 |
| Total | 10.6 | | 11.0 | | 11.3 | | 13.8 | | 11.5 | | 10.7 | | 10.4 | | 10.5 | | 46.7 | | 43.1 |
| | | | | | | | | | | | | | | | | | | |
| Postpaid device upgrade rate | 4.8 | % | | 4.7 | % | | 4.3 | % | | 5.8 | % | | 4.8 | % | | 4.1 | % | | 3.8 | % | | 3.9 | % | | 19.6 | % | | 16.6 | % |
| | | | | | | | | | | | | | | | | | | | | | | | | | | | | | | | | | | | | | | | | | | | | | | | | | | | | | | | | | | |
| Quarter | | Year Ended December 31, |
| Q1 2021 | | Q2 2021 | | Q3 2021 | | Q4 2021 | | Q1 2022 | | Q2 2022 | | Q3 2022 | | Q4 2022 | | 2021 | | 2022 |
| Churn | | | | | | | | | | | | | | | | | | | |
| Postpaid phone churn | 0.98 | % | | 0.87 | % | | 0.96 | % | | 1.10 | % | | 0.93 | % | | 0.80 | % | | 0.88 | % | | 0.92 | % | | 0.98 | % | | 0.88 | % |
| Prepaid churn | 2.78 | % | | 2.62 | % | | 2.90 | % | | 3.01 | % | | 2.67 | % | | 2.58 | % | | 2.88 | % | | 2.93 | % | | 2.83 | % | | 2.77 | % |
T-Mobile US, Inc.
Supplementary Operating and Financial Data
(Unaudited)
| | | | | | | | | | | | | | | | | | | | | | | | | | | | | | | | | | | | | | | | | | | | | | | | | | | | | | | | | | | |
| Quarter | | Year Ended December 31, |
| (in thousands) | Q1 2021 | | Q2 2021 | | Q3 2021 | | Q4 2021 | | Q1 2022 | | Q2 2022 | | Q3 2022 | | Q4 2022 | | 2021 | | 2022 |
| Accounts, end of period | | | | | | | | | | | | | | | | | | | |
Total postpaid customer accounts (1)(2) | 26,014 | | 26,363 | | 26,901 | | 27,216 | | 27,507 | | 27,818 | | 28,212 | | 28,526 | | 27,216 | | 28,526 |
| | | | | | | | | | | | | | | | | | | |
| | | | | | | | | | | | | | | | | | | |
(1) Customers impacted by the decommissioning of the legacy Sprint CDMA and LTE and T-Mobile UMTS networks have been excluded from our postpaid account base resulting in the removal of 57,000 postpaid accounts in the first quarter of 2022, 69,000 postpaid accounts in the second quarter of 2022.
(2) In the first quarter of 2021, we acquired 4,000 postpaid accounts through our acquisition of an affiliate. In the third quarter of 2021, we acquired 270,000 postpaid accounts through our acquisition of the Wireless Assets of Shentel.
| | | | | | | | | | | | | | | | | | | | | | | | | | | | | | | | | | | | | | | | | | | | | | | | | | | | | | | | | | | |
| Quarter | | Year Ended December 31, |
| (in thousands) | Q1 2021 | | Q2 2021 | | Q3 2021 | | Q4 2021 | | Q1 2022 | | Q2 2022 | | Q3 2022 | | Q4 2022 | | 2021 | | 2022 |
| Net account additions | | | | | | | | | | | | | | | | | | | |
| Postpaid net account additions | 257 | | 348 | | 268 | | 315 | | 348 | | 380 | | 394 | | 314 | | 1,188 | | 1,436 |
| | | | | | | | | | | | | | | | | | | |
| | | | | | | | | | | | | | | | | | | |
| | | | | | | | | | | | | | | | | | | | | | | | | | | | | | | | | | | | | | | | | | | | | | | | | | | | | | | | | | | |
| Quarter | | Year Ended December 31, |
| (in thousands) | Q1 2021 | | Q2 2021 | | Q3 2021 | | Q4 2021 | | Q1 2022 | | Q2 2022 | | Q3 2022 | | Q4 2022 | | 2021 | | 2022 |
| High speed internet customers, end of period | | | | | | | | | | | | | | | | | | | |
| Postpaid high speed internet customers | 193 | | 288 | | 422 | | 646 | | 975 | | 1,472 | | 1,960 | | 2,410 | | 646 | | 2,410 |
| Prepaid high speed internet customers | — | | — | | — | | — | | 9 | | 72 | | 162 | | 236 | | — | | 236 |
| Total high speed internet customers, end of period | 193 | | 288 | | 422 | | 646 | | 984 | | 1,544 | | 2,122 | | 2,646 | | 646 | | 2,646 |
| | | | | | | | | | | | | | | | | | | |
| | | | | | | | | | | | | | | | | | | |
| | | | | | | | | | | | | | | | | | | | | | | | | | | | | | | | | | | | | | | | | | | | | | | | | | | | | | | | | | | |
| Quarter | | Year Ended December 31, |
| (in thousands) | Q1 2021 | | Q2 2021 | | Q3 2021 | | Q4 2021 | | Q1 2022 | | Q2 2022 | | Q3 2022 | | Q4 2022 | | 2021 | | 2022 |
| High speed internet - net customer additions | | | | | | | | | | | | | | | | | | | |
| Postpaid high speed internet customers | 93 | | 95 | | 134 | | 224 | | 329 | | 497 | | 488 | | 450 | | 546 | | 1,764 |
| Prepaid high speed internet customers | — | | — | | — | | — | | 9 | | 63 | | 90 | | 74 | | — | | 236 |
| Total high speed internet net customer additions | 93 | | 95 | | 134 | | 224 | | 338 | | 560 | | 578 | | 524 | | 546 | | 2,000 |
| | | | | | | | | | | | | | | | | | | |
| | | | | | | | | | | | | | | | | | | |
| | | | | | | | | | | | | | | | | | | | | | | | | | | | | | | | | | | | | | | | | | | | | | | | | | | | | | | | | | | |
| Quarter | | Year Ended December 31, |
| (in millions, except percentages) | Q1 2021 | | Q2 2021 | | Q3 2021 | | Q4 2021 | | Q1 2022 | | Q2 2022 | | Q3 2022 | | Q4 2022 | | 2021 | | 2022 |
| Device Financing - Equipment Installment Plans | | | | | | | | | | | | | | | | | | | |
| Gross EIP financed | $ | 3,379 | | | $ | 3,348 | | | $ | 3,434 | | | $ | 5,282 | | | $ | 4,247 | | | $ | 3,580 | | | $ | 3,758 | | | $ | 4,103 | | | $ | 15,443 | | | $ | 15,688 | |
| EIP billings | 2,556 | | | 2,639 | | | 2,795 | | | 3,126 | | | 3,333 | | | 3,447 | | | 3,717 | | | 3,889 | | | 11,116 | | | 14,386 | |
| EIP receivables, net | 6,062 | | | 6,348 | | | 6,586 | | | 7,577 | | | 7,898 | | | 7,734 | | | 7,562 | | | 7,669 | | | 7,577 | | | 7,669 | |
| EIP receivables classified as prime | 57 | % | | 61 | % | | 60 | % | | 62 | % | | 61 | % | | 61 | % | | 61 | % | | 59 | % | | 62 | % | | 59 | % |
| EIP receivables classified as prime (including EIP receivables sold) | 56 | % | | 59 | % | | 57 | % | | 58 | % | | 58 | % | | 57 | % | | 58 | % | | 57 | % | | 58 | % | | 57 | % |
| | | | | | | | | | | | | | | | | | | |
| Device Financing - Leased Devices | | | | | | | | | | | | | | | | | | | |
| Lease revenues | $ | 1,041 | | | $ | 914 | | | $ | 770 | | | $ | 623 | | | $ | 487 | | | $ | 386 | | | $ | 311 | | | $ | 246 | | | $ | 3,348 | | | $ | 1,430 | |
| Leased device depreciation | 897 | | | 842 | | | 755 | | | 627 | | | 445 | | | 317 | | | 226 | | | 141 | | | 3,121 | | | 1,129 | |
| Leased devices transferred from inventory to property and equipment | 485 | | | 333 | | | 214 | | | 166 | | | 129 | | | 83 | | | 67 | | | 57 | | | 1,198 | | | 336 | |
| Returned leased devices transferred from property and equipment to inventory | (445) | | | (416) | | | (309) | | | (267) | | | (183) | | | (95) | | | (65) | | | (53) | | | (1,437) | | | (396) | |
| Leased devices included in property and equipment, net | 3,962 | | | 3,037 | | | 2,188 | | | 1,459 | | | 960 | | | 631 | | | 408 | | | 269 | | | 1,459 | | | 269 | |
| Leased devices (units) included in property and equipment, net | 12.4 | | 10.7 | | | 9.0 | | | 7.1 | | | 5.5 | | | 4.4 | | | 3.6 | | | 2.8 | | | 7.1 | | | 2.8 | |
T-Mobile US, Inc.
Supplementary Operating and Financial Data (continued)
(Unaudited)
| | | | | | | | | | | | | | | | | | | | | | | | | | | | | | | | | | | | | | | | | | | | | | | | | | | | | | | | | | | |
| Quarter | | Year Ended December 31, |
| (in millions, except percentages) | Q1 2021 | | Q2 2021 | | Q3 2021 | | Q4 2021 | | Q1 2022 | | Q2 2022 | | Q3 2022 | | Q4 2022 | | 2021 | | 2022 |
| Financial Measures | | | | | | | | | | | | | | | | | | | |
| | | | | | | | | | | | | | | | | | | |
| Service revenues | $ | 14,192 | | | $ | 14,492 | | | $ | 14,722 | | | $ | 14,963 | | | $ | 15,128 | | | $ | 15,316 | | | $ | 15,361 | | | $ | 15,518 | | | $ | 58,369 | | | $ | 61,323 | |
| | | | | | | | | | | | | | | | | | | |
| Equipment revenue | $ | 5,346 | | | $ | 5,215 | | | $ | 4,660 | | | $ | 5,506 | | | $ | 4,694 | | | $ | 4,130 | | | $ | 3,855 | | | $ | 4,451 | | | $ | 20,727 | | | $ | 17,130 | |
| Lease revenues | 1,041 | | | 914 | | | 770 | | | 623 | | | 487 | | | 386 | | | 311 | | | 246 | | | 3,348 | | | 1,430 | |
| Equipment sales | $ | 4,305 | | | $ | 4,301 | | | $ | 3,890 | | | $ | 4,883 | | | $ | 4,207 | | | $ | 3,744 | | | $ | 3,544 | | | $ | 4,205 | | | $ | 17,379 | | | $ | 15,700 | |
| | | | | | | | | | | | | | | | | | | |
| Total revenues | $ | 19,759 | | | $ | 19,950 | | | $ | 19,624 | | | $ | 20,785 | | | $ | 20,120 | | | $ | 19,701 | | | $ | 19,477 | | | $ | 20,273 | | | $ | 80,118 | | | $ | 79,571 | |
| | | | | | | | | | | | | | | | | | | |
| Net income (loss) | $ | 933 | | | $ | 978 | | | $ | 691 | | | $ | 422 | | | $ | 713 | | | $ | (108) | | | $ | 508 | | | $ | 1,477 | | | $ | 3,024 | | | $ | 2,590 | |
| Net income (loss) margin | 6.6 | % | | 6.7 | % | | 4.7 | % | | 2.8 | % | | 4.7 | % | | (0.7) | % | | 3.3 | % | | 9.5 | % | | 5.2 | % | | 4.2 | % |
| | | | | | | | | | | | | | | | | | | |
| Adjusted EBITDA | $ | 6,905 | | | $ | 6,906 | | | $ | 6,811 | | | $ | 6,302 | | | $ | 6,950 | | | $ | 7,004 | | | $ | 7,039 | | | $ | 6,828 | | | $ | 26,924 | | | $ | 27,821 | |
| Adjusted EBITDA margin | 48.7 | % | | 47.7 | % | | 46.3 | % | | 42.1 | % | | 45.9 | % | | 45.7 | % | | 45.8 | % | | 44.0 | % | | 46.1 | % | | 45.4 | % |
| Core Adjusted EBITDA | $ | 5,864 | | | $ | 5,992 | | | $ | 6,041 | | | $ | 5,679 | | | $ | 6,463 | | | $ | 6,618 | | | $ | 6,728 | | | $ | 6,582 | | | $ | 23,576 | | | $ | 26,391 | |
| Core Adjusted EBITDA margin | 41.3 | % | | 41.3 | % | | 41.0 | % | | 38.0 | % | | 42.7 | % | | 43.2 | % | | 43.8 | % | | 42.4 | % | | 40.4 | % | | 43.0 | % |
| | | | | | | | | | | | | | | | | | | |
| Cost of services | $ | 3,384 | | | $ | 3,491 | | | $ | 3,538 | | | $ | 3,521 | | | $ | 3,727 | | | $ | 4,060 | | | $ | 3,712 | | | $ | 3,167 | | | $ | 13,934 | | | $ | 14,666 | |
| Merger-related costs | 136 | | | 273 | | | 279 | | | 327 | | | 607 | | | 961 | | | 812 | | | 290 | | | 1,015 | | | 2,670 | |
| Cost of services excluding Merger-related costs | $ | 3,248 | | | $ | 3,218 | | | $ | 3,259 | | | $ | 3,194 | | | $ | 3,120 | | | $ | 3,099 | | | $ | 2,900 | | | $ | 2,877 | | | $ | 12,919 | | | $ | 11,996 | |
| | | | | | | | | | | | | | | | | | | |
| Cost of equipment sales | $ | 5,142 | | | $ | 5,453 | | | $ | 5,145 | | | $ | 6,931 | | | $ | 5,946 | | | $ | 5,108 | | | $ | 4,982 | | | $ | 5,504 | | | $ | 22,671 | | | $ | 21,540 | |
| Merger-related costs | 17 | | | 87 | | | 236 | | | 678 | | | 751 | | | 459 | | | 258 | | | 56 | | | 1,018 | | | 1,524 | |
| Cost of equipment sales excluding Merger-related costs | $ | 5,125 | | | $ | 5,366 | | | $ | 4,909 | | | $ | 6,253 | | | $ | 5,195 | | | $ | 4,649 | | | $ | 4,724 | | | $ | 5,448 | | | $ | 21,653 | | | $ | 20,016 | |
| | | | | | | | | | | | | | | | | | | |
| Selling, general and administrative | $ | 4,805 | | | $ | 4,823 | | | $ | 5,212 | | | $ | 5,398 | | | $ | 5,056 | | | $ | 5,856 | | | $ | 5,118 | | | $ | 5,577 | | | $ | 20,238 | | | $ | 21,607 | |
| Merger-related costs | 145 | | | 251 | | | 440 | | | 238 | | | 55 | | | 248 | | | 226 | | | 246 | | | 1,074 | | | 775 | |
| | | | | | | | | | | | | | | | | | | |
| Selling, general and administrative excluding Merger-related costs | $ | 4,660 | | | $ | 4,572 | | | $ | 4,772 | | | $ | 5,160 | | | $ | 5,001 | | | $ | 5,608 | | | $ | 4,892 | | | $ | 5,331 | | | $ | 19,164 | | | $ | 20,832 | |
| | | | | | | | | | | | | | | | | | | |
| Total bad debt expense and losses from sales of receivables | $ | 64 | | | $ | 60 | | | $ | 109 | | | $ | 234 | | | $ | 256 | | | $ | 373 | | | $ | 300 | | | $ | 311 | | | $ | 467 | | | $ | 1,240 | |
| Bad debt and losses from sales of receivables as a percentage of Total revenues | 0.32 | % | | 0.30 | % | | 0.56 | % | | 1.13 | % | | 1.27 | % | | 1.89 | % | | 1.54 | % | | 1.54 | % | | 0.58 | % | | 1.56 | % |
| | | | | | | | | | | | | | | | | | | |
| Cash purchases of property and equipment including capitalized interest | $ | 3,183 | | | $ | 3,270 | | | $ | 2,944 | | | $ | 2,929 | | | $ | 3,381 | | | $ | 3,572 | | | $ | 3,634 | | | $ | 3,383 | | | $ | 12,326 | | | $ | 13,970 | |
| Capitalized interest | 84 | | | 57 | | | 46 | | | 23 | | | 15 | | | 13 | | | 16 | | | 17 | | | 210 | | | 61 | |
| | | | | | | | | | | | | | | | | | | |
| Net cash proceeds from securitization | 22 | | | 18 | | | (2) | | | 1 | | | (3) | | | (10) | | | (18) | | | (26) | | | 39 | | | (57) | |
| | | | | | | | | | | | | | | | | | | |
| Operating Measures | | | | | | | | | | | | | | | | | | | |
| Postpaid ARPA | $ | 132.91 | | | $ | 133.55 | | | $ | 134.54 | | | $ | 135.04 | | | $ | 136.53 | | | $ | 137.92 | | | $ | 137.49 | | | $ | 137.78 | | | $ | 134.03 | | | $ | 137.43 | |
| | | | | | | | | | | | | | | | | | | |
| | | | | | | | | | | | | | | | | | | |
| | | | | | | | | | | | | | | | | | | |
| | | | | | | | | | | | | | | | | | | |
| | | | | | | | | | | | | | | | | | | |
| | | | | | | | | | | | | | | | | | | |
| | | | | | | | | | | | | | | | | | | |
| Postpaid phone ARPU | 47.30 | | | 47.61 | | | 48.06 | | | 48.03 | | | 48.41 | | | 48.96 | | | 48.89 | | | 48.86 | | | 47.75 | | | 48.78 | |
| | | | | | | | | | | | | | | | | | | |
| | | | | | | | | | | | | | | | | | | |
| | | | | | | | | | | | | | | | | | | |
| | | | | | | | | | | | | | | | | | | |
| | | | | | | | | | | | | | | | | | | |
| Prepaid ARPU | 37.81 | | | 38.53 | | | 39.49 | | | 39.32 | | | 39.19 | | | 38.71 | | | 38.86 | | | 38.29 | | | 38.79 | | | 38.76 | |
T-Mobile US, Inc.
Reconciliation of Non-GAAP Financial Measures to GAAP Financial Measures
(Unaudited)
This Investor Factbook includes non-GAAP financial measures. The non-GAAP financial measures should be considered in addition to, but not as a substitute for, the information provided in accordance with GAAP. Reconciliations for the non-GAAP financial measures to the most directly comparable GAAP financial measures are provided below. T-Mobile is not able to forecast Net income on a forward-looking basis without unreasonable efforts due to the high variability and difficulty in predicting certain items that affect GAAP net income including, but not limited to, Income tax expense and Interest expense. Adjusted EBITDA and Core Adjusted EBITDA should not be used to predict Net income, as the difference between either of these measures and Net income is variable.
Adjusted EBITDA and Core Adjusted EBITDA are reconciled to Net income (loss) as follows:
| | | | | | | | | | | | | | | | | | | | | | | | | | | | | | | | | | | | | | | | | | | | | | | | | | | | | | | | | | | |
| Quarter | | Year Ended December 31, |
| (in millions) | Q1 2021 | | Q2 2021 | | Q3 2021 | | Q4 2021 | | Q1 2022 | | Q2 2022 | | Q3 2022 | | Q4 2022 | | 2021 | | 2022 |
| Net income (loss) | $ | 933 | | | $ | 978 | | | $ | 691 | | | $ | 422 | | | $ | 713 | | | $ | (108) | | | $ | 508 | | | $ | 1,477 | | | $ | 3,024 | | | $ | 2,590 | |
| Adjustments: | | | | | | | | | | | | | | | | | | | |
| | | | | | | | | | | | | | | | | | | |
| | | | | | | | | | | | | | | | | | | |
| Interest expense, net | 835 | | | 850 | | | 836 | | | 821 | | | 864 | | | 851 | | | 827 | | | 822 | | | 3,342 | | | 3,364 | |
| | | | | | | | | | | | | | | | | | | |
| | | | | | | | | | | | | | | | | | | |
| Other expense (income), net | 125 | | | 1 | | | 60 | | | 13 | | | 11 | | | 21 | | | 3 | | | (2) | | | 199 | | | 33 | |
| Income tax expense (benefit) | 246 | | | 277 | | | (3) | | | (193) | | | 218 | | | (55) | | | (57) | | | 450 | | | 327 | | | 556 | |
| | | | | | | | | | | | | | | | | | | |
| Operating income | 2,139 | | | 2,106 | | | 1,584 | | | 1,063 | | | 1,806 | | | 709 | | | 1,281 | | | 2,747 | | | 6,892 | | | 6,543 | |
| Depreciation and amortization | 4,289 | | | 4,077 | | | 4,145 | | | 3,872 | | | 3,585 | | | 3,491 | | | 3,313 | | | 3,262 | | | 16,383 | | | 13,651 | |
| | | | | | | | | | | | | | | | | | | |
Stock-based compensation (1) | 130 | | | 129 | | | 127 | | | 135 | | | 136 | | | 149 | | | 145 | | | 146 | | | 521 | | | 576 | |
| Merger-related costs | 298 | | | 611 | | | 955 | | | 1,243 | | | 1,413 | | | 1,668 | | | 1,296 | | | 592 | | | 3,107 | | | 4,969 | |
| | | | | | | | | | | | | | | | | | | |
| Impairment expense | — | | | — | | | — | | | — | | | — | | | 477 | | | — | | | — | | | — | | | 477 | |
Legal-related expenses (recoveries), net (2) | — | | | — | | | — | | | — | | | — | | | 400 | | | (19) | | | 10 | | | — | | | 391 | |
| Loss on disposal group held for sale | — | | | — | | | — | | | — | | | — | | | — | | | 1,071 | | | 16 | | | — | | | 1,087 | |
Other, net (3) | 49 | | | (17) | | | — | | | (11) | | | 10 | | | 110 | | | (48) | | | 55 | | | 21 | | | 127 | |
| | | | | | | | | | | | | | | | | | | |
| Adjusted EBITDA | 6,905 | | | 6,906 | | | 6,811 | | | 6,302 | | | 6,950 | | | 7,004 | | | 7,039 | | | 6,828 | | | 26,924 | | | 27,821 | |
| Lease revenues | (1,041) | | | (914) | | | (770) | | | (623) | | | (487) | | | (386) | | | (311) | | | (246) | | | (3,348) | | | (1,430) | |
| Core Adjusted EBITDA | $ | 5,864 | | | $ | 5,992 | | | $ | 6,041 | | | $ | 5,679 | | | $ | 6,463 | | | $ | 6,618 | | | $ | 6,728 | | | $ | 6,582 | | | $ | 23,576 | | | $ | 26,391 | |
| | | | | | | | | | | | | | | | | | | |
| | | | | | | | | | | | | | | | | | | |
| | | | | | | | | | | | | | | | | | | |
| | | | | | | | | | | | | | | | | | | |
| | | | | | | | | | | | | | | | | | | |
| | | | | | | | | | | | | | | | | | | |
| | | | | | | | | | | | | | | | | | | |
| | | | | | | | | | | |
| | | | | | | | | | | | | | | | | | | |
| | | | | | | | | | | | | | | | | | | |
| | | | | | | | | | | | | | | | | | | |
| | | | | | | | | | | | | | | | | | | |
| | | | | | | | | | | | | | | | | | | |
| | | | | | | | | | | | | | | | | | | |
| | | | | | | | | | | | | | | | | | | |
| | | | | | | | | | | | | | | | | | | |
| | | | | | | | | | | | | | | | | | | |
| | | | | | | | | | | | | | | | | | | |
| | | | | | | | | | | | | | | | | | | |
| | | | | | | | | | | | | | | | | | | |
| | | | | | | | | | | | | | | | | | | |
| | | | | | | | | | | | | | | | | | | |
| | | | | | | | | | | | | | | | | | | |
| | | | | | | | | | | | | | | | | | | |
| | | | | | | | | | | | | | | | | | | |
| | | | | | | | | | | | | | | | | | | |
| | | | | | | | | | | | | | | | | | | |
| | | | | | | | | | | | | | | | | | | |
| | | | | | | | | | | | | | | | | | | |
| | | | | | | | | | | | | | | | | | | |
| | | | | | | | | | | | | | | | | | | |
| | | | | | | | | | | | | | | | | | | |
| | | | | | | | | | | | | | | | | | | |
| | | | | | | | | | | | | | | | | | | |
| | | | | | | | | | | | | | | | | | | |
| | | | | | | | | | | | | | | | | | | |
| | | | | | | | | | | | | | | | | | | |
| | | | | | | | | | | | | | | | | | | |
| | | | | | | | | | | | | | | | | | | |
(1)Stock-based compensation includes payroll tax impacts and may not agree to stock-based compensation expense in the Consolidated Financial Statements. Additionally, certain stock-based compensation expenses associated with the Merger have been included in Merger-related costs.
(2)Legal-related expenses (recoveries), net, consists of the settlement of certain litigation associated with the August 2021 cyberattack and is presented net of insurance recoveries.
(3)Other, net, primarily consists of certain severance, restructuring and other expenses and income, including gains from the sale of IP addresses, not directly attributable to the Merger which are not reflective of T-Mobile’s core business activities (“special items”), and are, therefore, excluded from Adjusted EBITDA and Core Adjusted EBITDA.
.
T-Mobile US, Inc.
Reconciliation of Non-GAAP Financial Measures to GAAP Financial Measures (continued)
(Unaudited)
Net debt (excluding tower obligations) to the LTM Net income, LTM Adjusted EBITDA and LTM Core Adjusted EBITDA ratios are calculated as follows:
| | | | | | | | | | | | | | | | | | | | | | | | | | | | | | | | | | | | | | | | | | | | | | | |
| (in millions, except net debt ratios) | Mar 31,
2021 | | Jun 30,
2021 | | Sep 30,
2021 | | Dec 31,
2021 | | Mar 31,
2022 | | Jun 30,
2022 | | Sep 30,
2022 | | Dec 31,
2022 |
| | | | | | | | | | | | | | | |
| Short-term debt | $ | 4,423 | | | $ | 4,648 | | | $ | 2,096 | | | $ | 3,378 | | | $ | 2,865 | | | $ | 2,942 | | | $ | 7,398 | | | $ | 5,164 | |
| Short-term debt to affiliates | — | | | 2,235 | | | 2,240 | | | 2,245 | | | 1,250 | | | — | | | — | | | — | |
| Short-term financing lease liabilities | 1,013 | | | 1,045 | | | 1,154 | | | 1,120 | | | 1,121 | | | 1,220 | | | 1,239 | | | 1,161 | |
| Long-term debt | 66,395 | | | 65,897 | | | 66,645 | | | 67,076 | | | 66,861 | | | 66,552 | | | 64,834 | | | 65,301 | |
| Long-term debt to affiliates | 4,721 | | | 2,490 | | | 1,494 | | | 1,494 | | | 1,494 | | | 1,495 | | | 1,495 | | | 1,495 | |
| Financing lease liabilities | 1,316 | | | 1,376 | | | 1,587 | | | 1,455 | | | 1,447 | | | 1,597 | | | 1,590 | | | 1,370 | |
| Less: Cash and cash equivalents | (6,677) | | | (7,793) | | | (4,055) | | | (6,631) | | | (3,245) | | | (3,151) | | | (6,888) | | | (4,507) | |
| | | | | | | | | | | | | | | |
| Net debt (excluding tower obligations) | $ | 71,191 | | | $ | 69,898 | | | $ | 71,161 | | | $ | 70,137 | | | $ | 71,793 | | | $ | 70,655 | | | $ | 69,668 | | | $ | 69,984 | |
| Divided by: Last twelve months Net income | $ | 3,046 | | | $ | 3,914 | | | $ | 3,352 | | | $ | 3,024 | | | $ | 2,804 | | | $ | 1,718 | | | $ | 1,535 | | | $ | 2,590 | |
| Net debt (excluding tower obligations) to LTM Net income Ratio | 23.4 | | | 17.9 | | | 21.2 | | | 23.2 | | | 25.6 | | | 41.1 | | | 45.4 | | | 27.0 | |
| | | | | | | | | | | | | | | |
| | | | | | | | | | | | | | | |
| | | | | | | | | | | | | | | |
| | | | | | | | | | | | | | | |
| Divided by: Last twelve months Adjusted EBITDA | $ | 27,797 | | | $ | 27,686 | | | $ | 27,368 | | | $ | 26,924 | | | $ | 26,969 | | | $ | 27,067 | | | $ | 27,295 | | | $ | 27,821 | |
| Net debt (excluding tower obligations) to LTM Adjusted EBITDA Ratio | 2.6 | | | 2.5 | | | 2.6 | | | 2.6 | | | 2.7 | | | 2.6 | | | 2.6 | | | 2.5 | |
| Divided by: Last twelve months Core Adjusted EBITDA | $ | 22,740 | | | $ | 23,136 | | | $ | 23,398 | | | $ | 23,576 | | | $ | 24,175 | | | $ | 24,801 | | | $ | 25,488 | | | $ | 26,391 | |
| Net debt (excluding tower obligations) to LTM Core Adjusted EBITDA Ratio | 3.1 | | | 3.0 | | | 3.0 | | | 3.0 | | | 3.0 | | | 2.8 | | | 2.7 | | | 2.7 | |
| | | | | | | | | | | | | | | |
| | | | | | | | | | | | | | | |
| | | | | | | | | | | | | | | |
| | | | | | | | | | | | | | | |
| | | | | | | | | | | | | | | |
| | | | | | | | | | | | | | | |
| | | | | | | | | | | | | | | |
| | | | | | | | | | | | | | | |
| | | | | | | | | | | | | | | |
| | | | | | | | | | | | | | | |
| | | | | | | | | | | | | | | |
| | | | | | | | | | | | | | | |
| | | | | | | | | | | | | | | |
Free Cash Flow is calculated as follows:
| | | | | | | | | | | | | | | | | | | | | | | | | | | | | | | | | | | | | | | | | | | | | | | | | | | | | | | | | | | |
| Quarter | | Year Ended December 31, |
| (in millions) | Q1 2021 | | Q2 2021 | | Q3 2021 | | Q4 2021 | | Q1 2022 | | Q2 2022 | | Q3 2022 | | Q4 2022 | | 2021 | | 2022 |
| | | | | | | | | | | | | | | | | | | |
| Net cash provided by operating activities | $ | 3,661 | | | $ | 3,779 | | | $ | 3,477 | | | $ | 3,000 | | | $ | 3,845 | | | $ | 4,209 | | | $ | 4,391 | | | $ | 4,336 | | | $ | 13,917 | | | $ | 16,781 | |
| Cash purchases of property and equipment, including capitalized interest | (3,183) | | | (3,270) | | | (2,944) | | | (2,929) | | | (3,381) | | | (3,572) | | | (3,634) | | | (3,383) | | | (12,326) | | | (13,970) | |
| Proceeds from sales of tower sites | — | | | 31 | | | — | | | 9 | | | — | | | — | | | — | | | 9 | | | 40 | | | 9 | |
| Proceeds related to beneficial interests in securitization transactions | 891 | | | 1,137 | | | 1,071 | | | 1,032 | | | 1,185 | | | 1,121 | | | 1,308 | | | 1,222 | | | 4,131 | | | 4,836 | |
| | | | | | | | | | | | | | | | | | | |
| Cash payments for debt prepayment or debt extinguishment costs | (65) | | | (6) | | | (45) | | | — | | | — | | | — | | | — | | | — | | | (116) | | | — | |
| | | | | | | | | | | | | | | | | | | |
| Free Cash Flow | $ | 1,304 | | | $ | 1,671 | | | $ | 1,559 | | | $ | 1,112 | | | $ | 1,649 | | | $ | 1,758 | | | $ | 2,065 | | | $ | 2,184 | | | $ | 5,646 | | | $ | 7,656 | |
| | | | | | | | | | | | | | | | | | | |
| | | | | | | | | | | | | | | | | | | |
| | | | | | | | | | | | | | | | | | | |
| | | | | | | | | | | | | | | | | | | |
| | | | | | | | | | | | | | | | | | | |
| | | | | | | | | | | | | | | | | | | |
| | | | | | | | | | | | | | | | | | | |
| | | | | | | | | | | | | | | | | | | |
| | | | | | | | | | | | | | | | | | | |
| | | | | | | | | | | | | | | | | | | |
| | | | | | | | | | | | | | | | | | | |
| | | | | | | | | | | | | | | | | | | |
| | | | | | | | | | | | | | | | | | | |
| | | | | | | | | | | | | | | | | | | |
| | | | | | | | | | | | | | | | | | | |
| | | | | | | | | | | | | | | | | | | |
| | | | | | | | | | | | | | | | | | | |
| | | | | | | | | | | | | | | | | | | |
| | | | | | | | | | | | | | | | | | | |
| | | | | | | | | | | | | | | | | | | |
| | | | | | | | | | | | | | | | | | | |
| | | | | | | | | | | | | | | | | | | |
| | | | | | | | | | | | | | | | | | | |
| | | | | | | | | | | | | | | | | | | |
| | | | | | | | | | | | | | | | | | | |
| | | | | | | | | | | | | | | | | | | |
| | | | | | | | | | | | | | | | | | | |
| | | | | | | | | | | | | | | | | | | |
| | | | | | | | | | | | | | | | | | | |
| | | | | | | | | | | | | | | | | | | |
T-Mobile US, Inc.
Reconciliation of Non-GAAP Financial Measures to GAAP Financial Measures (continued)
(Unaudited)
The current guidance range for Free Cash Flow is calculated as follows:
| | | | | | | | | | | |
| FY 2023 |
| (in millions) | Guidance Range |
| | | |
| Net cash provided by operating activities | $ | 17,800 | | | $ | 18,300 | |
| | | |
| Cash purchases of property and equipment, including capitalized interest | (9,400) | | | (9,700) | |
Proceeds related to beneficial interests in securitization transactions (1) | 4,700 | | | 5,000 | |
| | | |
| | | |
| Free Cash Flow | $ | 13,100 | | | $ | 13,600 | |
| | | |
| | | |
| | | |
| | | |
| | | |
| | | |
(1)Free Cash Flow guidance does not assume any material net cash inflows from securitization in 2023.
Definitions of Terms
Operating and financial measures are utilized by T-Mobile’s management to evaluate its operating performance and, in certain cases, its ability to meet liquidity requirements. Although companies in the wireless industry may not define measures in precisely the same way, T-Mobile believes the measures facilitate key operating performance comparisons with other companies in the wireless industry to provide management, investors and analysts with useful information to assess and evaluate past performance and assist in forecasting future performance.
1.Account - A postpaid account is generally defined as a billing account number that generates revenue. Postpaid accounts generally consist of customers that are qualified for postpaid service utilizing phones, High Speed Internet, tablets, wearables, DIGITS or other connected devices, where they generally pay after receiving service.
2.Customer - SIM number with a unique T-Mobile mobile identifier which is associated with an account that generates revenue. Customers generally are qualified either for postpaid service, where they generally pay after incurring service, or prepaid service, where they generally pay in advance.
3.Churn - The number of customers whose service was disconnected as a percentage of the average number of customers during the specified period further divided by the number of months in the period. The number of customers whose service was disconnected is presented net of customers that subsequently have their service restored within a certain period of time and excludes customers who received service for less than a certain minimum period of time.
4.Customers per account - The number of postpaid customers as of the end of the period divided by the number of postpaid accounts as of the end of the period.
5.Postpaid Average Revenue Per Account (Postpaid ARPA) - Average monthly postpaid service revenue earned per account. Postpaid service revenues for the specified period divided by the average number of postpaid accounts during the period, further divided by the number of months in the period.
Average Revenue Per User (ARPU) - Average monthly service revenue earned per customer. Service revenues for the specified period divided by the average number of customers during the period, further divided by the number of months in the period.
Postpaid phone ARPU excludes postpaid other customers and related revenues.
Service revenues - Postpaid, including handset insurance, prepaid, wholesale and other service revenues.
6.Cost of services - Costs directly attributable to providing wireless service through the operation of T-Mobile’s network, including direct switch and cell site costs, such as rent, network access and transport costs, utilities, maintenance, associated labor costs, long distance costs, regulatory program costs, roaming fees paid to other carriers and data content costs.
Cost of equipment sales - Costs of devices and accessories sold to customers and dealers, device costs to fulfill insurance and warranty claims, write-downs of inventory related to shrinkage and obsolescence, and shipping and handling costs.
Selling, general and administrative expenses - Costs not directly attributable to providing wireless service for the operation of sales, customer care and corporate activities. These include all commissions paid to dealers and retail employees for activations and upgrades, labor and facilities costs associated with retail sales force and administrative space, marketing and promotional costs, customer support and billing, bad debt expense and administrative support activities.
7.Net income margin - Net income divided by service revenues.
8.Adjusted EBITDA and Core Adjusted EBITDA - Adjusted EBITDA represents earnings before Interest expense, net of Interest income, Income tax expense, Depreciation and amortization expense, stock-based compensation and certain income and expenses not reflective of T-Mobile’s ongoing operating performance. Core Adjusted EBITDA represents Adjusted EBITDA less lease revenues. Core Adjusted EBITDA and Adjusted EBITDA are non-GAAP financial measures utilized by T-Mobile’s management to monitor the financial performance of our operations. T-Mobile uses Core Adjusted EBITDA and Adjusted EBITDA as benchmarks to evaluate T-Mobile’s operating performance in comparison to its competitors. T-Mobile also uses Core Adjusted EBITDA internally as a measure to evaluate and compensate its personnel and management for their performance. Management believes analysts and investors use Core Adjusted EBITDA and Adjusted EBITDA as supplemental measures to evaluate overall operating performance and to facilitate comparisons with other wireless communications companies because they are indicative of T-Mobile’s ongoing operating performance and trends by excluding the impact of Interest expense from financing, non-cash depreciation and amortization from capital investments, stock-based compensation, Merger-related costs, including network decommissioning costs, impairment expense, losses on disposal groups held for sale and certain legal-related recoveries and expenses, as well as other certain special income and expenses which are not reflective of our core business activities. Management believes analysts and investors use Core Adjusted EBITDA because it normalizes for the transition in the company’s device financing strategy, by excluding the impact of lease revenues from Adjusted EBITDA, to align with the related depreciation expense on leased devices, which is excluded from the definition of Adjusted EBITDA. Core Adjusted EBITDA and Adjusted EBITDA have limitations as analytical tools and should not be considered in isolation or as a substitute for Net income or any other measure of financial performance reported in accordance with U.S. Generally Accepted Accounting Principles (“GAAP”).
9.Adjusted EBITDA margin and Core Adjusted EBITDA margin - Adjusted EBITDA margin is calculated as Adjusted EBITDA divided by service revenues. Core Adjusted EBITDA margin is calculated as Core Adjusted EBITDA divided by service revenues.
10.Free Cash Flow - Net cash provided by operating activities less cash purchases of property and equipment, including proceeds from sales of tower sites and proceeds related to beneficial interests in securitization transactions and less cash payments for debt prepayment or debt extinguishment costs. Free Cash Flow is utilized by T-Mobile’s management, investors, and analysts to evaluate cash available to pay debt, repurchase shares and provide further investment in the business.
11.Net debt - Short-term debt, short-term debt to affiliates, long-term debt (excluding tower obligations), and long-term debt to affiliates, short-term financing lease liabilities and financing lease liabilities, less cash and cash equivalents.
12.Merger-related costs include:
•Integration costs to achieve efficiencies in network, retail, information technology and back office operations, migrate customers to the T-Mobile network and billing systems and the impact of legal matters assumed as part of the Merger;
•Restructuring costs, including severance, store rationalization and network decommissioning; and
•Transaction costs, including legal and professional services related to the completion of the Merger and the acquisitions of affiliates.
Cautionary Statement Regarding Forward-Looking Statements
This communication includes forward-looking statements within the meaning of the Private Securities Litigation Reform Act of 1995. All statements other than statements of historical fact, including information concerning T-Mobile US, Inc.’s future results of operations, are forward-looking statements. These forward-looking statements are generally identified by the words “anticipate,” “believe,” “estimate,” “expect,” “intend,” “may,” “could” or similar expressions. Forward-looking statements are based on current expectations and assumptions, which are subject to risks and uncertainties and may cause actual results to differ materially from the forward-looking statements. Important factors that could affect future results and cause those results to differ materially from those expressed in the forward-looking statements include, among others, the following: competition, industry consolidation and changes in the market for wireless communication services and other forms of connectivity; criminal cyberattacks, disruption, data loss or other security breaches; our inability to take advantage of technological developments on a timely basis; our inability to retain or motivate key personnel, hire qualified personnel or maintain our corporate culture; system failures and business disruptions, allowing for unauthorized use of or interference with our network and other systems; the scarcity and cost of additional wireless spectrum, and regulations relating to spectrum use; the difficulties in maintaining multiple billing systems following the Merger (as defined below) and any unanticipated difficulties, disruption, or significant delays in our long-term strategy to convert Sprint’s legacy customers onto T-Mobile’s billing platforms; the impacts of the actions we have taken and conditions we have agreed to in connection with the regulatory proceedings and approvals of the Transactions (as defined below), including the acquisition by DISH Network Corporation (“DISH”) of the prepaid wireless business operated under the Boost Mobile and Sprint prepaid brands (excluding the Assurance brand Lifeline customers and the prepaid wireless customers of Shenandoah Personal Communications Company LLC (“Shentel”) and Swiftel Communications, Inc.), including customer accounts, inventory, contracts, intellectual property and certain other specified assets, and the assumption of certain related liabilities (collectively, the “Prepaid Transaction”), the complaint and proposed final judgment agreed to by us, Deutsche Telekom AG (“DT”), Sprint Corporation, now known as Sprint LLC (“Sprint”), SoftBank Group Corp. (“SoftBank”) and DISH with the U.S. District Court for the District of Columbia, which was approved by the Court on April 1, 2020, the proposed commitments filed with the Secretary of the Federal Communications Commission (“FCC”), which we announced on May 20, 2019, certain national security commitments and undertakings, and any other commitments or undertakings entered into, including but not limited to, those we have made to certain states and nongovernmental organizations (collectively, the “Government Commitments”), and the challenges in satisfying the Government Commitments in the required time frames and the significant cumulative costs incurred in tracking and monitoring compliance over multiple years; adverse economic, political or market conditions in the U.S. and international markets, including changes resulting from increases in inflation or interest rates, supply chain disruption, impacts of current geopolitical instability caused by the war in Ukraine; our inability to manage the ongoing commercial and transition services arrangements entered into in connection with the Prepaid Transaction, and known or unknown liabilities arising in connection therewith; the timing and effects of any future acquisition, divestiture, investment, or merger involving us; any disruption or failure of our third parties (including key suppliers) to provide products or services for the operation of our business; our inability to fully realize the synergy benefits from the merger (the "Merger") with Sprint, pursuant to the Business Combination Agreement with Sprint and the other parties named therein (as amended, the "Business Combination Agreement" and the other transactions contemplated by the Business Combination Agreement (collectively, the "Transactions") in the expected time frame; our substantial level of indebtedness and our inability to service our debt obligations in accordance with their terms or to comply with the restrictive covenants contained therein; changes in the credit market conditions, credit rating downgrades or an inability to access debt markets; restrictive covenants including the agreements governing our indebtedness and other financings; the risk of future material weaknesses we may identify, or any other failure by us to maintain effective internal controls, and the resulting significant costs and reputational damage; any changes in regulations or in the regulatory framework under which we operate; laws and regulations relating to the handling of privacy and data protection; unfavorable outcomes of and increased costs from existing or future regulatory or legal proceedings our offering of regulated financial services products and exposure to a wide variety of state and federal regulations; new or amended tax laws or regulations or administrative interpretations and judicial decisions affecting the scope or application of tax laws or regulations; our wireless licenses, including those controlled through leasing agreements, are subject to renewal and may be revoked; our exclusive forum provision as provided in our Certificate of Incorporation; interests of DT, our controlling stockholder, that may differ from the interests of other stockholders; future sales of our common stock by DT and SoftBank and our inability to attract additional equity financing outside the United States due to foreign ownership limitations by the FCC; our 2022 Stock Repurchase Program may not be fully consummated, our share repurchase program may not enhance long-term stockholder value; and other risks as disclosed in our most recent annual report on Form 10-K, 10-Q and other filings with the Securities and Exchange Commission. Given these risks and uncertainties, readers are cautioned not to place undue reliance on such forward- looking statements. We undertake no obligation to revise or publicly release the results of any revision to these forward-looking statements, except as required by law.
About T-Mobile US, Inc.
T-Mobile US, Inc. (NASDAQ: TMUS) is America’s supercharged Un-carrier, delivering an advanced 4G LTE and transformative nationwide 5G network that will offer reliable connectivity for all. T-Mobile’s customers benefit from its unmatched combination of value and quality, unwavering obsession with offering them the best possible service experience and undisputable drive for disruption that creates competition and innovation in wireless and beyond. Based in Bellevue, Wash., T-Mobile provides services through its subsidiaries and operates its flagship brands, T-Mobile and Metro by T-Mobile. For more information please visit: http://www.t-mobile.com.