UNITED STATES
SECURITIES AND EXCHANGE COMMISSION
Washington, D.C. 20549
FORM N-CSR
CERTIFIED SHAREHOLDER REPORT OF REGISTERED
MANAGEMENT INVESTMENT COMPANIES
Investment Company Act file number | 811-21533 | |||||||
| ||||||||
Western Asset Inflation Management Fund Inc. | ||||||||
(Exact name of registrant as specified in charter) | ||||||||
| ||||||||
620 Eighth Avenue, 49th Floor, New York, NY |
| 10018 | ||||||
(Address of principal executive offices) |
| (Zip code) | ||||||
| ||||||||
Robert I. Frenkel, Esq. Legg Mason & Co., LLC 100 First Stamford Place Stamford, CT 06902 | ||||||||
(Name and address of agent for service) | ||||||||
| ||||||||
Registrant’s telephone number, including area code: | (888)777-0102 |
| ||||||
| ||||||||
Date of fiscal year end: | December 31 |
| ||||||
| ||||||||
Date of reporting period: | June 30, 2012 |
| ||||||
ITEM 1. REPORT TO STOCKHOLDERS.
The Semi-Annual Report to Stockholders is filed herewith.
June 30, 2012 |
|
|

Semi-Annual Report
Western Asset Inflation Management Fund Inc.
(IMF)
|
|
| INVESTMENT PRODUCTS: NOT FDIC INSURED · NO BANK GUARANTEE · MAY LOSE VALUE |
|
|
|
| Western Asset Inflation Management Fund Inc. |
|
|
Fund objectives
The Fund’s primary investment objective is total return. Current income is a secondary investment objective.
What’s inside
Letter from the chairman |
| II |
|
|
|
Investment commentary |
| III |
|
|
|
Fund at a glance |
| 1 |
|
|
|
Spread duration |
| 2 |
|
|
|
Effective duration |
| 3 |
|
|
|
Schedule of investments |
| 4 |
|
|
|
Statement of assets and liabilities |
| 8 |
|
|
|
Statement of operations |
| 9 |
|
|
|
Statements of changes in net assets |
| 10 |
|
|
|
Financial highlights |
| 11 |
|
|
|
Notes to financial statements |
| 12 |
|
|
|
Additional shareholder information |
| 26 |
|
|
|
Dividend reinvestment plan |
| 27 |
Letter from the chairman
|
|

Dear Shareholder,
We are pleased to provide the semi-annual report of Western Asset Inflation Management Fund Inc. for the six-month reporting period ended June 30, 2012. Please read on for Fund performance information and a detailed look at prevailing economic and market conditions during the Fund’s reporting period.
As always, we remain committed to providing you with excellent service and a full spectrum of investment choices. We also remain committed to supplementing the support you receive from your financial advisor. One way we accomplish this is through our website, www.lmcef.com. Here you can gain immediate access to market and investment information, including:
· Fund prices and performance,
· Market insights and commentaries from our portfolio managers, and
· A host of educational resources.
We look forward to helping you meet your financial goals.
Sincerely,

R. Jay Gerken, CFA
Chairman, President and Chief Executive Officer
July 27, 2012
|
| Western Asset Inflation Management Fund Inc. |
|
Investment commentary
Economic review
The U.S. economy continued to grow over the six months ended June 30, 2012, albeit at an uneven pace. Looking back, U.S. gross domestic product (“GDP”)i growth, as reported by the U.S. Department of Commerce, was 4.1% in the fourth quarter of 2011. Economic growth in the U.S. then decelerated, as the Commerce Department reported that first quarter 2012 GDP growth was 2.0%. The preliminary estimate for GDP growth in the second quarter was 1.5%. Moderating growth was partially due to weaker consumer spending, which rose 1.5% in the second quarter, versus 2.4% during the first three months of the year.
Two factors constraining economic growth were the weak job market and continued troubles in the housing market. While there was some improvement during the reporting period, unemployment remained elevated. When the reporting period began, unemployment, as reported by the U.S. Department of Labor, was 8.5%. Unemployment then generally declined over the next four months and was 8.1% in April 2012, the lowest rate since January 2009. However, the unemployment rate then moved up to 8.2% in May and was unchanged in June. Within the housing market, sales are still a bit soft, though home prices appear to be firming. According to the National Association of Realtors (“NAR”), existing-home sales fluctuated throughout the period. Existing-home sales fell 5.4% on a seasonally adjusted basis in June 2012 versus the previous month. However, the NAR reported that the median existing-home price for all housing types was $189,400 in June 2012, up 7.9% from June 2011. This marked the fourth consecutive month that home prices rose from a year earlier, the first such occurrence since February through May 2006. In addition, the inventory of unsold homes fell 3.2% in June versus the previous month.
The manufacturing sector, a relative pillar of strength since the end of the Great Recession, weakened during the reporting period. Based on the Institute for Supply Management’s PMI (“PMI”)ii, in December 2011 it had a reading of 53.9 (a reading below 50 indicates a contraction, whereas a reading above 50 indicates an expansion). Activity in the manufacturing sector fluctuated during the first half of the period and was 54.8 in April, its highest reading since June 2011. The PMI then dipped to 53.5 in May 2012 and fell to 49.7 in June. The latter represented the first contraction in the manufacturing sector since July 2009. In addition, whereas thirteen of the eighteen industries in the PMI grew in May, only seven expanded in June.
|
| Western Asset Inflation Management Fund Inc. |
|
|
Investment commentary (cont’d)
Market review
Q. Did Treasury yields trend higher or lower during the six months ended June 30, 2012?
A. Both short- and long-term Treasury yields fluctuated during the reporting period. When the period began, two- and ten-year Treasury yields were 0.25% and 1.89%, respectively. With the economy initially gathering some momentum, Treasury yields moved higher during the first half of the period. Two-year Treasury yields rose as high as 0.41% on March 20, 2012 and ten-year Treasuries peaked at 2.39% around the same time. Yields then fell in late March, as well as in April, May and early June, given renewed fears over the European sovereign debt crisis. On June 1, 2012, ten-year Treasuries closed at an all-time low of 1.47%. Yields then moved higher as the month progressed due to some positive developments in Europe and hopes for additional Federal Reserve Board (“Fed”)iii actions to stimulate the economy. When the reporting period ended on June 30, 2012, two-year Treasury yields were 0.33% and ten-year Treasury yields were 1.67%.
Q. How did the Fed respond to the economic environment?
A. The Fed took a number of actions as it sought to meet its dual mandate of fostering maximum employment and price stability. Looking back, in September 2011, the Fed announced its intention to purchase $400 billion of longer-term Treasury securities and to sell an equal amount of shorter-term Treasury securities by June 2012 (often referred to as “Operation Twist”). In January 2012, the Fed extended the period it expects to keep the federal funds rateiv at a historically low range between zero and 0.25%, saying “economic conditions – including low rates of resource utilization and a subdued outlook for inflation over the medium run – are likely to warrant exceptionally low levels for the federal funds rate at least through late 2014.” In June, the Fed announced that it would extend Operation Twist until the end of 2012 and that it was ���prepared to take further action as appropriate to promote a stronger economic recovery and sustained improvement in labor market conditions in a context of price stability.”
Q. What was the inflationary environment during the reporting period?
A. Inflation was well-contained during the reporting period. For the six months ended June 30, 2012, the seasonally unadjusted rate of inflation, as measured by the Consumer Price Index for All Urban Consumers (“CPI-U”)v, was 1.69%. The CPI-U less food and energy was 1.38% over the same time frame. Inflation-protected securities generated solid results during the six months ended June 30, 2012, with the Barclays U.S. TIPS Indexvi returning 4.04%.
Q. What factors impacted the spread sectors (non-Treasuries) during the reporting period?
A. The spread sectors experienced periods of volatility during the period. Risk appetite was often robust over the first half of the period, due to some better-than-expected economic data and signs of progress in the European sovereign debt crisis. However, fears related to the situation in Europe caused a number of spread sectors to weaken in April. While the spread sectors posted positive absolute returns in April, they generally lagged equal-durationvii Treasuries. Several of the riskiest spread sectors then performed poorly in May given a flight to quality
|
| Western Asset Inflation Management Fund Inc. |
|
that was triggered by escalating fears of contagion from Europe and some disappointing economic data in the U.S. The spread sectors then rallied in June as investor sentiment improved. For the six months ended June 30, 2012, the Barclays U.S. Aggregate Indexviii returned 2.37%.
Q. How did the high-yield market perform over the six months ended June 30, 2012?
A. The U.S. high-yield bond market generated a strong return during the reporting period. The asset class, as measured by the Barclays U.S. Corporate High Yield – 2% Issuer Cap Indexix, posted positive returns during four of the six months of the period. Risk appetite was often solid as investors were drawn to higher yielding securities. While the high-yield market faltered in March and May given increased risk aversion, they proved to be temporary setbacks. All told, the high-yield market gained 7.23% for the six months ended June 30, 2012.
Q. How did the emerging market debt asset class perform over the reporting period?
A. After a strong start, the asset class gave back a portion of its gains in May. During much of the first four months of the period, emerging market debt was supported by solid growth in developing countries and overall strong demand. However, a confluence of events, including the European sovereign debt crisis, moderating growth in the U.S. and fears that China’s economy would experience a hard landing, caused the asset class to fall sharply in May 2012. The asset class then moved higher in June as investor risk appetite returned. Overall, the JPMorgan Emerging Markets Bond Index Global (“EMBI Global”)x returned 7.45% over the six months ended June 30, 2012.
Performance review
For the six months ended June 30, 2012, Western Asset Inflation Management Fund Inc. returned 4.04% based on its net asset value (“NAV”)xi and 5.29% based on its New York Stock Exchange (“NYSE”) market price per share. The Fund’s unmanaged benchmark, the Barclays Global Real Index: U.S. TIPSxii, returned 4.04% for the same period. The Lipper Corporate Debt BBB-Rated Closed-End Funds Category Averagexiii returned 6.09% over the same time frame. Please note that Lipper performance returns are based on each fund’s NAV.
During this six-month period, the Fund made distributions to shareholders totaling $0.25 per share, which may have included a return of capital. The performance table shows the Fund’s six-month total return based on its NAV and market price as of June 30, 2012. Past performance is no guarantee of future results.
Performance Snapshot as of June 30, 2012 (unaudited)
Price Per Share |
| 6-Month |
|
$19.92 (NAV) |
| 4.04%† |
|
$18.16 (Market Price) |
| 5.29%‡ |
|
All figures represent past performance and are not a guarantee of future results. Performance figures for periods shorter than one year represent cumulative figures and are not annualized.
* Total returns are based on changes in NAV or market price, respectively.
† Total return assumes the reinvestment of all distributions, including returns of capital, if any, at NAV.
|
| Western Asset Inflation Management Fund Inc. |
|
|
Investment commentary (cont’d)
‡ Total return assumes the reinvestment of all distributions, including returns of capital, if any, in additional shares in accordance with the Fund’s Dividend Reinvestment Plan.
Looking for additional information?
The Fund is traded under the symbol “IMF” and its closing market price is available in most newspapers under the NYSE listings. The daily NAV is available on-line under the symbol “XIMFX” on most financial websites. Barron’s and the Wall Street Journal’s Monday edition both carry closed-end fund tables that provide additional information. In addition, the Fund issues a quarterly press release that can be found on most major financial websites as well as www.lmcef.com.
In a continuing effort to provide information concerning the Fund, shareholders may call 1-888-777-0102 (toll free), Monday through Friday from 8:00 a.m. to 5:30 p.m. Eastern Time, for the Fund’s current NAV, market price and other information.
As always, thank you for your confidence in our stewardship of your assets.
Sincerely,
R. Jay Gerken, CFA
Chairman, President and Chief Executive Officer
July 27, 2012
RISKS: If interest rates rise, but the rate of inflation does not, the Fund’s performance will be adversely affected. The Fund is subject to the risks associated with inflation-protected securities (“IPS”). Risks associated with IPS investments include liquidity risk, interest rate risk, prepayment risk, extension risk and deflation risk. Income distributions of the Fund are likely to fluctuate more than those of a conventional bond fund. Changes in inflation will cause the Fund’s income to fluctuate, sometimes substantially. Periods of deflation may adversely affect the Fund’s NAV. As interest rates rise, bond prices fall, reducing the value of the Fund’s fixed-income holdings. The Fund is not diversified, which means that it is permitted to invest a higher percentage of its assets in any one issuer than a diversified fund. This may magnify the Fund’s losses from events affecting a particular issuer. Foreign securities are subject to certain risks of overseas investing, including currency fluctuations and changes in political and economic conditions. These risks are greater in emerging markets. High-yield bonds involve greater credit and liquidity risks than investment grade bonds. The Fund may use derivatives, such as options and futures, which can be illiquid, may disproportionately increase losses, and have a potentially large impact on Fund performance. Leverage may result in greater volatility of NAV and the market price of common shares and increases a shareholder’s risk of loss. There is no assurance that the Fund’s leveraging strategy will be successful.
All investments are subject to risk including the possible loss of principal. Past performance is no guarantee of future results. All index performance reflects no deduction for fees, expenses or taxes. Please note that an investor cannot invest directly in an index.
The information provided is not intended to be a forecast of future events, a guarantee of future results or investment advice. Views expressed may differ from those of the firm as a whole.
|
| Western Asset Inflation Management Fund Inc. |
|
i Gross domestic product (“GDP”) is the market value of all final goods and services produced within a country in a given period of time.
ii The Institute for Supply Management’s PMI is based on a survey of purchasing executives who buy the raw materials for manufacturing at more than 350 companies. It offers an early reading on the health of the manufacturing sector.
iii The Federal Reserve Board (“Fed”) is responsible for the formulation of policies designed to promote economic growth, full employment, stable prices and a sustainable pattern of international trade and payments.
iv The federal funds rate is the rate charged by one depository institution on an overnight sale of immediately available funds (balances at the Federal Reserve) to another depository institution; the rate may vary from depository institution to depository institution and from day to day.
v The Consumer Price Index for All Urban Consumers (“CPI-U”) is a measure of the average change in prices over time of goods and services purchased by households, which covers approximately 87% of the total population and includes, in addition to wage earners and clerical worker households, groups such as professional, managerial and technical workers, the self-employed, short-term workers, the unemployed and retirees and others not in the labor force.
vi The Barclays U.S. TIPS Index represents an unmanaged market index made up of U.S. Treasury Inflation-Linked Index securities.
vii Duration is the measure of the price sensitivity of a fixed-income security to an interest rate change of 100 basis points. Calculation is based on the weighted average of the present values for all cash flows.
viii The Barclays U.S. Aggregate Index is a broad-based bond index comprised of government, corporate, mortgage- and asset-backed issues, rated investment grade or higher, and having at least one year to maturity.
ix The Barclays Corporate U.S. High Yield – 2% Issuer Cap Index is an index of the 2% Issuer Cap component of the Barclays U.S. Corporate High Yield Index, which covers the U.S. dollar-denominated, non-investment grade, fixed-rate, taxable corporate bond market.
x The JPMorgan Emerging Markets Bond Index Global (“EMBI Global”) tracks total returns for U.S. dollar-denominated debt instruments issued by emerging market sovereign and quasi-sovereign entities: Brady bonds, loans, Eurobonds and local market instruments.
xi Net asset value (“NAV”) is calculated by subtracting total liabilities and outstanding preferred stock (if any) from the closing value of all securities held by the Fund (plus all other assets) and dividing the result (total net assets) by the total number of the common shares outstanding. The NAV fluctuates with changes in the market prices of securities in which the Fund has invested. However, the price at which an investor may buy or sell shares of the Fund is the Fund’s market price as determined by supply of and demand for the Fund’s shares.
xii The Barclays Global Real Index: U.S. TIPS represents an unmanaged market index made up of U.S. Treasury Inflation-Linked Index securities.
xiii Lipper, Inc., a wholly-owned subsidiary of Reuters, provides independent insight on global collective investments. Returns are based on the six-month period ended June 30, 2012, including the reinvestment of all distributions, including returns of capital, if any, calculated among the 27 funds in the Fund’s Lipper category.
|
| Western Asset Inflation Management Fund Inc. 2012 Semi-Annual Report |
|
Fund at a glance† (unaudited)
Investment breakdown (%) as a percent of total investments
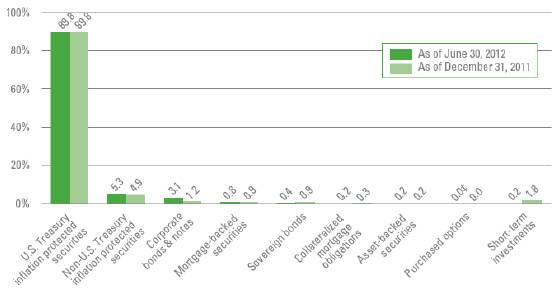
† The bar graph above represents the composition of the Fund’s investments as of June 30, 2012 and December 31, 2011 and does not include derivatives, such as futures contracts, written options and forward foreign currency contracts. The Fund is actively managed. As a result, the composition of the Fund’s investments is subject to change at any time.
‡ Represents less than 0.1%.
|
| Western Asset Inflation Management Fund Inc. 2012 Semi-Annual Report |
|
|
Spread duration (unaudited)
Economic Exposure — June 30, 2012
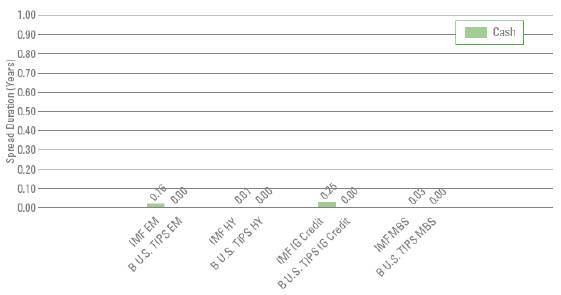
Spread duration measures the sensitivity to changes in spreads. The spread over Treasuries is the annual risk-premium demanded by investors to hold non-Treasury securities. Spread duration is quantified as the % change in price resulting from a 100 basis points change in spreads. For a security with positive spread duration, an increase in spreads would result in a price decline and a decline in spreads would result in a price increase. This chart highlights the market sector exposure of the Fund’s sectors relative to the selected benchmark sectors as of the end of the reporting period.
EM | — Emerging Markets |
HY | — High Yield |
IG Credit | — Investment Grade Credit |
IMF | — Western Asset Inflation Management Fund Inc. |
MBS | — Mortgage-Backed Securities |
B U.S. TIPS | — Barclays Global Real Index: U.S. TIPS |
|
| Western Asset Inflation Management Fund Inc. 2012 Semi-Annual Report |
|
Effective duration (unaudited)
Interest Rate Exposure — June 30, 2012
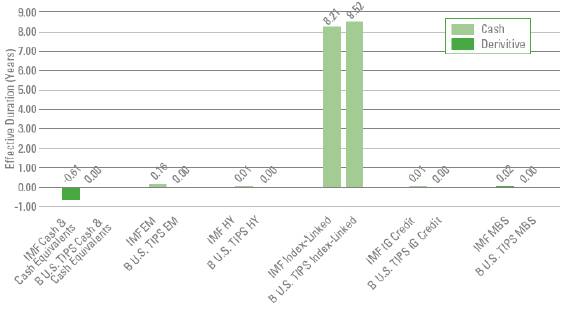
Effective duration measures the sensitivity to changes in relevant interest rates. Effective duration is quantified as the % change in price resulting from a 100 basis points change in interest rates. For a security with positive effective duration, an increase in interest rates would result in a price decline and a decline in interest rates would result in a price increase. This chart highlights the interest rate exposure of the Fund’s sectors relative to the selected benchmark sectors as of the end of the reporting period.
EM | — Emerging Markets |
HY | — High Yield |
IG Credit | — Investment Grade Credit |
IMF | — Western Asset Inflation Management Fund Inc. |
MBS | — Mortgage Backed Securities |
B U.S. TIPS | — Barclays Global Real Index: U.S. TIPS |
|
| Western Asset Inflation Management Fund Inc. 2012 Semi-Annual Report |
|
|
Schedule of investments (unaudited)
June 30, 2012
Western Asset Inflation Management Fund Inc.
Security |
| Rate |
| Maturity |
|
| Face |
| Value |
| |
U.S. Treasury Inflation Protected Securities — 89.0% |
|
|
|
|
|
|
|
|
| ||
U.S. Treasury Bonds, Inflation Indexed |
| 2.375 | % | 1/15/25 |
| 9,025,671 |
| $ | 11,908,949 |
| |
U.S. Treasury Bonds, Inflation Indexed |
| 2.000 | % | 1/15/26 |
| 10,919,005 |
| 13,961,826 |
| ||
U.S. Treasury Bonds, Inflation Indexed |
| 1.750 | % | 1/15/28 |
| 5,512,813 |
| 6,920,736 |
| ||
U.S. Treasury Bonds, Inflation Indexed |
| 2.500 | % | 1/15/29 |
| 1,210,852 |
| 1,683,367 |
| ||
U.S. Treasury Bonds, Inflation Indexed |
| 3.875 | % | 4/15/29 |
| 1,693,347 |
| 2,741,899 |
| ||
U.S. Treasury Bonds, Inflation Indexed |
| 2.125 | % | 2/15/40 |
| 1,522,106 |
| 2,166,148 |
| ||
U.S. Treasury Bonds, Inflation Indexed |
| 2.125 | % | 2/15/41 |
| 1,617,847 |
| 2,315,039 |
| ||
U.S. Treasury Bonds, Inflation Indexed |
| 0.750 | % | 2/15/42 |
| 814,520 |
| 857,473 |
| ||
U.S. Treasury Notes, Inflation Indexed |
| 2.000 | % | 1/15/14 |
| 547,844 |
| 569,158 |
| ||
U.S. Treasury Notes, Inflation Indexed |
| 1.250 | % | 4/15/14 |
| 5,609,333 |
| 5,794,704 |
| ||
U.S. Treasury Notes, Inflation Indexed |
| 2.000 | % | 7/15/14 |
| 1,684,304 |
| 1,785,756 |
| ||
U.S. Treasury Notes, Inflation Indexed |
| 1.625 | % | 1/15/15 |
| 5,397,773 |
| 5,739,349 |
| ||
U.S. Treasury Notes, Inflation Indexed |
| 0.500 | % | 4/15/15 |
| 4,044,696 |
| 4,202,059 |
| ||
U.S. Treasury Notes, Inflation Indexed |
| 1.875 | % | 7/15/15 |
| 1,170,952 |
| 1,274,142 |
| ||
U.S. Treasury Notes, Inflation Indexed |
| 2.000 | % | 1/15/16 |
| 4,903,120 |
| 5,427,906 |
| ||
U.S. Treasury Notes, Inflation Indexed |
| 0.125 | % | 4/15/16 |
| 6,733,129 |
| 7,012,446 |
| ||
U.S. Treasury Notes, Inflation Indexed |
| 2.500 | % | 7/15/16 |
| 2,517,610 |
| 2,883,648 |
| ||
U.S. Treasury Notes, Inflation Indexed |
| 2.375 | % | 1/15/17 |
| 7,563,570 |
| 8,733,564 |
| ||
U.S. Treasury Notes, Inflation Indexed |
| 0.125 | % | 4/15/17 |
| 1,012,910 |
| 1,069,886 |
| ||
U.S. Treasury Notes, Inflation Indexed |
| 1.625 | % | 1/15/18 |
| 4,282,863 |
| 4,891,162 |
| ||
U.S. Treasury Notes, Inflation Indexed |
| 1.375 | % | 7/15/18 |
| 3,317,997 |
| 3,791,070 |
| ||
U.S. Treasury Notes, Inflation Indexed |
| 2.125 | % | 1/15/19 |
| 964,395 |
| 1,155,089 |
| ||
U.S. Treasury Notes, Inflation Indexed |
| 1.250 | % | 7/15/20 |
| 5,095,264 |
| 5,922,449 |
| ||
U.S. Treasury Notes, Inflation Indexed |
| 1.125 | % | 1/15/21 |
| 11,400,428 |
| 13,133,647 |
| ||
U.S. Treasury Notes, Inflation Indexed |
| 0.625 | % | 7/15/21 |
| 5,471,274 |
| 6,098,763 |
| ||
U.S. Treasury Notes, Inflation Indexed |
| 0.125 | % | 1/15/22 |
| 2,978,257 |
| 3,153,927 |
| ||
Total U.S. Treasury Inflation Protected Securities (Cost — $110,494,018) |
|
|
| 125,194,162 |
| ||||||
Asset-Backed Securities — 0.1% |
|
|
|
|
|
|
|
|
| ||
Asset-Backed Funding Certificates, 2004-FF1 M2 |
| 2.420 | % | 1/25/34 |
| 244,693 |
| 28,762 | (a) | ||
Finance America Net Interest Margin Trust, 2004-1 A |
| 5.250 | % | 6/27/34 |
| 73,417 |
| 1 | (b)(c)(d) | ||
GSAMP Trust, 2004-OPT M3 |
| 1.395 | % | 11/25/34 |
| 108,642 |
| 47,771 | (a) | ||
Renaissance Home Equity Loan Trust, 2003-4 M3 |
| 2.145 | % | 3/25/34 |
| 276,081 |
| 132,790 | (a) | ||
SACO I Trust, 2005-2 A |
| 0.645 | % | 4/25/35 |
| 8,853 |
| 3,943 | (a)(b) | ||
Sail Net Interest Margin Notes, 2004-2A A |
| 5.500 | % | 3/27/34 |
| 71,380 |
| 1 | (b)(c)(d) | ||
Total Asset-Backed Securities (Cost — $787,595) |
|
|
|
|
|
|
| 213,268 |
| ||
Collateralized Mortgage Obligations — 0.2% |
|
|
|
|
|
|
|
|
| ||
Federal National Mortgage Association (FNMA), STRIPS, IO, 339 30 |
| 5.500 | % | 7/1/18 |
| 1,555,941 |
| 152,766 | (a) | ||
See Notes to Financial Statements.
|
| Western Asset Inflation Management Fund Inc. 2012 Semi-Annual Report |
|
Western Asset Inflation Management Fund Inc.
Security |
| Rate |
| Maturity |
|
| Face |
| Value |
| |
Collateralized Mortgage Obligations — continued |
|
|
|
|
|
|
|
|
| ||
Merit Securities Corp., 11PA B2 |
| 1.745 | % | 9/28/32 |
| 63,898 |
| $ | 62,722 | (a)(b) | |
Structured Asset Securities Corp., 1998-2 M1 |
| 1.345 | % | 2/25/28 |
| 11,839 |
| 11,057 | (a) | ||
Structured Asset Securities Corp., 1998-3 M1 |
| 1.245 | % | 3/25/28 |
| 116,930 |
| 109,642 | (a) | ||
Total Collateralized Mortgage Obligations (Cost — $190,450) |
|
|
|
| 336,187 |
| |||||
Corporate Bonds & Notes — 3.1% |
|
|
|
|
|
|
|
|
| ||
Consumer Discretionary — 0.2% |
|
|
|
|
|
|
|
|
| ||
Automobiles — 0.2% |
|
|
|
|
|
|
|
|
| ||
Ford Motor Credit Co., LLC, Senior Notes |
| 5.875 | % | 8/2/21 |
| 310,000 |
| 345,493 |
| ||
Energy — 0.6% |
|
|
|
|
|
|
|
|
| ||
Oil, Gas & Consumable Fuels — 0.6% |
|
|
|
|
|
|
|
|
| ||
Pemex Project Funding Master Trust, Senior Bonds |
| 6.625 | % | 6/15/35 |
| 29,000 |
| 34,655 |
| ||
Petrobras International Finance Co., Senior Notes |
| 5.750 | % | 1/20/20 |
| 180,000 |
| 197,798 |
| ||
Petrobras International Finance Co., Senior Notes |
| 5.375 | % | 1/27/21 |
| 440,000 |
| 476,419 |
| ||
Sinopec Group Overseas Development 2012 Ltd., Senior Notes |
| 2.750 | % | 5/17/17 |
| 200,000 |
| 203,888 | (b) | ||
Total Energy |
|
|
|
|
|
|
| 912,760 |
| ||
Financials — 1.1% |
|
|
|
|
|
|
|
|
| ||
Capital Markets — 0.0% |
|
|
|
|
|
|
|
|
| ||
Kaupthing Bank HF, Subordinated Notes |
| 7.125 | % | 5/19/16 |
| 1,050,000 |
| 0 | (b)(c)(d)(e)(f) | ||
Commercial Banks — 1.1% |
|
|
|
|
|
|
|
|
| ||
Glitnir Banki HF, Subordinated Notes |
| 6.693 | % | 6/15/16 |
| 550,000 |
| 0 | (b)(c)(d)(e)(f) | ||
Wachovia Capital Trust III, Junior Subordinated Bonds |
| 5.570 | % | 12/31/49 |
| 1,570,000 |
| 1,505,237 | (a) | ||
Total Commercial Banks |
|
|
|
|
|
|
| 1,505,237 |
| ||
Total Financials |
|
|
|
|
|
|
| 1,505,237 |
| ||
Materials — 1.0% |
|
|
|
|
|
|
|
|
| ||
Containers & Packaging — 0.3% |
|
|
|
|
|
|
|
|
| ||
Ball Corp., Senior Notes |
| 7.375 | % | 9/1/19 |
| 330,000 |
| 366,300 |
| ||
Metals & Mining — 0.4% |
|
|
|
|
|
|
|
|
| ||
Vale Overseas Ltd., Notes |
| 6.875 | % | 11/21/36 |
| 180,000 |
| 209,692 |
| ||
Vale Overseas Ltd., Senior Notes |
| 4.375 | % | 1/11/22 |
| 418,000 |
| 427,749 |
| ||
Total Metals & Mining |
|
|
|
|
|
|
| 637,441 |
| ||
Paper & Forest Products — 0.3% |
|
|
|
|
|
|
|
|
| ||
Celulosa Arauco y Constitucion SA, Senior Notes |
| 4.750 | % | 1/11/22 |
| 350,000 |
| 359,548 | (b) | ||
Total Materials |
|
|
|
|
|
|
| 1,363,289 |
| ||
See Notes to Financial Statements.
|
| Western Asset Inflation Management Fund Inc. 2012 Semi-Annual Report |
|
|
Schedule of investments (unaudited) (cont’d)
June 30, 2012
Western Asset Inflation Management Fund Inc.
Security |
| Rate |
| Maturity |
|
| Face |
| Value |
| ||
Telecommunication Services — 0.2% |
|
|
|
|
|
|
|
|
| |||
Wireless Telecommunication Services — 0.2% |
|
|
|
|
|
|
|
|
| |||
America Movil SAB de CV, Senior Notes |
| 5.625 | % | 11/15/17 |
| 90,000 |
| $ | 106,261 |
| ||
America Movil SAB de CV, Senior Notes |
| 5.000 | % | 3/30/20 |
| 100,000 |
| 114,065 |
| |||
Total Telecommunication Services |
|
|
|
|
|
|
| 220,326 |
| |||
Total Corporate Bonds & Notes (Cost — $5,706,901) |
|
|
|
|
|
|
| 4,347,105 |
| |||
Mortgage-Backed Securities — 0.8% |
|
|
|
|
|
|
|
|
| |||
FHLMC — 0.6% |
|
|
|
|
|
|
|
|
| |||
Federal Home Loan Mortgage Corp. (FHLMC), Gold |
| 7.000 | % | 6/1/17 |
| 23,972 |
| 24,174 |
| |||
Federal Home Loan Mortgage Corp. (FHLMC), Gold |
| 8.500 | % | 9/1/24 |
| 742,241 |
| 874,723 |
| |||
Total FHLMC |
|
|
|
|
|
|
| 898,897 |
| |||
FNMA — 0.2% |
|
|
|
|
|
|
|
|
| |||
Federal National Mortgage Association (FNMA) |
| 5.500 | % | 1/1/14 |
| 9,588 |
| 10,414 |
| |||
Federal National Mortgage Association (FNMA) |
| 7.000 | % | 10/1/18 - 6/1/32 |
| 179,391 |
| 207,811 |
| |||
Total FNMA |
|
|
|
|
|
|
| 218,225 |
| |||
Total Mortgage-Backed Securities (Cost — $1,015,492) |
|
|
|
|
|
|
| 1,117,122 |
| |||
Non-U.S. Treasury Inflation Protected Securities — 5.3% |
|
|
|
|
|
|
|
|
| |||
Canada — 4.3% |
|
|
|
|
|
|
|
|
| |||
Government of Canada, Bonds |
| 4.250 | % | 12/1/26 |
| 1,252,080 | CAD | 1,977,699 |
| |||
Government of Canada, Bonds |
| 2.000 | % | 12/1/41 |
| 933,802 | CAD | 1,311,761 |
| |||
Government of Canada, Bonds |
| 4.000 | % | 12/1/31 |
| 641,784 | CAD | 1,083,897 |
| |||
Government of Canada, Bonds |
| 4.250 | % | 12/1/21 |
| 1,176,576 | CAD | 1,638,296 |
| |||
Total Canada |
|
|
|
|
|
|
| 6,011,653 |
| |||
United Kingdom — 1.0% |
|
|
|
|
|
|
|
|
| |||
United Kingdom Treasury Gilt, Bonds |
| 1.250 | % | 11/22/55 |
| 605,477 | GBP | 1,412,066 |
| |||
Total Non-U.S. Treasury Inflation Protected Securities (Cost — $7,421,549) |
|
|
| 7,423,719 |
| |||||||
Sovereign Bonds — 0.4% |
|
|
|
|
|
|
|
|
| |||
India — 0.1% |
|
|
|
|
|
|
|
|
| |||
ICICI Bank Ltd., Subordinated Bonds |
| 6.375 | % | 4/30/22 |
| 170,000 |
| 153,000 | (a)(b) | |||
Mexico — 0.3% |
|
|
|
|
|
|
|
|
| |||
United Mexican States, Medium-Term Notes |
| 6.750 | % | 9/27/34 |
| 266,000 |
| 364,420 |
| |||
United Mexican States, Medium-Term Notes |
| 6.050 | % | 1/11/40 |
| 44,000 |
| 56,980 |
| |||
Total Mexico |
|
|
|
|
|
|
| 421,400 |
| |||
Total Sovereign Bonds (Cost — $495,262) |
|
|
|
|
|
|
| 574,400 |
| |||
|
|
|
|
|
|
|
|
|
| |||
|
|
|
| Expiration |
|
| Contracts |
|
|
| ||
Purchased Options — 0.0% |
|
|
|
|
|
|
|
|
| |||
U.S. Dollar/Canadian Dollar, Call (Cost — $53,741) |
|
|
| 8/23/12 |
| 3,540,000 |
| 14,451 |
| |||
Total Investments before Short-Term Investments (Cost — $126,165,008) |
|
|
| 139,220,414 |
| |||||||
See Notes to Financial Statements.
|
| Western Asset Inflation Management Fund Inc. 2012 Semi-Annual Report |
|
Western Asset Inflation Management Fund Inc.
Security |
| Rate |
| Maturity |
|
| Face |
| Value |
|
Short-Term Investments — 0.2% |
|
|
|
|
|
|
|
|
| |
Repurchase Agreements — 0.2% |
|
|
|
|
|
|
|
|
| |
State Street Bank & Trust Co. dated 06/29/12; Proceeds at maturity — $219,000; (Fully collateralized by U.S. Treasury Notes, 0.750% due 03/31/13; Market value — $226,406) (Cost — $219,000) |
| 0.010 | % | 7/2/12 |
| 219,000 |
| $ 219,000 |
| |
Total Investments — 99.1% (Cost — $126,384,008#) |
|
|
|
|
|
|
| 139,439,414 |
| |
Other Assets in Excess of Liabilities — 0.9% |
|
|
|
|
|
|
| 1,276,623 |
| |
Total Net Assets — 100.0% |
|
|
|
|
|
|
| $140,716,037 |
| |
† Face amount denominated in U.S. dollars, unless otherwise noted.
(a) Variable rate security. Interest rate disclosed is as of the most recent information available.
(b) Security is exempt from registration under Rule 144A of the Securities Act of 1933. This security may be resold in transactions that are exempt from registration, normally to qualified institutional buyers. This security has been deemed liquid pursuant to guidelines approved by the Board of Directors, unless otherwise noted.
(c) Illiquid security.
(d) The coupon payment on these securities is currently in default as of June 30, 2012.
(e) Value is less than $1.
(f) Security is valued in good faith in accordance with procedures approved by the Board of Directors (See Note 1).
# Aggregate cost for federal income tax purposes is substantially the same.
Abbreviations used in this schedule:
CAD | — Canadian Dollar |
GBP | — British Pound |
IO | — Interest Only |
STRIPS | — Separate Trading of Registered Interest and Principal Securities |
Schedule of Written Options
Security |
| Expiration |
| Strike |
| Contracts |
| Value |
|
U.S. Treasury 5-Year Notes Futures, Call (Premiums received — $59,236) |
| 7/27/12 |
| $124.00 |
| 134 |
| $33,500 |
|
See Notes to Financial Statements.
|
| Western Asset Inflation Management Fund Inc. 2012 Semi-Annual Report |
|
|
Statement of assets and liabilities (unaudited)
June 30, 2012
Assets: |
|
|
|
Investments, at value (Cost — $126,384,008) |
| $139,439,414 |
|
Foreign currency, at value (Cost — $190,286) |
| 192,056 |
|
Cash |
| 581 |
|
Interest receivable |
| 807,236 |
|
Deposits with brokers for open futures contracts |
| 250,006 |
|
Unrealized appreciation on forward foreign currency contracts |
| 163,915 |
|
Receivable from broker — variation margin on open futures contracts |
| 57,093 |
|
Foreign currency collateral for futures contracts, at value (Cost — $2,289) |
| 2,289 |
|
Prepaid expenses |
| 16,610 |
|
Total Assets |
| 140,929,200 |
|
|
|
|
|
Liabilities: |
|
|
|
Investment management fee payable |
| 69,628 |
|
Unrealized depreciation on forward foreign currency contracts |
| 62,041 |
|
Written options, at value (premiums received — $59,236) |
| 33,500 |
|
Accrued expenses |
| 47,994 |
|
Total Liabilities |
| 213,163 |
|
Total Net Assets |
| $140,716,037 |
|
|
|
|
|
Net Assets: |
|
|
|
Par value ($0.001 par value; 7,062,862 shares issued and outstanding; 100,000,000 shares authorized) |
| $ 7,063 |
|
Paid-in capital in excess of par value |
| 137,664,290 |
|
Overdistributed net investment income |
| (183,603) |
|
Accumulated net realized loss on investments, futures contracts, written options and foreign currency transactions |
| (9,976,653) |
|
Net unrealized appreciation on investments, futures contracts, written options and foreign currencies |
| 13,204,940 |
|
Total Net Assets |
| $140,716,037 |
|
|
|
|
|
Shares Outstanding |
| 7,062,862 |
|
|
|
|
|
Net Asset Value |
| $19.92 |
|
See Notes to Financial Statements.
|
| Western Asset Inflation Management Fund Inc. 2012 Semi-Annual Report |
|
Statement of operations (unaudited)
For the Six Months Ended June 30, 2012
Investment Income: |
|
|
|
Interest |
| $2,434,111 |
|
|
|
|
|
Expenses: |
|
|
|
Investment management fee (Note 2) |
| 415,393 |
|
Audit and tax |
| 33,790 |
|
Shareholder reports |
| 25,526 |
|
Transfer agent fees |
| 13,384 |
|
Legal fees |
| 13,126 |
|
Directors’ fees |
| 12,229 |
|
Stock exchange listing fees |
| 10,580 |
|
Fund accounting fees |
| 6,943 |
|
Custody fees |
| 3,239 |
|
Insurance |
| 1,936 |
|
Miscellaneous expenses |
| 3,438 |
|
Total Expenses |
| 539,584 |
|
Net Investment Income |
| 1,894,527 |
|
|
|
|
|
Realized and Unrealized Gain (Loss) on Investments, Futures Contracts, Written Options and Foreign Currency Transactions (Notes 1, 3 and 4): |
|
|
|
Net Realized Gain (Loss) From: |
|
|
|
Investment transactions |
| 2,478,735 |
|
Futures contracts |
| 79,019 |
|
Written options |
| 265,853 |
|
Foreign currency transactions |
| (41,771) |
|
Net Realized Gain |
| 2,781,836 |
|
Change in Net Unrealized Appreciation (Depreciation) From: |
|
|
|
Investments |
| 718,816 |
|
Futures contracts |
| 20,024 |
|
Written options |
| 25,736 |
|
Foreign currencies |
| 64,566 |
|
Change in Net Unrealized Appreciation (Depreciation) |
| 829,142 |
|
Net Gain on Investments, Futures Contracts, Written Options and Foreign Currency Transactions |
| 3,610,978 |
|
Increase in Net Assets from Operations |
| $5,505,505 |
|
See Notes to Financial Statements.
|
| Western Asset Inflation Management Fund Inc. 2012 Semi-Annual Report |
|
|
Statements of changes in net assets
For the Six Months Ended June 30, 2012 (unaudited) |
| 2012 |
| 2011 |
|
|
|
|
|
|
|
Operations: |
|
|
|
|
|
Net investment income |
| $ 1,894,527 |
| $ 4,702,786 |
|
Net realized gain |
| 2,781,836 |
| 4,081,087 |
|
Change in net unrealized appreciation (depreciation) |
| 829,142 |
| 6,599,029 |
|
Increase in Net Assets From Operations |
| 5,505,505 |
| 15,382,902 |
|
|
|
|
|
|
|
Distributions to Shareholders From (Note 1): |
|
|
|
|
|
Net investment income |
| (1,765,715) |
| (5,791,547) |
|
Decrease in Net Assets From Distributions to Shareholders |
| (1,765,715) |
| (5,791,547) |
|
Increase in Net Assets |
| 3,739,790 |
| 9,591,355 |
|
|
|
|
|
|
|
Net Assets: |
|
|
|
|
|
Beginning of period |
| 136,976,247 |
| 127,384,892 |
|
End of period* |
| $140,716,037 |
| $136,976,247 |
|
* Includes overdistributed net investment income of: |
| $(183,603) |
| $(312,415) |
|
See Notes to Financial Statements.
|
| Western Asset Inflation Management Fund Inc. 2012 Semi-Annual Report |
|
Financial highlights
For a share of capital stock outstanding throughout each year ended December 31, unless otherwise noted:
|
| 20121,2 |
| 20112 |
| 20102 |
| 20092,3 |
| 20092,4 |
| 20082,4 |
| 20072,4 |
|
|
|
|
|
|
|
|
|
|
|
|
|
|
|
|
|
Net asset value, beginning of period |
| $19.39 |
| $18.04 |
| $17.69 |
| $17.68 |
| $15.29 |
| $18.15 |
| $17.89 |
|
|
|
|
|
|
|
|
|
|
|
|
|
|
|
|
|
Income (loss) from operations: |
|
|
|
|
|
|
|
|
|
|
|
|
|
|
|
Net investment income |
| 0.27 |
| 0.67 |
| 0.39 |
| 0.06 |
| 0.16 |
| 1.32 |
| 0.66 |
|
Net realized and unrealized gain (loss) |
| 0.51 |
| 1.50 |
| 0.56 |
| 0.05 |
| 2.99 |
| (3.39) |
| 0.28 |
|
Total income (loss) from operations |
| 0.78 |
| 2.17 |
| 0.95 |
| 0.11 |
| 3.15 |
| (2.07) |
| 0.94 |
|
|
|
|
|
|
|
|
|
|
|
|
|
|
|
|
|
Less distributions from: |
|
|
|
|
|
|
|
|
|
|
|
|
|
|
|
Net investment income |
| (0.25) |
| (0.82) |
| (0.58) |
| (0.10) |
| (0.76) |
| (0.83) |
| (0.72) |
|
Return of capital |
| — |
| — |
| (0.02) |
| — |
| — |
| — |
| — |
|
Total distributions |
| (0.25) |
| (0.82) |
| (0.60) |
| (0.10) |
| (0.76) |
| (0.83) |
| (0.72) |
|
|
|
|
|
|
|
|
|
|
|
|
|
|
|
|
|
Increase in net asset value due to shares issued on reinvestment of distributions |
| — |
| — |
| — |
| — |
| — |
| 0.04 |
| 0.04 |
|
|
|
|
|
|
|
|
|
|
|
|
|
|
|
|
|
Net asset value, end of period |
| $19.92 |
| $19.39 |
| $18.04 |
| $17.69 |
| $17.68 |
| $15.29 |
| $18.15 |
|
Market price, end of period |
| $18.16 |
| $17.49 |
| $17.65 |
| $16.15 |
| $15.99 |
| $13.49 |
| $16.16 |
|
Total return, based on NAV5,6 |
| 4.04 | % | 12.21 | % | 5.42 | % | 0.62 | % | 21.09 | % | (11.87) | % | 5.65 | % |
Total return, based on Market Price7 |
| 5.29 | % | 3.83 | % | 13.26 | % | 1.62 | % | 24.67 | % | (12.15) | % | 6.51 | % |
|
|
|
|
|
|
|
|
|
|
|
|
|
|
|
|
Net assets, end of period (000s) |
| $140,716 |
| $136,976 |
| $127,385 |
| $124,891 |
| $124,813 |
| $107,948 |
| $142,003 |
|
|
|
|
|
|
|
|
|
|
|
|
|
|
|
|
|
Ratios to average net assets: |
|
|
|
|
|
|
|
|
|
|
|
|
|
|
|
Gross expenses |
| 0.78 | %8 | 0.87 | % | 0.87 | % | 1.04 | %8 | 1.09 | % | 1.40 | % | 1.45 | %9 |
Net expenses10 |
| 0.78 | 8 | 0.87 |
| 0.87 |
| 1.04 | 8 | 1.09 |
| 1.40 |
| 1.45 | 9,11 |
Net investment income |
| 2.74 | 8 | 3.53 |
| 2.15 |
| 2.03 | 8 | 0.97 |
| 7.16 |
| 3.69 |
|
|
|
|
|
|
|
|
|
|
|
|
|
|
|
|
|
Portfolio turnover rate |
| 26 | % | 52 | % | 48 | % | 2 | % | 45 | %12 | 70 | %12 | 39 | %12 |
1 For the six months ended June 30, 2012 (unaudited).
2 Per share amounts have been calculated using the average shares method.
3 For the period November 1, 2009 through December 31, 2009.
4 For the year ended October 31.
5 Performance figures may reflect compensating balance arrangements, fee waivers and/or expense reimbursements. In the absence of compensating balance arrangements, fee waivers and/or expense reimbursements, the total return would have been lower. Past performance is no guarantee of future results. Total returns for periods of less than one year are not annualized.
6 The total return calculation assumes that distributions are reinvested at NAV. Past performance is no guarantee of future results. Total returns for periods of less than one year are not annualized.
7 The total return calculation assumes that distributions are reinvested in accordance with the Fund’s dividend reinvestment plan. Past performance is no guarantee of future results. Total returns for periods of less than one year are not annualized.
8 Annualized.
9 Included in the expense ratios are certain non-recurring restructuring (and reorganization, if applicable) fees that were incurred by the Fund during the period. Without these fees, the gross and net expense ratios would not have changed.
10 The impact of compensating balance arrangements, if any, was less than 0.01%.
11 Reflects fee waivers and/or expense reimbursements.
12 Excluding mortgage dollar roll transactions. If mortgage dollar roll transactions had been included, the portfolio turnover rate would have been 55%, 122%, and 55% for the years ended October 31, 2009, 2008 and 2007, respectively.
See Notes to Financial Statements.
|
| Western Asset Inflation Management Fund Inc. 2012 Semi-Annual Report |
|
|
Notes to financial statements (unaudited)
1. Organization and significant accounting policies
Western Asset Inflation Management Fund Inc. (the “Fund”) was incorporated in Maryland on March 16, 2004 and is registered as a non-diversified, closed-end management investment company under the Investment Company Act of 1940, as amended (the “1940 Act”). The Board of Directors authorized 100 million shares of $0.001 par value common stock. The Fund’s primary investment objective is total return. Current income is the Fund’s secondary investment objective.
The following are significant accounting policies consistently followed by the Fund and are in conformity with U.S. generally accepted accounting principles (“GAAP”). Estimates and assumptions are required to be made regarding assets, liabilities and changes in net assets resulting from operations when financial statements are prepared. Changes in the economic environment, financial markets and any other parameters used in determining these estimates could cause actual results to differ. Subsequent events have been evaluated through the date the financial statements were issued.
(a) Investment valuation. The valuations for fixed income securities (which may include, but are not limited to, corporate, government, municipal, mortgage-backed, collateralized mortgage obligations and asset-backed securities) and certain derivative instruments are typically the prices supplied by independent third party pricing services, which may use market prices or broker/dealer quotations or a variety of valuation techniques and methodologies. The independent third party pricing services use inputs that are observable such as issuer details, interest rates, yield curves, prepayment speeds, credit risks/spreads, default rates and quoted prices for similar securities. Short-term fixed income securities that will mature in 60 days or less are valued at amortized cost, unless it is determined that using this method would not reflect an investment’s fair value. Futures contracts are valued daily at the settlement price established by the board of trade or exchange on which they are traded. Equity securities for which market quotations are available are valued at the last reported sales price or official closing price on the primary market or exchange on which they trade. When the Fund holds securities or other assets that are denominated in a foreign currency, the Fund will normally use the currency exchange rates as of 4:00 p.m. (Eastern Time). If independent third party pricing services are unable to supply prices for a portfolio investment, or if the prices supplied are deemed by the manager to be unreliable, the market price may be determined by the manager using quotations from one or more broker/dealers or at the transaction price if the security has recently been purchased and no value has yet been obtained from a pricing service or pricing broker. When reliable prices are not readily available, such as when the value of a security has been significantly affected by events after the close of the exchange or market on which the security is principally traded, but before the Fund calculates its net asset value, the
|
| Western Asset Inflation Management Fund Inc. 2012 Semi-Annual Report |
|
|
Fund values these securities as determined in accordance with procedures approved by the Fund’s Board of Directors.
The Board of Directors is responsible for the valuation process and has delegated the supervision of the daily valuation process to the Legg Mason North American Fund Valuation Committee (the “Valuation Committee”). The Valuation Committee, pursuant to the policies adopted by the Board of Directors, is responsible for making fair value determinations, evaluating the effectiveness of the Fund’s pricing policies, and reporting to the Board of Directors. When determining the reliability of third party pricing information for investments owned by the Fund, the Valuation Committee, among other things, conducts due diligence reviews of pricing vendors, monitors the daily change in prices and reviews transactions among market participants.
The Valuation Committee will consider pricing methodologies it deems relevant and appropriate when making fair value determinations. Examples of possible methodologies include, but are not limited to, multiple of earnings; discount from market of a similar freely traded security; discounted cash-flow analysis; book value or a multiple thereof; risk premium/yield analysis; yield to maturity; and/or fundamental investment analysis. The Valuation Committee will also consider factors it deems relevant and appropriate in light of the facts and circumstances. Examples of possible factors include, but are not limited to, the type of security; the issuer’s financial statements; the purchase price of the security; the discount from market value of unrestricted securities of the same class at the time of purchase; analysts’ research and observations from financial institutions; information regarding any transactions or offers with respect to the security; the existence of merger proposals or tender offers affecting the security; the price and extent of public trading in similar securities of the issuer or comparable companies; and the existence of a shelf registration for restricted securities.
For each portfolio security that has been fair valued pursuant to the policies adopted by the Board of Directors, the fair value price is compared against the last available and next available market quotations. The Valuation Committee reviews the results of such back testing monthly and fair valuation occurrences are reported to the Board of Directors quarterly.
The Fund uses valuation techniques to measure fair value that are consistent with the market approach and/or income approach, depending on the type of security and the particular circumstance. The market approach uses prices and other relevant information generated by market transactions involving identical or comparable securities. The income approach uses valuation techniques to discount estimated future cash flows to present value.
|
| Western Asset Inflation Management Fund Inc. 2012 Semi-Annual Report |
|
|
Notes to financial statements (unaudited) (cont’d)
GAAP establishes a disclosure hierarchy that categorizes the inputs to valuation techniques used to value assets and liabilities at measurement date. These inputs are summarized in the three broad levels listed below:
· Level 1 — quoted prices in active markets for identical investments
· Level 2 — other significant observable inputs (including quoted prices for similar investments, interest rates, prepayment speeds, credit risk, etc.)
· Level 3 — significant unobservable inputs (including the Fund’s own assumptions in determining the fair value of investments)
The inputs or methodologies used to value securities are not necessarily an indication of the risk associated with investing in those securities.
The following is a summary of the inputs used in valuing the Fund’s assets and liabilities carried at fair value:
ASSETS | |||||||||||
|
|
|
|
|
|
|
|
|
| ||
Description |
| Quoted Prices |
| Other Significant |
| Significant |
| Total |
| ||
Long-term investments†: |
|
|
|
|
|
|
|
|
| ||
U.S. treasury inflation- protected securities |
| — |
| $ | 125,194,162 |
| — |
| $ | 125,194,162 |
|
Asset-backed securities |
| — |
|
| 213,268 |
| — |
|
| 213,268 |
|
Collateralized mortgage obligations |
| — |
|
| 336,187 |
| — |
|
| 336,187 |
|
Corporate bonds & notes |
| — |
|
| 4,347,105 |
| $ 0* |
|
| 4,347,105 |
|
Mortgage-backed securities |
| — |
|
| 1,117,122 |
| — |
|
| 1,117,122 |
|
Non-U.S. treasury inflation protected securities |
| — |
|
| 7,423,719 |
| — |
|
| 7,423,719 |
|
Sovereign bonds |
| — |
|
| 574,400 |
| — |
|
| 574,400 |
|
Purchased options |
| — |
|
| 14,451 |
| — |
|
| 14,451 |
|
Total long-term investments |
| — |
| $ | 139,220,414 |
| $ 0* |
| $ | 139,220,414 |
|
Short-term investments† |
| — |
|
| 219,000 |
| — |
|
| 219,000 |
|
Total investments |
| — |
| $ | 139,439,414 |
| $ 0* |
| $ | 139,439,414 |
|
Other financial instruments: |
|
|
|
|
|
|
|
|
|
|
|
Futures contracts |
| $20,024 |
|
| — |
| — |
| $ | 20,024 |
|
Forward foreign currency contracts |
| — |
| $ | 163,915 |
| — |
|
| 163,915 |
|
Total other financial instruments |
| $20,024 |
| $ | 163,915 |
| — |
| $ | 183,939 |
|
Total |
| $20,024 |
| $ | 139,603,329 |
| $ 0* |
| $ | 139,623,353 |
|
LIABILITIES | |||||||||
|
|
|
|
|
|
|
|
|
|
Description |
| Quoted Prices |
| Other Significant |
| Significant |
| Total |
|
Other financial instruments: |
|
|
|
|
|
|
|
|
|
Written options |
| $33,500 |
| — |
| — |
| $33,500 |
|
Forward foreign currency contracts |
| — |
| $62,041 |
| — |
| 62,041 |
|
Total |
| $33,500 |
| $62,041 |
| — |
| $95,541 |
|
† See Schedule of Investments for additional detailed categorizations.
* Value is less than $1.
|
| Western Asset Inflation Management Fund Inc. 2012 Semi-Annual Report |
|
|
The following is a reconciliation of investments in which significant unobservable inputs (Level 3) were used in determining fair value:
Investments In Securities |
| Corporate |
|
Balance as of December 31, 2011 |
| $ 0* |
|
Accrued premiums/discounts |
| — |
|
Realized gain (loss) |
| — |
|
Change in unrealized appreciation (depreciation) |
| — |
|
Purchases |
| — |
|
Sales |
| — |
|
Transfers into Level 3 |
| — |
|
Transfers out of Level 3 |
| — |
|
Balance as of June 30, 2012 |
| $ 0* |
|
Net change in unrealized appreciation (depreciation) for investments in securities still held at June 30, 2012 |
| — |
|
The Fund’s policy is to recognize transfers between levels as of the end of the reporting period.
* Value is less than $1.
(b) Repurchase agreements. The Fund may enter into repurchase agreements with institutions that its investment adviser has determined are creditworthy. Each repurchase agreement is recorded at cost. Under the terms of a typical repurchase agreement, the Fund acquires a debt security subject to an obligation of the seller to repurchase, and of the Fund to resell, the security at an agreed-upon price and time, thereby determining the yield during the Fund’s holding period. When entering into repurchase agreements, it is the Fund’s policy that its custodian or a third party custodian, acting on the Fund’s behalf, take possession of the underlying collateral securities, the market value of which, at all times, at least equals the principal amount of the repurchase transaction, including accrued interest. To the extent that any repurchase transaction maturity exceeds one business day, the value of the collateral is marked-to-market and measured against the value of the agreement in an effort to ensure the adequacy of the collateral. If the counterparty defaults, the Fund generally has the right to use the collateral to satisfy the terms of the repurchase transaction. However, if the market value of the collateral declines during the period in which the Fund seeks to assert its rights or if bankruptcy proceedings are commenced with respect to the seller of the security, realization of the collateral by the Fund may be delayed or limited.
(c) Futures contracts. The Fund uses futures contracts generally to gain exposure to, or hedge against, changes in interest rates or gain exposure to, or hedge against, changes in certain asset classes. A futures contract represents a commitment for the future purchase or sale of an asset at a specified price on a specified date.
|
| Western Asset Inflation Management Fund Inc. 2012 Semi-Annual Report |
|
|
Notes to financial statements (unaudited) (cont’d)
Upon entering into a futures contract, the Fund is required to deposit cash or cash equivalents with a broker in an amount equal to a certain percentage of the contract amount. This is known as the “initial margin” and subsequent payments (“variation margin”) are made or received by the Fund each day, depending on the daily fluctuation in the value of the contract. For certain futures, including foreign denominated futures, variation margin is not settled daily, but is recorded as a net variation margin payable or receivable. Futures contracts are valued daily at the settlement price established by the board of trade or exchange on which they are traded. The daily changes in contract value are recorded as unrealized gains or losses in the Statement of Operations and the Fund recognizes a realized gain or loss when the contract is closed.
Futures contracts involve, to varying degrees, risk of loss in excess of the amounts reflected in the financial statements. In addition, there is the risk that the Fund may not be able to enter into a closing transaction because of an illiquid secondary market.
(d) Written options. When the Fund writes an option, an amount equal to the premium received by the Fund is recorded as a liability, the value of which is marked-to-market daily to reflect the current market value of the option written. If the option expires, the premium received is recorded as a realized gain. When a written call option is exercised, the difference between the premium received plus the option exercise price and the Fund’s basis in the underlying security (in the case of a covered written call option), or the cost to purchase the underlying security (in the case of an uncovered written call option), including brokerage commission, is recognized as a realized gain or loss. When a written put option is exercised, the amount of the premium received is subtracted from the cost of the security purchased by the Fund from the exercise of the written put option to form the Fund’s basis in the underlying security purchased. The writer or buyer of an option traded on an exchange can liquidate the position before the exercise of the option by entering into a closing transaction. The cost of a closing transaction is deducted from the original premium received resulting in a realized gain or loss to the Fund.
The risk in writing a covered call option is that the Fund may forego the opportunity of profit if the market price of the underlying security increases and the option is exercised. The risk in writing a put option is that the Fund may incur a loss if the market price of the underlying security decreases and the option is exercised. The risk in writing an uncovered call option is that the Fund is exposed to the risk of loss if the market price of the underlying security increases. In addition, there is the risk that the Fund may not be able to enter into a closing transaction because of an illiquid secondary market.
(e) Forward foreign currency contracts. The Fund enters into a forward foreign currency contract to hedge against foreign currency exchange rate risk on its non-U.S. dollar denominated securities or to facilitate settlement
|
| Western Asset Inflation Management Fund Inc. 2012 Semi-Annual Report |
|
|
of a foreign currency denominated portfolio transaction. A forward foreign currency contract is an agreement between two parties to buy and sell a currency at a set price with delivery and settlement at a future date. The contract is marked-to-market daily and the change in value is recorded by the Fund as an unrealized gain or loss. When a forward foreign currency contract is closed, through either delivery or offset by entering into another forward foreign currency contract, the Fund recognizes a realized gain or loss equal to the difference between the value of the contract at the time it was opened and the value of the contract at the time it is closed.
Forward foreign currency contracts involve elements of market risk in excess of the amounts reflected on the Statement of Assets and Liabilities. The Fund bears the risk of an unfavorable change in the foreign exchange rate underlying the forward foreign currency contract. Risks may also arise upon entering into these contracts from the potential inability of the counterparties to meet the terms of their contracts.
(f) Foreign currency translation. Investment securities and other assets and liabilities denominated in foreign currencies are translated into U.S. dollar amounts based upon prevailing exchange rates on the date of valuation. Purchases and sales of investment securities and income and expense items denominated in foreign currencies are translated into U.S. dollar amounts based upon prevailing exchange rates on the respective dates of such transactions.
The Fund does not isolate that portion of the results of operations resulting from fluctuations in foreign exchange rates on investments from the fluctuations arising from changes in market prices of securities held. Such fluctuations are included with the net realized and unrealized gain or loss on investments.
Net realized foreign exchange gains or losses arise from sales of foreign currencies, including gains and losses on forward foreign currency contracts, currency gains or losses realized between the trade and settlement dates on securities transactions, and the difference between the amounts of dividends, interest, and foreign withholding taxes recorded on the Fund’s books and the U.S. dollar equivalent of the amounts actually received or paid. Net unrealized foreign exchange gains and losses arise from changes in the values of assets and liabilities, other than investments in securities, on the date of valuation, resulting from changes in exchange rates.
Foreign security and currency transactions may involve certain considerations and risks not typically associated with those of U.S. dollar denominated transactions as a result of, among other factors, the possibility of lower levels of governmental supervision and regulation of foreign securities markets and the possibility of political or economic instability.
(g) Inflation-indexed bonds. Inflation-indexed bonds are fixed-income securities whose principal value or interest rate is periodically adjusted according to
|
| Western Asset Inflation Management Fund Inc. 2012 Semi-Annual Report |
|
|
Notes to financial statements (unaudited) (cont’d)
the rate of inflation. As the index measuring inflation changes, the principal value or interest rate of inflation-indexed bonds will be adjusted accordingly. Repayment of the original bond principal upon maturity (as adjusted for inflation) is guaranteed in the case of U.S. Treasury inflation-indexed bonds. For bonds that do not provide a similar guarantee, the adjusted principal value of the bond repaid at maturity may be less than the original principal.
(h) Stripped securities. The Fund may invest in “Stripped Securities,” a term used collectively for components, or strips, of fixed income securities. Stripped securities can be principal only securities (“PO”), which are debt obligations that have been stripped of unmatured interest coupons or, interest only securities (“IO”), which are unmatured interest coupons that have been stripped from debt obligations. The market value of Stripped Securities will fluctuate in response to changes in economic conditions, rates of pre-payment, interest rates and the market’s perception of the securities. However, fluctuations in response to interest rates may be greater in Stripped Securities than for debt obligations of comparable maturities that pay interest currently. The amount of fluctuation may increase with a longer period of maturity.
The yield to maturity on IO’s is sensitive to the rate of principal repayments (including prepayments) on the related underlying debt obligation and principal payments may have a material effect on yield to maturity. If the underlying debt obligation experiences greater than anticipated prepayments of principal, the Fund may not fully recoup its initial investment in IO’s.
(i) Loan participations. The Fund may invest in loans arranged through private negotiation between one or more financial institutions. The Fund’s investment in any such loan may be in the form of a participation in or an assignment of the loan. In connection with purchasing participations, the Fund generally will have no right to enforce compliance by the borrower with the terms of the loan agreement related to the loan, or any rights of off-set against the borrower and the Fund may not benefit directly from any collateral supporting the loan in which it has purchased the participation.
The Fund assumes the credit risk of the borrower, the lender that is selling the participation and any other persons interpositioned between the Fund and the borrower. In the event of the insolvency of the lender selling the participation, the Fund may be treated as a general creditor of the lender and may not benefit from any off-set between the lender and the borrower.
(j) Credit and market risk. The Fund invests in high-yield and emerging market instruments that are subject to certain credit and market risks. The yields of high-yield and emerging market debt obligations reflect, among other things, perceived credit and market risks. The Fund’s investment in securities rated below investment grade typically involve risks not associated with higher rated securities including, among others, greater risk related to timely and ultimate payment of interest and principal, greater market price volatility and less liquid secondary market trading. The consequences of political,
|
| Western Asset Inflation Management Fund Inc. 2012 Semi-Annual Report |
|
|
social, economic or diplomatic changes may have disruptive effects on the market prices of investments held by the Fund. The Fund’s investment in non-U.S. dollar denominated securities may also result in foreign currency losses caused by devaluations and exchange rate fluctuations.
(k) Foreign investment risks. The Fund’s investments in foreign securities may involve risks not present in domestic investments. Since securities may be denominated in foreign currencies, may require settlement in foreign currencies or pay interest or dividends in foreign currencies, changes in the relationship of these foreign currencies to the U.S. dollar can significantly affect the value of the investments and earnings of the Fund. Foreign investments may also subject the Fund to foreign government exchange restrictions, expropriation, taxation or other political, social or economic developments, all of which affect the market and/or credit risk of the investments.
(l) Counterparty risk and credit-risk-related contingent features of derivative instruments. The Fund may invest in certain securities or engage in other transactions, where the Fund is exposed to counterparty credit risk in addition to broader market risks. The Fund may invest in securities of issuers, which may also be considered counterparties as trading partners in other transactions. This may increase the risk of loss in the event of default or bankruptcy by the counterparty or if the counterparty otherwise fails to meet its contractual obligations. The Fund’s investment manager attempts to mitigate counterparty risk by (i) periodically assessing the creditworthiness of its trading partners, (ii) monitoring and/or limiting the amount of its net exposure to each individual counterparty based on its assessment and (iii) requiring collateral from the counterparty for certain transactions. Market events and changes in overall economic conditions may impact the assessment of such counterparty risk by the investment manager. In addition, declines in the values of underlying collateral received may expose the Fund to increased risk of loss.
The Fund has entered into master agreements with certain of its derivative counterparties that provide for general obligations, representations, agreements, collateral, events of default or termination and credit related contingent features. The credit related contingent features include, but are not limited to, a percentage decrease in the Fund’s net assets or NAV over a specified period of time. If these credit related contingent features were triggered, the derivatives counterparty could terminate the positions and demand payment or require additional collateral.
As of June 30, 2012, the Fund held written options and forward foreign currency contracts with credit related contingent features which had a liability position of $95,541. If a contingent feature in the master agreements would have been triggered, the Fund would have been required to pay this amount to its derivatives counterparties.
|
| Western Asset Inflation Management Fund Inc. 2012 Semi-Annual Report |
|
|
Notes to financial statements (unaudited) (cont’d)
(m) Security transactions and investment income. Security transactions are accounted for on a trade date basis. Interest income, adjusted for amortization of premium and accretion of discount, is recorded on the accrual basis. Dividend income is recorded on the ex-dividend date. The cost of investments sold is determined by use of the specific identification method. To the extent any issuer defaults or a credit event occurs that impacts the issuer, the Fund may halt any additional interest income accruals and consider the realizability of interest accrued up to the date of default or credit event.
(n) Distributions to shareholders. Distributions from net investment income of the Fund, if any, are declared and paid on a monthly basis. Distributions of net realized gains, if any, are declared at least annually. Distributions to shareholders of the Fund are recorded on the ex-dividend date and are determined in accordance with income tax regulations, which may differ from GAAP.
(o) Compensating balance arrangements. The Fund has an arrangement with its custodian bank whereby a portion of the custodian’s fees is paid indirectly by credits earned on the Fund’s cash on deposit with the bank.
(p) Federal and other taxes. It is the Fund’s policy to comply with the federal income and excise tax requirements of the Internal Revenue Code of 1986 (the “Code”), as amended, applicable to regulated investment companies. Accordingly, the Fund intends to distribute its taxable income and net realized gains, if any, to shareholders in accordance with timing requirements imposed by the Code. Therefore, no federal or state income tax provision is required in the Fund’s financial statements.
However, due to the timing of when distributions are made by the Fund, the Fund may be subject to an excise tax of 4% of the amount by which 98% of the Fund’s annual taxable income and 98.2% of net realized gains exceed the distributions from such taxable income and realized gains for the calendar year.
Management has analyzed the Fund’s tax positions taken on income tax returns for all open tax years and has concluded that as of June 30, 2012 no provision for income tax is required in the Fund’s financial statements. The Fund’s federal and state income and federal excise tax returns for tax years for which the applicable statutes of limitations have not expired are subject to examination by Internal Revenue Service and state departments of revenue.
(q) Reclassification. GAAP requires that certain components of net assets be reclassified to reflect permanent differences between financial and tax reporting. These reclassifications have no effect on net assets or net asset value per share.
|
| Western Asset Inflation Management Fund Inc. 2012 Semi-Annual Report |
|
|
2. Investment management agreement and other transactions with affiliates
Legg Mason Partners Fund Advisor, LLC (“LMPFA”) is the Fund’s investment manager. Western Asset Management Company (“Western Asset”), Western Asset Management Company Limited (“Western Asset Limited”) and Western Asset Management Company Pte. Ltd. (“Western Singapore”) are the Fund’s subadvisers. LMPFA, Western Asset, Western Asset Limited and Western Singapore are wholly-owned subsidiaries of Legg Mason, Inc. (“Legg Mason”).
LMPFA provides administrative and certain oversight services to the Fund. The Fund pays an investment management fee, calculated daily and paid monthly, at an annual rate of 0.60% of the Fund’s average daily net assets plus the proceeds of any outstanding borrowings used for leverage.
LMPFA delegates to Western Asset the day-to-day portfolio management of the Fund. Western Asset Limited and Western Singapore provide certain advisory services to the Fund relating to currency transactions and investment in non-U.S. dollar denominated securities. Western Asset Limited and Western Singapore do not receive any compensation from the Fund and are compensated by Western Asset for its services to the Fund. For its services, LMPFA pays Western Asset 70% of the net management fee it receives from the Fund. In turn, Western Asset pays Western Asset Limited and Western Singapore a subadvisory fee of 0.30% on assets managed by each subadviser.
All officers and one Director of the Fund are employees of Legg Mason or its affiliates and do not receive compensation from the Fund.
3. Investments
During the six months ended June 30, 2012, the aggregate cost of purchases and proceeds from sales of investments (excluding short-term investments) and U.S Government & Agency Obligations were as follows:
|
| Investments |
| U.S. Government & |
|
Purchases |
| $6,716,084 |
| $29,560,159 |
|
Sales |
| 4,215,071 |
| 31,445,536 |
|
At June 30, 2012, the aggregate gross unrealized appreciation and depreciation of investments for federal income tax purposes were substantially as follows:
Gross unrealized appreciation |
| $15,681,070 |
|
Gross unrealized depreciation |
| (2,625,664 | ) |
Net unrealized appreciation |
| $13,055,406 |
|
|
| Western Asset Inflation Management Fund Inc. 2012 Semi-Annual Report |
|
|
Notes to financial statements (unaudited) (cont’d)
During the six months ended June 30, 2012, written option transactions for the Fund were as follows:
|
| Number of Contracts |
| Premiums |
| |
Written options, outstanding as of December 31, 2011 |
| — |
| — |
| |
Options written |
| 570 |
| $ | 432,460 |
|
Options closed |
| (436) |
| (373,224 | ) | |
Options exercised |
| — |
| — |
| |
Options expired |
| — |
| — |
| |
Written options, outstanding as of June 30, 2012 |
| 134 |
| $ | 59,236 |
|
At June 30, 2012, the Fund had the following open futures contracts:
|
| Number of |
| Expiration |
| Basis |
| Market |
| Unrealized |
|
Contracts to Sell: |
|
|
|
|
|
|
|
|
|
|
|
U.S. Treasury 30-Year Bonds |
| 31 |
| 9/12 |
| $4,607,055 |
| $4,587,031 |
| $20,024 |
|
At June 30, 2012, the Fund had the following open forward foreign currency contracts:
Foreign Currency |
| Counterparty |
| Local |
| Market |
| Settlement |
| Unrealized |
| |
Contracts to Buy: |
|
|
|
|
|
|
|
|
|
|
| |
Australian Dollar |
| Citibank, N.A. |
| 1,310,000 |
| $1,335,255 |
| 8/16/12 |
| $ 46,084 |
|
|
Euro |
| JPMorgan Chase & Co. |
| 120,000 |
| 151,918 |
| 8/16/12 |
| (496 | ) |
|
Japanese Yen |
| Citibank, N.A. |
| 110,362,588 |
| 1,381,500 |
| 8/16/12 |
| (11,000 | ) |
|
Japanese Yen |
| Citibank, N.A. |
| 1,054,933 |
| 13,205 |
| 8/16/12 |
| (5 | ) |
|
|
|
|
|
|
|
|
|
|
| 34,583 |
|
|
Contracts to Sell: |
|
|
|
|
|
|
|
|
|
|
|
|
Australian Dollar |
| Citibank, N.A. |
| 1,310,000 |
| 1,335,255 |
| 8/16/12 |
| (20,199 | ) |
|
British Pound |
| Citibank, N.A. |
| 1,000,000 |
| 1,565,974 |
| 8/16/12 |
| (19,269 | ) |
|
Canadian Dollar |
| Citibank, N.A. |
| 1,200,000 |
| 1,177,525 |
| 8/16/12 |
| 16,742 |
|
|
Canadian Dollar |
| Citibank, N.A. |
| 1,200,000 |
| 1,177,525 |
| 8/16/12 |
| (11,072 | ) |
|
Canadian Dollar |
| Citibank, N.A. |
| 1,585,182 |
| 1,555,493 |
| 8/16/12 |
| 30,998 |
|
|
Canadian Dollar |
| Credit Suisse |
| 1,850,428 |
| 1,815,771 |
| 8/16/12 |
| 59,115 |
|
|
Euro |
| JPMorgan & Co. |
| 200,000 |
| 253,197 |
| 8/16/12 |
| 9,567 |
|
|
Japanese Yen |
| Citibank, N.A. |
| 112,184,159 |
| 1,404,302 |
| 8/16/12 |
| 1,409 |
|
|
|
|
|
|
|
|
|
|
|
| 67,291 |
|
|
Net unrealized gain on open forward foreign currency contracts |
|
|
| $101,874 |
|
| ||||||
4. Derivative instruments and hedging activities
Financial Accounting Standards Board Codification Topic 815 requires enhanced disclosure about an entity’s derivative and hedging activities.
|
| Western Asset Inflation Management Fund Inc. 2012 Semi-Annual Report |
|
|
Below is a table, grouped by derivative type, that provides information about the fair value and the location of derivatives within the Statement of Assets and Liabilities at June 30, 2012.
ASSET DERIVATIVES1 | |||||||
|
|
|
|
|
|
|
|
|
| Interest Rate |
| Foreign Exchange |
| Total |
|
Purchased options2 |
| — |
| $ 14,451 |
| $ 14,451 |
|
Futures contracts3 |
| $20,024 |
| — |
| 20,024 |
|
Forward foreign currency contracts |
| — |
| 163,915 |
| 163,915 |
|
Total |
| $20,024 |
| $178,366 |
| $198,390 |
|
LIABILITY DERIVATIVES1 | |||||||
|
|
|
|
|
|
|
|
|
| Interest Rate |
| Foreign Exchange |
| Total |
|
Written options |
| $33,500 |
| — |
| $33,500 |
|
Forward foreign currency contracts |
| — |
| $62,041 |
| 62,041 |
|
Total |
| $33,500 |
| $62,041 |
| $95,541 |
|
1 Generally, the balance sheet location for asset derivatives is receivables/net unrealized appreciation (depreciation) and for liability derivatives is payables/net unrealized appreciation (depreciation).
2 Market value of purchased options is reported in Investments at value in the Statement of Assets and Liabilities.
3 Includes cumulative appreciation (depreciation) of futures contracts as reported in the footnotes. Only variation margin is reported within the receivables and/or payables of the Statement of Assets and Liabilities.
The following tables provide information about the effect of derivatives and hedging activities on the Fund’s Statement of Operations for the six months ended June 30, 2012. The first table provides additional detail about the amounts and sources of gains (losses) realized on derivatives during the period. The second table provides additional information about the change in unrealized appreciation (depreciation) resulting from the Fund’s derivatives and hedging activities during the period.
AMOUNT OF REALIZED GAIN (LOSS) ON DERIVATIVES RECOGNIZED | ||||||||||
|
|
|
|
|
|
|
| |||
|
| Interest Rate |
| Foreign Exchange |
| Total |
| |||
Purchased options |
| $ (59,961 | ) | $ 5,894 |
| $ (54,067 | ) | |||
Written options |
| 265,853 |
| — |
| 265,853 |
| |||
Futures contracts |
| 79,019 |
| — |
| 79,019 |
| |||
Forward foreign currency contracts |
| — |
| (83,721 | ) | (83,721 | ) | |||
Total |
| $284,911 |
| $(77,827 | ) | $207,084 |
| |||
|
| Western Asset Inflation Management Fund Inc. 2012 Semi-Annual Report |
|
|
Notes to financial statements (unaudited) (cont’d)
CHANGE IN UNREALIZED APPRECIATION (DEPRECIATION) ON DERIVATIVES RECOGNIZED |
| ||||||||
|
|
|
|
|
|
|
| ||
|
| Interest Rate |
| Foreign Exchange |
| Total |
| ||
Purchased options |
| — |
| $(39,290 | ) | $(39,290 | ) | ||
Written options |
| $25,736 |
| — |
| 25,736 |
| ||
Futures contracts |
| 20,024 |
| — |
| 20,024 |
| ||
Forward foreign currency contracts |
| — |
| 61,542 |
| 61,542 |
| ||
Total |
| $45,760 |
| $ 22,252 |
| $ 68,012 |
| ||
During the six months ended June 30, 2012, the volume of derivative activity for the Fund was as follows:
|
| Average Market |
|
Purchased options |
| $ 13,647 |
|
Written options |
| 15,294 |
|
Forward foreign currency contracts (to buy) |
| 5,535,512 |
|
Forward foreign currency contracts (to sell) |
| 11,937,290 |
|
Futures contracts (to buy)† |
| 319,681 |
|
Futures contracts (to sell) |
| 665,388 |
|
† At June 30, 2012 there were no open positions held in this derivative.
5. Distributions subsequent to June 30, 2012
On May 10, 2012, the Fund’s Board of Directors (the “Board”) declared three distributions, each in the amount of $0.0500 per share, payable on June 29, 2012, July 27, 2012 and August 31, 2012 to shareholders of record on June 22, 2012, July 20, 2012 and August 24, 2012, respectively. The July and August record date distributions were made subsequent to the period end of this report.
On August 8, 2012, the Board declared a distribution in the amount of $0.0500 per share payable on September 28, 2012 to shareholders of record on September 21, 2012.
6. Capital loss carryforward
As of December 31, 2011, the Fund had a net capital loss carryforward of approximately $10,743,167, of which $98,619 expires in 2013, $5,900,240 expires in 2014, $2,444,775 expires in 2016 and $2,299,533 expires in 2018. These amounts will be available to offset any future taxable capital gains.
Under the recently enacted Regulated Investment Company Modernization Act of 2010, the Fund will be permitted to carry forward capital losses incurred in taxable years beginning after December 22, 2010 for an unlimited period. However, any losses incurred during those future years will be required to be utilized prior to the losses incurred in pre-enactment taxable years. As a result of this ordering rule, pre-enactment capital loss carryforwards may be more likely to expire unused. Additionally, post-enactment capital losses that are
|
| Western Asset Inflation Management Fund Inc. 2012 Semi-Annual Report |
|
|
carried forward will retain their character as either short-term or long-term capital losses rather than being considered all short-term as under previous law.
7. Recent accounting pronouncement
In May 2011, the Financial Accounting Standards Board issued Accounting Standards Update No. 2011-04, Fair Value Measurement (Topic 820) — Amendments to Achieve Common Fair Value Measurement and Disclosure Requirements in U.S. GAAP and IFRSs (“ASU No. 2011-04”). ASU No. 2011-04 establishes common requirements for measuring fair value and for disclosing information about fair value measurements. ASU No. 2011-04 is effective during interim and annual periods beginning after December 15, 2011. Management has evaluated ASU No. 2011-04 and concluded that it does not materially impact the financial statement amounts; however, as required, additional disclosure has been included about fair value measurement.
|
| Western Asset Inflation Management Fund Inc. |
|
|
Additional shareholder information (unaudited)
Results of annual meeting of shareholders
The Annual Meeting of Shareholders of Western Asset Inflation Management Fund Inc. was held on April 27, 2012, for the purpose of considering and voting upon Proposal 1: the election of Directors and Proposal 2: stockholder proposal regarding termination of existing investment management agreement. The following table provides information concerning the matters voted upon at the Meeting:
Proposal 1: Election of directors
Nominees |
| Votes For |
| Votes Withheld |
|
Carol L. Colman |
| 4,535,588 |
| 2,169,079 |
|
Daniel P. Cronin |
| 4,540,566 |
| 2,164,101 |
|
Paolo M. Cucchi |
| 4,526,816 |
| 2,177,851 |
|
At June 30, 2012, in addition to Carol L. Colman, Daniel P. Cronin and Paolo M. Cucchi, the other Directors of the Fund were as follows:
Leslie H. Gelb
R. Jay Gerken
William R. Hutchinson
Riordan Roett
Jeswald W. Salacuse
Proposal 2: Stockholder proposal regarding termination of existing investment management agreement
|
| Votes For |
| Votes Against |
| Abstain |
|
Stockholder proposal regarding termination of existing investment management agreement |
| 2,177,990 |
| 2,440,156 |
| 55,252 |
|
|
| Western Asset Inflation Management Fund Inc. |
|
|
Dividend reinvestment plan (unaudited)
Unless you elect to receive distributions in cash (i.e., opt-out), all distributions on your Common Shares will be automatically reinvested by American Stock Transfer and Trust Company, as agent for the Common Shareholders (the “Plan Agent”), in additional Common Shares under the Dividend Reinvestment Plan (the “Plan”). You may elect not to participate in the Plan by contacting the Plan Agent.
If you do not participate, you will receive all cash distributions paid by check mailed directly to you by American Stock Transfer and Trust Company, as dividend paying agent.
If you participate in the Plan, the number of Common Shares you will receive will be determined as follows:
(1) If the market price of the Common Shares on the record date (or, if the record date is not a New York Stock Exchange trading day, the immediately preceding trading day) for determining shareholders eligible to receive the relevant distribution (the “determination date”) is equal to or exceeds 98% of the net asset value per share of the Common Shares, the Fund will issue new Common Shares at a price equal to the greater of (a) 98% of the net asset value per share at the close of trading on the Exchange on the determination date or (b) 95% of the market price per share of the Common Shares on the determination date.
(2) If 98% of the net asset value per share of the Common Shares exceeds the market price of the Common Shares on the determination date, the Plan Agent will receive the dividend or distribution in cash and will buy Common Shares in the open market, on the Exchange or elsewhere, for your account as soon as practicable commencing on the trading day following the determination date and terminating no later than the earlier of (a) 30 days after the distribution payment date, or (b) the record date for the next succeeding distribution to be made to the Common Shareholders; except when necessary to comply with applicable provisions of the federal securities laws. If during this period: (i) the market price rises so that it equals or exceeds 98% of the net asset value per share of the Common Shares at the close of trading on the Exchange on the determination date before the Plan Agent has completed the open market purchases or (ii) if the Plan Agent is unable to invest the full amount eligible to be reinvested in open market purchases, the Plan Agent will cease purchasing Common Shares in the open market and the Fund shall issue the remaining Common Shares at a price per share equal to the greater of (a) 98% of the net asset value per share at the close of trading on the Exchange on the determination date or (b) 95% of the then current market price per share.
The Plan Agent maintains all participants’ accounts in the Plan and gives written confirmation of all transactions in the accounts, including information you
|
| Western Asset Inflation Management Fund Inc. |
|
|
Dividend reinvestment plan (unaudited) (cont’d)
may need for tax records. Common Shares in your account will be held by the Plan Agent in non-certificated form. Any proxy you receive will include all Common Shares you have received under the Plan.
You may withdraw from the Plan by notifying the Plan Agent in writing at 59 Maiden Lane, New York, New York 10038 or by calling the Plan Agent at 1-888-888-0151 or by accessing the Plan Agent’s website at www.amstock.com. Such withdrawal will be effective immediately if notice is received by the Plan Agent not less than ten business days prior to any distribution record date; otherwise such withdrawal will be effective as soon as practicable after the Plan Agent’s investment of the most recently declared distribution on the Common Shares. The Plan may be terminated by the Fund upon notice in writing mailed to Common Shareholders at least 30 days prior to the record date for the payment of any distribution by the Fund for which the termination is to be effective. Upon any termination, you will be sent a certificate or certificates for the full Common Shares held for you under the Plan and cash for any fractional Common Shares. You may elect to notify the Plan Agent in advance of such termination to have the Plan Agent sell part or all of your shares on your behalf. You will be charged a service charge and the Plan Agent is authorized to deduct brokerage charges actually incurred for this transaction from the proceeds.
There is no service charge for reinvestment of your distributions in Common Shares. However, all participants will pay a pro rata share of brokerage commissions incurred by the Plan Agent when it makes open market purchases. Because all dividends and distributions will be automatically reinvested in additional Common Shares, this allows you to add to your investment through dollar cost averaging, which may lower the average cost of your Common Shares over time. Dollar cost averaging is a technique for lowering the average cost per share over time if the Fund’s net asset value declines. While dollar cost averaging has definite advantages, it cannot assure profit or protect against loss in declining markets. Investors will be subject to income tax on amounts reinvested under the plan.
Automatically reinvesting distributions does not mean that you do not have to pay income taxes due upon receiving distributions.
The Fund reserves the right to amend or terminate the Plan if, in the judgment of the Board of Directors, the change is warranted. There is no direct service charge to participants in the Plan; however, the Fund reserves the right to amend the Plan to include a service charge payable by the participants. Additional information about the Plan and your account may be obtained from the Plan Agent at 1-888-888-0151.
Western Asset
Inflation Management Fund Inc.
Directors |
| Western Asset Inflation Management Fund Inc. |
| Independent registered public accounting firm |
Carol L. Colman |
| 620 Eighth Avenue |
| KPMG LLP |
Daniel P. Cronin |
| 49th Floor |
| 345 Park Avenue |
Paolo M. Cucchi |
| New York, NY 10018 |
| New York, NY 10154 |
Leslie H. Gelb |
|
|
|
|
R. Jay Gerken |
| Investment manager |
| Legal counsel |
Chairman |
| Legg Mason Partners Fund Advisor, LLC |
| Simpson Thacher & Bartlett LLP |
William R. Hutchinson |
|
|
| 425 Lexington Avenue |
Riordan Roett |
| Subadvisers |
| New York, NY 10017 |
Jeswald W. Salacuse |
| Western Asset Management Company |
|
|
|
| Western Asset Management Company Limited |
| New York Stock Exchange Symbol |
Officers |
| Western Asset Management Company Pte. Ltd. |
| IMF |
R. Jay Gerken |
|
|
|
|
President and Chief Executive Officer |
| Custodian |
|
|
Richard F. Sennett |
| State Street Bank and Trust Company |
|
|
Principal Financial Officer |
| 1 Lincoln Street |
|
|
Ted P. Becker |
| Boston, MA 02111 |
|
|
Chief Compliance Officer |
|
|
|
|
Vanessa A. Williams |
| Transfer agent |
|
|
Identity Theft Prevention Officer |
| American Stock Transfer & Trust Company |
|
|
Robert I. Frenkel |
| 59 Maiden Lane |
|
|
Secretary and Chief Legal Officer |
| New York, NY 10038 |
|
|
Thomas C. Mandia |
|
|
|
|
Assistant Secretary |
|
|
|
|
Steven Frank |
|
|
|
|
Treasurer |
|
|
|
|
Jeanne M. Kelly |
|
|
|
|
Senior Vice President |
|
|
|
|
Legg Mason Funds Privacy and Security Notice
Your Privacy and the Security of Your Personal Information is Very Important to the Legg Mason Funds
This Privacy and Security Notice (the “Privacy Notice”) addresses the Legg Mason Funds’ privacy and data protection practices with respect to nonpublic personal information the Funds receive. The Legg Mason Funds include any funds sold by the Funds’ distributor, Legg Mason Investor Services, LLC, as well as Legg Mason-sponsored closed-end funds and certain closed-end funds managed or sub-advised by Legg Mason or its affiliates. The provisions of this Privacy Notice apply to your information both while you are a shareholder and after you are no longer invested with the Funds.
The Type of Nonpublic Personal Information the Funds Collect About You
The Funds collect and maintain nonpublic personal information about you in connection with your shareholder account. Such information may include, but is not limited to:
· Personal information included on applications or other forms;
· Account balances, transactions, and mutual fund holdings and positions;
· Online account access user IDs, passwords, security challenge question responses; and
· Information received from consumer reporting agencies regarding credit history and creditworthiness (such as the amount of an individual’s total debt, payment history, etc.).
How the Funds Use Nonpublic Personal Information About You
The Funds do not sell or share your nonpublic personal information with third parties or with affiliates for their marketing purposes, or with other financial institutions or affiliates for joint marketing purposes, unless you have authorized the Funds to do so. The Funds do not disclose any nonpublic personal information about you except as may be required to perform transactions or services you have authorized or as permitted or required by law. The Funds may disclose information about you to:
· Employees, agents, and affiliates on a “need to know” basis to enable the Funds to conduct ordinary business or comply with obligations to government regulators;
· Service providers, including the Funds’ affiliates, who assist the Funds as part of the ordinary course of business (such as printing, mailing services, or processing or servicing your account with us) or otherwise perform services on the Funds’ behalf, including companies that may perform marketing services solely for the Funds;
· The Funds’ representatives such as legal counsel, accountants and auditors; and
· Fiduciaries or representatives acting on your behalf, such as an IRA custodian or trustee of a grantor trust.
|
|
|
|
|
|
| NOT PART OF THE SEMI-ANNUAL REPORT |
|
|
|
|
|
|
|
Legg Mason Funds Privacy and Security Notice (cont’d)
Except as otherwise permitted by applicable law, companies acting on the Funds’ behalf are contractually obligated to keep nonpublic personal information the Funds provide to them confidential and to use the information the Funds share only to provide the services the Funds ask them to perform.
The Funds may disclose nonpublic personal information about you when necessary to enforce their rights or protect against fraud, or as permitted or required by applicable law, such as in connection with a law enforcement or regulatory request, subpoena, or similar legal process. In the event of a corporate action or in the event a Fund service provider changes, the Funds may be required to disclose your nonpublic personal information to third parties. While it is the Funds’ practice to obtain protections for disclosed information in these types of transactions, the Funds cannot guarantee their privacy policy will remain unchanged.
Keeping You Informed of the Funds’ Privacy and Security Practices
The Funds will notify you annually of their privacy policy as required by federal law. While the Funds reserve the right to modify this policy at any time they will notify you promptly if this privacy policy changes.
The Funds’ Security Practices
The Funds maintain appropriate physical, electronic and procedural safeguards designed to guard your nonpublic personal information. The Funds’ internal data security policies restrict access to your nonpublic personal information to authorized employees, who may use your nonpublic personal information for Fund business purposes only.
Although the Funds strive to protect your nonpublic personal information, they cannot ensure or warrant the security of any information you provide or transmit to them, and you do so at your own risk. In the event of a breach of the confidentiality or security of your nonpublic personal information, the Funds will attempt to notify you as necessary so you can take appropriate protective steps. If you have consented to the Funds using electronic communications or electronic delivery of statements, they may notify you under such circumstances using the most current email address you have on record with them.
In order for the Funds to provide effective service to you, keeping your account information accurate is very important. If you believe that your account information is incomplete, not accurate or not current, or if you have questions about the Funds’ privacy practices, write the Funds using the contact information on your account statements, email the Funds by clicking on the Contact Us section of the Funds’ website at www.leggmason.com, or contact the Fund at 1-888-777-0102.
Revised April 2011
|
|
|
|
|
|
| NOT PART OF THE SEMI-ANNUAL REPORT |
|
|
|
|
|
|
|
![]()
Western Asset Inflation Management Fund Inc.
Western Asset Inflation Management Fund Inc.
620 Eighth Avenue
49th Floor
New York, NY 10018
Notice is hereby given in accordance with Section 23(c) of the Investment Company Act of 1940, as amended, that from time to time, the Fund may purchase, at market prices, shares of its common stock in the open market.
The Fund files its complete schedule of portfolio holdings with the Securities and Exchange Commission (“SEC”) for the first and third quarters of each fiscal year on Form N-Q. The Fund’s Forms N-Q are available on the SEC’s website at www.sec.gov. The Fund’s Forms N-Q may be reviewed and copied at the SEC’s Public Reference Room in Washington D.C., and information on the operation of the Public Reference Room may be obtained by calling 1-800-SEC-0330. To obtain information on Form N-Q from the Fund, shareholders can call 1-888-777-0102.
Information on how the Fund voted proxies relating to portfolio securities during the prior 12-month period ended June 30th of each year and a description of the policies and procedures that the Fund uses to determine how to vote proxies relating to portfolio transactions are available (1) without charge, upon request, by calling 1-888-777-0102, (2) on the Fund’s website at www.lmcef.com and (3) on the SEC’s website at www.sec.gov.
This report is transmitted to the shareholders of Western Asset Inflation Management Fund Inc. for their information. This is not a prospectus, circular or representation intended for use in the purchase or sale of shares of the Fund or any securities mentioned in the report.
American Stock
Transfer & Trust Company
59 Maiden Lane
New York, NY 10038
WAS04053 8/12 SR12-1730
ITEM 2. CODE OF ETHICS.
Not applicable.
ITEM 3. AUDIT COMMITTEE FINANCIAL EXPERT.
Not applicable.
ITEM 4. PRINCIPAL ACCOUNTANT FEES AND SERVICES.
Not applicable.
ITEM 5. AUDIT COMMITTEE OF LISTED REGISTRANTS.
Not applicable.
ITEM 6. SCHEDULE OF INVESTMENTS.
Included herein under Item 1.
ITEM 7. DISCLOSURE OF PROXY VOITNG POLIIES AND PROCEDURES FOR CLOSED-END MANAGEMENT INVESTMENT COMPANIES.
Not applicable.
ITEM 8. PORTFOLIO MANAGERS OF CLOSED-END MANAGEMENT INVESTMENT COMPANIES.
Not applicable.
ITEM 9. PURCHASES OF EQUITY SECURITIES BY CLOSED-END MANAGEMENT INVESTMENT COMPANY AND AFFILIATED PURCHASERS.
Not applicable.
ITEM 10. SUBMISSION OF MATTERS TO A VOTE OF SECURITY HOLDERS.
Not applicable.
ITEM 11. CONTROLS AND PROCEDURES.
(a) The registrant’s principal executive officer and principal financial officer have concluded that the registrant’s disclosure controls and procedures (as defined in Rule 30a- 3(c) under the Investment Company Act of 1940, as amended (the “1940 Act”)) are effective as of a date within 90 days of the filing date of this report that includes the disclosure required by this paragraph, based on their evaluation of the disclosure controls and procedures required by Rule 30a-3(b) under the 1940 Act and 15d-15(b) under the Securities Exchange Act of 1934.
(b) Disclosed in this report any change in the registrant’s internal control over financial reporting that occurred during the second fiscal quarter of the period covered by this report that has materially affected, or is reasonably likely to materially affect, the registrant’s internal control over financial reporting; and,
ITEM 12. EXHIBITS.
(a) (1) Not applicable.
Exhibit 99.CODE ETH
(a) (2) Certifications pursuant to section 302 of the Sarbanes-Oxley Act of 2002 attached hereto.
Exhibit 99.CERT
(b) Certifications pursuant to Section 906 of the Sarbanes-Oxley Act of 2002 attached hereto.
Exhibit 99.906CERT
SIGNATURES
Pursuant to the requirements of the Securities Exchange Act of 1934 and the Investment Company Act of 1940, the registrant has duly caused this Report to be signed on its behalf by the undersigned, there unto duly authorized.
Western Asset Inflation Management Fund Inc.
By: | /s/ R. Jay Gerken |
|
| R. Jay Gerken | |
| Chief Executive Officer | |
| Western Asset Inflation Management Fund Inc. | |
|
| |
Date: | August 23, 2012 | |
Pursuant to the requirements of the Securities Exchange Act of 1934 and the Investment Company Act of 1940, this report has been signed below by the following persons on behalf of the registrant and in the capacities and on the dates indicated.
By: | /s/ R. Jay Gerken |
|
| R. Jay Gerken | |
| Chief Executive Officer | |
| Western Asset Inflation Management Fund Inc. | |
|
| |
Date: | August 23, 2012 | |
By: | /s/ Richard F. Sennett |
|
| Richard F. Sennett | |
| Principal Financial Officer | |
| Western Asset Inflation Management Fund Inc. | |
|
| |
|
| |
Date: | August 23, 2012 | |