Exhibit 99.1
| INTERMOUNTAIN COMMUNITY BANCORP Annual Shareholder Meeting April 28, 2010 3/21/10 |
| Forward Looking Statements Disclosure This presentation contains forward-looking statements within the meaning of the Private Securities Litigation Reform Act of 1995. Such forward-looking statements may include but are not limited to statements about the Company's plans, objectives, expectations and intentions and other statements contained in this report that are not historical facts. These forward-looking statements are inherently subject to significant business, economic and competitive uncertainties and contingencies, many of which are beyond the Company's control. Actual results may differ materially from the results discussed in these forward-looking statements because of numerous possible risks and uncertainties. These include but are not limited to the following and the other risks described in the "Risk Factors," "Business," and "Management's Discussion and Analysis of Financial Condition and Results of Operations" sections, as applicable, of the Company's Annual Report on Form 10-K for the fiscal year ended December 31, 2009; the possibility of adverse economic developments that may, among other things, increase default and delinquency risks in the Company's loan portfolio; shifts in interest rates that may result in lower interest rate margins; shifts in the demand for the Company's loan and other products; lower-than-expected revenue or cost savings in connection with acquisitions; changes in accounting policies; changes in the monetary and fiscal policies of the federal government; and changes in laws, regulations and the competitive environment. Readers are cautioned that forward-looking statements in this release speak only as of the date of this release. The Company does not undertake any obligation to update any forward-looking statement, whether as a result of new information, future events or otherwise. |
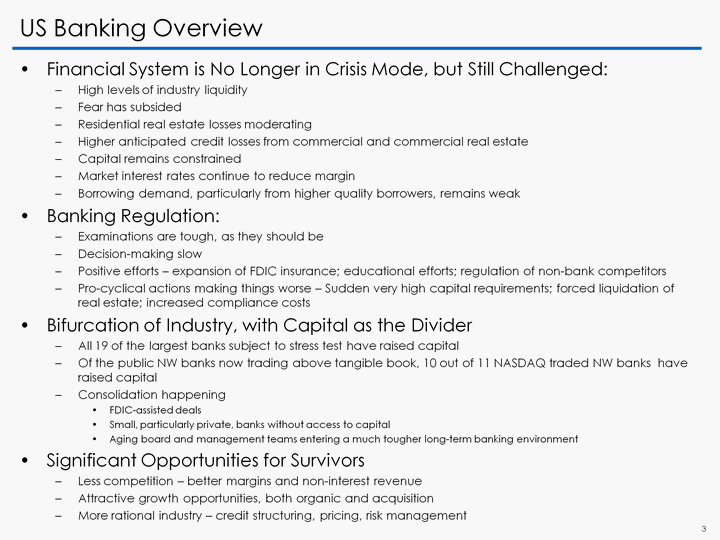
| US Banking Overview Financial System is No Longer in Crisis Mode, but Still Challenged: High levels of industry liquidity Fear has subsided Residential real estate losses moderating Higher anticipated credit losses from commercial and commercial real estate Capital remains constrained Market interest rates continue to reduce margin Borrowing demand, particularly from higher quality borrowers, remains weak Banking Regulation: Examinations are tough, as they should be Decision-making slow Positive efforts - expansion of FDIC insurance; educational efforts; regulation of non-bank competitors Pro-cyclical actions making things worse - Sudden very high capital requirements; forced liquidation of real estate; increased compliance costs Bifurcation of Industry, with Capital as the Divider All 19 of the largest banks subject to stress test have raised capital Of the public NW banks now trading above tangible book, 10 out of 11 NASDAQ traded NW banks have raised capital Consolidation happening FDIC-assisted deals Small, particularly private, banks without access to capital Aging board and management teams entering a much tougher long-term banking environment Significant Opportunities for Survivors Less competition - better margins and non-interest revenue Attractive growth opportunities, both organic and acquisition More rational industry - credit structuring, pricing, risk management |
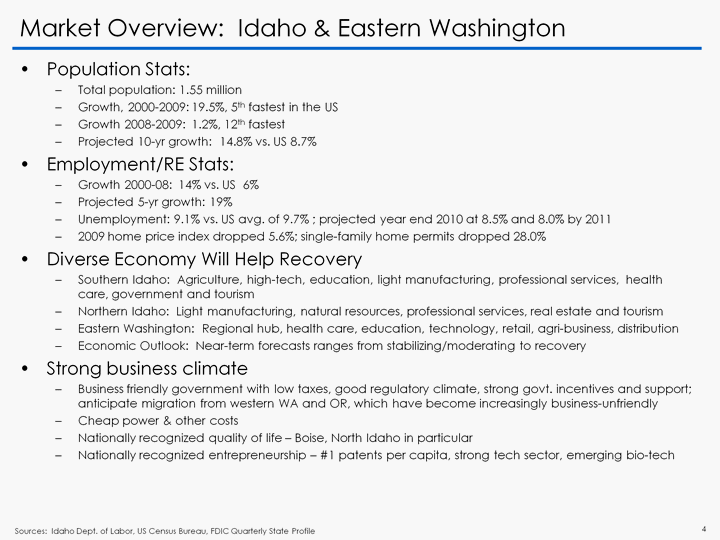
| Market Overview: Idaho & Eastern Washington Population Stats: Total population: 1.55 million Growth, 2000-2009: 19.5%, 5th fastest in the US Growth 2008-2009: 1.2%, 12th fastest Projected 10-yr growth: 14.8% vs. US 8.7% Employment/RE Stats: Growth 2000-08: 14% vs. US 6% Projected 5-yr growth: 19% Unemployment: 9.1% vs. US avg. of 9.7% ; projected year end 2010 at 8.5% and 8.0% by 2011 2009 home price index dropped 5.6%; single-family home permits dropped 28.0% Diverse Economy Will Help Recovery Southern Idaho: Agriculture, high-tech, education, light manufacturing, professional services, health care, government and tourism Northern Idaho: Light manufacturing, natural resources, professional services, real estate and tourism Eastern Washington: Regional hub, health care, education, technology, retail, agri-business, distribution Economic Outlook: Near-term forecasts ranges from stabilizing/moderating to recovery Strong business climate Business friendly government with low taxes, good regulatory climate, strong govt. incentives and support; anticipate migration from western WA and OR, which have become increasingly business-unfriendly Cheap power & other costs Nationally recognized quality of life - Boise, North Idaho in particular Nationally recognized entrepreneurship - #1 patents per capita, strong tech sector, emerging bio-tech Sources: Idaho Dept. of Labor, US Census Bureau, FDIC Quarterly State Profile |

| IMCB Banking Market IMCB Banking Market Asset quality ratios are stressed and worsening Capital access is limited, esp. for: Highly distressed banks Smaller privately held banks Reasonable chance of some failures Asset quality trends: Residential construction & development loans created losses in 2009; will continue in 2010 More stress on Commercial Real Estate and Commercial Loan portfolios in 2010, 2011 Many banks have been less aggressive in identifying problem loans early; big increase in 4Q Opportunities exist to increase market share from distressed banks |
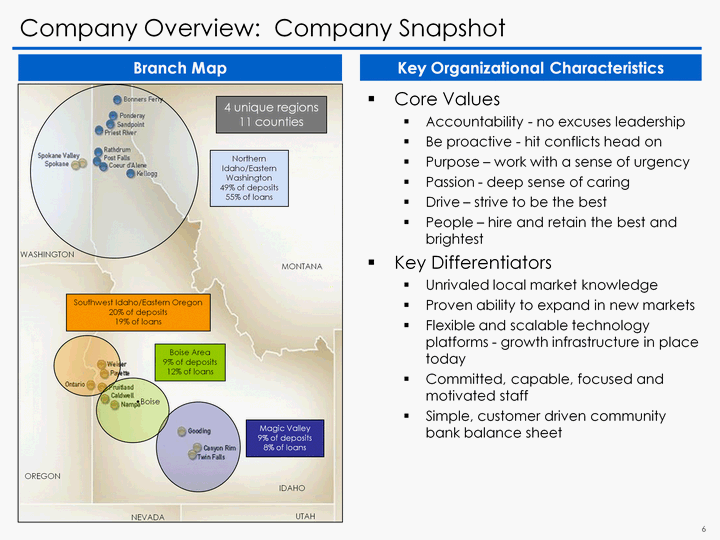
| Company Overview: Company Snapshot Company Overview: Company Snapshot Core Values Accountability - no excuses leadership Be proactive - hit conflicts head on Purpose - work with a sense of urgency Passion - deep sense of caring Drive - strive to be the best People - hire and retain the best and brightest Key Differentiators Unrivaled local market knowledge Proven ability to expand in new markets Flexible and scalable technology platforms - growth infrastructure in place today Committed, capable, focused and motivated staff Simple, customer driven community bank balance sheet Branch Map Key Organizational Characteristics 4 unique regions 11 counties Northern Idaho/Eastern Washington 49% of deposits 55% of loans Southwest Idaho/Eastern Oregon 20% of deposits 19% of loans Boise Area 9% of deposits 12% of loans Magic Valley 9% of deposits 8% of loans IDAHO UTAH NEVADA OREGON WASHINGTON MONTANA Boise |

| Company Strengths: Why the Future Looks Brighter Robust risk management function - "seasoned by recent experiences" Refined credit forecasting system with defined future loss projections (model based and loan-level) Integrated credit, liquidity and capital risk management program - comprehensive risk perspective Granular loan portfolio - limited concentrations, small average loan size Aggressive credit management is reducing concentration risk and exposure to problem assets NPA's at lowest level in over a year, C&D loans reduced by nearly 50% from peak in 2007 Credit team is deep and experienced - department leaders have 20+ years experience in credit Strong Credit Function & Aggressive Problem Asset Resolution Core deposit funding a long-time core element of Intermountain's business plan 62% of deposits are transaction accounts, including 21% noninterest bearing Local deposits comprise 93% of deposits Continued growth in deposit market share for the past 10 years Limited borrowings or non-core funding reliance Strong & Growing Deposit Franchise Strong management team with solid foundation & extensive knowledge of the local market area Average of 20+ years banking experience Younger, but much wiser, management team is willing and able to continue learning Energized & Experienced Leadership Net interest income driven by funding, not lending Higher margin, lower risk Asset sensitive and well positioned for rising rates Increasing non-interest income diversification: investment services, mortgage banking, deposit products Continued cost savings initiatives will drive further profitability Investment in scalable infrastructure sets stage for profitable growth opportunities going forward Well Positioned for Future Earnings Growth Strong and growing market share in core markets Meaningful expansion opportunity in larger contiguous markets & growth markets in the current footprint Many regional competitors are weakened - markets are in flux, customer and talent shake-up Community banking business model remains intact - near-term focus shifts to reflect market conditions Attractive Market Dynamics & Intact Business Model |
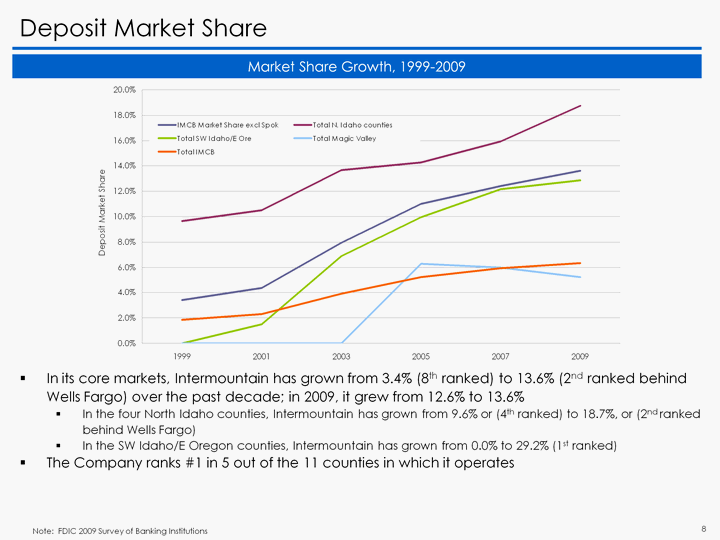
| Deposit Market Share Market Share Growth, 1999-2009 In its core markets, Intermountain has grown from 3.4% (8th ranked) to 13.6% (2nd ranked behind Wells Fargo) over the past decade; in 2009, it grew from 12.6% to 13.6% In the four North Idaho counties, Intermountain has grown from 9.6% or (4th ranked) to 18.7%, or (2nd ranked behind Wells Fargo) In the SW Idaho/E Oregon counties, Intermountain has grown from 0.0% to 29.2% (1st ranked) The Company ranks #1 in 5 out of the 11 counties in which it operates Note: FDIC 2009 Survey of Banking Institutions |
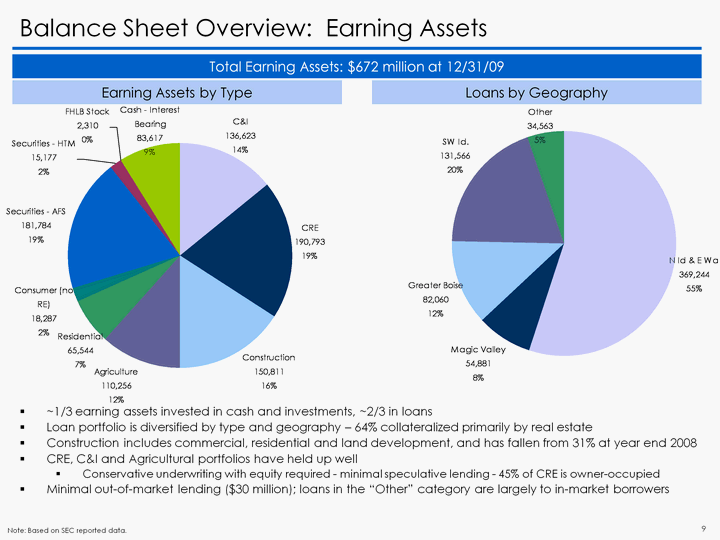
| ~1/3 earning assets invested in cash and investments, ~2/3 in loans Loan portfolio is diversified by type and geography - 64% collateralized primarily by real estate Construction includes commercial, residential and land development, and has fallen from 31% at year end 2008 CRE, C&I and Agricultural portfolios have held up well Conservative underwriting with equity required - minimal speculative lending - 45% of CRE is owner-occupied Minimal out-of-market lending ($30 million); loans in the "Other" category are largely to in-market borrowers Balance Sheet Overview: Earning Assets Total Earning Assets: $672 million at 12/31/09 Earning Assets by Type Loans by Geography C&I CRE Construction Agriculture Residential Consumer (no RE) Securities - AFS Securities - HTM FHLB Stock Cash - Interest Bearing 12/31/2009 136623 190793 150811 110256 65544 18287 181784 15177 2310 83617 N Id & E Wa Magic Valley Greater Boise SW Id. Other 12/31/2009 369244 54881 82060 131566 34563 Note: Based on SEC reported data. |
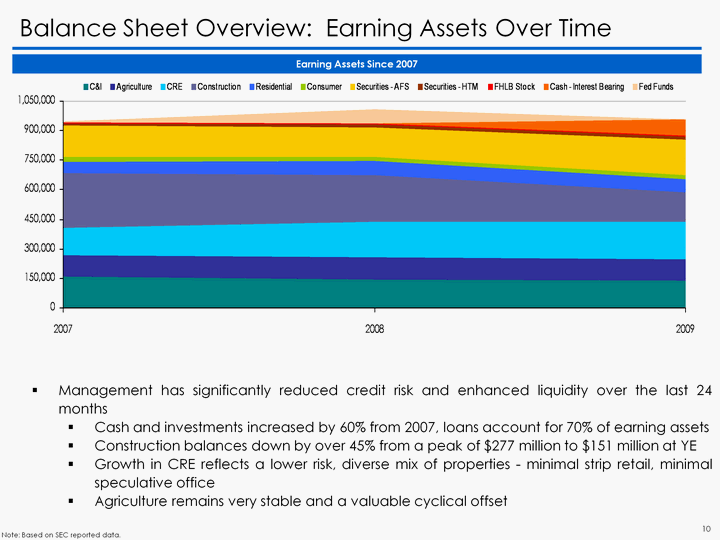
| Balance Sheet Overview: Earning Assets Over Time Earning Assets Since 2007 Management has significantly reduced credit risk and enhanced liquidity over the last 24 months Cash and investments increased by 60% from 2007, loans account for 70% of earning assets Construction balances down by over 45% from a peak of $277 million to $151 million at YE Growth in CRE reflects a lower risk, diverse mix of properties - minimal strip retail, minimal speculative office Agriculture remains very stable and a valuable cyclical offset Note: Based on SEC reported data. 2007 2008 2009 C&I 161331 144553 136623 Agriculture 108102 112358 110256 CRE 137913 180245 190793 Construction 277414 236571 150811 Residential 57910 72301 65544 Consumer 26286 23245 18287 Securities - AFS 158791 147618 181784 Securities - HTM 11324 15177 17604 FHLB Stock 1779 2310 2310 Cash - Interest Bearing 149 1354 83617 Fed Funds 6565 71450 0 |
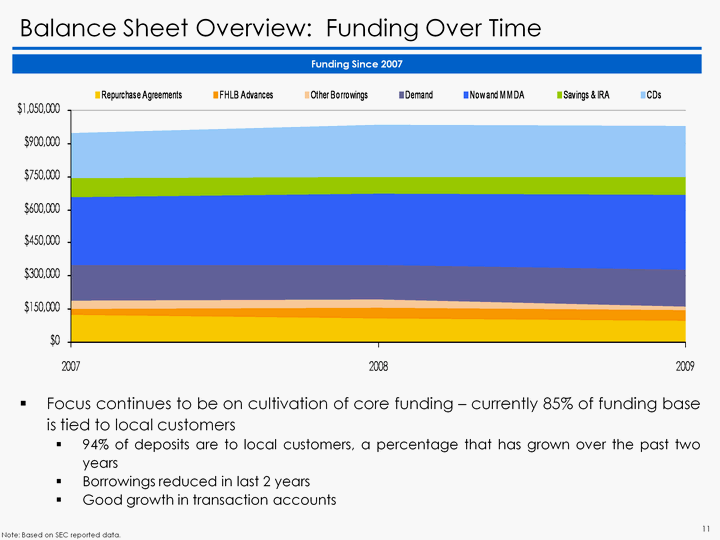
| Balance Sheet Overview: Funding Over Time Funding Since 2007 Focus continues to be on cultivation of core funding - currently 85% of funding base is tied to local customers 94% of deposits are to local customers, a percentage that has grown over the past two years Borrowings reduced in last 2 years Good growth in transaction accounts Note: Based on SEC reported data. 2007 2008 2009 Repurchase Agreements 124127 109006 95233 FHLB Advances 29000 46000 49000 Other Borrowings 36998 40613 16527 Demand 159069 154265 168244 Now and MMDA 308857 321556 340070 Savings & IRA 87149 78671 77623 CDs 202763 235920 233384 |
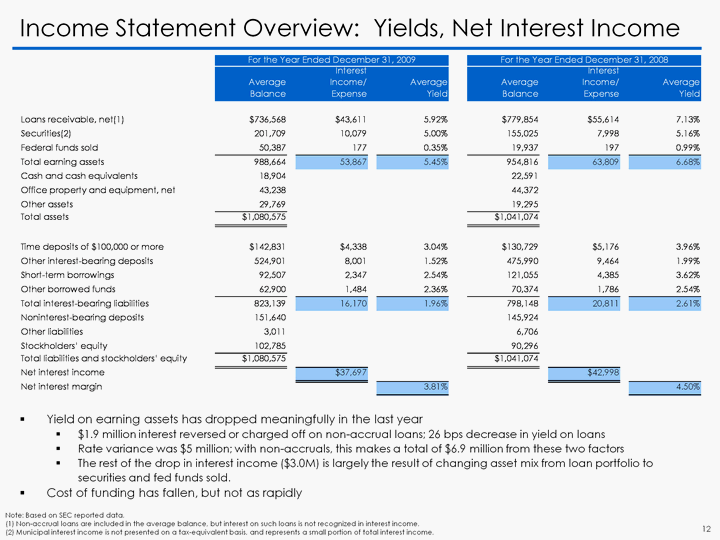
| Income Statement Overview: Yields, Net Interest Income Yield on earning assets has dropped meaningfully in the last year $1.9 million interest reversed or charged off on non-accrual loans; 26 bps decrease in yield on loans Rate variance was $5 million; with non-accruals, this makes a total of $6.9 million from these two factors The rest of the drop in interest income ($3.0M) is largely the result of changing asset mix from loan portfolio to securities and fed funds sold. Cost of funding has fallen, but not as rapidly Note: Based on SEC reported data. (1) Non-accrual loans are included in the average balance, but interest on such loans is not recognized in interest income. (2) Municipal interest income is not presented on a tax-equivalent basis, and represents a small portion of total interest income. |

| Income Statement Overview: Net Interest Income Net Interest Income/Average Assets: Panhandle State Bank vs. Peer Group IMCB's core deposit base and disciplined loan pricing have consistently generated superior net interest income Although non-accrual interest reversals and the very low level of market rates has compressed this variance, the spread is still wide and places the Bank in the 86th percentile of its peer group Intermountain is asset sensitive and positioned well for increased rates going forward As renewals and new loans were originated over the past 2 years, we have been widening spreads Variable rates comprise over 50% of the loan portfolio; the investment portfolio duration is short and the large fed funds sold position will reprice rapidly IMCB's deposit pricing is based on a comprehensive customer profit system that includes market rates, risk factors, non-interest fees and origination, activity and maintenance costs Officer's performance plans are based on risk management and profitability Note: Based on Call Report data. Peer Group #2 as defined by FFIEC UBPR. All commercial banks nationwide with assets between $1 billion and $3.0 billion in assets. |
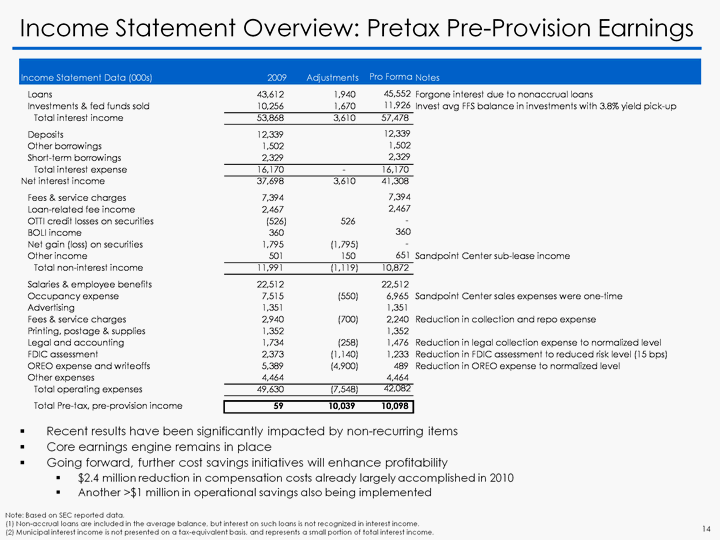
| Income Statement Overview: Pretax Pre-Provision Earnings Recent results have been significantly impacted by non-recurring items Core earnings engine remains in place Going forward, further cost savings initiatives will enhance profitability $2.4 million reduction in compensation costs already largely accomplished in 2010 Another >$1 million in operational savings also being implemented Note: Based on SEC reported data. (1) Non-accrual loans are included in the average balance, but interest on such loans is not recognized in interest income. (2) Municipal interest income is not presented on a tax-equivalent basis, and represents a small portion of total interest income. |
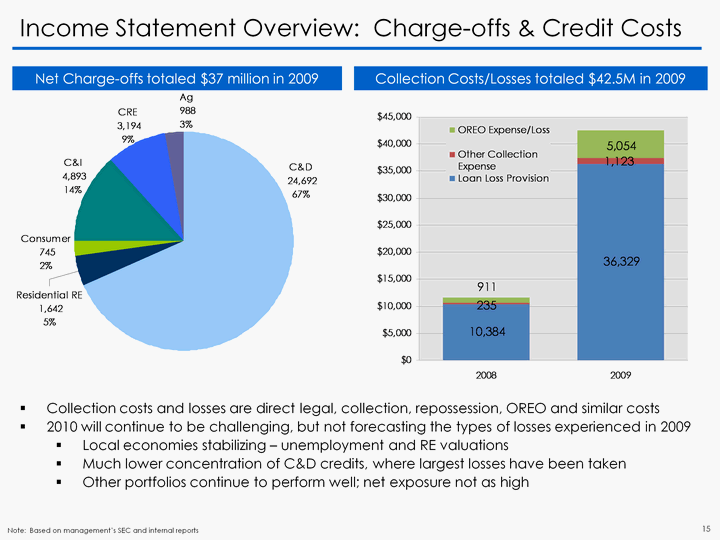
| Income Statement Overview: Charge-offs & Credit Costs Net Charge-offs totaled $37 million in 2009 Collection Costs/Losses totaled $42.5M in 2009 Collection costs and losses are direct legal, collection, repossession, OREO and similar costs 2010 will continue to be challenging, but not forecasting the types of losses experienced in 2009 Local economies stabilizing - unemployment and RE valuations Much lower concentration of C&D credits, where largest losses have been taken Other portfolios continue to perform well; net exposure not as high Note: Based on management's SEC and internal reports |

| Loan Portfolio Review: CRE Total CRE Portfolio: $191 million at 12/31/09 Loans by Type Portfolio has performed well Portfolio is well-diversified by type - only 2% in condos and 5% in commercial land 45% of the portfolio is owner- occupied 62% of CRE is in the N Idaho/E Washington region SBA 504 loans total $10.2 million Top 75 credits total $105 million or 55% of the portfolio; average loan size in this group is $1.4 million Note: Based on management's SEC and internal reports. Column1 Condos Religious Office Warehouse Storage Retail Restaurant Multi-family Land Other Health Care C-Store Misc 40178 4504 6881 32265 24863 6984 12177 6028 18067 10281 19560 11345 2713 35126 Loans by Risk Rating 3 - Pass 4 - Watch 5 - Special Mention 6 - Substandard 7-Doubtful 143683 32399 1027 13074 610 Portfolio Notes |
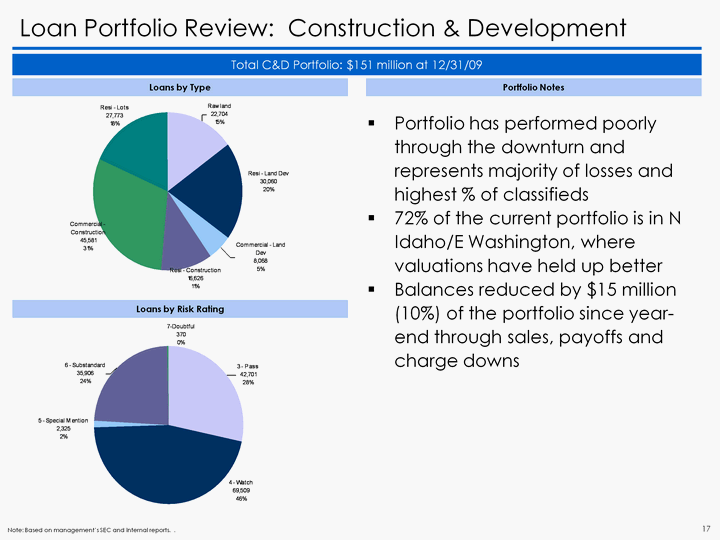
| Loan Portfolio Review: Construction & Development Total C&D Portfolio: $151 million at 12/31/09 Loans by Type Portfolio has performed poorly through the downturn and represents majority of losses and highest % of classifieds 72% of the current portfolio is in N Idaho/E Washington, where valuations have held up better Balances reduced by $7 million (5%) of the portfolio since year-end through sales, payoffs and charge downs Note: Based on management's SEC and internal reports. . Raw land Resi - Land Dev Commercial - Land Dev Resi - Construction Commercial - Construction Resi - Lots 40178 22704 30060 8068 16626 45581 27773 Loans by Risk Rating 3 - Pass 4 - Watch 5 - Special Mention 6 - Substandard 7-Doubtful 42701 69509 2325 35906 370 Portfolio Notes |

| Loan Portfolio Review: C&I Total C&I Portfolio: $137 million at 12/31/09 Loans by Type Portfolio has performed well C&I diversified by industry type with no significant concentrations in any industry 67% of totals are in the N Idaho/E Washington region $26M of loans (20%) are SBA or USDA guaranteed $12 million in classified C&I loans are managed closely by CRM group with recent collateral evaluations Of the total $12 million classified, $5.5 million (47%) are SBA guaranteed Note: Based on management's SEC and internal reports. Agri-business Construction Manufacturing Wholesale Retail Transportation Finance Real Estate Professional Health Care Administration Other Services Municipal Misc 6328 15680 19746 6272 8585 9403 16553 12465 9383 6290 4988 4686 5054 11190 Loans by Risk Rating 3 - Pass 4 - Watch 5 - Special Mention 6 - Substandard 7-Doubtful 107049 17051 838 11192 493 Portfolio Notes |
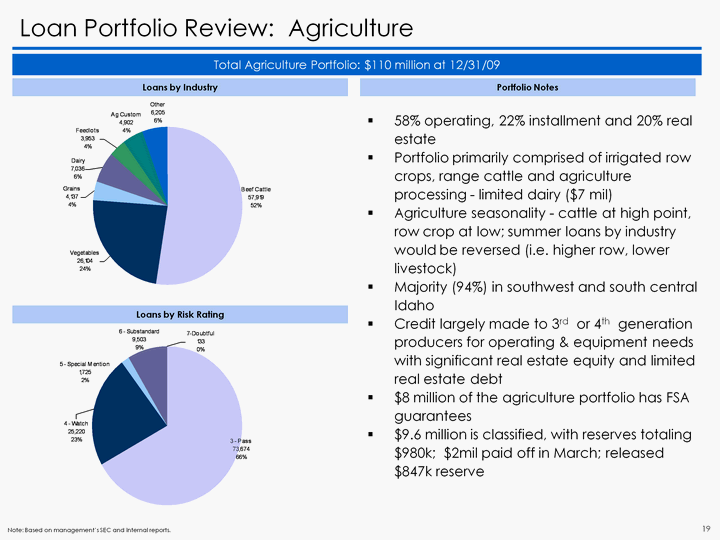
| Loan Portfolio Review: Agriculture Total Agriculture Portfolio: $110 million at 12/31/09 Loans by Industry 58% operating, 22% installment and 20% real estate Portfolio primarily comprised of irrigated row crops, range cattle and agriculture processing - limited dairy ($7 mil) Agriculture seasonality - cattle at high point, row crop at low; summer loans by industry would be reversed (i.e. higher row, lower livestock) Majority (94%) in southwest and south central Idaho Credit largely made to 3rd or 4th generation producers for operating & equipment needs with significant real estate equity and limited real estate debt $8 million of the agriculture portfolio has FSA guarantees $9.6 million is classified, with reserves totaling $980k; $2mil paid off in March; released $847k reserve Note: Based on management's SEC and internal reports. Beef Cattle Vegetables Grains Dairy Feedlots Ag Custom Other 57919 26104 4137 7036 3953 4902 6205 Loans by Risk Rating 3 - Pass 4 - Watch 5 - Special Mention 6 - Substandard 7-Doubtful 73674 25220 1725 9503 133 Portfolio Notes |
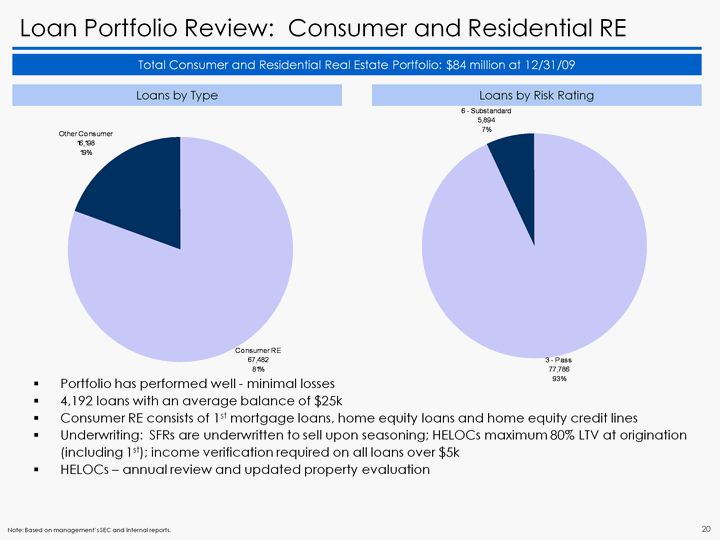
| Loan Portfolio Review: Consumer and Residential RE Total Consumer and Residential Real Estate Portfolio: $84 million at 12/31/09 Portfolio has performed well - minimal losses 4,192 loans with an average balance of $25k Consumer RE consists of 1st mortgage loans, home equity loans and home equity credit lines Underwriting: SFRs are underwritten to sell upon seasoning; HELOCs maximum 80% LTV at origination (including 1st); income verification required on all loans over $5k HELOCs - annual review and updated property evaluation Note: Based on management's SEC and internal reports. Loans by Type Loans by Risk Rating Consumer RE Other Consumer 12/31/2009 67482 16198 3 - Pass 6 - Substandard 12/31/2009 77786 5894 |

| Loan Portfolio Review: Non Performing Assets Total NPAs: $31 million at 12/31/09 NPA's by Type 12/31/09 NPAs at lowest level since 3rd quarter 2008 Texas Ratio peaked at 41.7% in 2Q 2009, down to 32.6% at 4Q 2009 NPA /Total Assets peaked at 3.7% in 2Q 2009, down to 2.8% at 4Q 2009 30-day delinquency ratio peaked at 3.1% in 2Q 2009, down to 1.06% at 4Q 2009 Note: Based on management's SEC and internal reports. Last 9 Quarters NPAs C&D CRE C&I Agriculture Consumer 12/31/2009 18452 5370 2653 834 3283 Notes |
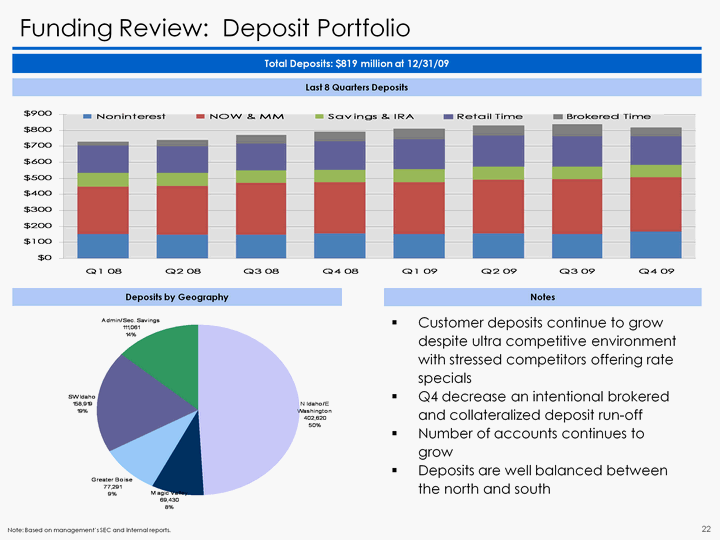
| Funding Review: Deposit Portfolio Total Deposits: $819 million at 12/31/09 Customer deposits continue to grow despite ultra competitive environment with stressed competitors offering rate specials Q4 decrease an intentional brokered and collateralized deposit run-off Number of accounts continues to grow Deposits are well balanced between the north and south Note: Based on management's SEC and internal reports. Deposits by Geography Last 8 Quarters Deposits N Idaho/E Washington Magic Valley Greater Boise SW Idaho Admin/Sec. Savings 40178 402620 69430 77291 158919 111061 Notes |
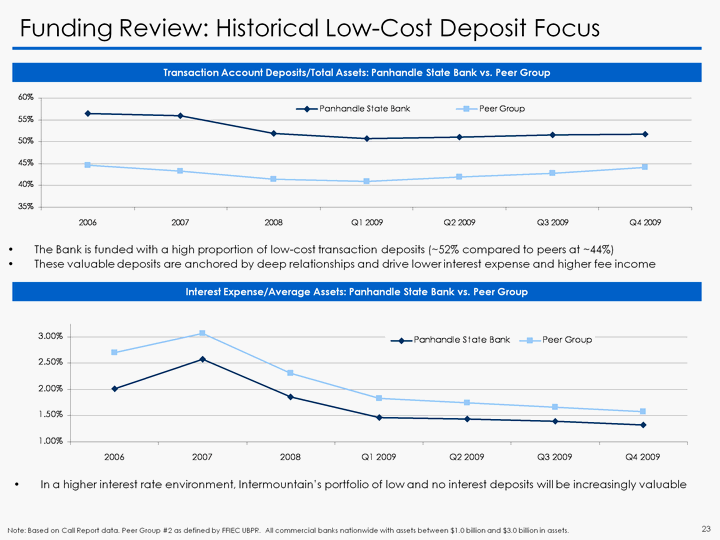
| Funding Review: Historical Low-Cost Deposit Focus Interest Expense/Average Assets: Panhandle State Bank vs. Peer Group The Bank is funded with a high proportion of low-cost transaction deposits (~52% compared to peers at ~44%) These valuable deposits are anchored by deep relationships and drive lower interest expense and higher fee income Transaction Account Deposits/Total Assets: Panhandle State Bank vs. Peer Group In a higher interest rate environment, Intermountain's portfolio of low and no interest deposits will be increasingly valuable Note: Based on Call Report data. Peer Group #2 as defined by FFIEC UBPR. All commercial banks nationwide with assets between $1.0 billion and $3.0 billion in assets. |
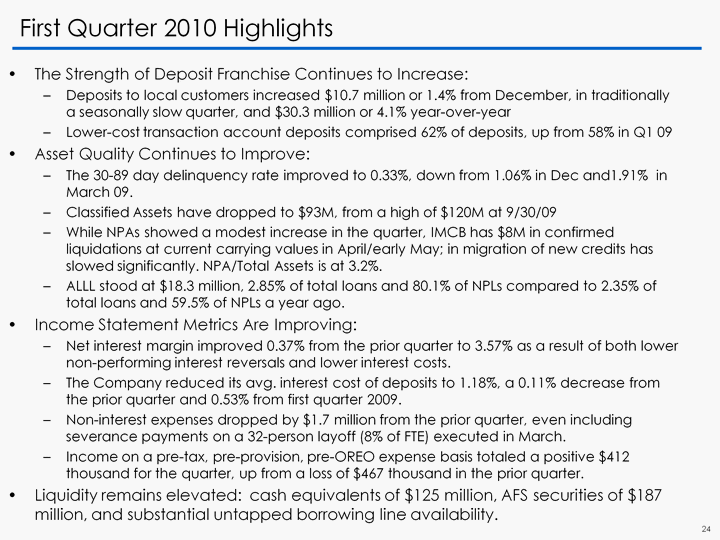
| First Quarter 2010 Highlights The Strength of Deposit Franchise Continues to Increase: Deposits to local customers increased $10.7 million or 1.4% from December, in traditionally a seasonally slow quarter, and $30.3 million or 4.1% year-over-year Lower-cost transaction account deposits comprised 62% of deposits, up from 58% in Q1 09 Asset Quality Continues to Improve: The 30-89 day delinquency rate improved to 0.33%, down from 1.06% in Dec and1.91% in March 09. Classified Assets have dropped to $93M, from a high of $120M at 9/30/09 While NPAs showed a modest increase in the quarter, IMCB has $8M in confirmed liquidations at current carrying values in April/early May; in migration of new credits has slowed significantly. NPA/Total Assets is at 3.2%. ALLL stood at $18.3 million, 2.85% of total loans and 80.1% of NPLs compared to 2.35% of total loans and 59.5% of NPLs a year ago. Income Statement Metrics Are Improving: Net interest margin improved 0.37% from the prior quarter to 3.57% as a result of both lower non-performing interest reversals and lower interest costs. The Company reduced its avg. interest cost of deposits to 1.18%, a 0.11% decrease from the prior quarter and 0.53% from first quarter 2009. Non-interest expenses dropped by $1.7 million from the prior quarter, even including severance payments on a 32-person layoff (8% of FTE) executed in March. Income on a pre-tax, pre-provision, pre-OREO expense basis totaled a positive $412 thousand for the quarter, up from a loss of $467 thousand in the prior quarter. Liquidity remains elevated: cash equivalents of $125 million, AFS securities of $187 million, and substantial untapped borrowing line availability. |

| Balance Sheet Summary Balance Sheet Summary |
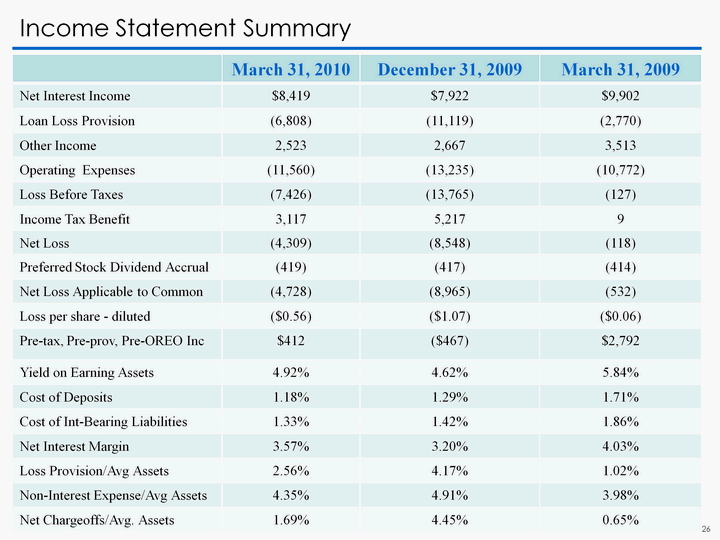
| Income Statement Summary Income Statement Summary |
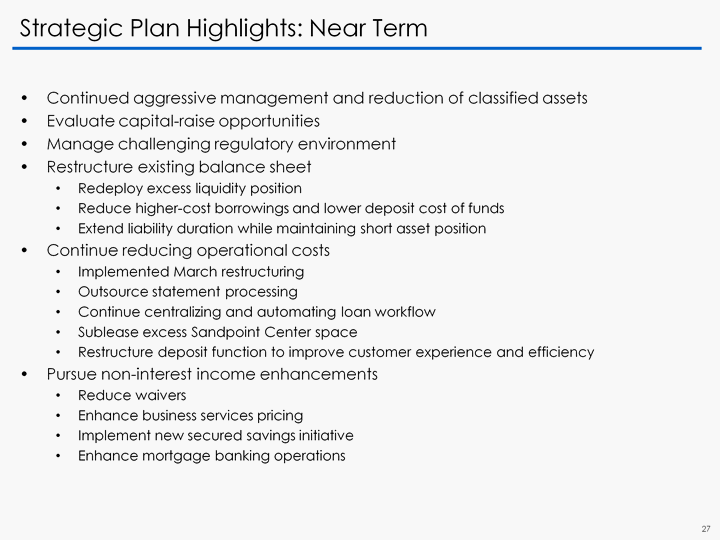
| Strategic Plan Highlights: Near Term Continued aggressive management and reduction of classified assets Evaluate capital-raise opportunities Manage challenging regulatory environment Restructure existing balance sheet Redeploy excess liquidity position Reduce higher-cost borrowings and lower deposit cost of funds Extend liability duration while maintaining short asset position Continue reducing operational costs Implemented March restructuring Outsource statement processing Continue centralizing and automating loan workflow Sublease excess Sandpoint Center space Restructure deposit function to improve customer experience and efficiency Pursue non-interest income enhancements Reduce waivers Enhance business services pricing Implement new secured savings initiative Enhance mortgage banking operations |

| Strategic Plan Highlights: Long Term Pursue attractive growth opportunities to expand profitably Core markets: Continue expanding basic market share Capitalize on distressed bank runoff Existing Growth markets: Add low-cost, high-tech facilities in attractive areas; attract strong employees, particularly from distressed banks Expand deposit officer program in these markets Capitalize on distressed bank runoff Contiguous markets: Recruit strong teams in markets contiguous to existing markets Acquisitions: Take advantage of market disruptions to take customers and attract qualified bankers Opportunistically pursue FDIC-assisted or other deals with attractive risk profiles Lending: Pursue attractive mid-market C&I credits with established personnel and conservative underwriting Pursue CRE loans to strong borrowers with conservative LTVs on lower-valued assets Pursue SFR jumbo and non-jumbo residential loans to strong borrowers with strong LTVs in rural or smaller suburban areas where FNMA/FHLMC appraisal issues create origination challenges Expand agricultural lending and continue growing government-guaranteed loans Continue strong emphasis on risk management Continue strong emphasis on cost-reduction and enhanced efficiency Evaluate TARP CPP program payoff opportunities |

| Wrap Up Questions Thank You for Your Continued Support |