QuickLinks -- Click here to rapidly navigate through this document
As filed with the Securities and Exchange Commission on May 13, 2004.
Registration No. 333-114043
SECURITIES AND EXCHANGE COMMISSION
Washington, DC 20549
Amendment No. 1
to
FORM S-1
REGISTRATION STATEMENT
UNDER
THE SECURITIES ACT OF 1933
WORLDSPAN TECHNOLOGIES INC.
(Exact name of Registrant as specified in its charter)
| Delaware (State or Other Jurisdiction of Incorporation or Organization) | 7374 (Primary Standard Industrial Classification Code Number) | 75-3125716 (I.R.S. Employer Identification No.) | ||
300 Galleria Parkway, N.W. Atlanta, Georgia 30339 (770) 563-7400 (Address, Including Zip Code, and Telephone Number, Including Area Code, of Registrant's Principal Executive Offices) | ||||
Jeffrey C. Smith, Esq. General Counsel Worldspan, L.P. 300 Galleria Parkway, N.W. Atlanta, Georgia 30339 (770) 563-7400 (Name, address including zip code, and telephone number, including area code, of agent for service) | ||||
With copies to: | ||
| G. Daniel O'Donnell, Esq. Geraldine A. Sinatra, Esq. Dechert LLP 4000 Bell Atlantic Tower 1717 Arch Street Philadelphia, Pennsylvania 19103 (215) 994-4000 | Kirk A. Davenport, Esq. Latham & Watkins LLP 885 Third Avenue Suite 1000 New York, New York 10022 (212) 906-1284 | |
Approximate date of commencement of proposed sale to the public:
As soon as practicable after the effective date of this Registration Statement.
If any of the securities being registered on this form are to be offered on a delayed or continuous basis pursuant to Rule 415 under the Securities Act of 1933, check the following box. o
If this form is filed to register additional securities for an offering pursuant to Rule 462(b) under the Securities Act, please check the following box and list the Securities Act registration statement number of the earlier effective registration statement for the same offering. o
If this form is a post-effective amendment filed pursuant to Rule 462(c) under the Securities Act, check the following box and list the Securities Act registration statement number of the earlier effective registration statement for the same offering. o
If delivery of the prospectus is expected to be made pursuant to Rule 434, please check the following box. o
CALCULATION OF REGISTRATION FEE
| Title of Each Class of Securities to be Registered | Proposed Maximum Aggregate Offering Price(1) | Amount of Registration Fee(3) | ||
|---|---|---|---|---|
| Common Stock, par value $.01 per share | $745,000,000(2) | $94,391.50 | ||
- (1)
- Estimated solely for the purpose of calculating the registration fee pursuant to Rule 457(o) under the Securities Act of 1933, as amended.
- (2)
- Includes the aggregate value offered if the underwriters exercise the option to purchase shares of Common Stock to cover over-allotments, if any.
- (3)
- A registration fee of $39,910.50 was previously paid in connection with the initial filing of this Registration Statement. An additional registration fee of $54,481.00 is being paid in connection with this filing, based on an increase in the maximum aggregate offering price of $745,000,000. The total registration fee is $94,391.50
The Registrant hereby amends this Registration Statement on such date or dates as may be necessary to delay its effective date until the Registrant shall file a further amendment which specifically states that this Registration Statement shall thereafter become effective in accordance with Section 8(a) of the Securities Act of 1933 or until this Registration Statement shall become effective on such date as the Commission, acting pursuant to said Section 8(a), may determine.
The information in this prospectus is not complete and may be changed. We may not sell these securities until the registration statement filed with the Securities and Exchange Commission is effective. This prospectus is not an offer to sell these securities and it is not soliciting an offer to buy these securities in any state where the offer or sale is not permitted.
SUBJECT TO COMPLETION, DATED , 2004
Preliminary prospectus
Shares

Worldspan Technologies Inc.
Common Stock
$ per share
We are selling shares of our Common Stock.
This is the initial public offering of our Common Stock. We currently expect the initial public offering price to be between $ and $ per share. We intend to apply to list our Common Stock on the New York Stock Exchange under the symbol "WS".
Investing in our Common Stock involves risks. See "Risk Factors" beginning on page 10.
Neither the Securities and Exchange Commission nor any state securities commission has approved or disapproved of these securities or determined if this prospectus is truthful or complete. Any representation to the contrary is a criminal offense.
| | Per Share | Total | ||||
|---|---|---|---|---|---|---|
| Public Offering Price | $ | $ | ||||
| Underwriting Discounts and Commissions | $ | $ | ||||
| Proceeds to Worldspan Technologies Inc. (before expenses) | $ | $ | ||||
The selling stockholders have granted the underwriters a 45-day option to purchase up to additional shares to cover any over-allotments. All of the shares of Common Stock subject to the over-allotment option will be sold by the selling stockholders. We will not receive any of the proceeds from any shares of Common Stock sold by the selling stockholders.
The underwriters expect to deliver the shares on or about , 2004.
Lehman Brothers | JPMorgan | |
Goldman, Sachs & Co. | UBS Investment Bank | |
CIBC World Markets | RBC Capital Markets | |
, 2004
| | Page | |
|---|---|---|
Prospectus Summary | 1 | |
| Risk Factors | 10 | |
| Forward-Looking Statements | 24 | |
| Industry and Market Data | 24 | |
| Use of Proceeds | 25 | |
| Dividend Policy | 25 | |
| Capitalization | 26 | |
| Dilution | 27 | |
| Unaudited Pro Forma Condensed Consolidated Financial Statements | 29 | |
| Selected Historical Financial Data | 39 | |
| Management's Discussion and Analysis of Financial Condition and Results of Operations | 41 | |
| Business | 63 | |
Management | 80 | |
| Certain Relationships and Related Transactions | 96 | |
| Principal and Selling Stockholders | 100 | |
| Description of Capital Stock | 102 | |
| Shares Eligible for Future Sale | 104 | |
| Material United States Tax Consequences to Non-U.S. Holders of Common Stock | 106 | |
| Underwriting | 108 | |
| Legal Matters | 112 | |
| Experts | 112 | |
| Where You Can Find More Information | 112 | |
| Index to Combined Financial Statements | F-1 |
Until , 2004 (25 days after the date of this prospectus), all dealers that buy, sell or trade our Common Stock, whether or not participating in this offering, may be required to deliver a prospectus. This is in addition to the dealers' obligation to deliver a prospectus when acting as underwriters and with respect to their unsold allotments or subscriptions.
You should rely only on the information contained in this prospectus or to which we have referred you. We have not authorized anyone to provide you with information that is different. This prospectus may only be used where it is legal to sell these securities. The information in this prospectus may only be accurate on the date of this prospectus.
i
This following summary highlights certain significant aspects of our business and this offering, but you should read this entire prospectus, including the financial data and related notes, before making an investment decision. References in this prospectus to "WTI" refer to Worldspan Technologies Inc. References in this prospectus to "we," "us," "our" and "our company" refer to WTI and its consolidated subsidiaries unless otherwise specified. References in this prospectus to "Worldspan" refer to Worldspan, L.P. References in this prospectus to the "Acquisition" refer to the acquisition by WTI, formerly named Travel Transaction Processing Corporation, through its wholly-owned subsidiaries, of the general partnership interests and limited partnership interest of Worldspan. WTI is a holding company with no business operations. WTI owns all of the partnership interests in Worldspan, our wholly-owned subsidiary through which we conduct all our business operations. References in this prospectus to the "Transactions" refer to the Acquisition, our new senior credit facility and this offering. You should carefully consider the information set forth under the heading "Risk Factors."
Worldspan Technologies Inc.
We are a leading provider of mission-critical transaction processing and information technology services to the global travel industry. We are the second largest transaction processor for travel agencies in the United States (the world's largest travel market) and the largest processor globally for online travel agencies as measured by transactions. In 2003, we processed over 65% of online airline transactions made in the United States and processed by a global distribution system, or GDS. We provide subscribers (including traditional travel agencies, online travel agencies and corporate travel departments) with real-time access to schedule, price, availability and other travel information and the ability to process reservations and issue tickets for the products and services of approximately 800 travel suppliers (such as airlines, hotels, car rental companies, tour companies and cruise lines) throughout the world. During the year ended December 31, 2003, we processed approximately 193 million transactions. We also provide information technology services to the travel industry, primarily airline internal reservation systems, flight operations technology and software development.
In recent years, the travel industry has been marked by the emergence and growth of the Internet as a travel distribution channel. The growth in use of the Internet has led to the establishment of online travel agencies that provide a link between the consumer and the travel supplier, typically through a GDS. In 2003, airline transactions generated through online travel agencies accounted for approximately 28% of all airline transactions in the United States processed by a GDS, up from approximately 23% in 2002 and approximately 17% in 2001. Between 1999 and 2003, the number of airline transactions in the United States generated through online travel agencies and processed by a GDS increased at a compound annual growth rate of 40.5% and an annual growth rate of 14.1% for the most recent year. The chart below illustrates airline transactions generated through online and traditional travel agencies in the United States and processed by a GDS.(1)
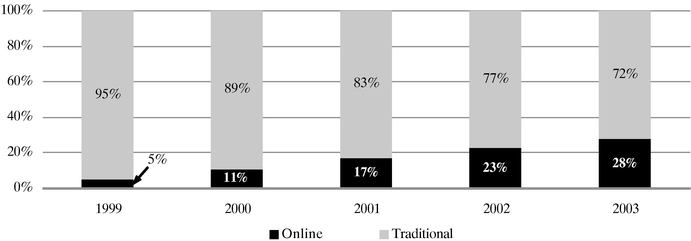
- (1)
- MIDT airline transactions data for Worldspan, Amadeus, Galileo and Sabre.
1
We have executed an alternative strategy with regard to the online travel agency channel. Unlike our primary competitors, we do not own an online travel agency that competes with travel suppliers or travel agencies. Instead, we have developed strategic relationships with online travel agencies to provide them with transaction processing, mission-critical technology and services, and access to our aggregated travel information, which enable online travel agencies to operate effectively and efficiently. As a result of this strategy, we have entered into long-term contracts with Expedia, Orbitz and Priceline, which are three of the five largest online travel agencies in the world. In addition, we have an agreement with Hotwire, another leading online travel agency, to process its airline transactions and have converted all of its airline transactions from Sabre, its previous provider, to us since March 2003.
Business Segments
We operate in two business segments: electronic travel distribution and information technology services, which represented approximately 90% and 10%, respectively, of our revenues in the year ended December 31, 2003.
Electronic Travel Distribution
We are the second largest transaction processor for travel agencies in the United States (the world's largest travel market) and the largest processor globally for online travel agencies as measured by transactions. The GDS industry is a core component of the worldwide travel industry and is organized around two major sets of customers: travel suppliers and travel agencies. Suppliers of travel and travel-related products and services (such as airlines, car rental companies and hotels) utilize GDSs as a means of selling tickets and generating sales. Travel agencies (including traditional travel agencies, online travel agencies and corporate travel departments) utilize GDSs to search schedule, price, availability and other travel information and to process transactions on behalf of consumers. GDSs provide travel agencies with a single, expansive source of travel information, allowing travel agencies to search and process tens of thousands of itinerary and pricing options across multiple travel suppliers within seconds.
Through our GDS, we provide approximately 16,000 traditional travel agency locations in over 70 countries and approximately 50 online travel agencies, including four of the largest online travel agencies, with access to the inventory, reservations and ticketing of travel suppliers, including approximately 465 airlines, 225 hotel chains and 35 car rental companies throughout the world. As compensation for performing these services, we generally charge the travel supplier a fee for every transaction we process. For example, for a roundtrip ticket with one connection each way, a three night hotel stay and a three day car rental, we charge the respective travel suppliers one transaction fee for each segment of the airline ticket, one transaction fee for the hotel stay and one transaction fee for the car rental for a total of six transaction fees. The value of the travel purchase or the length of stay has no impact on our transaction fee.
Information Technology Services
We provide a comprehensive suite of information technology services to airlines, including: (i) internal reservation system services; (ii) flight operations technology services; and (iii) software development and licensing services, which include custom development and integration. We provide some of these services to several airlines, including Delta and Northwest. We have also developed other products and services to meet the needs of airlines, which we sell on a subscription basis. These products and services include Worldspan Rapid RepriceSM, Electronic Ticketing, e-Pricing® and Fares and Pricing.
2
Competitive Strengths
We believe the following strengths will allow us to continue to grow our market position and enhance our operating profitability and cash flow:
- •
- Market Leading Transaction Processor for Online Travel Agencies. In 2003, we processed over 65% of online airline transactions made in the United States and processed by a GDS. Our leadership in the online travel agency channel began in 1995 when Microsoft chose us as its transaction processing partner when it was developing Expedia as an online travel agency. In addition, we have executed a strategy of developing contractual relationships with online travel agencies, rather than owning an online travel agency like our primary competitors. As a result, we process online transactions for Expedia, Hotwire, Orbitz and Priceline, four of the six largest online travel agencies in the world.
- •
- Well Positioned to Take Advantage of the Shift to the Online Travel Agency Channel. An increasing number of travel transactions are being made online. In 2003, airline transactions generated through online travel agencies accounted for approximately 28% of all airline transactions in the United States processed by a GDS, up from approximately 23% in 2002 and approximately 17% in 2001. Our relationships with four of the six largest online travel agencies in the world have positioned us well to take advantage of this shift.
- •
- Neutrality. Unlike our competitors, we have intentionally not pursued a strategy of vertical integration and instead have forged strategic partnerships with leading online travel agencies. As the shift towards the online travel agency channel continues, we believe the traditional travel agencies will increasingly view the GDS-owned online travel agencies as competitive to their core business. As a result, our neutrality gives us an opportunity to capture additional business from both online and traditional travel agencies.
- •
- Robust Technology Capabilities. Our use of Internet and server-based technologies has allowed us to provide travel suppliers and online and traditional travel agencies with products and services that enable custom applications, reduce operating costs, increase productivity and enhance the customer experience. In addition, as a result of a new agreement with IBM, we believe that we will be able to increase our processing and computer capabilities without a significant increase in associated software and hardware costs.
- •
- Proven Business Model with Strong Cash Flow Generation. Our ability to leverage our cost structure, grow transaction volumes, enlarge our customer base, and incur moderate ongoing capital expenditure and working capital requirements, enables us to generate significant net cash from operations. From 1999 through 2003, we generated $946 million of net cash from operations, which primarily enabled us to distribute $715 million to our founding airlines from 1999 through the closing of the Acquisition.
Business Strategy
We intend to continue to strengthen our market leadership position, maximize profitability and enhance cash flow through the following strategies:
- •
- Continue to Increase Our Share and the Number of Online Travel Agency Transactions. While we processed over 65% of online airline transactions made in the United States and processed by a GDS in 2003, we believe there are still opportunities to increase our number of transactions and our market share in the online travel agency channel. Our primary competitors own online travel agencies, and we believe that the channel conflict inherent in our primary competitors' strategy leaves us well positioned to compete for the business of independent online travel agencies.
- •
- Increase Our Global Penetration of the Traditional Travel Agency Channel. We have historically focused on selected geographic markets where our founding airlines had significant operations. We believe we have the opportunity to obtain new traditional travel agencies both in and outside
3
- •
- Capitalize on the Shift by Corporate Travel Departments to Online Travel Services. We believe there will be a substantial opportunity to capitalize on the trend of corporate travel departments toward making bookings for business travel through online services. We are well positioned to benefit from this trend, as Expedia and Orbitz, two of our largest online travel agency customers, have entered the corporate travel market.
- •
- Increase Hospitality and Destination Services Transactions. We intend to increase our transaction revenues from hospitality and destination services, which include car, hotel, tour, cruise and rail transactions. We derived approximately 8% of our transaction fee revenues for the year ended December 31, 2003 from hospitality and destination services transactions. We expect these future transactions to increase in number, largely as a result of the emergence of the Internet and online travel agencies as a means of facilitating travel commerce.
- •
- Expand Information Technology Services Business. We intend to expand our existing information technology services business. We believe airlines and other travel suppliers have been and will be increasingly outsourcing non-core technology functionalities due to the desire to focus on their core travel business, to better manage fixed costs and to leverage the technology of information technology service providers.
- •
- Continue to Reduce Costs. Since the Acquisition, we have executed several strategic cost reduction initiatives. We believe additional opportunities exist to reduce costs and improve profitability. We plan to improve our cost structure by streamlining our programming and processing systems and reducing our network and data center costs, among other initiatives.
the United States, particularly in Europe, Asia, Australia, South America and Latin America, where we have not previously concentrated and where travel reservations are not generally made using current Internet technologies. In addition, we intend to expand the number of transactions we process for traditional travel agencies in the United States.
Summary Risks
You should consider carefully the following important risks:
- •
- Our revenues are highly dependent on the level of travel activity and are therefore highly subject to declines or disruptions to travel, particularly with respect to airlines that participate in our GDS. The travel industry is susceptible to safety and security concerns, including acts of terrorism and war and global epidemics such as SARS. In 2003, our revenues were adversely affected by the war in Iraq and the SARS epidemic, both of which resulted in the cancellation of a significant number of flights and travel bookings and a decrease in new travel bookings.
- •
- We depend on a relatively small number of airlines for a significant portion of our revenues and the loss of any of our major airline relationships would harm us. In 2003, our five largest airline customers represented 54% of our revenues.
- •
- We seek to obtain as our customers traditional travel agencies, online travel agencies, corporate travel departments and travel suppliers. We face significant competition in each of these areas. We also face significant competition with respect to our information technology services from other companies offering internal reservation systems and related technology.
- •
- Travel suppliers, particularly airlines, are aggressively seeking ways to reduce distribution costs and, through the use of the Internet and otherwise, are seeking to decrease their reliance on GDSs including us. Several airlines have entered into direct supplier agreements with Orbitz and have established their own travel distribution websites. We may not always have access to the lowest prices that travel suppliers offer through these alternative channels.
- •
- We are highly dependent on a small number of large online travel agencies, and the success of our business depends on continuing these relationships. In 2003, Expedia, Hotwire, Orbitz and Priceline represented approximately 43% of our total transactions, with Expedia representing
4
- •
- In connection with our acquisition of the outstanding general partnership interests and limited partnership interest of Worldspan in June 2003, we incurred substantial indebtedness. As a result of the interest expense associated with this indebtedness combined with other events as described above, our net income in 2003 was significantly lower than 2002.
over 20% of our total transactions. Under our agreements with these agencies, the agencies have a variety of termination rights and other rights to reduce their business with Worldspan. For example, Expedia informed us in May 2004 that it intends to exercise its right to move a portion of its transactions to another GDS provider.
Please see the section entitled "Risk Factors" for information on these and other risks related to our business and this offering.
Our Corporate Structure and History
We were formed in March 2003 by Citigroup Venture Capital Equity Partners, L.P. , or CVC, and Ontario Teachers' Pension Plan Board, or OTPP, for the purpose of acquiring all of the general partnership interests and indirectly acquiring all of the limited partnership interest of Worldspan. Worldspan was founded in 1990 by Delta Air Lines, or Delta, Northwest Airlines, or Northwest, and Trans World Airlines, Inc., or TWA. Affiliates of these three airlines (and later American Airlines, or American, following its acquisition of TWA's assets) held ownership stakes in Worldspan from its formation until we acquired it in 2003. We refer to American, Delta and Northwest in this prospectus as our founding airlines. On June 30, 2003, we acquired 100% of the outstanding general partnership interests and limited partnership interest of Worldspan from affiliates of our founding airlines for an aggregate consideration of $901.5 million and agreed to provide credits to Delta and Northwest totalling up to $250.0 million structured over nine years in exchange for the agreement of those airlines to continue using Worldspan for information technology services.
Our principal executive offices are located at 300 Galleria Parkway, N.W., Atlanta, Georgia 30339, and our telephone number is (770) 563-7400. Our website ishttp://www.worldspan.com. The website and the information included therein are not part of this prospectus.
Equity Sponsors
CVC is a private equity fund managed by Citigroup Venture Capital Ltd., one of the industry's oldest private equity firms. Citigroup Venture Capital Ltd. was established in 1968, and manages funds in excess of $6.0 billion. Citigroup Venture Capital is a leading technology and travel investor, sponsoring such industry leading names as Fairchild Semiconductor, Intersil, ChipPAC, AMI Semiconductor, Federal Express and People Express.
OTPP, with approximately C$75.7 billion in net assets at December 31, 2003, is one of the largest pension plans in Canada. OTPP's private equity arm was established in 1991. The private equity arm has completed more than 100 transactions in a wide range of industries having participated in many management buy-outs in Canada, the United States and Europe, including The Yellow Pages Group Co. and Shoppers Drug Mart Corporation. With a portfolio valued at C$4.5 billion as of December 31, 2003, OTPP's private equity arm is one of Canada's largest private equity investors.
5
| Common Stock offered by us | shares of Common Stock | ||||
Common Stock to be outstanding after this offering: | shares of Common Stock | ||||
| 11,000,000 | shares of Class B Convertible Common Stock | ||||
| Total | shares of common stock | ||||
Use of Proceeds | We intend to use the net proceeds of this offering, along with borrowings under our new senior credit facility, to repay our existing senior term loan, redeem a portion of our senior notes, redeem our subordinated seller notes, prepay credits to be provided to Delta and Northwest pursuant to a service agreement with each of them, redeem our Series A Preferred Stock, terminate our advisory fee with CVC and prepay the special dividend due on our Class B Convertible Common Stock. | ||||
Voting Rights | Holders of Common Stock are entitled to one vote per share on all matters submitted to a vote of the stockholders. | ||||
Holders of Class B Convertible Common Stock are entitled to one vote per share on all matters submitted to a vote of the stockholders, other than the election of directors. | |||||
Conversion Rights | Shares of each class of common stock are convertible on a one-to-one basis into shares of the other class of common stock at the option of the holder. | ||||
Other Rights | Except as to voting rights, each class of common stock has the same rights. | ||||
Risk Factors | For a discussion of certain risks that should be considered in connection with an investment in our Common Stock, see "Risk Factors." | ||||
Proposed New York Stock Exchange Symbol | "WS". | ||||
The number of shares of Common Stock and Class B Convertible Common Stock to be outstanding after this offering excludes:
- •
- 3,787,000 shares of Common Stock subject to options outstanding as of March 31, 2004, at a weighted average exercise price of $4.55 per share; and
- •
- 2,213,000 additional shares of Common Stock reserved for issuance under our stock incentive plan, as of March 31, 2004.
Except as otherwise indicated, all information in this prospectus assumes:
- •
- an initial public offering price of $ per share, the mid-point of the filing range set forth on the cover of this prospectus;
- •
- a one-for reverse stock split of our common stock, which will be effected prior to the completion of this offering;
- •
- the redemption of all outstanding shares of our Series A Preferred Stock;
- •
- no exercise of the underwriters' over-allotment option; and
- •
- our merger with and into a wholly-owned subsidiary of ours in order to affect the recapitalization of our capital stock concurrently with the completion of this offering.
6
Summary Historical and Pro Forma Financial Information
The following table sets forth our summary historical and unaudited pro forma as adjusted consolidated financial data for the periods ended and the dates indicated. We have derived the summary historical consolidated financial data as of December 31, 2003 and for the fiscal years ended December 31, 2001 and 2002, and for the six months ended June 30, 2003 and December 31, 2003 from our audited financial statements and related notes included elsewhere in this prospectus. We have derived the summary historical consolidated financial data as of March 31, 2004 and for the three months ended March 31, 2003 and 2004 from our unaudited financial statements and related notes included elsewhere in this prospectus. The unaudited pro forma as adjusted consolidated financial data gives effect to the Transactions and assumptions described in "Unaudited Pro Forma Condensed Consolidated Financial Statements" and the accompanying notes as if each had occurred at the beginning of the period indicated below. The summary historical and unaudited pro forma as adjusted consolidated financial data set forth below are not necessarily indicative of the results of future operations and should be read in conjunction with the discussion under the headings "Management's Discussion and Analysis of Financial Condition and Results of Operations," and "Unaudited Pro Forma Condensed Consolidated Financial Statements" and the historical consolidated financial statements and accompanying notes included elsewhere in this prospectus.
Worldspan was acquired on June 30, 2003 in a business combination accounted for under the purchase method of accounting. Accordingly, the financial data set forth below includes a predecessor basis and a successor basis. As a result of the Acquisition, Worldspan's assets and liabilities were adjusted to their estimated fair values. In addition, our statements of operations for the successor basis include interest expense resulting from indebtedness incurred to finance the Acquisition and amortization of intangible assets related to the Acquisition. Therefore, our successor basis financial data generally is not comparable to our predecessor basis financial data.
| | Predecessor Basis | | | | ||||||||||||||||||
|---|---|---|---|---|---|---|---|---|---|---|---|---|---|---|---|---|---|---|---|---|---|---|
| | Successor Basis | | ||||||||||||||||||||
| | Year Ended December 31, | | | Pro Forma Three Months Ended March 31, 2004 | ||||||||||||||||||
| | Three Months Ended March 31, 2003 | Six months Ended June 30, 2003 | Six months Ended December 31, 2003 | Three Months Ended March 31, 2004 | ||||||||||||||||||
| | 2001 | 2002 | ||||||||||||||||||||
| | | | (unaudited) | (dollars in thousands except per share data) | (unaudited) | (unaudited) | ||||||||||||||||
| Statement of Income Data: | ||||||||||||||||||||||
| Revenues: | ||||||||||||||||||||||
| Electronic travel distribution | $ | 762,304 | $ | 807,095 | $ | 206,944 | $ | 414,933 | $ | 396,488 | $ | 232,539 | $ | 232,539 | ||||||||
| Information technology services | 126,049 | 107,774 | 27,401 | 52,539 | 32,974 | 15,992 | 18,719 | |||||||||||||||
| Total revenues | 888,353 | 914,869 | 234,345 | 467,472 | 429,462 | 248,531 | 251,258 | |||||||||||||||
| Total operating expenses | 807,775 | 802,902 | 207,091 | 417,969 | 421,312 | 221,235 | 221,010 | |||||||||||||||
| Operating income | 80,578 | 111,967 | 27,254 | 49,503 | 8,150 | 27,296 | 30,248 | |||||||||||||||
| Interest expense | 6,515 | 5,481 | 1,368 | 2,756 | 25,481 | 13,160 | 7,275 | |||||||||||||||
| Net income (loss) | 63,169 | 104,819 | 25,302 | 28,414 | (18,990 | ) | 13,691 | 22,528 | ||||||||||||||
| Net (loss) income available to common stockholders | — | — | — | — | (34,990 | ) | 5,291 | |||||||||||||||
| Net (loss) income available to Class B Convertible Common Stock and Common Stock stockholders | — | — | — | — | (35,440 | ) | 5,291 | |||||||||||||||
| Basic net (loss) income per Class B Convertible Common Stock | — | — | — | — | $ | (0.34 | ) | $ | 0.06 | |||||||||||||
| Basic net (loss) income per Common Stock | — | — | — | — | $ | (0.39 | ) | $ | 0.06 | |||||||||||||
| Diluted net (loss) income per Class B Convertible Common Stock | — | — | — | — | $ | (0.34 | ) | $ | 0.06 | |||||||||||||
| Diluted net (loss) income per Common Stock | — | — | — | — | $ | (0.39 | ) | $ | 0.06 | |||||||||||||
7
| | As of March 31, 2004 | ||||||
|---|---|---|---|---|---|---|---|
| | Actual | Pro Forma As Adjusted | |||||
| | | (unaudited) | |||||
| Balance Sheet Data: | |||||||
| Cash and cash equivalents | $ | 33,087 | $ | 26,231 | |||
| Working capital (deficit)(1) | (22,459 | ) | (77,065 | ) | |||
| Property and equipment | 137,406 | 137,406 | |||||
| Total assets | 1,138,907 | 1,284,521 | |||||
| Total debt(2) | 539,642 | 454,152 | |||||
| Series A preferred stock subject to mandatory redemption | 344,734 | — | |||||
| Stockholders' equity (deficit) | (25 | ) | 577,096 | ||||
8
| | Predecessor Basis | | | | ||||||||||||||||||
|---|---|---|---|---|---|---|---|---|---|---|---|---|---|---|---|---|---|---|---|---|---|---|
| | Successor Basis | | ||||||||||||||||||||
| | Year Ended December 31, | | | | ||||||||||||||||||
| | | Six months Ended June 30, 2003 | Six months Ended December 31, 2003 | | Pro Forma Three Months Ended March 31, 2004 | |||||||||||||||||
| | Three Months Ended March 31, 2003 | Three Months Ended March 31, 2004 | ||||||||||||||||||||
| | 2001 | 2002 | ||||||||||||||||||||
| | | | (unaudited) | (dollars in thousands) | (unaudited) | (unaudited) | ||||||||||||||||
| Other Data: | ||||||||||||||||||||||
| Total transactions using the Worldspan system:(3) | ||||||||||||||||||||||
| Online (in thousands) | 54,790 | 75,896 | 21,773 | 45,058 | 45,201 | 26,189 | 26,189 | |||||||||||||||
| Traditional (in thousands) | 140,774 | 116,279 | 27,246 | 54,063 | 48,556 | 29,222 | 29,222 | |||||||||||||||
| Total transactions (in thousands) | 195,564 | 192,175 | 49,019 | 99,121 | 93,757 | 55,411 | 55,411 | |||||||||||||||
| Depreciation and amortization | $ | 83,425 | $ | 79,215 | $ | 17,146 | $ | 32,322 | $ | 52,955 | $ | 25,063 | $ | 25,063 | ||||||||
| Capital expenditures(4) | 56,653 | 56,484 | 19,317 | 22,840 | 29,490 | 23,781 | 23,781 | |||||||||||||||
| Distributions | 175,000 | 100,000 | 60,000 | 110,000 | — | — | — | |||||||||||||||
- (1)
- Working capital is calculated as current assets (including cash and cash equivalents) minus current liabilities.
- (2)
- Includes senior notes, term loan, seller notes and assets acquired under capital leases.
- (3)
- We designate each travel agency for which we process transactions as traditional or online based on management's belief as to whether a travel agency is traditional or online. The historical transaction data set forth above reflects the designations which were in effect for each period presented. We evaluate the classification of our travel agencies on a monthly basis and reclassify them as appropriate. Upon a reclassification of a travel agency, all transactions for such travel agency are correspondingly reclassified for all historical and subsequent periods. Accordingly, to the extent we change a designation for a travel agency, the transactions for such travel agency may be reflected in different categories at different times. Based on a recent evaluation of the classifications, we generated total online transactions of 55,753 and 77,021 for the years ended December 31, 2001, and 2002, 20,370 for the three months ended March 31, 2003, 45,432 for the six months ended June 30, 2003 and 45,201 for the six months ended December 31, 2003.
- (4)
- The following table summarizes capital expenditures for the periods indicated:
| | Predecessor Basis | | | |||||||||||||||
|---|---|---|---|---|---|---|---|---|---|---|---|---|---|---|---|---|---|---|
| | Successor Basis | |||||||||||||||||
| | Year Ended December 31, | | | |||||||||||||||
| | | Six Months Ended June 30, 2003 | Six Months Ended December 31, 2003 | | ||||||||||||||
| | Three Months Ended March 31, 2003 | Three Months Ended March 31, 2004 | ||||||||||||||||
| | 2001 | 2002 | ||||||||||||||||
| | | | (unaudited) | (dollars in thousands) | (unaudited) | |||||||||||||
| Purchase of property and equipment | $ | 22,337 | $ | 12,375 | $ | 7,574 | $ | 4,236 | $ | 15,961 | $ | 2,862 | ||||||
| Assets acquired under capital leases | 30,703 | 41,053 | 10,707 | 17,237 | 12,134 | 20,919 | ||||||||||||
| Capitalized software for internal use | 3,613 | 3,056 | 1,036 | 1,367 | 1,395 | — | ||||||||||||
| Total capital expenditures | $ | 56,653 | $ | 56,484 | $ | 19,317 | $ | 22,840 | $ | 29,490 | $ | 23,781 | ||||||
9
You should carefully consider the risk factors set forth below as well as the other information contained in this prospectus before deciding whether to invest in our Common Stock. If any of the following risks actually occur, our business, financial condition or results of operations could suffer. In such case, you may lose all or part of your original investment.
Risks Relating To Our Business
Dependence on Travel Industry in General and Airline Industry in Particular—Our revenues are highly dependent on the travel industry, and particularly on the airlines, and a substantial decrease in travel bookings could adversely affect our business and operating results.
Substantially all of our revenues are derived from airlines, hotel operators, car rental companies and other suppliers in the travel industry. Our revenues increase and decrease with the level of travel activity and are therefore highly subject to declines in or disruptions to travel. In particular, because a significant portion of our revenues are derived from transaction fees generated by airline bookings and airline outsourcing services, our revenues and earnings are especially sensitive to events that affect airline travel, the airlines that participate in our GDS and the airlines that obtain travel information technology services from us. Our business could also be adversely affected by a reduction in bookings on the airlines that participate in our GDS as a result of those airlines losing business for other reasons, including losing market share to other airlines, such as low-cost carriers, that do not participate in our GDS. In addition, travel expenditures are seasonal and are sensitive to business and personal discretionary spending levels and tend to decline during general economic downturns, which could also reduce our revenues and profits.
The downturn in the commercial airline market, together with the terrorist attacks of September 11, 2001, the global economic downturn, SARS and the war and continuing conflict in Iraq, have adversely affected the financial condition of many commercial airlines and other travel suppliers. Several major airlines are experiencing liquidity problems, some have sought bankruptcy protection and still others may consider bankruptcy relief. A substantial portion of our revenues are derived from transaction fees received directly from airlines and from the sale of products and services directly to airlines. If an airline declared bankruptcy, we may be unable to collect our outstanding accounts receivable from the airline. In addition, the bankruptcy of the airline might result in reduced transaction fees and other revenues from the airline or a rejection by the airline of some or all of our agreements with it, all of which could have a material adverse effect on our business, financial condition and results of operations.
Susceptibility to Terrorism and War—Acts of terrorism and war could have an adverse effect on the travel industry, which in turn could adversely affect our business and operating results.
Travel is sensitive to safety and security concerns, and thus declines after occurrences of, and fears of future incidents of, terrorism and hostilities that affect the safety, security and confidence of travelers. For example, the start of the war in Iraq in March 2003 and the continuing conflict and the terrorist attacks of September 11, 2001, which included attacks on the World Trade Center and the Pentagon using hijacked commercial aircraft, resulted in the cancellation of a significant number of flights and travel bookings and a decrease in new travel bookings. Future revenues may be reduced by similar and/or other acts of terrorism or war. The effects of these events could include, among other things, a protracted decrease in demand for air travel due to fears regarding additional acts of terrorism, military and governmental responses to acts of terrorism and a perceived inconvenience in traveling by air and increased costs and reduced operations by airlines due, in part, to new safety and security directives adopted by the Federal Aviation Administration or other governmental agencies. As an example, escalation of the U.S. Government's terrorist security alert level to code orange or higher may adversely impact demand for air travel. These effects, depending on their scope and duration,
10
which we cannot predict, could significantly impact our business, financial condition and results of operations.
Competition—We operate in highly competitive markets, and we may not be able to compete effectively.
In our electronic travel distribution segment, we compete primarily against other large and well-established GDSs, including those operated by Amadeus, Galileo and Sabre, each of which may have greater financial, technical and other resources than we have. These greater resources may allow our competitors to better finance more strategic transactions and more research and development than us and it could allow them to offer more or better products and services for less than we can. Competition among GDSs to attract and retain travel agencies is intense. In competitive markets, we and other GDSs offer discounts, incentive payments and other inducements to travel agencies if productivity or transaction volume growth targets are achieved. In order to compete effectively, we may need to increase inducements, increase spending on marketing or product development, make significant investments to purchase strategic assets or take other costly actions. Although expansion of the use of these inducements could adversely affect our profitability, our failure to continue to provide inducements could result in the loss of some travel agency customers. If we were to lose a significant portion of our current base of travel agencies to a competing GDS or if we were forced to increase the amounts of these inducements significantly, our business, financial condition and results of operations could be materially adversely affected. In addition, we face competition in the travel agency market from travel suppliers and new types of travel distribution companies that seek to bypass GDSs and distribute directly to travel agencies or consumers.
In our information technology services segment, there are several organizations offering internal reservation system and related technology services to the airlines, with our main competitors being Amadeus, EDS, Navitaire, Sabre and Unisys/SITA. This segment is highly competitive and the competitors are highly aggressive. If we cannot compete effectively to keep and grow this segment of business, we risk losing customers and economies of scale which could have a negative impact on our operating results.
Factors affecting the competitive success of GDSs include the timeliness, reliability and scope of the information offered, the reliability and ease of use of the GDS, the fees charged and inducements paid to travel agencies, the transaction fees charged to travel suppliers and the range of products and services available to travel suppliers and travel agencies. We believe that we compete effectively with respect to each of these factors. In addition, deregulation of the GDS industry in the U.S. will likely increase competition between the GDSs. Increased competition could require us to increase spending on marketing or product development, decrease our transaction fees and other revenues, increase inducement payments or take other actions that could have a material adverse effect on our business, financial condition and results of operations.
Travel Supplier Cost Savings—Travel supplier cost savings efforts may shift business away from us or cause us to reduce the fees we charge to suppliers or increase the inducements we offer to travel agencies, thereby adversely affecting our results of operations.
Travel suppliers, particularly airlines, are aggressively seeking ways to reduce distribution costs and, through the use of the Internet and otherwise, are seeking to decrease their reliance on global distribution systems including us. Travel suppliers have increasingly been providing direct access to their inventory through their own websites through travel agencies and through travel supplier joint ventures, which potentially bypass GDSs. See "Business—Competition." Some of these travel suppliers offer lower prices when their products and services are purchased directly from these supplier-related distribution channels. These lower prices are not always available to us. Some of these travel suppliers are also not providing their lowest fares to GDSs unless the GDS provides them with lower transaction fees. These practices may have the effect of diverting customers away from us to other distribution
11
channels, including websites, or of forcing us to reduce our transaction fees, which could have a material adverse effect on our business, financial condition and results of operations. Moreover, consolidation among travel suppliers, including airline mergers and alliances, may increase competition from these supplier-related distribution channels. In addition, some travel suppliers have reduced or eliminated commissions paid to both traditional and online travel agencies. The reduction or loss of commissions may cause travel agencies to become more dependent on other sources of revenues, such as traveler-paid service fees and GDS-paid inducements. We may have to increase inducement payments or incur other expenses in order to compete for travel agency business.
Fare Content Agreements—Our efforts to obtain more comprehensive content through airline fare content agreements may cause downward pressure on pricing and adversely affect our revenues and operating results.
In recent months, some airlines have differentiated the fare content that they provide to us and to our GDS competitors. Some fare content has been provided to GDSs at no additional charge under standard participation agreements, and other content, such as web fares, has been withheld unless the GDS agrees to provide discounts, payments or other benefits to the airline. We have recently entered into fare content agreements with Continental Airlines, Delta, Northwest and United Air Lines. Generally, in these agreements, the airlines commit (subject to the exceptions contained in the agreements) to provide travel agencies covered by the agreements in the territories covered by the agreements with substantially the same fare content (including web fares) it provides to the travel agencies of other GDSs in exchange for payments from us to each airline and subject to us keeping steady the average transaction fees paid by each airline for travel agency bookings in the territories covered by the agreements. Further, in February 2004, we executed a three-year fare content agreement with British Airways to provide access to virtually all of their published fares (including web fares) to some of our U.K. travel agencies. We believe that obtaining similar fare content from other major airline travel suppliers is important to our ability to compete, since other GDSs have also entered into fare content agreements with various airlines. Consequently, we plan to pursue agreements similar to these fare content agreements with some other major airlines. We expect that our fare content agreements will require us to make, in the aggregate, significant payments or other concessions to the participating airlines which could have a material adverse effect on our business, financial condition and results of operations in the future, including during the next three-year period. In addition, our fare content agreements are subject to several conditions, exceptions, term limitations and termination rights. There is no guarantee that the participating airlines will continue to provide their fare content to us to the same extent as they do at the current time. The loss or substantial reduction in the amount of fare content received from the participating airlines could negatively affect our business, financial condition and results of operations.
Dependence on Small Number of Airlines—We depend on a relatively small number of airlines for a significant portion of our revenues and the loss of any of our major airline relationships would harm our revenues and operating results.
We depend on a relatively small number of airlines for a significant portion of our revenues. Our five largest airline relationships represented an aggregate of approximately 54% of our total 2003 revenues, down from 56% in 2002, while our ten largest airline relationships represented an aggregate of approximately 66% of our total 2003 revenues, down from 68% in 2002. Our five largest airline relationships by total revenue in 2003 were with Delta, Northwest, United Air Lines, American and US Airways, representing 19%, 12%, 9%, 8% and 5% of our total 2003 revenues, respectively. In 2002, these carriers accounted for 20%, 14%, 7%, 9% and 6%, respectively. We expect to continue to depend upon a relatively small number of airlines for a significant portion of our revenues. In addition, although we expect to continue our relationships with these airlines, our airline contracts can be terminated on short notice. Because our major airline relationships represent such a large part of our
12
business, the loss of any of our major airline relationships, including due to the bankruptcy of an airline, could have a material negative impact on our business, financial condition and results of operations.
Dependence on Small Number of Online Travel Agencies—We are highly dependent on a small number of large online travel agencies, and the success of our business depends on continuing these relationships and the continued growth of online travel commerce.
In 2003, Expedia, Hotwire, Orbitz and Priceline represented approximately 43% of our total transactions, with Expedia representing over 20% of our total transactions. If we were to lose and not replace the transactions generated by any of these online travel agencies, our business, financial condition and results of operations would be materially adversely impacted. In addition, if other online travel agencies become more successful or new online travel agencies emerge and we lose online transaction volumes as a result, our business, financial condition (including the carrying value of certain intangibles) and results of operations could be materially adversely impacted.
While we have long-term contracts with Expedia, Orbitz and Priceline, these agencies have a variety of termination rights and other rights to reduce their business with Worldspan. Hotwire has the right to terminate its contract with us for any reason on 90 days advance notice. Expedia has the right to renegotiate the inducements payable to it by us every three years (with the next renegotiation right scheduled for July 2004), and it can terminate its contract with us if we cannot reach an agreement on inducements. In addition, Expedia informed us in May 2004 that it intends to exercise its right to move a portion of its transactions to another GDS provider. Although we currently continue to operate under these agreements, we cannot assure you that any travel agency will not attempt to terminate its agreement with us or otherwise move business to another GDS in the future. Any such termination or a significant reduction in transaction volumes would have a material adverse effect on our business, financial condition (including the carrying value of certain intangibles) and results of operations.
In addition, our growth strategy relies on the continuing growth in the travel industry of the Internet as a distribution channel. If consumers do not book significantly more travel online than they currently do today and if the use of the Internet as a medium of commerce for travel bookings does not continue to grow or grows more slowly than expected, our revenues and profit may be adversely affected. Consumers have historically relied on traditional travel agencies and travel suppliers and are accustomed to a high degree of human interaction in purchasing travel products and services. The success of our business is dependent on the number of consumers who use the Internet to make travel bookings increasing significantly.
Relationships with Our Founding Airlines—A significant portion of our current revenues are attributable to our founding airlines, and there is no guarantee that these airlines will continue to use our services to the same extent that they did when they owned us or that they will not indirectly compete with us.
Each of American, Delta and Northwest has important commercial relations with us, and, in 2003, revenues received from our founding airlines represented, in the aggregate, approximately 39% of our revenues. Approximately 79% of this revenue was from transaction fees and the balance was derived from information technology services provided to Delta and Northwest. Delta is the largest single travel supplier utilizing our GDS, as measured by transaction fee revenues, generating transaction fees that accounted for approximately 14% of our 2003 revenue, while Northwest and American represent approximately 9% and 8%, respectively. In addition, approximately 86% of our information technology services revenues, which represented approximately 10% of our total revenues in 2003, are derived from providing processing, software development and other services to Delta and Northwest. Although we believe that each founding airline will continue to distribute its travel services through our GDS and
13
that Delta and Northwest will continue to use our information technology services, there is no guarantee that our founding airlines will continue to use these services to the same extent as they did prior to the Acquisition or at all. In addition, although we have entered into noncompetition agreements with our founding airlines and each has agreed not to operate a GDS for three years after the Acquisition, there is no guarantee that our founding airlines will not indirectly compete with us in some or all of our markets, such as through supplier direct connections which could bypass our GDS. The loss or substantial reduction of fees from any of our founding airlines, or direct or indirect competition from any of our founding airlines, could negatively affect our business, financial condition and results of operations.
For instance, the information technology services that we perform for Delta include computer functionality known as "PNR Sync." In 2003, Delta notified us that it intended to terminate PNR Sync. Following discussions with Delta relating to the mutual benefits of PNR Sync to Delta and us, we reached an agreement with Delta in December 2003 to continue to provide PNR Sync to Delta for a minimum three-year period at a fixed price and subject to several conditions, term limitations and termination rights. A termination of the PNR Sync functionality by Delta would represent a material adverse effect on our business, financial condition and results of operations. Additionally, in March 2004, Delta notified us that our GDS transaction fee pricing did not satisfy the conditions of our marketing support agreement with Delta. Delta indicated that, until we modify our GDS transaction fee pricing, it would suspend marketing support of us and the discount that Delta has provided to us for business travel. Pursuant to the agreement, we are working with Delta to review the relevant data and to resolve these issues.
Critical Systems—Our systems may suffer failures, capacity constraints and business interruptions, which could increase our operating costs, decrease our revenues and cause us to lose customers.
The reliability of our GDS is critical to the success of our business. Much of our computer and communications hardware is located in a single data center located near Atlanta, Georgia. Our systems might be damaged or interrupted by fire, flood, power loss, telecommunications failure, break-ins, earthquakes, terrorist attacks, war or similar events. Computer malfunctions, computer viruses, physical or electronic break-ins and similar disruptions might cause system interruptions and delays and loss of critical data and could significantly diminish our reputation and brand name and prevent us from providing services. Although we believe we have taken adequate steps to address these risks, we could be harmed by outages in, or unreliability of, the data center or computer systems.
In addition, we rely on several communications services companies in the United States and internationally to provide network connections between our data center and our travel agencies' access terminals and also our travel suppliers. In particular, we rely upon AT&T and SITA, which is owned by a consortium of airlines and other travel-related businesses, to maintain our data communications and to provide network services in the United States and in many countries served by us. We occasionally experience network interruptions and malfunctions that make our global distribution system or other data processing services unavailable or less usable. Any significant failure or inability of AT&T, SITA or other communications companies to provide and maintain network access could have a material adverse effect on our business, financial condition and results of operations.
Protection of Technology—We may not protect our technology effectively, which would allow competitors to duplicate our products and services. This could make it more difficult for us to compete with them.
Our success and ability to compete depend, in part, upon our technology. Among our significant assets are our software and other proprietary information and intellectual property rights. We rely on a combination of copyright, trademark and patent laws, trade secrets, confidentiality procedures and contractual provisions to protect these assets. Our software and related documentation, however, are
14
protected principally under trade secret and copyright laws, which afford only limited protection, and the laws of some foreign jurisdictions provide less protection for our proprietary rights than the laws of the United States. Unauthorized use and misuse of our intellectual property could have a material adverse effect on our business, financial condition and results of operations, and there can be no assurance that our legal remedies would adequately compensate us for the damages caused by unauthorized use.
In addition, licenses for a number of software products have been granted to us. Some of these licenses, individually and in the aggregate, are material to our business. Although we believe that the risk that we will lose any material license is remote, any loss could have a material adverse effect on our business, financial condition and results of operations.
Intellectual Property—Our products and services may infringe on claims of intellectual property rights of third parties, which could adversely affect our business and operating results.
We do not believe that any of our products, services or activities infringe upon the intellectual property rights of third parties in any material respect. There can be no assurance, however, that third parties will not claim infringement by us with respect to current or future products, services or activities. Any infringement claim, with or without merit, could result in substantial costs and diversion of management and financial resources, and a successful claim could effectively block our ability to use or license products and services in the United States or abroad or cost us money. Any infringement claim, therefore, could have a material adverse effect on our business, financial condition and results of operations.
Technological Change—Rapid technological changes may render our technology obsolete or decrease the attractiveness of our products and services to customers.
Our industry is subject to rapid technological change as travel suppliers, travel agencies and competitors create new and innovative products and services. Our ability to compete in our business and our future results will depend, in part, upon our ability to make timely, innovative and cost-effective enhancements and additions to our technology and to introduce new products and services that meet the demands of travel suppliers, travel agencies and other customers. The success of new products and services depends on several factors, including:
- •
- identifying the needs of travel suppliers, travel agencies and other customers;
- •
- developing and introducing effective new products and services in a timely and efficient manner;
- •
- managing the cost of new product development and operations;
- •
- differentiating new products and services from those of our competitors; and
- •
- achieving market acceptance of new products and services.
In addition, maintaining the flexibility to respond to technological and market changes may require substantial expenditures and lead time. There can be no assurance that we will successfully identify and develop new products or services in a timely manner, that products, technologies or services developed by others will not render our offerings obsolete or noncompetitive or that the technologies in which we focus our research and development investments will achieve acceptance in the marketplace.
Our technology infrastructure is largely fixed. As a result, in the event of a significant reduction in transaction volumes or revenues, technology costs would remain relatively constant. If a reduction continued for a prolonged period, our business, financial condition and results of operations could be materially adversely affected.
15
Regulatory Risks—Regulatory developments could limit our ability to compete by restricting our flexibility to respond to competitive conditions.
Changes and developments in the regulatory environment could have an adverse affect on our financial condition or results of operations, including by negatively impacting our transaction volume, transaction fees and by otherwise impacting the way we operate our business. GDSs are regulated by the U.S., the European Union ("E.U.") and other countries in which we operate. The U.S. Department of Transportation ("DOT") and the European Commission ("EC") are the relevant regulatory authorities in the U.S. and the E.U., respectively. Most of the regulating bodies have reexamined or are examining their GDS regulations and appear to be moving toward deregulation. Regulatory changes in the U.S., E.U. or other countries could have a material adverse effect on our business, financial condition and results of operations.
On January 31, 2004, most DOT rules governing GDSs were lifted. The remaining DOT rules will be phased out at the end of July 2004. The DOT rules no longer contain any rules that apply uniquely to GDSs that are owned or marketed by airlines. In addition, deregulation in the U.S. could create uncertainty as to established GDS business models. Discontinuance of the rules could facilitate efforts by the airlines to divert travel bookings to distribution channels that they own and control and could also facilitate movement of travel agencies from one GDS to another. In addition, elimination of the rule prohibiting discrimination in airline fees could affect transaction fee revenues.
E.U. regulations continue to address the participation of airline GDS owners in other GDSs. See "Business—GDS Industry Regulation."
The EC is engaged in a comprehensive review of its rules governing GDSs. It is unclear at this time when the EC will complete its review and what changes, if any, will be made to the E.U. rules. We could be unfairly and adversely affected if the E.U. rules are retained as to traditional global distribution systems used by travel agencies but are not applied to businesses providing comparable services, such as travel distribution websites owned by more than one airline. In addition, we could be adversely affected if changes to the rules, changes in interpretations of the rules, or new rules increase our cost of doing business, limit our ability to establish relationships with travel agencies, airlines, or others, impair the enforceability of existing agreements with travel agencies and other users of our system, prohibit or limit us from offering services or products, or limit our ability to establish or changes fees. Continued GDS regulation in the E.U. and elsewhere, while GDS regulations are being abolished in the U.S., could also create the operational challenge of supporting different products, services and business practices to conform to the different regulatory regimes.
There are also GDS regulations in Canada, under the regulatory authority of the Canadian Department of Transport. On April 27, 2004, a significant number of these regulations were lifted. Amendments to the rules include eliminating the "obligated carrier" rule, which required larger airlines in Canada to participate equally in the GDSs, and elimination of the requirement that transaction fees charged by GDSs to airlines be non-discriminatory. Due to the elimination of the obligated carrier rule in Canada, Air Canada, the dominant Canadian airline, could choose distribution channels that it owns and controls or distribution through another GDS rather than through the Worldspan GDS.
Privacy and Data Protection—Our processing, storage, use and disclosure of personal data could give rise to liabilities as a result of governmental regulation, conflicting legal requirements or differing views of personal privacy rights.
In our processing of travel transactions, we receive and store a large volume of personally identifiable data. This data is increasingly subject to legislation in numerous jurisdictions around the world, including the E.U. through its Data Protection Directive (and variations of this Directive in the E.U. Member States). This legislation is typically intended to protect the privacy of personal data that is collected, processed and transmitted in or from the governing jurisdiction. We could be adversely
16
affected if the legislation is expanded to require changes in our business practices or if governing jurisdictions interpret or implement their legislation in ways that negatively affect our business, financial condition and results of operations.
In addition, in the aftermath of the terrorist attacks of September 11, 2001, government agencies have been contemplating or developing initiatives to enhance national and aviation security, including the Transportation Security Administration's Computer-Assisted Passenger Prescreening System, known as CAPPS II. These initiatives may result in conflicting legal requirements with respect to data handling. As privacy and data protection has become a more sensitive issue, we may also incur legal defense costs and become exposed to potential liabilities as a result of differing views on the privacy of travel data. Travel businesses have also been subjected to investigations, lawsuits and adverse publicity due to allegedly improper disclosure of passenger information. For example, we were initially named as one of the defendants in a class action lawsuit arising from disclosures by Northwest of passenger data to a U.S. government agency. An amended and consolidated class action lawsuit was recently refiled in this case and we are no longer a named defendant in the matter. We are evaluating whether we have any future liability arising from this matter. While we do not believe that this matter is material, other privacy developments that are difficult to anticipate could impact our business, financial condition and results of operations.
Key Employees—Our ability to attract, train and retain executives and other qualified employees is crucial to results of operations and future growth.
We depend substantially on the continued services and performance of our key executives, senior management and skilled personnel, particularly our professionals with experience in our business and operations and the GDS industry, including: Rakesh Gangwal, our Chairman and Chief Executive Officer, Gregory O'Hara, our Executive Vice President—Corporate Planning and Development; Ninan Chacko, our Senior Vice President—e-Commerce and Product Planning; David A. Lauderdale, our Chief Technology Officer and Senior Vice President—Technical Operations; Michael B. Parks, our Senior Vice President and General Manager; Susan J. Powers, our Chief Information Officer and Senior Vice President—Worldwide Product Solutions; Jeffrey C. Smith, our General Counsel, Secretary and Senior Vice President—Human Resources; and Michael Wood, our Senior Vice President and Chief Financial Officer. We have entered into employment agreements with Messrs. Gangwal, O'Hara, Chacko and Wood to provide them with incentives to remain employed by us, all as more fully described in the section of this prospectus entitled "Management—Employment Agreements." However, we cannot assure you that any of these individuals will continue to be employed by us. The specialized skills needed by our business are time-consuming and difficult to acquire and in short supply, and this shortage is likely to continue. A lengthy period of time is required to hire and train replacement personnel when skilled personnel depart the company. An inability to hire, train and retain a sufficient number of qualified employees could materially hinder our business by, for example, delaying our ability to bring new products and services to market or impairing the success of our operations. Even if we are able to maintain our employee base, the resources needed to attract and retain such employees may adversely affect our profits, growth and operating margins.
Business Combinations and Strategic Investments—We may not successfully make and integrate business combinations and strategic investments.
We plan to continue to enter into business combinations, investments, joint ventures and other strategic alliances with other companies in order to maintain and grow revenue and market presence as well as to provide us with access to technology, products and services. Those transactions with other companies create risks such as difficulty in assimilating the technology, products and operations with our technology, products and operations; disruption of our ongoing business, including loss of management focus on existing businesses; impairment of relationships with existing executives,
17
employees, customers and business partners; and losses that may arise from equity investments. In the past, in an effort to secure new technologies or obtain unique content for our GDS, we have invested in a number of early-stage technology companies. Each of these investments has required senior management attention. Many of these companies have failed, and most of our investments have been written down. If we enter into such transactions in the future, we may issue shares of stock that dilute the interests of our other stockholders, expend cash, incur debt, assume contingent liabilities or create additional expenses related to amortizing other intangible assets with estimable useful lives, any of which might harm our business, financial condition or results of operations. In addition, we may not be able to identify suitable candidates for these transactions or obtain financing or otherwise make these transactions on acceptable terms.
Seasonality—Because our business is seasonal, our quarterly results will fluctuate.
The travel industry is seasonal in nature. Bookings, and thus transaction fee revenues charged for the use of our GDS, typically decrease each year in the fourth quarter, due to the early bookings by customers for travel during the holiday season and a decline in bookings for business travel during the holiday season. During 2002 and 2003, our transactions in the fourth quarter have averaged approximately 22% of total transactions for those years. Seasonality could cause our revenues to fluctuate significantly from quarter to quarter. Substantial fluctuations in our results of operations could have a material adverse effect on us.
Trade Barriers—We face trade barriers outside of the United States that limit our ability to compete.
Trade barriers erected by non-U.S. travel suppliers, which are sometimes government-owned, have on occasion interfered with our ability to offer our products and services in their markets or have denied us content or features that they give to our competitors. Those trade barriers make our products and services less attractive to travel agencies in those countries than products and services offered by other GDSs that have these capabilities and have restricted our ability to gain market share outside of the U.S. Competition and trade barriers in those countries could require us to increase inducements, reduce prices, increase spending on marketing or product development, withdraw from or not enter certain markets or otherwise take actions adverse to us.
International Operations—Our international operations are subject to other risks which may impede our ability to grow internationally.
Approximately 14% of our revenues during the twelve months ended December 31, 2003 were generated through our foreign subsidiaries. We face risks inherent in international operations, such as risks of:
- •
- currency exchange rate fluctuations;
- •
- local economic and political conditions, including conditions resulting from the continuing conflict in Iraq;
- •
- restrictive governmental actions (such as trade protection measures, privacy rules, consumer protection laws and restrictions on pricing or discounts);
- •
- changes in legal or regulatory requirements;
- •
- limitations on the repatriation of funds;
- •
- difficulty in obtaining distribution and support;
- •
- nationalization;
- •
- different accounting practices and potentially longer payment cycles;
18
- •
- seasonal reductions in business activity;
- •
- higher costs of doing business;
- •
- lack of, or the failure to implement, the appropriate infrastructure to support our technology;
- •
- lesser protection in some jurisdictions for our intellectual property;
- •
- disruptions of capital and trading markets;
- •
- laws and policies of the U.S. affecting trade, foreign investment and loans; and
- •
- foreign tax and other laws.
These risks may adversely affect our ability to conduct and grow business internationally, which could cause us to increase expenditures and costs, decrease our revenue growth or both.
Exchange Rate Fluctuations—Fluctuations in the exchange rate of the U.S. dollar and other foreign currencies could have a material adverse effect on our financial performance and results of operations.
While we and our subsidiaries transact business primarily in U.S. dollars and most of our revenues are denominated in U.S. dollars, a portion of our costs and revenues are denominated in other currencies, such as the euro and the British pound sterling. As a result, changes in the exchange rates of these currencies or any other applicable currencies to the U.S. dollar will affect our operating expenses and operating margins and could result in exchange losses. The impact of future exchange rate fluctuations on our results of operations cannot be accurately predicted. In the past, we have incurred such losses, including a $1.0 million loss during 2001.
Environmental, Health and Safety Requirements—We could be adversely affected by environmental, health and safety requirements.
We are subject to requirements of foreign, federal, state and local environmental and occupational health and safety laws and regulations. These requirements are complex, constantly changing and have tended to become more stringent over time. It is possible that these requirements may change or liabilities may arise in the future in a manner that could have a material adverse effect on our business, financial condition and results of operations. We cannot assure you that we have been or will be at all times in complete compliance with all those requirements or that we will not incur material costs or liabilities in connection with those requirements in the future.
Additional Capital—We may need additional capital in the future and it may not be available on acceptable terms.
We may require more capital in the future to:
- •
- fund our operations;
- •
- finance investments in equipment and infrastructure needed to maintain and expand our network;
- •
- enhance and expand the range of services we offer; and
- •
- respond to competitive pressures and potential strategic opportunities, such as investments, acquisitions and international expansion.
We cannot assure you that additional financing will be available on terms favorable to us, or at all. The terms of available financing may place limits on our financial and operating flexibility. If adequate funds are not available on acceptable terms, we may be forced to reduce our operations or abandon expansion opportunities. Moreover, even if we are able to continue our operations, the failure to obtain
19
additional financing could reduce our competitiveness as our competitors may provide better maintained networks or offer an expanded range of services.
Securities Laws Compliance—Recently enacted and proposed changes in securities laws and regulations are likely to increase our costs.
The Sarbanes-Oxley Act of 2002, as well as new rules subsequently implemented by the Securities and Exchange Commission, have required changes in some of our corporate governance and accounting practices. In addition, the New York Stock Exchange has promulgated a number of regulations. We expect these laws, rules and regulations to increase our legal and financial compliance costs and to make some activities more difficult, time consuming and costly. We also expect these new rules and regulations to make it more difficult and more expensive for us to obtain director and officer liability insurance, and we may be required to accept reduced coverage or incur significantly higher costs to obtain coverage. These new laws, rules and regulations could also make it more difficult for us to attract and retain qualified members of our board of directors, particularly to serve on our audit committee, and qualified executive officers.
Substantial Indebtedness—Our substantial consolidated indebtedness could adversely affect our financial condition and the value of your investment in our Common Stock.
Our substantial consolidated indebtedness could have important consequences to you and our business, including requiring us to spend a substantial amount of our cash flow from operations to make payments in respect of our indebtedness, increasing our vulnerability to adverse general economic or industry conditions and placing us at a competitive disadvantage compared to our competitors with less indebtedness. As of March 31, 2004, on a pro forma basis after giving effect to this offering, our total consolidated indebtedness would have been approximately $454.2 million and our total consolidated debt as a percentage of total capitalization would have been 44%. Our ability to make payments on and to refinance our indebtedness and to fund planned capital expenditures and research and development efforts will depend on our ability to generate cash in the future. This, to a certain extent, is subject to general economic, financial, competitive, legislative, regulatory and other factors that are beyond our control. In addition, the operating and financial restrictions and covenants in our debt instruments could adversely affect our ability to finance future operations or capital needs or engage in other business activities that may be in our interest.
Based on our current level of operations and anticipated cost savings and operating improvements, we believe our cash flow from operations, available cash and available borrowings under our senior credit facility, will be adequate to meet our future liquidity needs for the foreseeable future. We cannot assure you, however, that our business will generate sufficient cash flow from operations, that currently anticipated cost savings and operating improvements will be realized on schedule or that future borrowings will be available to us under our senior credit facility in an amount sufficient to enable us to pay our indebtedness, or to fund our other liquidity needs. We may need to refinance all or a portion of our indebtedness on or before maturity. We cannot assure you that we will be able to refinance any of our indebtedness on commercially reasonable terms or at all.
Risks Related to this Offering
Stock Price Volatility—The price of our Common Stock may be volatile and subject to wide fluctuations.
The market price of the securities of travel-related companies has been especially volatile. Thus, the market price of our Common Stock may be subject to wide fluctuations. If our revenue does not increase or increases less than we anticipate, or if operating or capital expenditures exceed our estimates and cannot be adjusted accordingly, or if some other event adversely affects us, the market
20
price of our Common Stock could decline. In addition, if the market for travel-related stocks or the stock market in general experiences a loss in investor confidence or otherwise falls, the market price of our Common Stock could fall for reasons unrelated to our business, results of operations or financial condition. The market price of our Common Stock also might decline in reaction to events that affect other companies in our industry, even if these events do not directly affect us. The initial public offering price of our Common Stock will be determined through negotiations between the representatives of the underwriters and us and may not be representative of the price that will prevail in the open market. You might be unable to resell your shares of our Common Stock at or above the offering price. In the past, companies that have experienced volatility in the market price of their stock have been the subject of securities class action litigation. If we were to become the subject of securities class action litigation, it could result in substantial costs and a diversion of management's attention and resources.
Fluctuations in Revenues and Operating Results—We may experience significant period-to-period quarterly and annual fluctuations in our revenue and operating results, which may result in volatility in our stock price.
We may experience significant period-to-period fluctuations in our sales and operating results in the future due to a number of factors and any such variations may cause our stock price to fluctuate. It is likely that in some future period our operating results will be below the expectations of securities analysts or investors. If this occurs, the price of our Common Stock could drop significantly.
A number of factors, in addition to those cited in other risk factors, may contribute to fluctuations in our sales and operating results, including:
- •
- actual or anticipated variations in quarterly operating results;
- •
- changes in financial estimates by us or any securities analysts who might cover our stock;
- •
- conditions or trends in our industry;
- •
- changes in the market valuations of other GDSs, travel agencies or travel suppliers;
- •
- announcements by us or our competitors of significant acquisitions, strategic partnerships or divestitures;
- •
- announcements of investigations or regulatory scrutiny of our operations or lawsuits filed against us;
- •
- capital commitments;
- •
- additions or departures of key personnel; and
- •
- sales of our Common Stock, including sales of our Common Stock by our directors, officers or principal stockholders.
Holding Company—We are a holding company that depends on dividends from our subsidiaries to meet our cash requirements and we do not anticipate paying any dividends on our Common Stock in the foreseeable future.
We are a holding company with no business operations. Our only significant assets are the general partnership interests and limited partnership interest in Worldspan, our wholly owned subsidiary through which we conduct all our business operations, and certain intangible assets. As a consequence, the success of an investment in our Common Stock will be entirely dependent upon the future performance of Worldspan and its subsidiaries and will be subject to the financial, business and other factors affecting Worldspan and its subsidiaries and the markets in which they do business, as well as general economic and financial conditions. We will not be able to pay cash dividends on our Common
21
Stock without receiving dividends or other distributions from Worldspan. Furthermore, Worldspan is restricted by its senior credit facility and its senior notes from paying dividends or making distributions to us. In any event, we currently expect that Worldspan's earnings and cash flow will be retained for use in its operations and to service its debt obligations. Even if we determined to pay a dividend on or make a distribution in respect of our Common Stock, we cannot assure you that our subsidiaries will generate sufficient cash flow to pay a dividend or distribute funds to us or that applicable state law and contractual restrictions will permit such dividends or distributions. Accordingly, investors must rely on sales of their Common Stock after price appreciation, which may never occur, as the only way to realize any future gains on their investment. Investors seeking cash dividends should not purchase our Common Stock.
Subordination—In the event of our bankruptcy, liquidation or reorganization, your claims will be subordinate to our substantial debt obligations.
Because virtually all of our assets are and will be held by operating subsidiaries, the claims of our stockholders will be structurally subordinate to all existing and future liabilities and obligations (whether or not for borrowed money), including debt under Worldspan's senior secured credit facilities and its senior notes and trade payables of Worldspan and its subsidiaries. In addition, the claims of our stockholders will be subordinate to all existing and future liabilities and obligations of WTI. Therefore, in the event of our bankruptcy, liquidation or reorganization, our assets and those of our subsidiaries will be available to satisfy the claims of our stockholders only after all our and our subsidiaries' liabilities and obligations have been paid in full.
Principal Stockholders—Our principal stockholders exert substantial influence over us and may exercise their control in a manner adverse to your interests.
Upon completion of the Transactions, assuming no exercise of the underwriter's over-allotment option, CVC and OTPP will own shares (including shares of Common Stock issuable upon conversion of Class B Convertible Common Stock), or approximately %, of our outstanding common stock. Because a limited number of persons control us, transactions could be difficult or impossible to complete without the support of those persons. It is possible that these persons will exercise control over us in a manner adverse to your interests. See "Principal and Selling Stockholders" and "Certain Relationships and Related Transactions" for further information regarding the ownership of our capital stock and the stockholders agreement.
Anti-Takeover Provisions—Delaware law could discourage potential acquisition proposals and could delay, deter or prevent a change in control.
The anti-takeover provisions of Delaware law impose various impediments to the ability of a third party to acquire control of us, even if a change in control would be beneficial to our existing stockholders.
Future Sales—Future sales of shares could depress our stock price.
If our existing stockholders sell substantial amounts of our common stock (including shares of Common Stock issuable upon conversion of Class B Convertible Common Stock) in the public market following this offering, the market price of our Common Stock could decline. Based on 83,037,152 shares outstanding as of May 10, 2004, upon completion of this offering we will have outstanding approximately shares of Common Stock, assuming no exercise of the underwriters' over-allotment option and 11,000,000 shares of Class B Convertible Common Stock. All of the shares of our
22
Common Stock sold in this offering will be freely tradable, without restriction, in the public market. Of the remaining shares:
- •
- shares held by our principal stockholders will be eligible for sale in the public market after the applicable lock-up period expires, subject to compliance with the volume limitations and other conditions of Rule 144; and
- •
- shares held by our directors and executive officers will be eligible for sale in the public market after the applicable lock-up period expires, subject to compliance with the volume limitations and other conditions of Rule 144.
Furthermore, an additional 3,822,000 shares of Common Stock may be issued in the future upon exercise of outstanding options and an additional 2,178,000 shares of Common Stock have been reserved for issuance under our stock incentive plan. We expect to register these shares under the Securities Act, and therefore the shares will be freely tradable when issued, subject to compliance with the volume limitations and other conditions of Rule 144 in the case of shares sold by persons deemed to be our affiliates.
Our existing stockholders are parties to an agreement that provides for registration rights. Registration of the sale of these shares of our common stock would permit their sale into the market immediately. Moreover, the perception in the public market that these stockholders might sell shares of our common stock could depress the market price of the common stock. See "Shares Eligible for Future Sale" for more detailed information. Additionally, we may sell additional shares of common stock in subsequent public offerings, which may adversely affect market prices for our common stock.
No Current Trading Market—There is currently no public market for our Common Stock, and we cannot predict the extent to which a trading market will develop for our Common Stock.
There has not been a public market for our Common Stock. We cannot predict the extent to which a trading market will develop or how liquid that market might become. If an active trading market does not develop, you may have difficulty selling any of our Common Stock that you buy. The initial public offering price has been determined by negotiations between representatives of the underwriters and us and may not be indicative of prices that will prevail in the trading market. As a result, if you purchase shares of Common Stock, you may not be able to resell those shares at or above the initial public offering price.
Dilution—You will incur immediate and substantial dilution.
The initial public offering price is substantially higher than the pro forma net book value per share of our outstanding Common Stock. As a result, if you purchase shares in this offering, you will incur immediate and substantial dilution in the amount of $ per share, assuming an initial public offering price of $ per share, the mid-point of the range reflected on the cover of this prospectus. In addition, we have issued options to acquire shares of our Common Stock at prices significantly below the initial public offering price. To the extent these securities are exercised, you will incur further dilution. See "Dilution" for a more complete description of the dilution that you will incur.
23
Statements in this prospectus and the exhibits hereto which are not purely historical facts, including statements about forecasted financial projections or other statements about anticipations, beliefs, expectations, hopes, intentions or strategies for the future, may be forward-looking statements. Readers are cautioned not to place undue reliance on forward-looking statements. All forward-looking statements are based upon information available to us on the date this prospectus was submitted. We undertake no obligation to publicly update or revise any forward-looking statements, whether as a result of new information, future events or otherwise. Any forward-looking statements involve risks and uncertainties that could cause actual events or results to differ materially from the events or results described in the forward-looking statements, including, but not limited to, risks or uncertainties related to: the computer reservation system rules of the Department of Transportation; our revenues being highly dependent on the travel and transportation industries; airlines limiting their participation in travel marketing and distribution services; or other changes within the travel industry. We may not succeed in addressing these and other risks.
We have obtained some industry data from third party sources that we believe to be reliable. In particular, we obtained raw airline bookings data compiled by DOB Systems, Inc. and sold as marketing industry data tapes (or MIDT), and our determinations of market size and share within our industry are based on our processing of this data. In many cases, however, we have made statements in this prospectus regarding our industry and our position in the industry based on our experience in the industry and our own investigation of market conditions. In particular, we designate each travel agency for which we process transactions as traditional or online based on our belief as to whether a travel agency is traditional or online. Our designation of travel agencies as online or traditional is based on an agency's aggregate booking activity for all its locations and our knowledge of the agency. These designations may be revised as an agency's business changes. For example, Cheap Tickets' business was originally driven by a traditional call center. As it moved to predominantly online bookings last year, we recategorized it as online.
24
We estimate that the net proceeds from the sale of shares of our Common Stock in this offering will be approximately $ million, based on an assumed initial public offering price of $ per share, the mid-point of the range set forth on the cover of this prospectus, after deducting underwriting discounts and commissions and estimated offering expenses payable by us. If the underwriters exercise their over-allotment option in full, we estimate that our net proceeds will be approximately $ million.
We expect to use the net proceeds of this offering, together with proceeds of our new senior credit facility, as follows:
- •
- approximately $71.0 million to repay indebtedness under our existing senior credit facility, which bears interest at a variable rate and matures on June 30, 2007;
- •
- approximately $107.4 million to repurchase a portion of our 95/8% senior notes due June 15, 2011 and pay related premiums;
- •
- approximately $89.1 million to prepay all outstanding indebtedness under the 10% seller notes originally issued to Delta and 12% seller notes originally issued to American, each due July 31, 2012;
- •
- approximately $152.6 million to prepay all credits to be provided to Delta and Northwest pursuant to their FASA;
- •
- approximately $353.2 million to redeem our outstanding shares of Series A Preferred Stock;
- •
- approximately $5.3 million to terminate our advisory fees payable to CVC Management LLC(1); and
- •
- approximately $3.5 million to prepay the special dividend payable on our Class B Convertible Common Stock.(1)
- •
- approximately $2.4 million for general working capital purposes.
- (1)
- These payments will be made by us within 90 days of the consummation of this offering.
We have not in the past paid, and do not expect for the foreseeable future to pay, dividends on our Common Stock. Instead, we anticipate that all of our earnings, if any, in the foreseeable future will be used for working capital and other general corporate purposes. The payment of dividends by us to holders of our Common Stock is prohibited by our senior credit facility and is restricted by the indenture governing our senior notes. Any future determination to pay dividends will be at the discretion of our board of directors and will depend upon, among other factors, our results of operations, financial condition, capital requirements and contractual restrictions.
25
The following table sets forth our cash and cash equivalents and capitalization as of March 31, 2004 on an actual basis and as adjusted for the sale by us of Common Stock in this offering and the application of our estimated net proceeds from the transactions discussed under "Use of Proceeds," after deducting underwriting discounts and commissions and estimated offering expenses. The table below should be read in conjunction with our consolidated financial statements and related notes included elsewhere in this prospectus.
| | As of March 31, 2004 | ||||||
|---|---|---|---|---|---|---|---|
| | Actual | As Adjusted | |||||
| | (dollars in thousands) (unaudited) | ||||||
| Cash and cash equivalents | $ | 33,087 | $ | 26,231 | |||
| Senior credit facility(1): | |||||||
| Revolving credit facility | $ | — | $ | — | |||
| Term loan facility | 86,000 | 185,000 | |||||
| Capital leases | 87,152 | 87,152 | |||||
| Senior notes | 280,000 | 182,000 | |||||
| Seller notes | 86,490 | — | |||||
Total debt | 539,642 | 454,152 | |||||
Series A preferred stock subject to mandatory redemption | 344,734 | — | |||||
Stockholders' (deficit) equity | (25 | ) | 577,096 | ||||
Total capitalization | $ | 884,351 | $ | 1,031,248 | |||
- (1)
- As of March 31, 2004, we had $50.0 million of unused borrowing capacity under our revolving credit facility. Concurrently with the closing of this offering we expect to enter into a new senior credit facility, consisting of a $185 million senior term loan facility and a $40 million senior revolving credit facility (which will be undrawn as of the closing of this offering).
26
If you invest in our Common Stock, your interest will be diluted to the extent of the difference between the public offering price per share of our Common Stock and the adjusted net tangible book value per share of Common Stock immediately upon the completion of this offering.
The net tangible book value (deficit) of our Common Stock as of March 31, 2004 was $(735.1) million, or $(8.85) per share. Net tangible book value per share before the offering has been determined by dividing net tangible book value (deficit) (total book value of tangible assets less total liabilities and redeemable preferred stock) by the number of shares of Common Stock outstanding as of March 31, 2004. After giving effect to the sale of our Common Stock in this offering, at an assumed initial public offering price of $ per share (the mid-point of the range set forth on the cover page of this prospectus), and after deducting underwriting discounts and commissions and estimated offering expenses payable by us, and giving effect to the other transactions described under "Use of Proceeds," our adjusted net tangible book value as of December 31, 2003 would have been $ million, or $ per share. This represents an increase in net tangible book value per share of $ to existing stockholders and dilution in net tangible book value per share of $ to new investors who purchase shares in the offering. The following table summarizes this per share dilution:
| Assumed initial public offering price per share | $ | |||||||
| Net tangible book deficit per share at March 31, 2004 | $ | (8.85 | ) | |||||
| Increase per share attributable to this offering | — | |||||||
| Adjusted net tangible book value per share after the offering | ||||||||
| Dilution in net tangible book value per share to new investors | $ | |||||||
The following table summarizes as of March 31, 2004, the differences between our existing stockholders and new investors with respect to the number of shares of Common Stock issued by us, the total consideration paid and the average price per share paid:
| | Shares Purchased | Total Consideration | | ||||||||||
|---|---|---|---|---|---|---|---|---|---|---|---|---|---|
| | Average Price Per Share | ||||||||||||
| | Number | Percent | Amount | Percent | |||||||||
| | (in millions) | (in millions) | | ||||||||||
| Existing stockholders | % | $ | % | $ | |||||||||
| New investors | |||||||||||||
| Total | % | $ | % | ||||||||||
If the underwriters exercise their over-allotment option in full, the following will occur: (1) the number of shares of Common Stock held by existing stockholders will represent approximately % of the total number of shares of Common Stock outstanding; and (2) the number of shares of Common Stock held by new investors will be increased to .
As of May 10, 2004, there were an aggregate of: (1) 3,822,000 shares of Common Stock issuable upon the exercise of outstanding options granted under our stock incentive plan at a weighted average exercise price of $4.55 per share, of which there were no options to purchase shares then exercisable; and (2) 189,001 shares of Common Stock are available for issuance as restricted stock under the stock incentive plan and options to purchase 2,178,000 shares of Common Stock may be granted under the stock incentive plan.
27
The following table adjusts the information set forth in the table above to reflect the assumed exercise of options described in the preceding paragraph that were outstanding as of March 31, 2004:
| | Shares Purchased | Total Consideration | | ||||||||||
|---|---|---|---|---|---|---|---|---|---|---|---|---|---|
| | Average Price Per Share | ||||||||||||
| | Number | Percent | Amount | Percent | |||||||||
| | (in millions) | (in millions) | | ||||||||||
| Existing stockholders | % | $ | % | $ | |||||||||
| Option holders | |||||||||||||
| New investors | |||||||||||||
Total | % | $ | % | ||||||||||
Assuming the exercise of the foregoing outstanding options, dilution to new investors in net tangible book value per share would be $ .
28
UNAUDITED PRO FORMA CONDENSED CONSOLIDATED FINANCIAL STATEMENTS
The following unaudited pro forma condensed consolidated financial statements are presented to illustrate the effects of the following transactions on our historical financial position and results of operations:
- (i)
- the acquisition by WTI of the general partnership interests and the limited partnership interest of Worldspan (the "Acquisition");
- (ii)
- our new senior credit facility and the offering and use of proceeds as described herein (this "offering") (collectively, the "Transactions").
Historical amounts for the year ended December 31, 2003 are derived from our audited 2003 consolidated financial statements, which represent the mathematical addition of the Successor basis results of operations and the Predecessor basis results of operations and are not consistent with GAAP. Historical amounts as of and for the three months ended March 31, 2004 are derived from our unaudited consolidated financial statements.
The pro forma adjustments are based upon available information and certain assumptions that we believe are reasonable under the circumstances. These adjustments are more fully described in the notes to the pro forma condensed consolidated financial statements below.
The unaudited pro forma condensed consolidated balance sheet at March 31, 2004 assumes that the Transactions took place on that date. The unaudited pro forma condensed consolidated statement of operations for the year ended December 31, 2003 and the three months ended March 31, 2004 assume that the Transactions described above took place on January 1, 2003, the beginning of our 2003 fiscal year. Such information is not necessarily indicative of our financial position or results of operations that would have occurred if the Transactions had been consummated as of the dates indicated, nor should it be construed as being a representation of our future financial position or results of operations.
The unaudited pro forma condensed consolidated financial statements should be read in conjunction with "Management's Discussion and Analysis of Financial Condition and Results of Operations" and our consolidated financial statements, the related notes and the other financial information included elsewhere in this prospectus.
29
Unaudited Pro Forma Condensed Consolidated Statement of Operations
for the Year Ended December 31, 2003
| | | Successor Basis | | | | | |||||||||||||||
|---|---|---|---|---|---|---|---|---|---|---|---|---|---|---|---|---|---|---|---|---|---|
| | Predecessor Basis | | | | | ||||||||||||||||
| | Six Months Ended December 31, 2003 | | | | | ||||||||||||||||
| | Six Months Ended June 30, 2003 | Acquisition Pro Forma Adjustments | Acquisition Pro Forma | Pro Forma Adjustments for the Transactions | Pro Forma | ||||||||||||||||
| | (dollars in thousands) | ||||||||||||||||||||
| Revenues: | |||||||||||||||||||||
| Electronic travel distribution | $ | 414,933 | $ | 396,488 | $ | — | $ | 811,421 | $ | — | $ | 811,421 | |||||||||
| Information technology services | 52,539 | 32,974 | (8,333 (8,333 | )(b) )(b) | 68,847 | 16,667 16,667 (11,029 (11,398 | (j) (j) )(j) )(j) | 79,754 | |||||||||||||
| Total revenues | 467,472 | 429,462 | (16,666 | ) | 880,268 | 10,907 | 891,175 | ||||||||||||||
Operating expenses: | |||||||||||||||||||||
| Cost of revenues | 341,828 | 330,618 | 3,408 1,314 | (d) (c) | 677,168 | — | 677,168 | ||||||||||||||
| Selling, general and administrative | 76,141 | 72,424 | 450 | (e) | 149,015 | (900 | )(k) | 148,115 | |||||||||||||
| Amortization of intangible assets | — | 18,270 | 18,270 | (d) | 36,540 | — | 36,540 | ||||||||||||||
| Total operating expenses | 417,969 | 421,312 | 23,442 | 862,723 | (900 | ) | 861,823 | ||||||||||||||
Operating income | 49,503 | 8,150 | (40,108 | ) | 17,545 | 11,807 | 29,352 | ||||||||||||||
| Other Income/(expense): | |||||||||||||||||||||
| Interest income | 401 | 295 | — | 696 | — | 696 | |||||||||||||||
| Interest expense | (2,756 | ) | (25,481 | ) | (2,677 (13,475 (4,728 (1,311 | )(f) )(f) )(f) )(f) | (50,428 | ) | 6,003 26,950 9,318 2,622 (6,330 (17,518 (1,223 | (l) (l) (l) (l) )(l) )(l) )(l) | (30,606 | ) | |||||||||
| Equity in gain of investees | 130 | 278 | — | 408 | — | 408 | |||||||||||||||
| Write-down of impaired investments | — | (1,232 | ) | — | (1,232 | ) | — | (1,232 | ) | ||||||||||||
| Change-in-control expense | (17,259 | ) | — | 17,259 | (g) | — | — | — | |||||||||||||
| Other, net | (1,461 | ) | (11 | ) | — | (1,472 | ) | — | (1,472 | ) | |||||||||||
| Total other expense, net | (20,945 | ) | (26,151 | ) | (4,932 | ) | (52,028 | ) | 19,822 | (32,206 | ) | ||||||||||
Income (loss) before taxes | 28,558 | (18,001 | ) | (45,040 | ) | (34,483 | ) | 31,629 | (2,854 | ) | |||||||||||
Income tax expense | 144 | 989 | — | (h) | 1,133 | — | (n) | 1,133 | |||||||||||||
| Net income (loss) | $ | 28,414 | $ | (18,990 | ) | $ | (45,040 | ) | $ | (35,616 | ) | $ | 31,629 | $ | (3,987 | ) | |||||
See accompanying Notes to Unaudited Pro Forma Condensed Consolidated Financial Statements
30
Unaudited Pro Forma Condensed Consolidated Statement of Operations
for the Three Months Ended March 31, 2004
| | Historical Three Months Ended March 31, 2004 | Pro Forma Adjustments for the Transactions | Pro Forma | |||||||||
|---|---|---|---|---|---|---|---|---|---|---|---|---|
| | (dollars in thousands) | |||||||||||
| Revenues: | ||||||||||||
| Electronic travel distribution | $ | 232,539 | $ | — | $ | 232,539 | ||||||
| Information technology services | 15,992 | 4,167 4,167 (2,757 (2,850 | (j) (j) )(j) )(j) | 18,719 | ||||||||
| Total revenues | 248,531 | 2,727 | 251,258 | |||||||||
Operating expenses: | ||||||||||||
| Cost of revenues | 175,845 | — | 175,845 | |||||||||
| Selling, general and administrative | 36,255 | (225 | )(k) | 36,030 | ||||||||
| Amortization of intangible assets | 9,135 | — | 9,135 | |||||||||
| Total operating expenses | 221,235 | (225 | ) | 221,010 | ||||||||
Operating income | 27,296 | 2,952 | 30,248 | |||||||||
Other Income/(expense): | ||||||||||||
| Interest income | 99 | — | 99 | |||||||||
| Interest expense | (13,160 | ) | 1,458 6,738 2,364 1,207 (1,197 (4,379 (306 | (l) (l) (l) (l) )(l) )(l) )(l) | (7,275 | ) | ||||||
| Equity in gain of investees | (50 | ) | — | (50 | ) | |||||||
| Other, net | (265 | ) | — | (265 | ) | |||||||
| Total other expense, net | (13,376 | ) | 5,885 | (7,491 | ) | |||||||
Income before taxes | 13,920 | 8,837 | 22,757 | |||||||||
Income tax expense | 229 | — | (n) | 229 | ||||||||
Net income | $ | 13,691 | $ | 8,837 | $ | 22,528 | ||||||
See accompanying Notes to Unaudited Pro Forma Condensed Consolidated Financial Statements
31
Unaudited Pro Forma Condensed Consolidated Balance Sheet
as of March 31, 2004
| | Historical March 31, 2004(a) | Pro Forma Adjustments for the Transactions | Pro Forma March 31, 2004 | |||||||||
|---|---|---|---|---|---|---|---|---|---|---|---|---|
| | (dollars in thousands) | |||||||||||
| Assets | ||||||||||||
| Current Assets | ||||||||||||
| Cash and cash equivalents | $ | 33,087 | $ | (6,856) | (i) | $ | 26,231 | |||||
| Trade accounts receivable, net | 142,041 | — | 142,041 | |||||||||
| Prepaid expenses and other current assets | 15,347 | — | 15,347 | |||||||||
| Total current assets | 190,475 | (6,856 | ) | 183,619 | ||||||||
Property and equipment, less accumulated depreciation | 137,406 | — | 137,406 | |||||||||
| Deferred charges | 34,899 | — | 34,899 | |||||||||
| Debt issuance costs, net | 12,419 | (4,179 | )(m) | 8,240 | ||||||||
| Goodwill | 109,788 | — | 109,788 | |||||||||
| Other intangible assets, net | 625,295 | — | 625,295 | |||||||||
| Investments | 6,115 | — | 6,115 | |||||||||
| Other long term assets | 22,510 | 77,136 | (i)(j) | 179,159 | ||||||||
| 79,513 | (i)(j) | |||||||||||
| Total assets | $ | 1,138,907 | $ | 145,614 | $ | 1,284,521 | ||||||
Liabilities, Preferred Stock Subject to Mandatory Redemption and Stockholders' Equity | ||||||||||||
| Current liabilities | ||||||||||||
| Accounts payable | $ | 18,452 | $ | — | $ | 18,452 | ||||||
| Accrued expenses | 162,125 | — | 162,125 | |||||||||
| Current portion of capital lease obligations | 20,107 | — | 20,107 | |||||||||
| Current portion of long-term debt | 12,250 | (12,250 | )(i) | 60,000 | ||||||||
| 60,000 | (i) | |||||||||||
| Total current liabilities | 212,934 | 47,750 | 260,684 | |||||||||
Long-term portion of capital lease obligations | 67,045 | — | 67,045 | |||||||||
| Term loan | 73,750 | (73,750 | )(i) | 125,000 | ||||||||
| 125,000 | (i) | |||||||||||
| Senior notes | 280,000 | (98,000 | )(i) | 182,000 | ||||||||
| Seller notes | 86,490 | (86,490 | )(i) | — | ||||||||
| Pension and postretirement benefits | 65,959 | — | 65,959 | |||||||||
| Other long-term liabilities | 8,020 | (1,283 | )(i) | 6,737 | ||||||||
Total liabilities | 794,198 | (86,773 | ) | 707,425 | ||||||||
Series A preferred stock subject to mandatory redemption | 344,734 | (344,734 | )(i) | — | ||||||||
Stockholders' equity | ||||||||||||
| Common stock | 30,000 | 645,000 | (i) | 632,500 | ||||||||
| (42,500 | )(i) | |||||||||||
| Retained deficit | (30,025 | ) | (3,500 | )(i) | (55,404 | ) | ||||||
| (5,300 (9,400 (7,179 | )(i) )(i) )(m) | |||||||||||
| Total liabilities, preferred stock subject to mandatory redemption and stockholders' equity | $ | 1,138,907 | $ | 145,614 | $ | 1,284,521 | ||||||
See accompanying Notes to Unaudited Pro Forma Condensed Consolidated Financial Statements
32
Notes to Unaudited Pro Forma Condensed Consolidated Financial Statements
(dollars in thousands)
The unaudited pro forma condensed consolidated statement of operations for the year ended December 31, 2003 gives effect to the following adjustments related to the Acquisition. These adjustments do not affect the unaudited pro forma condensed consolidated statement of operations for the three months ended March 31, 2004, as they are already reflected in the historical accounts for that period:
(a) The Acquisition was accounted for as a purchase in the historical amounts in accordance with Statement of Financial Accounting Standards No. 141,Business Combinations. The adjustments reflect the Acquisition financing and purchase accounting adjustments as follows (dollars in thousands):
| Funds used for the Acquisition: | |||||
| Equity contributions | $ | 348,618 | |||
| Proceeds from our senior credit facility | 125,000 | ||||
| Proceeds from the senior notes | 280,000 | ||||
| Proceeds from the seller notes | 84,000 | ||||
| Excess cash | (8,686 | ) | |||
| Total funds used for the Acquisition | $ | 828,932 | |||
| Book value of net assets acquired(1) | $ | 37,527 | |||
| Additional fair value of tangible assets acquired | 19,110 | ||||
| Additional fair value of liabilities assumed | (5,621 | ) | |||
| Deferred financing costs related to old term loan and the senior notes | 14,937 | ||||
| Additional fair value of identifiable intangible assets acquired | 762,979 | ||||
| Total net assets acquired, at fair value | $ | 828,932 | |||
The assets and liabilities deemed to be acquired pursuant to the purchase agreement are recorded at fair value. The intangible assets acquired and their respective estimated values are as follows (dollars in thousands):
| Customer contracts | $ | 357,744 | |
| Developed technology | 236,837 | ||
| Trade names | 72,142 | ||
| Goodwill | 109,788 |
- (1)
- The purchase agreement provided the we would retain $30,000 cash at the closing of the Acquisition. The book value of net assets acquired includes an adjustment of $13,931 to reflect the distribution of cash in excess of $30,000 at June 30, 2003 to the seller airlines.
Customer contracts consist of agency relationships with useful lives of 11 years, e-commerce contracts with useful lives of 8 years, FASA contracts with useful lives of 15 years and IT services contracts with useful lives of 5 years. Developed technology has a useful life of 11 years, and trade names have indefinite useful lives.
(b) We record credits provided under the FASAs as contra-information technology services revenue in accordance with EITF No. 01-9 at a rate of $2,778 per month or $33,333 per year. Since we entered into the FASAs on June 30, 2003 in connection with the Acquisition, we recorded contra-information technology services revenue for the period of July 1, 2003 through December 31, 2003 of $8,333 for the Delta FASA and $8,333 for the Northwest FASA. To reflect the pro forma effect of entering into both FASAs as of January 1, 2003, we would have recorded
33
additional contra-information technology services revenue for the period ending December 31, 2003 of $8,333 for the Delta FASA and $8,333 for the Northwest FASA.
(c) To reflect the additional annual depreciation expense included in cost of revenues resulting from $19,110 increase in the basis of property and equipment acquired at June 30, 2003 based on estimated useful lives of three to nineteen years.
| | Year Ended December 31, 2003 | ||
|---|---|---|---|
| Depreciation, historical | $ | 48,631 | |
| Depreciation, after adjustments | 49,945 | ||
| Additional cost of revenues | 1,314 | ||
(d) To reflect the amortization of intangible assets on a straight line basis over periods ranging from five to fifteen years. Amortization related to developed software is included in costs of revenues, and amortization related to customer relationships is included in amortization of intangible assets. In accordance with SFAS 142,Goodwill and Other Intangible Assets, values related to trade names and to goodwill resulting from the Acquisition are not amortized.
| | Year Ended December 31, 2003 | ||
|---|---|---|---|
| Amortization, historical | $ | 36,646 | |
| Amortization, after adjustments | 58,324 | ||
| Additional cost of revenues | 3,408 | ||
| Additional amortization of intangible assets | 18,270 | ||
(e) To reflect the additional selling, general and administrative expenses relating to the advisory fees of $900 annually to be paid to CVC Management LLC under its advisory agreement with us. See "Certain Relationships and Related Transactions—Advisory Agreements."
| | Year Ended December 31, 2003 | ||
|---|---|---|---|
| Advisory fees, historical | $ | 450 | |
| Advisory fees, after adjustments | 900 | ||
| Additional expense | 450 | ||
(f) To reflect the increase in interest expense as a result of (i) the annual interest expense associated with $125,000 of variable rate (5.13% at assumed Transaction date) debt under the old term loan facility portion of our senior credit facility payable in quarterly installments over a 48 month period of four years, (ii) the annual interest expense associated with the $280,000 of
34
senior notes, (iii) the annual interest expense associated with the $84,000 seller notes and (iv) the annual amortization of debt issuance costs on our old senior credit facility.
| | Year Ended December 31, 2003 | ||
|---|---|---|---|
| Additional interest on the $125.0 million old term loan for the first six months of the year | $ | 2,677 | |
| Additional interest on the senior notes for the first six months of the year | 13,475 | ||
| Additional interest on the seller notes for the first six months of the year | 4,728 | ||
| Additional debt issuance cost amortization for the first six months of the year | 1,311 | ||
The actual interest rate on the variable rate indebtedness incurred to consummate the Transactions could vary from those used to compute the above adjustment of interest expense. A one-eighth percent increase in these rates would increase interest expense for the year ended December 31, 2003 by approximately $62.
(g) In the historical statement of operations, the change-in-control expense was recorded in the period prior to the closing of the Acquisition. To reflect the pro forma effect of the Transactions occurring on January 1, 2003, this expense is removed from the pro forma statement of operations, as the charge would have been recorded in the previous period.
(h) There is no adjustment to the income tax provision due to the operating loss, and any deferred tax asset recorded would have a full valuation allowance. Because we have experienced a three-year history of net operating losses, on a pro-forma basis, it is not believed to be more likely than not that we will be able to utilize deferred tax assets.
35
The unaudited pro forma condensed consolidated financial statements give effect to the following adjustments related to this offering for the year ended December 31, 2003 and the three months ended March 31, 2004:
(i) The adjustments reflect the offering financing as follows (dollars in thousands):
| Funds used for the Transaction: | ||||
| Repay current portion of senior credit facility | $ | 12,250 | ||
| Repay long term portion of senior credit facility | 73,750 | |||
| Repurchase portion of the senior notes | 98,000 | |||
| Premium on prepayment of the senior notes | 9,400 | |||
| Prepay seller notes | 86,490 | |||
| Prepay PIK interest on seller notes (included in other long-term liabilities) | 1,283 | |||
| Redeem Series A Preferred Stock | 344,734 | |||
| Pay transaction fees associated with this offering | 42,500 | |||
| Pay debt issuance costs | 3,000 | |||
| Prepay Delta FASA | 77,136 | |||
| Prepay Northwest FASA | 79,513 | |||
| Payment upon termination of advisory agreement | 5,300 | |||
| Prepay the Class B Convertible Common Stock special dividend | 3,500 | |||
| Total funds used for the Transaction | $ | 836,856 | ||
| Sources of funds used for the Transaction: | ||||
| Proceeds from our new senior credit facility—long term portion | $ | 125,000 | ||
| Proceeds from our new senior credit facility—current portion | 60,000 | |||
| Proceeds from this offering | 645,000 | |||
| Available cash(2) | 6,856 | |||
| Total sources of funds used for the Transaction | $ | 836,856 | ||
- (2)
- The reduction of available cash is a result of assuming that the Transactions occurred on March 31, 2004. This result differs from that illustrated in the use of proceeds, as the use of proceeds assumes certain FASA payments, required and discretionary senior credit facility payments and seller note accruals will occur during the second quarter of 2004.
(j) Concurrently with the consummation of this offering, we will prepay credits to be provided under the FASAs. To reflect the pro forma effect of this prepayment, prepaid assets of $77,136 and $79,513 has been recorded on the pro forma balance sheet for the Delta FASA and Northwest FASA, respectively, which represents the present value of the future credits at March 31, 2004. Amortization of this prepaid will be recognized as contra-information technology services revenue over nine years, which is the remaining original period that we were scheduled to provide the FASA credits. As a result of the prepayment to Delta, we have eliminated the contra-revenue that was recorded related to the Delta FASA and have recorded contra-revenue attributable to the amortization of the prepayment of credits to be provided under the Delta FASA. As a result of the prepayment to Northwest, we have eliminated the contra-revenue that
36
was recorded related to the Northwest FASA and have recorded contra-revenue attributable to the amortization of the prepayment of credits to be provided under the Northwest FASA.
| | Year Ended December 31, 2003 | Three Months Ended March 31, 2004 | |||
|---|---|---|---|---|---|
| Reduction in FASA credit due to prepayment of Delta FASA | 16,667 | 4,167 | |||
| Reduction in FASA credit due to prepayment of Northwest FASA | 16,667 | 4,167 | |||
| Amortization of prepayment of Delta FASA | (11,029 | ) | (2,757 | ) | |
| Amortization of prepayment of Northwest FASA | (11,398 | ) | (2,850 | ) |
(k) To reflect the elimination of the selling, general and administrative expenses relating to the advisory fees to be paid to CVC Management LLC under its advisory agreement with us. See "Certain Relationships and Related Transactions—Advisory Agreements."
| | Year Ended December 31, 2003 | Three Months Ended March 31, 2004 | |||||
|---|---|---|---|---|---|---|---|
| Advisory fees, historical | $ | 900 | $ | 225 | |||
| Advisory fees, after adjustments | 0 | 0 | |||||
| Elimination of expense | (900 | ) | (225 | ) | |||
(l) As discussed in note (i), certain proceeds of this offering and our new senior credit facility are to be used to reduce certain of our obligations. We have recorded adjustments to reflect the decrease in interest expense as a result of (i) the removal of the interest expense associated with the $125,000 of variable rate debt under the term loan facility portion of our senior credit facility repaid with the proceeds of the offering, (ii) the removal of the interest expense associated with the $280,000 of senior notes, (iii) the removal of the interest expense associated with the $84,000 seller notes repaid with the proceeds of the offering, and (iv) the removal of the amortization of the original debt issuance costs; and the increase in interest expense as a result of (i) the interest expense associated with $185,000 of variable rate (3.5% at assumed Transaction date) debt under the term loan facility portion of our new senior credit facility payable in quarterly installments over an estimated 72 month period of six years, (ii) the interest expense associated with the remaining $182,000 of senior notes and (iii) the annual amortization of debt issuance costs on our new senior credit facility.
| | Year Ended December 31, 2003 | Three Months Ended March 31, 2004 | |||||
|---|---|---|---|---|---|---|---|
| Removal of interest on the $125.0 million old term loan | $ | 6,003 | $ | 1,458 | |||
| Removal of interest on the senior notes | 26,950 | 6,738 | |||||
| Removal of interest on the seller notes | 9,318 | 2,364 | |||||
| Removal of original debt issuance cost amortization | 2,622 | 1,207 | |||||
| Additional interest on the $185.0 million new term loan | (6,330 | ) | (1,197 | ) | |||
| Additional interest on the $182.0 million remaining senior notes | (17,518 | ) | (4,379 | ) | |||
| Additional debt issuance cost amortization associated with the new term loan and the remaining senior notes | (1,223 | ) | (306 | ) | |||
37
The actual interest rate on the variable rate indebtedness incurred to consummate the Transactions could vary from those used to compute the above adjustment of interest expense. A one-eighth percent increase in these rates would increase interest expense for the year ended December 31, 2003 and the three months ended March 31, 2004 by approximately $210 and $39, respectively.
(m) When the old term loan and $98,000 of the senior notes are repaid, $7,179 of debt issuance costs will be written off. This reduction, which represents the remaining balance of the debt issuance costs on the old term loan and 35% of the remaining balance of the debt issuance costs on the senior notes at March 31, 2004, is shown as an increase to retained deficit on the pro forma balance sheet. This decrease is partially offset by the new debt issuance costs of $3,000 in order to arrive at the reduction of $4,179 to debt issuance costs on the pro forma balance sheet.
(n) There is no adjustment to the income tax provision due to the operating loss, and any deferred tax asset recorded would have a full valuation allowance. Because we have experienced a three-year history of net operating losses, on a pro-forma basis, it is not believed to be more likely than not that we will be able to utilize deferred tax assets.
38
SELECTED HISTORICAL FINANCIAL DATA
The following table sets forth certain of our historical financial data. We have derived the selected historical consolidated financial data as of December 31, 2002 and 2003 and for the fiscal years ended December 31, 2001 and 2002 and for the six months ended June 30, 2003 and December 31, 2003 from our audited financial statements and related notes included elsewhere in this prospectus. We have derived the selected historical consolidated financial data as of December 31, 1999, 2000 and 2001 and for the fiscal years ended December 31, 1999 and 2000 from our audited financial statements and related notes, which are not included in this prospectus. We have derived the selected historical consolidated financial data as of June 30, 2003 from our unaudited financial statements and related notes, which are not included in this prospectus. We have derived the selected historial consolidated financial data as of March 31, 2004 and for the three months ended March 31, 2003 and 2004 from our unaudited financial statements and related notes included elsewhere in this prospectus. The selected historical consolidated financial data set forth below are not necessarily indicative of the results of future operations and should be read in conjunction with the discussion under the heading "Management's Discussion and Analysis of Financial Condition and Results of Operations," and the historical consolidated financial statements and accompanying notes included elsewhere in this prospectus.
Worldspan was acquired on June 30, 2003 in a business combination accounted for under the purchase method of accounting. Accordingly, the financial data set forth below includes a predecessor basis and a successor basis. As a result of the Acquisition, Worldspan's assets and liabilities were adjusted to their estimated fair values. In addition, our statements of operations for the successor basis include interest expense resulting from indebtedness incurred to finance the Acquisition and amortization of intangible assets related to the Acquisition. Therefore, our successor basis financial data generally is not comparable to our predecessor basis financial data.
| | Predecessor Basis | Successor Basis | |||||||||||||||||||||||||
|---|---|---|---|---|---|---|---|---|---|---|---|---|---|---|---|---|---|---|---|---|---|---|---|---|---|---|---|
| | Year Ended December 31, | Three Months Ended March 31, | Six Months Ended June 30, | Six Months Ended December 31, | Three Months Ended March 31, | ||||||||||||||||||||||
| | 1999 | 2000 | 2001 | 2002 | 2003 | 2003 | 2003 | 2004 | |||||||||||||||||||
| | (dollars in thousands) | (unaudited) | | | (unaudited) | ||||||||||||||||||||||
| Statement of Income Data: | |||||||||||||||||||||||||||
| Revenues: | |||||||||||||||||||||||||||
| Electronic travel distribution | $ | 581,768 | $ | 665,176 | $ | 762,304 | $ | 807,095 | $ | 206,944 | $ | 414,933 | $ | 396,488 | $ | 232,539 | |||||||||||
| Information technology services | 120,336 | 122,345 | 126,049 | 107,774 | 27,401 | 52,539 | 32,974 | 15,992 | |||||||||||||||||||
Total revenues | 702,104 | 787,521 | 888,353 | 914,869 | 234,345 | 467,472 | 429,462 | 248,531 | |||||||||||||||||||
| Operating expenses: | |||||||||||||||||||||||||||
| Cost of revenues excluding developed technology amortization | 402,463 | 506,023 | 588,633 | 605,845 | 162,852 | 334,469 | 319,603 | 170,337 | |||||||||||||||||||
| Developed technology amortization | 28,646 | 10,587 | 12,827 | 15,244 | 3,961 | 7,359 | 11,015 | 5,508 | |||||||||||||||||||
| Total cost of revenues | 431,109 | 516,610 | 601,460 | 621,089 | 166,813 | 341,828 | 330,618 | 175,845 | |||||||||||||||||||
| Selling, general and administrative expenses | 197,233 | 187,736 | 206,315 | 181,813 | 40,278 | 76,141 | 72,424 | 36,255 | |||||||||||||||||||
| Amortization of intangible assets | — | — | — | — | — | — | 18,270 | 9,135 | |||||||||||||||||||
Total operating expenses | 628,342 | 704,346 | 807,775 | 802,902 | 207,091 | 417,969 | 421,312 | 221,235 | |||||||||||||||||||
| Operating income | 73,762 | 83,175 | 80,578 | 111,967 | 27,254 | 49,503 | 8,150 | 27,296 | |||||||||||||||||||
| Other income (expense): | |||||||||||||||||||||||||||
| Interest income | 13,238 | 8,583 | 5,812 | 2,085 | 251 | 401 | 295 | 99 | |||||||||||||||||||
| Interest expense | (5,377 | ) | (4,424 | ) | (6,515 | ) | (5,481 | ) | (1,368 | ) | (2,756 | ) | (25,481 | ) | (13,160 | ) | |||||||||||
| Gain on sale of marketable securities | 30,256 | — | 9,148 | — | — | — | — | — | |||||||||||||||||||
| Equity in (loss) gain of investees, net | — | (3,487 | ) | (2,141 | ) | 68 | 3 | 130 | 278 | (50 | ) | ||||||||||||||||
| Write-down of impaired investments | — | (16,627 | ) | (19,784 | ) | (10,330 | ) | — | — | (1,232 | ) | — | |||||||||||||||
| Change-in-control expense | — | — | — | — | — | (17,259 | ) | — | — | ||||||||||||||||||
| Other, net | (5,423 | ) | 38,152 | (4,819 | ) | 7,768 | (781 | ) | (1,461 | ) | (11 | ) | (265 | ) | |||||||||||||
39
| | Predecessor Basis | Successor Basis | ||||||||||||||||||||||||
|---|---|---|---|---|---|---|---|---|---|---|---|---|---|---|---|---|---|---|---|---|---|---|---|---|---|---|
| | Year Ended December 31, | Three Months Ended March 31, | Six Months Ended June 30, | Six Months Ended December 31, | Three Months Ended March 31, | |||||||||||||||||||||
| | 1999 | 2000 | 2001 | 2002 | 2003 | 2003 | 2003 | 2004 | ||||||||||||||||||
| | (dollars in thousands, except per share data) | (unaudited) | | | (unaudited) | |||||||||||||||||||||
Total other income (expense), net | 32,694 | 22,197 | (18,299 | ) | (5,890 | ) | (1,895 | ) | (20,945 | ) | (26,151 | ) | (13,376 | ) | ||||||||||||
| Income before provision for income taxes | 106,456 | 105,372 | 62,279 | 106,077 | 25,359 | 28,558 | (18,001 | ) | 13,920 | |||||||||||||||||
| Income tax expense (benefit) | 5,859 | 1,129 | (890 | ) | 1,258 | 57 | 144 | 989 | 229 | |||||||||||||||||
Net income (loss) | $ | 100,597 | $ | 104,243 | $ | 63,169 | $ | 104,819 | $ | 25,302 | $ | 28,414 | $ | (18,990 | ) | $ | 13,691 | |||||||||
| Net (loss) income available to common stockholders | — | — | — | — | — | — | (34,990 | ) | 5,291 | |||||||||||||||||
| Net (loss) income available to Class B Convertible Common Stock and Common Stock stockholders | — | — | — | — | — | — | (35,440 | ) | 5,291 | |||||||||||||||||
| Basic net (loss) income per Class B Convertible Common Stock | — | — | — | — | — | — | $ | (0.34 | ) | $ | 0.06 | |||||||||||||||
| Basic net (loss) income per Common Stock | — | — | — | — | — | — | $ | (0.39 | ) | $ | 0.06 | |||||||||||||||
| Diluted net (loss) income per Class B Convertible Common Stock | — | — | — | — | — | — | $ | (0.34 | ) | $ | 0.06 | |||||||||||||||
| Diluted net (loss) income per Common Stock | — | — | — | — | — | — | $ | (0.39 | ) | $ | 0.06 | |||||||||||||||
Balance Sheet Data (at end of period): | ||||||||||||||||||||||||||
| Cash and cash equivalents | $ | 140,417 | $ | 141,175 | $ | 85,941 | $ | 132,101 | $ | 61,043 | $ | 43,931 | $ | 43,846 | $ | 33,087 | ||||||||||
| Working capital (deficit)(1) | 68,378 | 86,236 | 22,687 | 62,831 | 24,961 | (20,542 | ) | (17,954 | ) | (22,459 | ) | |||||||||||||||
| Property and equipment | 159,880 | 148,483 | 127,538 | 115,610 | 120,404 | 110,711 | 120,510 | 137,406 | ||||||||||||||||||
| Total assets | 481,096 | 509,543 | 427,894 | 454,866 | 403,730 | 385,801 | 1,119,445 | 1,138,907 | ||||||||||||||||||
| Total debt(2) | 48,969 | 63,162 | 77,818 | 93,556 | 97,265 | 96,807 | 550,628 | 539,642 | ||||||||||||||||||
| Series A Preferred Stock subject to mandatory redemption | — | — | — | — | — | — | 336,000 | 344,734 | ||||||||||||||||||
| Partners' capital | 224,809 | 246,547 | 137,356 | 135,602 | 100,842 | 54,226 | — | — | ||||||||||||||||||
| Stockholders' deficit | — | — | — | — | — | — | (6,163 | ) | (25 | ) | ||||||||||||||||
| Other Data: | ||||||||||||||||||||||||||
| Total transactions using the Worldspan system:(3) | ||||||||||||||||||||||||||
| Online (in thousands) | 14,608 | 33,283 | 54,790 | 75,896 | 21,773 | 45,058 | 45,201 | 26,189 | ||||||||||||||||||
| Traditional (in thousands) | 139,622 | 139,353 | 140,774 | 116,279 | 27,246 | 54,063 | 48,556 | 29,222 | ||||||||||||||||||
| Total transactions (in thousands) | 154,230 | 172,636 | 195,564 | 192,175 | 49,019 | 99,121 | 93,757 | 55,411 | ||||||||||||||||||
| Depreciation and amortization | $ | 98,453 | $ | 82,153 | $ | 83,425 | $ | 79,215 | $ | 17,146 | $ | 32,322 | $ | 52,955 | $ | 25,063 | ||||||||||
| Distributions | 250,000 | 80,000 | 175,000 | 100,000 | 60,000 | 110,000 | — | — | ||||||||||||||||||
Purchase of property and equipment | 52,284 | 34,656 | 22,337 | 12,375 | 7,574 | 4,236 | 15,961 | 2,862 | ||||||||||||||||||
| Assets acquired under capital leases | 13,695 | 26,877 | 30,703 | 41,053 | 10,707 | 17,237 | 12,134 | 20,919 | ||||||||||||||||||
| Capitalized software for internal use | 1,141 | 5,693 | 3,613 | 3,056 | 1,036 | 1,367 | 1,395 | — | ||||||||||||||||||
| Total capital expenditures | 67,120 | 67,226 | 56,653 | 56,484 | 19,317 | 22,840 | 29,490 | 23,781 | ||||||||||||||||||
- (1)
- Working capital is calculated as current assets (including cash and cash equivalents) minus current liabilities.
- (2)
- Includes senior notes, term loan, seller notes and assets acquired under capital leases.
- (3)
- We designate each travel agency for which we process transactions as traditional or online based on management's belief as to whether a travel agency is traditional or online. The historical transaction data set forth above reflects the designations which were in effect for each period presented. We evaluate the classification of our travel agencies on a monthly basis and reclassify them as appropriate. Upon a reclassification of a travel agency, all transactions for such travel agency are correspondingly reclassified for all historical and subsequent periods. Accordingly, to the extent we change a designation for a travel agency, the transactions for such travel agency may be reflected in different categories at different times. Based on a recent evaluation of the classifications, we generated total online transactions of 55,753 and 77,021 for the years ended December 31, 2001 and 2002, 20,370 for the three months ended March 31, 2003, 45,432 for the six months ended June 30, 2003 and 45,201 for the six months ended December 31, 2003.
40
MANAGEMENT'S DISCUSSION AND ANALYSIS OF
FINANCIAL CONDITION AND RESULTS OF OPERATIONS
Management's discussion and analysis of our results of operations includes periods prior to the consummation of the Acquisition. Accordingly, the discussion and analysis of historical periods prior to July 1, 2003 does not reflect the significant impact that the Acquisition has had and will have on us, including increased leverage and increased liquidity requirements. References to "WTI" refer to Worldspan Technologies Inc. The terms "we", "us", "our" and other similar terms refer to the consolidated businesses of WTI and all of its subsidiaries. References to the "Acquisition" refer to our acquisition, through our wholly-owned subsidiaries, of the general partnership interests and limited partnership interest of Worldspan, L.P. References to "Worldspan" refer to Worldspan, L.P.
In accordance with the requirements of purchase accounting, the assets and liabilities of Worldspan were adjusted to their estimated fair values and the resulting goodwill computed for the Acquisition. The application of purchase accounting generally results in higher depreciation and amortization expense in future periods. Accordingly, and because of other effects of purchase accounting, the results discussed for the three months ended March 31, 2004 are not comparable with the three months ended March 31, 2003.
Overview
We are a leading provider of mission-critical transaction processing and information technology services to the global travel industry. We are the second largest transaction processor for travel agencies in the United States (the world's largest travel market) and the largest processor globally for online travel agencies as measured by transactions. In 2003, we processed over 65% of online airline transactions made in the United States and processed by a global distribution system, or GDS. This trend has continued during the three months ended March 31, 2004. We provide subscribers (including traditional travel agencies, online travel agencies and corporate travel departments) with real-time access to schedule, price, availability and other travel information and the ability to process reservations and issue tickets for the products and services of approximately 800 travel suppliers (such as airlines, hotels, car rental companies, tour companies and cruise lines) throughout the world. During the year ended December 31, 2003 and the three months ended March 31, 2004, we processed approximately 193 million and 55 million transactions, respectively. We also provide information technology services to the travel industry, primarily airline internal reservation systems, flight operations technology and software development.
Our business is highly dependent upon the air travel industry. During the first half of 2003, travel booking volumes were significantly depressed industry wide, affected primarily by the war and on-going conflict in Iraq and concerns over severe acute respiratory syndrome, or SARS. Our leading position in processing online travel transactions provided for growth in our business during the second half of 2003. The recovery that we saw in travel transactions beginning late in the second quarter of 2003 continued during the later part of the year, particularly for our online business. Our relationships with four of the largest online travel agencies in the world have positioned us well to take advantage of the continuing shift to the online travel agency channel, where we have a higher market share. In addition, airlines have responded to the difficult operating conditions by offering lower prices on tickets distributed through direct and online channels, resulting in an increase in airline travel transactions generated through online travel agencies relative to traditional travel agencies. We believe our strong position in the online travel agency channel has allowed us to increase our airline transactions market share, despite the decrease in the number of total transactions since the beginning of 2001. Total transactions for the first quarter of 2004, including airline and hospitality and destination services, were up 13.0% compared to the same period in 2003.
We depend upon a relatively small number of airlines and online travel agencies for a significant portion of our revenues. Our five largest airline relationships represented an aggregate of approximately 54% of our total 2003 revenues, while our top ten largest airline relationships
41
represented an aggregate of approximately 66% of our total 2003 revenues. Our relationships with four online travel agencies, Expedia, Hotwire, Orbitz and Priceline, represented 43% of our total transactions. We expect to continue to depend upon a relatively small number of airlines and online travel agencies for a significant portion of our revenues.
Supplier Content and Transaction Fees
During the five-year period ending December 31, 2003, we increased the transaction fees we collect from our airline suppliers, which pay a substantial portion of our transaction fees. The average fee per airline transaction increased at a compound annual growth rate of 2.6% from $3.72 per transaction in 1999 to $4.12 per transaction in 2003. We anticipate that this historic trend of annual transaction fee increases could be reduced in the future due to our plan to enter into fare content agreements with major airlines. For instance, we have recently entered into fare content agreements with Continental Airlines, Delta, Northwest and United Air Lines. Generally, in these agreements, the airlines commit (subject to the exceptions contained in the agreements) to provide the travel agencies covered by the agreements in the territories covered by the agreements with substantially the same fare content it provides to the travel agency subscribers of other GDSs (including web fares) in exchange for payments from us to each airline and subject to us keeping steady the average transaction fees paid by each airline for travel agency transactions in the territories covered by the agreements. In addition, pursuant to this agreement, each airline has agreed, among other things, to commit to the highest level of participation in our GDS. Subject to termination rights, these obligations continue until 2006. Further, in February 2004, we executed a three-year fare content agreement with British Airways to provide access to virtually all of their published fares (including web fares) to some of our U.K. travel agencies. We expect that these fare content agreements will provide our travel agencies in the territories covered by the agreements with access to improved content concerning the flights and fares of the participating airlines and other forms of non-discriminatory treatment. We believe that obtaining similar fare content from our other major airline travel suppliers is important to our ability to compete, since other GDSs have also entered into fare content agreements with various airlines. Consequently, we plan to pursue agreements similar to these fare content agreements with other major airlines in order to obtain access to such content. We expect that the fare content agreements will require us to make, in the aggregate, significant payments or other concessions to the participating airlines which we expect will reduce our revenues.
Channel Shift
An increasing number of travel transactions are being made online. In 2003, airline transactions generated through online travel agencies accounted for approximately 28% of all airline transactions in the United States processed by a GDS, up from approximately 23% in 2002 and approximately 17% in 2001. Between 2001 and 2003, the number of airline transactions in the United States generated through online travel agencies and processed by us increased at a compound annual growth rate of 23.5%. We believe that this shift to online travel agency bookings will continue, but the extent and pace of the shift is difficult to anticipate. Other industry developments, such as Expedia's announcement that it intends to move a portion of its transactions to another GDS provider, compound our difficulty in forecasting the growth of our transactions from online travel agencies. We typically pay a higher inducement per transaction to our large online travel agency customers than our traditional agencies. Accordingly, as we continue to experience significant channel shift, we expect our inducements cost to continue to grow and direct costs related to supporting traditional travel agencies to continue to decline.
Since 2001, the combination of channel shift, declines in the global economy, terrorist actions and threats, wars in Afghanistan and Iraq, and health concerns over SARS has resulted in annual declines in transactions generated by traditional travel agencies. As a result of these declines, we have completed restructuring activities in 2001, 2002, and 2003, which have largely been focused on reducing
42
the operating costs associated with servicing traditional travel agencies in areas such as labor, network, agency hardware, and advertising.
Uncertainty in Transaction Volumes from Online Travel Agencies
Although we have historically processed most of the airline transactions for our online travel agencies, these agencies may move a portion of their business to other technologies and technology providers, subject to some contractual limitations. See "Risk Factors—Dependence on Small Number of Online Travel Agencies." For example, Expedia has announced that it intends to move a portion of its transactions to another GDS provider. In addition, Orbitz has developed direct connections with travel suppliers which bypass our GDS. Although we currently continue to operate under these agreements, we cannot assure you that these and our other major online travel agencies will not attempt to terminate their respective agreements with us or otherwise move business to another GDS in the future. With this uncertainty, we cannot reliably forecast the volume of such transactions and may experience transaction volume decreases that result in a material adverse effect on our financial condition and operating results.
Neutrality
We do not own an online travel agency. Unlike our competitors, we have intentionally not pursued a strategy of vertical integration and instead have forged strategic partnerships with leading online travel agencies. Given the highly competitive nature of the travel agency business, we believe our customers value our neutrality. As the shift towards the online travel agency channel continues, we believe the traditional travel agencies will increasingly view the GDS-owned online travel agencies as competitive to their core business. As a result, our neutrality gives us an opportunity to capture additional business from both online and traditional travel agencies.
FASA Credits
Pursuant to the terms of the FASAs, we provide FASA credits to Delta and Northwest to be applied against FASA service fee payments due from these airlines to us. The FASA credits are structured and will be applied through June 2012 in scheduled monthly installments up to an aggregate total of approximately $112.5 million to each of Delta and Northwest as of March 31, 2004, and are reflected as reductions of FASA revenue in the corresponding periods. In the event that the monthly FASA credits deliverable by us to Delta or Northwest are more than the FASA service fee payments due from the applicable airline, then we will be obligated to pay such excess to such airline in cash. Pursuant to a recent amendment of our FASA with Delta, the FASA credits to Delta will terminate upon the closing of this offering in exchange for a one-time payment from us to Delta of approximately $75 million. Pursuant to a recent amendment of our FASA with Northwest, the FASA credits to Northwest will terminate upon the closing of this offering in exchange for a one-time payment from us to Northwest of approximately $77 million. Pursuant to the terms of our FASA with Delta, we are obligated to offer Delta the higher one-time payment of $77 million and the other terms that we have agreed upon with Northwest in lieu of the $75 million transaction we have agreed upon previously with Delta. Following the consummation of this offering, these one-time payments will be capitalized and amortized as a reduction of FASA revenue in the corresponding periods.
Debt Reduction
We have historically generated significant cash flow from operations. During the fourth quarter of 2003 and the first quarter of 2004, we used this cash flow to reduce in the aggregate $35.0 million of our term loan in addition to the mandatory repayment schedule. Where possible and prudent, we expect to continue to use our cash flow from operations to repay indebtedness prior to maturity.
43
Impacts of the Acquisition
We were initially founded by Delta, Northwest and TWA. Although we were owned by Delta, Northwest and American (as successor of TWA) since our inception until the Acquisition, we operated as an autonomous entity during that time. The expenses reflected in our historical financial statements do not reflect any allocation of overhead costs incurred by our founding airlines. For the periods following the Acquisition, our expenses changed as a result of the purchase accounting treatment of the Acquisition and the costs associated with financing the Acquisition. Under the rules of purchase accounting, we adjusted the value of our assets and liabilities to their respective estimated fair values, and any excess of the purchase price over the fair market value of the net assets acquired was allocated to goodwill. As a result of these adjustments to our asset basis, our depreciation and amortization expenses increased. In addition, for the periods following the Acquisition, our revenues have been affected by the accounting treatment of our obligation to provide FASA credits and make FASA credit payments under the founder airlines services agreements, or FASAs, with Delta and Northwest. These payments are accounted for as a reduction to our gross information technology services revenues.
Business Segment Summary
Our revenues are primarily derived from transaction fees paid by our travel suppliers for electronic travel distribution services, and to a lesser extent, other transaction and subscription fees from our information technology services operations:
- •
- Electronic travel distribution revenues are generated by charging a fee per transaction, which is generally paid by the travel supplier, based upon the number of transactions involved in the booking. We record and charge one transaction for each segment of an air travel itinerary (e.g., four transactions for a round-trip airline ticket with one connection each way). We record and charge one transaction for each car rental, hotel, cruise or tour company booking, regardless of the length of time associated with the booking. Fees paid by travel suppliers vary according to the levels of functionality at which they can participate in our GDS. These levels of functionality generally depend upon the type of communications and real-time access allowed with respect to the particular travel supplier's internal systems. Revenues are based on the volume of transactions and are not dependent on the revenue earned by the supplier for that booking. We recognize revenue for airline travel transactions in the month the transactions are processed, net of cancellations processed in that month. Revenues for other types of travel transactions are recognized at the time the booking is used by the traveler. Although the substantial majority of our electronic travel distribution revenues are derived from transaction fees paid by travel suppliers, we have an agreement with Hotwire which does not follow this traditional business model. Under our agreement with Hotwire, we generally derive revenues from a service fee payable by Hotwire (rather than the travel supplier) based upon the number of travel transactions booked.
44
Set forth below is a chart illustrating the flow of payments in a typical consumer travel booking processed by us.
| 1 Roundtrip Airline Ticket (one connection each way) | 4 transactions | |
| 1 Car Rental (3 days) | 1 transaction | |
| 1 Hotel Reservation (3 days) | 1 transaction | |
| 6 transactions |
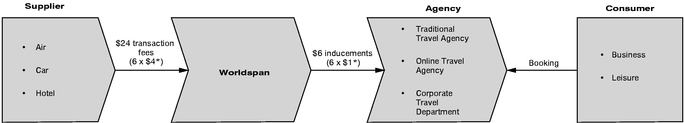
- *
- Transaction and inducement fees are for illustrative purposes only.
- •
- Information technology services revenues are generated by charging a fee for hosting travel supplier inventory, reservations, flight operations and other computer applications within our data center and by providing software development and maintenance services on those applications. Fees paid by travel suppliers are generally based upon the volume of messages processed on behalf of the travel supplier or software development hours performed on the travel supplier's applications. In some cases, we charge fees for access to and usage of certain of our proprietary applications on a per transaction basis. Revenues for information technology services are recognized in the month that the services are provided and are recorded net of the value of the FASA credits earned by Delta and Northwest in the corresponding month.
Our costs and expenses consist of the cost of electronic travel distribution and information technology services revenues, selling, general and administrative expenses and depreciation and amortization:
- •
- Cost of electronic travel distribution revenues consists primarily of inducements paid to travel agencies, technology development and operations personnel, software costs, network costs, hardware leases, maintenance of computer and network hardware, the data center building, help desk and other travel agency support headcount. As our transactions from online travel agencies increase as a percent of our total transactions, we incur additional inducement and technology costs due to the average inducement paid to our large on-line customers typically exceeding the average inducement that we pay to traditional travel agencies and due to a higher volume of messages processed per transaction in the online channel compared to traditional travel agency transactions. Cost of information technology services revenues consists primarily of technology development and operations personnel, software costs, network costs, hardware leases, depreciation of computer hardware and the data center building, amortization of capitalized software and maintenance of computer and network hardware.
- •
- Selling, general and administrative expenses consist primarily of sales and marketing, labor and associated costs, advertising services, professional fees, a portion of the expenses associated with our facilities, depreciation of computer equipment, furniture and fixtures and leasehold improvements, internal management costs and expenses for finance, legal, human resources and other administrative functions.
45
Critical Accounting Policies
Accounts Receivable
We generate a significant portion of our revenues and corresponding accounts receivable from the travel industry and, in particular, the commercial airline industry. As of March 31, 2004, approximately 78.9% of our accounts receivable were attributed to commercial airlines. Our other accounts receivable are generally attributable to other travel suppliers or travel agencies. We evaluate the collectibility of our accounts receivable considering a combination of factors. In circumstances where we are aware of a specific customer's inability to meet its financial obligations to us, we record a specific reserve for bad debts against amounts due in order to reduce the net recognized receivable to the amount we reasonably believe will be collected. For all other customers, we recognize reserves for bad debts based on past write-off experience and the length of time the receivables are past due. Our collection risk with respect to our air travel suppliers may be mitigated by our participation in industry clearinghouses, which allow for centralized payment of service providers.
Since 2001, the travel industry has been adversely impacted by a decline in travel. Our customers have been negatively affected by the continuing lower levels of travel activity. Several major airlines are currently experiencing liquidity problems, leading some airlines to seek bankruptcy protection. Other airlines may seek relief through bankruptcy in the future. We believe that we have appropriately considered these and other factors impacting the ability of our travel suppliers and travel agencies to pay amounts owed to us. However, if demand for commercial air travel further softens due to terrorist acts, war, other incidents involving commercial air transport or other factors, the financial condition of our customers may be adversely impacted. If we begin, or estimate that we will begin, to experience higher than currently expected defaults on amounts due us, our estimates of the amounts which we will ultimately collect could be reduced by a material amount. In that event, we would need to increase our reserves for bad debts, which would result in a charge to our earnings.
Booking Cancellation Reserve
We record revenues for airline transactions processed by us in the month the booking is made. However, if the booking is subsequently cancelled, the transaction fee or fees may be credited or refunded to the airline. Therefore, we record revenues net of an estimated amount reserved to account for cancellations which may occur in a future month. This reserve is calculated based on historical cancellation rates. In estimating the amount of future cancellations that will require us to refund a transaction fee, we assume that a significant percentage of cancellations are followed by an immediate re-booking, without a net loss of revenues. This assumption is based on historical rates of cancellations and re-bookings and has a significant impact on the amount reserved. If circumstances change, such as higher than expected cancellation rates or changes in booking behavior, our estimates of future cancellations could be increased by a material amount, and our revenues could be decreased by a corresponding amount. At March 31, 2004 and December 31, 2003, our booking cancellation reserve was $14.6 million and $9.7 million, respectively. The cancellation reserve increased by $4.9 million at March 31, 2004 due to an increase in booking levels. This reserve is sensitive to the number of bookings remaining for future travel periods as of each balance sheet date. For example, if bookings for future travel as of March 31, 2004 had been 10% higher, the reserve balance would have been increased by approximately $1.5 million.
Inducements
We pay inducements to traditional and online travel agencies for their usage of our GDS. These inducements may be paid at the time of signing a long-term agreement, at specified intervals of time, upon reaching specified transaction thresholds or for each transaction processed by us. Inducements that are payable on a per transaction basis are expensed in the month the transactions are generated. Inducements paid at contract signing or payable at specified dates or upon the achievement of specified objectives are capitalized and amortized over the expected life of the travel agency contract.
46
Inducements payable upon the achievement of specified objectives are assessed as to the likelihood and amount of ultimate payment and expensed over the term of the contract. If we change our estimate of the inducements to be paid to travel agencies in future periods, based upon developments in the travel industry or upon the facts and circumstances of a specific travel agency, cost of sales will increase or decrease accordingly. In addition, we estimate the recoverability of capitalized inducements based upon the expected future cash flows from transactions generated by the related travel agencies. If we change our estimates for future recoverability of amounts capitalized, cost of sales will increase as the amounts are written-off.
Lease Classification
We lease our data center facility and a significant portion of our data center equipment. At the inception of each lease agreement, we assess the lease for capitalization based upon the criteria specified in Statement of Financial Accounting Standards ("SFAS") No. 13,Accounting for Leases. As of March 31, 2004, our liabilities included $87.2 million in outstanding capital lease obligations.
During 2002, we entered into a five-year agreement with IBM for hardware, maintenance, software and other services. In December 2003, this agreement was amended to, among other changes, extend the term of the original agreement until June 2008. The minimum payments due under the amended agreement are approximately $287.2 million. The agreement has been accounted for as a multiple-element software arrangement in accordance with SOP 98-1,Accounting for the Costs of Computer Software Developed or Obtained for Internal Use. The total cost of the agreement is allocated to the various products and services obtained based upon their relative fair values at initiation of the arrangement and each element of the arrangement is accounted for separately as either a capital or period cost, depending on its characteristics. The hardware acquired under this agreement is accounted for in accordance with SFAS 13. In addition, SOP 98-1 requires software licensed for internal use to be evaluated in a manner analogous to SFAS 13 for purposes of determining accounting treatment. At March 31, 2004, we had capital lease balances of $34.1 million associated with this agreement. Certain other costs associated with the agreement are treated as operating leases and are expensed based upon utilization throughout the term of the agreement.
Long-Lived Assets
We review all of our long-lived assets for impairment when changes in circumstances indicate that the carrying amount of an asset may not be recoverable. If we determine that such indicators are present, we prepare an undiscounted future net cash flow projection for the asset. In preparing this projection, we make a number of assumptions, which include, without limitation, future transaction volume levels, price levels and rates of increase in operating expenses. If our projection of undiscounted future cash flows is in excess of the carrying value of the recorded asset, no impairment is reported. If the carrying value of the asset exceeds the projected undiscounted net cash flows, an impairment is recorded. The amount of the impairment charge is determined by discounting the projected net cash flows.
Goodwill and Other Intangible Assets
We account for goodwill and other intangible assets in accordance with SFAS No. 142,Goodwill and Other Intangible Assets. SFAS No. 142 requires goodwill and some intangible assets to no longer be amortized. In addition, goodwill is tested for impairment at the reporting unit level and intangible assets deemed to have an indefinite life and other intangibles are tested for impairment at least annually, or more frequently if impairment indicators arise. We test for impairment of goodwill and other intangible assets by preparing an undiscounted future net cash flow analysis. In preparing this projection, we make a number of assumptions, which include, without limitation, future transaction volume levels, price levels and rates of increase in operating expenses. If our projection of undiscounted future cash flows is in excess of the carrying value of the recorded asset, no impairment is
47
reported. If the carrying value of the asset exceeds the projected undiscounted net cash flows, an impairment is recorded. The amount of the impairment charge is determined by discounting the projected net cash flows.
Results of Operations
The following table shows information derived from our consolidated statements of operations expressed as a percentage of revenues for the periods presented.
| | Predecessor Basis | Successor Basis | |||||||||||||
|---|---|---|---|---|---|---|---|---|---|---|---|---|---|---|---|
| | Year ended December 31, | | | | | ||||||||||
| | Three months ended March 31, 2003 | | | Three months ended March 31, 2004 | |||||||||||
| | Six months ended June 30, 2003 | Six months ended December 31, 2003 | |||||||||||||
| | 2001 | 2002 | |||||||||||||
| Revenues: | |||||||||||||||
| Electronic travel distribution | 85.8 | % | 88.2 | % | 88.3 | % | 88.8 | % | 92.3 | % | 93.6 | % | |||
| Information technology services | 14.2 | 11.8 | 11.7 | 11.2 | 7.7 | 6.4 | |||||||||
| Total revenues | 100.0 | 100.0 | 100.0 | 100.0 | 100.0 | 100.0 | |||||||||
| Operating expenses: | |||||||||||||||
| Cost of revenues excluding developed technology amortization | 66.3 | 66.2 | 69.5 | 71.5 | 74.4 | 68.5 | |||||||||
| Developed technology amortization | 1.4 | 1.7 | 1.7 | 1.6 | 2.6 | 2.2 | |||||||||
| Total cost of revenues | 67.7 | 67.9 | 71.2 | 73.1 | 77.0 | 70.7 | |||||||||
| Selling, general and administrative expenses | 23.2 | 19.9 | 17.2 | 16.3 | 16.9 | 14.6 | |||||||||
| Amortization of intangible assets | — | — | — | — | 4.3 | 3.7 | |||||||||
| Total operating expenses | 90.9 | 87.8 | 88.4 | 89.4 | 98.1 | 89.0 | |||||||||
| Operating income | 9.1 | 12.2 | 11.6 | 10.6 | 1.9 | 11.0 | |||||||||
| Total other expense | 2.1 | 0.6 | 0.8 | 4.5 | 6.1 | 5.4 | |||||||||
| Income before provision for income taxes | 7.0 | 11.6 | 10.8 | 6.1 | (4.2 | ) | 5.6 | ||||||||
| Income tax (benefit) expense | (0.1 | ) | 0.1 | — | — | 0.2 | 0.1 | ||||||||
| Net income | 7.1 | % | 11.5 | % | 10.8 | % | 6.1 | % | (4.4 | )% | 5.5 | % | |||
Comparison of Three Months Ended March 31, 2004 and March 31, 2003
Revenues
Total revenues were $248.5 million for the three months ended March 31, 2004, a $14.2 million or 6.1% increase from the three months ended March 31, 2003 revenues of $234.3 million. This increase was primarily attributable to an increase in transactions processed during the first quarter of 2004 when compared to the same period in the prior year.
Electronic travel distribution revenues were $232.5 million for the three months ended March 31, 2004, a $25.6 million or 12.4% increase from the three months ended March 31, 2003 revenues of $206.9 million. The increase in revenues was largely attributable to a $6.1 million or 13.6% increase in transactions generated from air travel suppliers during the period. The increase was also attributable to a $0.4 million or 9.8% increase in the volume of car and hotel transactions processed.
48
Information technology services revenues were $16.0 million for the three months ended March 31, 2004, an $11.4 million or 41.6% decrease from the three months ended March 31, 2003 revenues of $27.4 million. The decrease was primarily driven by $8.3 million of FASA credits, which are provided under the terms of the FASAs, and a reduction in certain operating expenses which are passed through to customers on a cost-plus basis.
Cost of Revenues Excluding Developed Technology Amortization
Cost of revenues excluding developed technology amortization was $170.3 million for the three months ended March 31, 2004, a $7.4 million or 4.5% increase from the three months ended March 31, 2003 cost of revenues of $162.9 million. This increase was primarily driven by higher inducements paid to travel agencies, partially offset by lower employee costs, network costs and depreciation on hardware provided to traditional travel agencies. Cost of revenues excluding developed technology amortization as a percentage of total revenues decreased to 68.5% for the three months ended March 31, 2004 compared to 69.5% for the three months ended March 31, 2003.
Cost of electronic travel distribution revenues excluding developed technology amortization was $148.8 million for the three months ended March 31, 2004, a $9.6 million or 6.9% increase from the three months ended March 31, 2003 cost of electronic travel distribution revenues excluding developed technology amortization of $139.2 million. Cost of electronic travel distribution revenues excluding developed technology amortization as a percentage of total revenues increased to 59.9% for the three months ended March 31, 2004 compared to 59.4% for the three months ended March 31, 2003. This increase was primarily driven by a 29.7% increase in inducements paid to travel agencies, which was partially offset by a 22.2% decline in employee costs, a 19.7% reduction in network charges and an 18.2% reduction in depreciation, principally on hardware provided to traditional travel agencies. Inducements grew due to the growth in transaction volumes and the continuing shift toward online travel agency transactions, which tend to have higher inducement costs than traditional travel agency transactions. Employee costs declined as a result of the April 2003 workforce reductions. In addition, as part of a cost savings initiative, we reduced the salaries of U.S. and Canada employees by 5%, which was effective May 1, 2003. Network costs decreased due to migration of customers to Internet-based products rather than dedicated circuits. Depreciation on hardware provided to traditional travel agencies decreased during the period due to the decrease in capital expenditures for this type of hardware. As traditional travel agencies purchase their own equipment, our need to continue this capital expenditure decreases.
Cost of information technology services revenues excluding developed technology amortization was $21.5 million or 8.7% of total revenues for the three months ended March 31, 2004, a $2.2 million or 9.3% decrease from the three months ended March 31, 2003 cost of information technology revenues excluding developed technology amortization of $23.7 million or 10.1% of total revenues. This decrease was primarily driven by the reduced costs attributable to the hosting operations for Delta and Northwest.
Developed Technology Amortization
Developed technology amortization was $5.5 million or 2.2% of total revenues for the three months ended March 31, 2004, a $1.5 million or 37.5% increase from the three months ended March 31, 2003 developed technology amortization of $4.0 million or 1.7% of total revenues. This increase was a result of the Acquisition. Purchase accounting requires intangible assets to be recorded at their fair value and amortized over their estimated useful lives.
Selling, General and Administrative Expenses
Selling, general and administrative expenses were $36.3 million or 14.6% of total revenues for the three months ended March 31, 2004, a $4.0 million or 9.9% decrease from the three months ended March 31, 2003 selling, general and administrative expenses of $40.3 million or 17.2% of total revenues.
49
The decrease was driven by a 77.1% reduction in advertising and promotional activities and a series of smaller transactions, partially offset by the stock-based compensation expense recorded during the three months ended March 31, 2004.
Amortization of Intangible Assets
Amortization of intangible assets was $9.1 million or 3.7% of total revenues for the three months ended March 31, 2004, a $9.1 million increase from the three months ended March 31, 2003. This increase was a result of the Acquisition. Purchase accounting requires intangible assets to be recorded at their fair value and amortized over their estimated useful lives.
Operating income
Operating income was $27.3 million for the three months ended March 31, 2004, consistent with the three months ended March 31, 2003 operating income of $27.3 million. Operating income as a percentage of total revenues decreased to 11.0% for the three months ended March 31, 2004 compared to 11.6% in the three months ended March 31, 2003. The increase in operating income primarily resulted from a 12.4% increase in electronic travel distribution revenues, a 22.2% decrease in employee costs and a 19.7% decrease in network costs, partially offset by a 29.7% increase in inducements paid to travel agencies and increased amortization of the fair value of amortizing intangible assets.
Net Interest Expense
Net interest expense was $13.1 million for the three months ended March 31, 2004, a $12.0 million increase from the three months ended March 31, 2003 net interest expense of $1.1 million. This increase in net interest expense was primarily due to the interest expense associated with the debt issued in connection with the Acquisition.
Income Tax Expense
Income tax expense attributable to foreign jurisdictions was $0.2 million for the three months ended March 31, 2004, a $0.1 million increase from the three months ended March 31, 2003 income tax expense of $0.1 million.
Net Income
Net income was $13.7 million for the three months ended March 31, 2004, an $11.6 million or 45.8% decline from the three months ended March 31, 2003 net income of $25.3 million. This decrease was primarily as a result of the increase in the amortization of intangible assets and interest expense associated with the debt issued in connection with the Acquisition, partially offset by improved operating performance.
Comparison of the Successor Six Months Ended December 31, 2003 and the Predecessor Six Months Ended June 30, 2003 to the Predecessor Year Ended December 31, 2002
Revenues
Total revenues were $467.5 million for the six months ended June 30, 2003 and $429.5 million for the six months ended December 31, 2003, a $17.9 million or 2.0% decrease from 2002 revenues of $914.9 million. This decrease was primarily attributable to a decline in information technology services revenues as a result of the FASA credits.
Electronic travel distribution revenues were $414.9 million for the six months ended June 30, 2003 and $396.5 million for the six months ended December 31, 2003, a $4.3 million or 0.5% increase from 2002 revenues of $807.1 million. The increase in revenues was largely attributable to a 1.7% increase in the average fee per transaction charged to air travel suppliers for booking activities, which was partially offset by a 0.3% decrease in air booking activities. The increase in electronic travel distribution revenue
50
was also attributable to a 1.4 million or 8.4% increase in the volume of car and hotel transactions processed. The increase in car and hotel transactions was a result of an increase in our online channel. The average fee per transaction charged to car and hotel suppliers increased 2.6% from 2002 to 2003.
Information technology services revenues were $52.5 million for the six months ended June 30, 2003 and $33.0 million for the six months ended December 31, 2003 , a $22.3 million or 20.7% decrease from 2002 revenues of $107.8 million. The decrease was primarily driven by $16.7 million of FASA credits, a 5.8% decrease in software development activities performed for Delta and an 89.8% decline in third-party web site hosting revenue.
Cost of Revenues Excluding Developed Technology Amortization
Cost of revenues excluding developed technology amortization was $334.5 million for the six months ended June 30, 2003 and $319.6 million for the six months ended December 31, 2003, a $48.3 million or 8.0% increase from 2002 cost of revenues of $605.8 million. Cost of revenues excluding developed technology amortization as a percentage of total revenues increased to 71.5% for the six months ended June 30, 2003 and 74.4% for the six months ended December 31, 2003 compared to 66.2% in 2002. This increase was primarily driven by higher software license fees and inducements paid to travel agencies, partially offset by lower network costs, labor costs and depreciation on hardware provided to traditional travel agencies.
Cost of electronic travel distribution revenues excluding developed technology amortization was $288.1 million for the six months ended June 30, 2003 and $275.4 million for the six months ended December 31, 2003, a $54.8 million or 10.8% increase from 2002 cost of electronic travel distribution revenues excluding developed technology amortization of $508.7 million. Cost of electronic travel distribution revenues excluding developed technology amortization as a percentage of total revenues increased to 61.6% for the six months ended June 30, 2003 and 64.1% for the six months ended December 31, 2003, compared to 55.6% in 2002. This increase was primarily driven by a 17.5% increase in inducements paid to travel agencies and a 21.7% increase in our license fees for software. These increases were partially offset by a 16.6% reduction in network charges and a 24.0% reduction in depreciation, principally on hardware provided to traditional travel agencies. Inducements grew due to the continuing shift toward online travel agency transactions, which tend to have higher inducement costs than traditional travel agency transactions. Software costs were higher as a result of additional computing capacity added throughout 2003 to support the continued growth of the online channel. Network costs decreased due to migration of customers to Internet-based products rather than dedicated circuits. Depreciation on hardware provided to traditional travel agencies decreased during the period due to the decrease in capital expenditures for this type of hardware. As traditional travel agencies purchase their own equipment, our need to continue this capital expenditure decreases.
Cost of information technology services revenues excluding developed technology amortization was $46.4 million for the six months ended June 30, 2003 and $44.2 million for the six months ended December 31, 2003 or 9.9% and 10.3% of total revenues for the six months ended June 30, 2003 and December 31, 2003, respectively, a $6.6 million or 6.8% decrease from 2002 cost of information technology revenues excluding developed technology amortization of $97.2 million or 10.6% of total revenues. This decrease was primarily driven by the 5.8% decrease in software development activities for Delta.
Developed Technology Amortization
Developed technology amortization was $7.4 million for the six months ended June 30, 2003 and $11.0 million for the six months ended December 31, 2003 or 1.6% and 2.6% of total revenues for the six months ended June 30, 2003 and December 31, 2003, respectively, a $3.2 million or 21.1% increase from 2002 developed technology amortization of $15.2 million or 1.7% of total revenues. This increase was a result of the Acquisition. Purchase accounting requires intangible assets to be recorded at their fair value and amortized over their estimated useful lives.
51
Selling, General and Administrative Expenses
Selling, general and administrative expenses were $76.1 million for the six months ended June 30, 2003 and $72.4 million for the six months ended December 31, 2003 or 16.3% and 16.9% of total revenues for the six months ended June 30, 2003 and December 31, 2003, respectively, a $33.3 million or 18.3% decrease from 2002 selling, general and administrative expenses of $181.8 million or 19.9% of total revenues. The decrease was primarily driven by lower costs for incentive compensation programs and decreased labor costs as a result of the December 2002 and April 2003 workforce reductions. We recorded restructuring charges of $4.6 million in 2003 and $6.1 million in 2002. The 2003 workforce reduction, which affected approximately 200 employees, was a result of decreased travel, and related booking volumes, caused by several factors including the war in Iraq, concerns over SARS and the weakened economy. The $4.6 million charge included $4.0 million for the electronic travel distribution segment and $0.6 million for the information technology services segment. The annual labor costs represented by the employees terminated in the 2003 workforce reduction is approximately $11.1 million. We expect that the 2003 workforce reduction will decrease our labor costs in the future, although other factors, including any future expansion of our workforce, will also impact our ongoing labor costs. The 2002 workforce reduction, which affected approximately 130 employees, was a voluntary program offered by the Company in an effort of reducing labor costs. The annual labor costs represented by the employees terminated in the 2002 workforce reduction is approximately $9.6 million. We expect that the 2002 workforce reduction will decrease our labor costs in the future, although other factors, including any future expansion of our workforce, will also impact our ongoing labor costs. In addition, as part of a cost savings initiative, we reduced the salaries of U.S. and Canada employees by 5%, which was effective May 1, 2003.
Amortization of Intangible Assets
Amortization of intangible assets was $18.3 million for the six months ended December 31, 2003 or 4.3% of total revenues for the six months ended December 31, 2003, a $18.3 million increase from 2002. This increase was a result of the Acquisition. Purchase accounting requires intangible assets to be recorded at their fair value and amortized over their estimated useful lives.
Operating Income
Operating income was $49.5 million for the six months ended June 30, 2003 and $8.2 million for the six months ended December 31, 2003, a $54.3 million or 48.5% decrease from 2002 operating income of $112.0 million. Operating income as a percentage of total revenues decreased to 10.6% for the six months ended June 30, 2003 and 1.9% for the six months ended December 31, 2003, compared to 12.2% in 2002. This decrease primarily resulted from a 20.7% decrease in technology services revenues as a result of the FASA credits, a 17.5% increase in inducements paid to travel agencies and amortization of the fair value of amortizing intangible assets.
Net Interest Expense
Net interest expense was $2.4 million for the six months ended June 30, 2003 and $25.2 million for the six months ended December 31, 2003, a $24.2 million increase from 2002 net interest expense of $3.4 million. This increase in net interest expense was primarily due to the interest expense associated with the debt issued in connection with the Acquisition.
Other, net
Other expense, net was $1.5 million for the six months ended June 30, 2003 and $0.01 million for the six months ended December 31, 2003, a $9.3 million increase in expense from 2002 other income, net of $7.8 million. The increase was due to our receipt of proceeds from a legal settlement in 2002.
52
Income Tax Expense
Income tax expense attributable to foreign jurisdictions was $0.1 million for the six months ended June 30, 2003 and $1.0 million for the six months ended December 31, 2003, a $0.2 million decrease from 2002 income tax expense of $1.3 million.
Net Income
Net income was $28.4 million for the six months ended June 30, 2003 and net loss was $19.0 million for the six months ended December 31, 2003, a $95.4 million or 91.0% decline from 2002 net income of $104.8 million. This decrease was primarily as a result of a $54.3 million decrease in operating income and the interest expense associated with the debt issued in connection with the Acquisition.
Comparison of Years Ended December 31, 2002 and December 31, 2001
Revenues
Total revenues were $914.9 million in 2002, a $26.5 million or 3.0% increase from 2001 revenues of $888.4 million. This increase in revenues was primarily attributable to an increase in the average transaction fee partially offset by a decrease in transaction volumes and a decrease in information technology services revenues as a result of the acquisition of TWA by American in 2001 and the subsequent migration of TWA's activities to American.
Electronic travel distribution revenues were $807.1 million in 2002, a $44.8 million or 5.9% increase from 2001 revenues of $762.3 million. The increase in revenues was largely attributable to a 7.0% increase in the average transaction fee charged to air travel suppliers for booking activities and a 1.7 million or 11.4% increase in the volume of car and hotel transactions processed. The increase in car and hotel transactions were a result of an increase primarily through our online travel agencies. The increase in revenues was partially offset by a 4.6 million or 2.5% decrease in airline transactions due to reduced demand for air travel following the terrorist attacks in September 2001.
Information technology services revenues were $107.8 million in 2002, an $18.3 million or 14.5% decrease from 2001 revenues of $126.0 million. The decrease in revenues was largely attributable to the purchase of the assets of TWA by American Airlines in 2001 and the resulting migration of services previously performed by us on behalf of TWA into the operations of American Airlines during 2001. Software development activities performed for Northwest Airlines and Delta Air Lines decreased by 21.3% compared to 2001.
Cost of Revenues Excluding Developed Technology Amortization
Cost of revenues excluding developed technology amortization was $605.8 million in 2002, a $17.2 million or 2.9% increase from 2001 cost of revenues excluding developed technology amortization of $588.6 million. Cost of total revenues excluding developed technology amortization as a percentage of total revenues in 2002 was relatively consistent with 2001. The $17.2 million increase was primarily attributable to higher software license fees and inducements paid to travel agencies, partially offset by lower network costs, decreased utilization of third party professional services, reductions in headquarters space rented and lower advertising promotional activities.
Cost of electronic travel distribution revenues excluding developed technology amortization was $508.7 million in 2002, a $33.3 million or 7.0% increase from 2001 cost of electronic travel distribution revenues excluding developed technology amortization of $475.4 million. Cost of electronic travel distribution revenues excluding developed technology amortization as a percentage of total revenues increased to 55.6% in 2002 compared to 53.5% in 2001. This increase is primarily attributable to a 32.4% increase in inducements paid to travel agencies and a 15.5% increase in our software license fees. Inducements paid to online travel agencies, which tend to be higher than those paid to traditional travel agencies, grew primarily as a result of the continuing shift to the online channel. Licenses for
53
systems software grew largely as a result of increased computing capacity requirements necessitated by the shift to the online channel. The increase in costs was partially offset by a 15.8% decrease in our costs for network services as a result of increased utilization of online travel technologies.
Cost of information technology services revenues excluding developed technology amortization was $97.2 million or 10.6% of total revenues in 2002, a $16.1 million or 14.2% decrease from 2001 cost of information technology services revenues excluding developed technology amortization of $113.3 million or 12.8% of total revenues. The decrease versus 2001 was largely caused by the discontinued hosting of TWA in our data center following TWA's acquisition by American Airlines in 2001 and its elimination as a stand-alone carrier. Additionally, software development costs were lower in 2002 as a result of a 21.3% reduction in the development hours that we provided for our largest hosted airlines. This decrease was part of the overall reductions in discretionary spending by the airline industry following September 2001.
Developed Technology Amortization
Developed technology amortization was $15.2 million or 1.7% of total revenues for 2002, a $2.4 million or 18.8% increase from 2001 developed technology amortization of $12.8 million or 1.4% of total revenues. This increase was a result of additional amortization associated with software development initiatives, primarily related to online booking products.
Selling, General and Administrative Expenses
Selling, general and administrative expenses were $181.8 million or 19.9% of total revenues in 2002, a $24.5 million or 11.9% decrease from selling, general and administrative expenses of $206.3 million or 23.2% of total revenues in 2001. The significant decrease in 2002 was primarily attributable to a $8.5 million decline in charges associated with headcount reductions. In 2002, we incurred charges of $6.1 million related to severance costs associated with a voluntary severance program. Worldspan offered the 2002 workforce reduction, which affected approximately 130 employees, in an effort to reduce labor costs. The annual labor costs represented by the employees terminated in the 2002 workforce reduction is approximately $9.6 million. We expect that the 2002 workforce reduction will decrease our labor costs in the future, although other factors, including any future expansion of our workforce, will also impact our ongoing labor costs. In 2001, we incurred charges of $7.2 million related to a post-9/11 work force reduction and $7.4 million related to a work force reduction associated with the discontinuation of information technology services to TWA due to American's acquisition of TWA's assets and the subsequent transition of its IT services business from us to American's provider. The annual labor costs represented by the employees terminated in the 2001 workforce reduction is approximately $27.6 million. We expect that the 2001 workforce reduction will decrease our labor costs in the future, although other factors, including any future expansion of our workforce, will also impact our ongoing labor costs. We also incurred a one-time charge of $8.2 million in 2001 associated with the restructuring of one of our travel agency inducement programs. In addition, in 2002 selling, general and administrative expenses decreased $6.1 million as a result of a reduction in advertising and marketing activities and other reductions in discretionary spending.
Operating Income
Operating income was $112.0 million in 2002, a $31.4 million or 39.0% increase from 2001 operating income of $80.6 million. Operating income as a percentage of total revenues increased to 12.2% in 2002 from 9.1% in 2001. The comparative increase in operating income for 2002 was principally due to a 7.0% increase in the average air transaction fee, 38.5% growth in online travel distribution, 15.8% decrease in network expenses resulting from greater utilization of online travel technologies, reductions in discretionary spending, a reduction of charges associated with workforce reduction programs ($6.1 million in 2002 compared to $14.5 million in 2001) and the restructuring of one of our travel agency inducement programs which was not repeated in 2002.
54
Net Interest Expense
Net interest expense was $3.4 million in 2002, a $2.7 million increase from 2001 net interest expense of $0.7 million. The increase in net interest expense was primarily due to reduced returns on invested cash and cash equivalents in 2002.
Gain on Sale of Marketable Securities
Gain on sale of marketable securities was $9.1 million in 2001 as a result of Worldspan's sale of its remaining France Telecom (formerly Equant N.V.) shares.
Write-down of impaired investments
Write-down of impaired investments was $10.3 million in 2002, a $9.5 million or 48.0% decrease from 2001 write-down of impaired investments of $19.8 million. In 2002, we discontinued entering into strategic investments with early-stage technology and Internet companies that offer travel related products and services. The original business plans for most of our investees have not come to fruition. There was a significant reduction in the write-down of impaired investments in 2002 since the write-down of impaired investments in 2001 related primarily to investments that we acquired in 2000. We purchased $42.8 million and $9.4 million of investments during the years ended December 31, 2000 and 2001, respectively.
Other, net
Other income, net was $7.8 million in 2002, a $12.6 million increase in income from 2001 other expense, net of $4.8 million. The increase was due to our receipt of proceeds from a legal settlement in 2002.
Income Tax Expense
Income tax expense was $1.3 million in 2002, a $2.2 million increase from 2001 income tax benefit of $0.9 million. The increase was due to the realization of a taxable loss by foreign subsidiaries in 2001.
Net Income
Net income was $104.8 million in 2002, a $41.6 million or 65.8% increase over 2001 net income of $63.2 million. Net income as a percentage of revenues increased to 11.5% in 2002 from 7.1% in 2001. This increase was primarily a result of a $31.4 million improvement in operating income in addition to a reduction of $9.5 million in impairment charges related to minority equity investments in third parties ($10.3 million in 2002 compared to $19.8 million in 2001).
55
Quarterly Results
The following table sets forth our unaudited historical revenues, operating income and net income by quarter during 2002 and 2003 and the first quarter of 2004:
| | | | | | | | Sucessor Basis | ||||||||||||||||||||
|---|---|---|---|---|---|---|---|---|---|---|---|---|---|---|---|---|---|---|---|---|---|---|---|---|---|---|---|
| | Predecessor Basis | ||||||||||||||||||||||||||
| | | | Fiscal Year 2004 | ||||||||||||||||||||||||
| | Fiscal Year 2002 | Fiscal Year 2003 | |||||||||||||||||||||||||
| | Q1 | Q2 | Q3 | Q4 | Q1 | Q2 | Q3 | Q4 | Q1 | ||||||||||||||||||
| | (dollars in thousands) | | |||||||||||||||||||||||||
| Revenues: | |||||||||||||||||||||||||||
| Electronic travel distributions | $ | 211,873 | $ | 209,560 | $ | 207,450 | $ | 178,212 | $ | 206,944 | $ | 207,989 | $ | 212,916 | $ | 183,572 | $ | 232,539 | |||||||||
| Information technology services | 27,586 | 26,564 | 27,600 | 26,024 | 27,401 | 25,138 | 16,598 | 16,376 | 15,992 | ||||||||||||||||||
| Total | $ | 239,459 | $ | 236,124 | $ | 235,050 | $ | 204,236 | $ | 234,345 | $ | 233,127 | $ | 229,514 | $ | 199,948 | $ | 248,531 | |||||||||
| Operating income (loss) | $ | 42,062 | $ | 31,832 | $ | 35,725 | $ | 2,348 | $ | 27,254 | $ | 22,249 | $ | 16,687 | $ | (8,537 | ) | $ | 27,296 | ||||||||
| Net income (loss) | 39,965 | 36,680 | 34,338 | (6,164 | ) | 25,302 | 3,112 | 4,226 | (23,216 | ) | 13,691 | ||||||||||||||||
The travel industry is seasonal in nature. Bookings, and thus transaction fees charged for the use of our GDS, decrease significantly each year in the fourth quarter, primarily in December, due to early bookings by customers for travel during the holiday season and a decline in business travel during the holiday season. All of the 2002 quarters were also negatively impacted by the significant decrease in air travel and booking activity after the September 11, 2001 terrorist attacks and the resulting decline in both the travel industry and the overall economic climate. The first and second quarters of 2003 were negatively impacted by several events, including the war in Iraq and the outbreak of SARS. In addition, net income for the second quarter was negatively impacted by the $17.3 million change-in-control expense. Information technology services revenue decreased in the third and fourth quarters of 2003 primarily as a result of the FASA credits. Net income decreased in the third and fourth quarters of 2003 primarily as a result of increased amortization of intangible assets and interest expense associated with the debt issued in connection with the Acquisition.
Liquidity and Capital Resources
Our principal source of liquidity will be cash flow generated from operations and borrowings under our senior credit facility. Our principal uses of cash will be to meet debt service requirements, finance our capital expenditures, and provide working capital. Based on our current level of operations, we believe that our cash flow from operations, available cash and available borrowings under our senior credit facility will be adequate to meet our future liquidity needs for at least the next 12 months, although no assurance can be given. Our future operating performance and ability to extend or refinance our indebtedness will be dependent on future economic conditions and financial, business and other factors that are beyond our control.
At March 31, 2004, we had cash and cash equivalents of $33.1 million and working capital of $(22.5) million as compared to $61.0 million in cash and cash equivalents and working capital of $25.0 million at March 31, 2003. The $47.5 million decrease in working capital and the $27.9 million decrease in cash were primarily the result of a $27.0 million payment in principal on the senior term loan during the first quarter of 2004 and a $50.0 million distribution to our founding airlines during the second quarter of 2003. The $27.0 million payment in the first quarter of 2004 was comprised of a scheduled payment of $2.0 million and a prepayment of $25.0 million. At December 31, 2003, we had cash and cash equivalents of $43.8 million and working capital of ($18.0) million as compared to
56
$132.1 million in cash and cash equivalents and working capital of $62.8 million at December 31, 2002. The $80.8 million decrease in working capital and the $88.3 million decrease in cash were primarily driven by a decrease in net income. In addition, working capital was negative at December 31, 2003 since we distributed $110.0 million to our founding airlines during the first six months of 2003, causing our cash and cash equivalents balance to decrease significantly.
Historically, we have funded our operations through internally generated cash. We generated cash from operating activities of $23.6 million and $4.4 million for the three months ended March 31, 2004 and 2003, respectively. The $19.2 million increase in cash provided by operating activities during the first three months of 2004 as compared to the first three months of 2003 primarily resulted from a $20.8 million increase for changes in operating assets and liabilities and an increase in non-cash items of $10.0 million, partially offset by an $11.6 million decrease in net income. We generated cash from operating activities of $41.0 million for the six months ended June 30, 2003 and $49.5 million for the six months ended December 31, 2003 compared to $186.7 million for 2002. The $96.2 million decrease in cash provided by operating activities during 2003 as compared to 2002 primarily resulted from a $95.4 million decrease in net income and the decrease in working capital. We generated cash from operating activities of $161.2 million for 2001. The $25.5 million increase in cash provided by operating activities from 2001 to 2002 primarily resulted from a $41.7 million increase in net income, partially offset by a $14.0 million increase in deferred costs associated with a new technology agreement entered into in 2002.
We used cash for investing activities of approximately $2.8 million and $8.5 million in the three months ended March 31, 2004 and 2003, respectively. The decrease in cash used for investing activities during the first three months of 2004 as compared to the first three months of 2003 primarily resulted from decreased purchases of computer hardware. We used cash for investing activities of approximately $5.2 million for the six months ended June 30, 2003 and $17.3 million for the six months ended December 31, 2003 compared to $15.2 million in 2002. The increase in cash used for investing activities during 2003 as compared to 2002 primarily resulted from increased purchases of computer hardware. We used cash for investing activities of approximately $25.4 million in 2001. The decrease in cash used for investing activities during 2002 as compared to 2001 primarily resulted from reduced purchases of computer hardware.
We used cash for financing activities of approximately $31.6 million and $67.0 million in the three months ended March 31, 2004 and 2003, respectively. The decrease in cash used for financing activities during the first three months of 2004 as compared to the first three months of 2003 primarily resulted from a $60.0 million decrease in distributions to our founding airlines, partially offset by $27.0 million of payments associated with the senior credit facility. We used cash for financing activities of approximately $124.0 million for the six months ended June 30, 2003 and $32.3 million for the six months ended December 31, 2003 compared to $125.4 million in 2002. The increase in cash used for financing activities during 2003 as compared to 2002 primarily resulted from a $10.0 million increase in distributions to our founding airlines, $12.0 million of payments associated with the senior credit facility, and transaction costs associated with the Acquisition. We used cash for financing activities of approximately $191.0 million in 2001. The decrease in cash used for financing activities during 2002 as compared to 2001 primarily resulted from a $75.0 million reduction in cash distributions to our partners from $175.0 million during 2001 to $100.0 million during 2002, partially offset by increased principal payments on capital leases.
57
Senior Credit Facility
In June 2003, Worldspan entered into a senior credit facility with a syndicate of financial institutions as lenders. The senior credit facility provides for aggregate borrowings by us of up to $175.0 million, consisting of:
- •
- a four-year revolving credit facility of up to $50.0 million in revolving credit loans and letters of credit which is available until June 30, 2007, and
- •
- a four-year term loan facility of $125.0 million which matures on June 30, 2007.
We borrowed $125.0 million under the term loan facility in connection with the Acquisition. The revolving credit facility is available for working capital and general corporate needs.
Obligations under the senior credit facility and the guarantees are secured by:
- •
- a perfected first priority security interest in all of our tangible and intangible assets and all of the tangible and intangible assets of WTI and each of its direct and indirect domestic subsidiaries and certain foreign subsidiaries, subject to customary exceptions, and
- •
- a pledge of (i) all of the membership interests of WS Holdings LLC owned by WTI, (ii) all of our partnership interests owned by WTI and WS Holdings LLC, (iii) all of the capital stock of our domestic subsidiaries and some of our foreign subsidiaries and (iv) 65% of the capital stock of other of our first-tier foreign subsidiaries.
Borrowings under the senior credit facility bear interest at a rate equal to, at our option:
- •
- a base rate generally defined as the sum of (i) the higher of (x) the prime rate (as quoted on the British Banking Association Telerate Page 5) and (y) the federal funds effective rate, plus one half percent (0.50%) per annum) and (ii) an applicable margin, or
- •
- a LIBOR rate generally defined as the sum of (i) the rate at which euro deposits for one, two, three or six months (as selected by us) are offered in the interbank euro market as set forth on page 3750 of the Dow Jones Telerate Screen and (ii) an applicable margin.
The initial applicable margin for the base rate revolving loans is 2.75% and the applicable margin for the euro revolving loans is 3.75%. The applicable margin for the loans is subject to reduction based upon the ratio of our consolidated total bank debt to consolidated EBITDA. We are also required to pay a commitment fee of 0.50% per annum on the difference between committed amounts and amounts actually utilized under the revolving credit facility. Fees for letters of credit are based on the face amount of each letter of credit outstanding under the senior credit facility multiplied by to the applicable margin for LIBOR borrowings under the revolving credit facility and are payable quarterly in arrears. In addition, we must pay each letter of credit bank a fronting fee to be determined based upon the face amount of all outstanding letters of credit issued by it.
Total cash principal and interest payments related to the $125.0 million borrowed under the term loan facility portion of our senior credit facility were $27.0 million and $2.1 million, respectively, for the three months ended March 31, 2004. The remaining principal payment schedules will require payments over a four-year period for the term loan, totaling to the following principal payments: $6.0 million in 2004, $25.0 million in 2005, $25.0 million in 2006 and $30.0 million in 2007.
The senior credit facility requires us to meet financial tests, including without limitation, a minimum fixed charge coverage ratio, a minimum interest coverage ratio, a maximum senior secured leverage ratio and a maximum total leverage ratio. The minimum fixed charge ratio will be 1.00 to 1.00 until the end of the second quarter of 2005 and will be 1.10 to 1.00 thereafter. The minimum interest coverage ratio will be 2.15 to 1.00 until the end of the second quarter of 2005 and will increase to 3.00 to 1.00 by the end of the term of the senior credit facility. The maximum senior secured leverage ratio
58
will be 1.65 to 1.00 through the second quarter of 2004 and will decrease to 1.00 to 1.00 by the end of the term of the senior credit facility. The maximum total leverage ratio will be 3.85 to 1.00 until the end of the second quarter of 2004 and will decrease to 2.75 to 1.00 by the end of the term of the senior credit facility. In addition, the senior credit facility contains customary covenants which, among other things, limit the incurrence of additional indebtedness, investments, dividends, transactions with affiliates, asset sales, acquisitions, capital expenditures, mergers and consolidations, prepayments of other indebtedness, liens and encumbrances and other matters customarily restricted in a senior credit facility. As of March 31, 2004, we were in compliance with these covenants.
In connection with this offering and the related transactions, we expect to negotiate a new $235.0 million senior credit facility, consisting of a $40.0 million revolving credit facility and a $185.0 million senior term loan, and we will repay our existing senior term loan. We expect that our new senior credit facility will have terms and financial covenants which are improved relative to those in our existing senior credit facility. The interest rates on the new senior credit facility have not been fixed, but we expect the rates to be below those on our existing senior credit facility and we also expect most of the principal amount of the new senior credit facility to be repayable at maturity in June 30, 2010. We cannot assure you that we will be successful in negotiating a new senior credit facility which contains improved interest rates, terms and financial covenants.
95/8% Senior Notes Due 2011
On June 30, 2003, Worldspan and WS Financing Corp. issued $280.0 million aggregate principal amount of 95/8% Senior Notes Due 2011. Interest on the notes accrues at 95/8% per annum.
We cannot redeem the notes before June 15, 2007 except that, until June 15, 2006, we can choose to redeem up to an aggregate of 35% of the original principal amount of the notes, or $98.0 million, at a redemption price of 109.625% of the principal amount of the notes we redeem with funds raised in certain equity offerings. In connection with this offering, we intend to redeem $98.0 million of principal amount of notes, for an aggregate payment of $107.4 million plus accrued interest.
The notes are unsecured senior obligations of Worldspan and WS Financing Corp., are equal in right of payment to all existing and future unsecured senior debt of Worldspan and WS Financing Corp., and are senior in right of payment to all future subordinated debt of Worldspan and WS Financing Corp. The notes are guaranteed by each subsidiary guarantor (as defined in the indenture governing the notes).
If we experience a change of control (as defined in the indenture governing the notes), each holder of notes may require Worldspan to repurchase all or any portion of the holder's notes at a purchase price equal to 101% of the principal amount plus accrued and unpaid interest to the date of purchase.
The indenture governing the notes contains certain covenants that, among other things, limit (i) the incurrence of additional debt by Worldspan and certain of its subsidiaries, (ii) the payment of dividends on capital stock of Worldspan and the purchase, redemption or retirement of capital stock or subordinated indebtedness, (iii) investments, (iv) certain transactions with affiliates, (v) sales of assets, including capital stock of subsidiaries and (vi) certain consolidations, mergers and transfers of assets. As of March 31, 2004, we were in compliance with these covenants. The indenture also prohibits certain restrictions on distributions from certain subsidiaries.
Depending on capital market conditions, we may elect to repurchase the notes in open market purchases or otherwise.
59
Capital Lease Obligations
We lease equipment and software under capital lease obligations. As of December 31, 2003, our obligations under capital leases totaled $71.1 million. The interest rate used in computing the present value of the minimum lease payments ranges from approximately 4.0% to 12.0% depending on the asset being leased.
Future minimum lease payments under non-cancelable capital leases at December 31, 2003 are as follows:
| 2004 | $ | 21,287 | ||
| 2005 | 18,343 | |||
| 2006 | 15,756 | |||
| 2007 | 7,152 | |||
| 2008 | 4,864 | |||
| Thereafter | 45,547 | |||
| Total | 112,949 | |||
| Less amount representing interest | (41,811 | ) | ||
| Present value of net minimum lease payments | 71,138 | |||
| Less current maturities | (16,136 | ) | ||
| Long-term maturities | $ | 55,002 | ||
Subordinated Notes
As part of the Acquisition, we issued to American and Delta subordinated seller notes in the original principal amounts of $39.0 million and $45.0 million, respectively. We expect that these subordinated seller notes will be redeemed by us at the closing of this offering with a portion of the proceeds of this offering.
FASAs
Pursuant to the terms of the FASAs, we provide FASA credits to Delta and Northwest to be applied against FASA service fee payments due from these airlines to us. The FASA credits are structured and applied through June 2012 in an amount up to an aggregate of approximately $112.5 million to each of Delta and Northwest, as of March 31, 2004, and are reflected as reductions to our FASA revenues in the corresponding periods. Pursuant to a recent amendment of our FASA with Delta, the FASA credits to Delta will terminate upon the closing of this offering in exchange for a one-time payment from us to Delta of approximately $75 million. Pursuant to a recent amendment of our FASA with Northwest, the FASA credits to Northwest will terminate upon the closing of this offering in exchange for a one-time payment from us to Northwest of approximately $77 million. Pursuant to the terms of our FASA with Delta, we are obligated to offer Delta the higher one-time payment of $77 million and the other terms that we have agreed upon with Northwest in lieu of the $75 million transaction we have agreed upon previously with Delta.
IBM Agreement
In 2002, we entered into a five year agreement with IBM for hardware currently deployed in our data center, future hardware requirements, TPF license fees and other software products, equipment maintenance and various other services. In December 2003, this agreement was amended to, among other changes, extend the term of the original agreement until June 2008. Prior to entering into this agreement, we routinely acquired many of these products and services from IBM under separate agreements with varying terms and conditions. This agreement bundles these products and services together for one discounted price and, at December 31, 2003, requires future minimum payments
60
aggregating approximately $272.8 million over the remaining term of the agreement, with $68.6 million, $58.3 million, $60.7 million, $59.3 million and $25.9 million payable in 2004, 2005, 2006, 2007 and 2008, respectively.
Capital Expenditures
Capital expenditures for property and equipment, including both purchased assets and assets acquired under capital leases, as well as capitalized software, totaled $23.8 million for the three months ended March 31, 2004, an increase of $4.5 million from capital expenditures of $19.3 million for the three months ended March 31, 2003. We have forecasted approximately $54.5 million for capital expenditures in 2004. Of that amount, approximately $19.5 million relates to a significant upgrade of mainframe computer equipment at our data center. The upgraded equipment is expected to be in use through June 2008. The remaining $35.0 million represents normal growth in capacity requirements as well as routine replacement of older equipment.
Capital expenditures totaled $52.3 million for 2003, a decrease of $4.2 million from capital expenditures of $56.5 million in 2002. Capital expenditures totaled $56.7 million in 2001. The $0.2 decrease in capital expenditures from 2002 to 2001 was principally due to a reduction in purchases of bundled software products, reductions in acquisitions of personal computers for employee use and reduced purchases of hardware to be provided to traditional travel agencies.
Contractual Obligations
The following table summarizes our future minimum non-cancelable contractual obligations (including interest) at December 31, 2003.
| | Payments Due by Period | ||||||||||||||
|---|---|---|---|---|---|---|---|---|---|---|---|---|---|---|---|
| Contractual Obligations | Total | 2004 | 2005 to 2006 | 2007 to 2008 | 2009 and beyond | ||||||||||
| | (dollars in thousands) | ||||||||||||||
| Long-term debt | $ | 791,705 | $ | 44,715 | $ | 121,605 | $ | 120,781 | $ | 504,604 | |||||
| Capital lease obligations | 112,949 | 21,287 | 34,099 | 12,016 | 45,547 | ||||||||||
| Operating leases | 244,266 | 53,464 | 91,651 | 71,046 | 28,105 | ||||||||||
| Other long-term obligation | 47,405 | 8,981 | 21,060 | 17,364 | — | ||||||||||
| Total contractual obligations | $ | 1,196,325 | $ | 128,447 | $ | 268,415 | $ | 221,207 | $ | 578,256 | |||||
In March 2004, we entered into an agreement to purchase data network services for our U.S. and Canadian offices and travel agency customers that expires in 2007. In addition, the agreement includes voice services for our U.S. and Canadian offices. The minimum commitment over the term of the agreement is $30.0 million.
Off-Balance Sheet Arrangements
At March 31, 2004 and December 31, 2003, we did not have any relationships with unconsolidated entities or financial partnerships, such as entities often referred to as structured finance or special purpose entities, which would have been established for the purpose of facilitating off-balance sheet arrangements or other contractually narrow or limited purposes. We are, therefore, not materially exposed to any financing, liquidity, market or credit risk that could arise if we had engaged in such relationships.
Effect of Inflation
Inflation generally affects us by increasing our costs of labor, equipment and new materials. We do not believe that inflation has had any material effect on our results of operations during fiscal years 2003 and 2002 and the three months ended March 31, 2004 and 2003.
61
Recently Issued Accounting Pronouncements
In January 2003, the FASB issued FIN 46,Consolidation of Variable Interest Entities. FIN 46 expands upon existing accounting guidance that addresses when a company should include in its financial statements the assets, liabilities and activities of a variable interest entity. The consolidation requirements of FIN 46 apply immediately to variable interest entities created after January 31, 2003. The consolidation requirements apply to older entities in the first fiscal year or interim period beginning after June 15, 2003. The adoption of FIN 46 did not have a significant effect on our financial position or results of operations.
In May 2003, the FASB issued SFAS No. 150,Accounting for Certain Financial Instruments with Characteristics of Both Liabilities and Equity. The Statement specifies that instruments within its scope embody obligations of the issuer and that, therefore, the issuer must classify them as liabilities. SFAS 150 prohibits entities from restating financial statements for earlier years presented. SFAS 150 became effective for us at the beginning of the third quarter of 2003. We do not currently have financial instruments with the characteristics of liabilities and equity. Accordingly, the implementation of SFAS 150 did not have any impact on the our consolidated financial position or results of operations.
Quantitative and Qualitative Disclosures About Market Risk
Market risk represents the risk of changes in value of a financial instrument, derivative or non-derivative, caused by fluctuations in interest rates, foreign exchange rates and equity prices. Changes in these factors could cause fluctuations in the results of our operations and cash flows. In the ordinary course of business, we are exposed to foreign currency and interest rate risks. These risks primarily relate to the sale of products and services to foreign customers and changes in interest rates on our long-term debt.
Foreign Exchange Rate Market Risk
We consider the U.S. dollar to be the functional currency for all of our entities. Substantially all of our net sales and the majority of our expenses in 2001, 2002 and 2003 were denominated in U.S. dollars. Therefore, foreign currency fluctuations did not materially impact our financial results in those periods. We have foreign currency exposure arising from the translation of our foreign subsidiaries' financial statements into U.S. dollars. The primary currencies to which we are exposed to fluctuations include the euro and the British pound sterling. The fair value of our net foreign investments would not be materially affected by a 10% adverse change in foreign currency exchange rates from December 31, 2001, 2002 or 2003 levels.
Interest Rate Market Risk
Our senior credit facility is variable rate debt. Interest rate changes therefore generally do not affect the market value of such debt but do impact the amount of our interest payments and, therefore, our future earnings and cash flows, assuming other factors are held constant. As of March 31, 2004, we had variable rate debt of approximately $86.0 million. Holding other variables constant, including levels of indebtedness, a one hundred basis point increase in interest rates on our variable debt would have had an estimated impact on pre-tax earnings and cash flows for the next year of approximately $0.9 million. Under the terms of our senior credit facility, we are required to have at least 50% of our total indebtedness subject to either a fixed interest rate or interest rate protection for a period of not less than three years.
62
We are a leading provider of mission-critical transaction processing and information technology services to the global travel industry. We are the second largest transaction processor for travel agencies in the United States (the world's largest travel market) and the largest processor globally for online travel agencies as measured by transactions. In 2003, we processed over 65% of online airline transactions made in the United States processed through a global distribution system, or a GDS. We provide subscribers (including traditional travel agencies, online travel agencies and corporate travel departments) with real-time access to schedule, price, availability and other travel information and the ability to process reservations and issue tickets for the products and services of approximately 800 travel suppliers (such as airlines, hotels, car rental companies, tour companies and cruise lines) throughout the world. During the year ended December 31, 2003, we processed approximately 193 million transactions. We also provide information technology services to the travel industry, primarily airline internal reservation systems, flight operations technology and software development.
We operate in two business segments: electronic travel distribution and information technology services, which represented approximately 90% and 10%, respectively, of our revenues in the year ended December 31, 2003. Our electronic travel distribution revenues are generally derived from travel suppliers paying us a fee per transaction processed, as well as fees for other products. Under this model, each time a travel agency processes a booking with a travel supplier through us, the travel supplier pays us a fee based on the number of transactions involved in the booking. We record and charge one transaction fee for each segment of an air travel itinerary (e.g., four transactions for a round-trip airline ticket with one connection each way). We record and charge one transaction fee for each car rental, hotel, cruise or tour company booking, regardless of the length of time associated with the booking. The price of travel (airline ticket, car rental or hotel stay) does not impact the transaction fee that we receive. In addition to transaction fees, we derive a small portion of our electronic travel distribution revenues from access fees paid by travel agencies for the use of our services, which are typically discounted or waived if the travel agency generates a specified number of transactions through us over a specified period of time. As an incentive for travel agencies to use us, we typically pay volume-based inducements to our travel agencies. We also generate revenues from information technology services that we provide to various travel suppliers. As part of this business, we operate, maintain, develop and host the internal reservation and other systems for Delta and Northwest.
We are the largest processor globally for online travel agencies as measured by transactions. Since 1999, our total online travel agency transactions have increased from 14.6 million transactions to 90.3 million transactions in 2003 for a compound annual growth rate of 57.7%, with growth of 18.9% from 2002 to 2003. In 2003, in the United States (the world's largest travel market) we processed over 65% of online airline transactions and nearly all non-GDS owned online travel agency airline transactions processed by a GDS. Moreover, we expect hospitality and destination services transactions (which include car, hotel, tour, cruise and rail) generated through online travel agencies to increase in the future as hospitality and destination services suppliers increasingly recognize the distribution potential of online travel agencies and the importance of making inventory available for distribution in and generating sales through this channel. We believe that the emergence and growth of the Internet as a channel for making travel bookings and our leading market position put us at the forefront of industry growth.
We have executed an alternative strategy with regard to the online travel agency channel. Unlike our primary competitors, we do not own an online travel agency that competes with travel suppliers or travel agencies. Instead, we have developed strategic relationships with online travel agencies to provide them with transaction processing, mission-critical technology and services, and access to our aggregated travel information, which enable online travel agencies to operate effectively and efficiently. As a result of this strategy, we have entered into long-term contracts with Expedia, Orbitz and Priceline, which are three of the five largest online travel agencies in the world. In addition, we have an agreement with
63
Hotwire, another leading online travel agency, to process its airline transactions and have converted all of its airline transactions from Sabre, its previous provider, to us since March 2003. We also believe our Internet strategy will enhance our attractiveness to the traditional travel agencies that are now competing against online travel agencies owned by our competitors.
The chart below includes major online travel agencies and other GDS-owned sites and illustrates which agencies and sites are owned by a GDS and which agencies and sites are not owned by a GDS and instead have a strategic relationship with a GDS.
| | Name of GDS | |||||||
|---|---|---|---|---|---|---|---|---|
| | Worldspan | Amadeus | Galileo | Sabre | ||||
| Online Travel Agencies which are owned by a GDS: | None | Amadeus.net OneTravel.com Opodo(2) Rumbo.com Vacation.com | CheapTickets | Travelocity Site 59(1) | ||||
Online Travel Agencies which are not owned by a GDS and instead have a strategic relationship with a GDS: | Expedia Hotwire Orbitz Priceline | None | None | Expedia(3) | ||||
- (1)
- Site 59 is owned by Sabre but has an agreement to process its transactions through Worldspan.
- (2)
- Amadeus and its controlling shareholders hold a majority interest in Opodo.
- (3)
- Expedia informed us in May 2004 that it intends to exercise its right to move a portion of its transactions to Sabre.
We were formed in March 2003 by CVC and OTPP for purposes of acquiring all of the general partnership interests and limited partnership interest of Worldspan. Worldspan was founded in 1990 by Delta, Northwest and TWA. Affiliates of these three airlines (and later American, following its acquisition of TWA's assets) held ownership stakes in Worldspan from its formation until June 2003. We refer to American, Delta and Northwest in this prospectus as our founding airlines. On June 30, 2003, we acquired 100% of the outstanding partnership interests of Worldspan from affiliates of our founding airlines for an aggregate consideration of $901.5 million and agreed to provide credits to Delta and Northwest totalling up to $250.0 million structured over nine years in exchange for the agreement of those airlines to continue using Worldspan for information technology services.
GDS Industry
The GDS industry is a core component of the worldwide travel industry and is organized around two major sets of customers: travel suppliers and travel agencies. Suppliers of travel and travel-related products and services (such as airlines, car rental companies and hotels) utilize GDSs as a means of selling tickets and generating sales. As compensation for performing these services, the GDS generally charges the travel supplier a fee for every transaction it processes. Travel agencies (including traditional travel agencies, online travel agencies and corporate travel departments) utilize GDSs to search schedule, price, availability and other travel information and to process transactions on behalf of consumers. GDSs provide travel agencies with a single, expansive source of travel information, allowing travel agencies to search and process tens of thousands of itinerary and pricing options across multiple travel suppliers within seconds. Although travel agencies initiate and complete the transactions, it is the travel supplier that generally pays the transaction fee to the GDS. In addition, in order to gain and maintain relationships with travel agencies, GDSs typically provide volume-based inducements and
64
other economic incentives to travel agencies. Travel agencies may also pay fees for the use of hardware and software provided by the GDS, which may be discounted or waived if the travel agency generates a specified number of transactions through the GDS over a specified period of time. Nearly every time a consumer books a travel reservation through a travel supplier and travel agency that participates in a GDS, a GDS generates revenue.
In recent years, the travel industry has been marked by the emergence and growth of the Internet as a travel distribution channel. The growth in use of the Internet has led to the establishment of online travel agencies that provide a link between the consumer and the travel supplier, typically through a GDS. In 2003, airline transactions generated through online travel agencies accounted for approximately 28% of all airline transactions in the United States processed by a GDS, up from approximately 23% in 2002 and approximately 17% in 2001. Between 1999 and 2003, the number of airline transactions in the United States generated through online travel agencies and processed by a GDS increased at a compound annual growth rate of 40.5% and an annual growth rate of 14.1% for the most recent year. The chart below illustrates airline transactions generated through online and traditional travel agencies in the United States and processed by a GDS.(1)
- (1)
- MIDT airline transactions data for Worldspan, Amadeus, Galileo and Sabre.
Information Technology Services Industry
GDSs and other companies also provide various information technology services to the travel industry. These services include (i) internal reservation system services; (ii) flight operations technology services; and (iii) software development and licensing services, which includes custom development and integration. Internal reservation system services generally include the operation, maintenance, development and hosting of an airline's internal reservation system. The internal reservation system services a GDS provides to its airline customers are a critical component of their operations because they are the means by which they sell tickets. Flight operations technology services provide operational support from pre-flight preparation through departure and landing. Some of these services include weight and balance calculations, flight planning and tracking, passenger boarding, flight crew management, passenger manifests and cargo. Software development services focus on creating innovative software for use in an airline's internal reservation system and flight operations systems.
65
Competitive Strengths
We believe that the following strengths will allow us to continue to grow our market position and enhance our operating profitability and cash flow:
- •
- Market Leading Transaction Processor for Online Travel Agencies. In 2003, we processed more than 65% of online airline transactions made in the United States and processed by a GDS. In the mid-1990s, we recognized the important and increasing role the Internet would play in travel distribution. Our leadership in the online travel agency channel began in 1995 when Microsoft chose us as its transaction processing partner when it was developing Expedia as an online travel agency. Our relationship with Microsoft allowed us to gain invaluable experience in the online travel agency channel. We believe we were the first GDS to use Internet Protocol, or IP, from the online travel agency site all the way through to our mainframe, which allows us to take advantage of newly developing Internet technologies and to optimize our products and services for online travel agencies and travel suppliers. In addition, we executed a strategy of developing contractual relationships with online travel agencies, rather than owning an online travel agency like our primary competitors. As a result, we have been able to enter into long-term contracts with Expedia, Orbitz and Priceline, which are three of the five largest online travel agencies in the world. In addition, we have an agreement with Hotwire, another leading online travel agency, to process its airline transactions and have converted all of its airline transactions from Sabre, its previous provider, to us since March 2003.
- •
- Well Positioned to Take Advantage of the Shift to the Online Travel Agency Channel. An increasing number of travel transactions are being made online. In 2003, airline transactions generated through online travel agencies accounted for approximately 28% of all airline transactions in the United States processed by a GDS, up from approximately 23% in 2002 and approximately 17% in 2001. Between 2001 and 2003, the number of airline transactions in the United States generated through online travel agencies and processed by us increased at a compound annual growth rate of 23.5%. We believe that this shift to online travel agency booking will continue. Our relationships with four of the six largest online travel agencies in the world have positioned us well to take advantage of this shift.
- •
- Neutrality. We do not own an online travel agency. Unlike our competitors, we have intentionally not pursued a strategy of vertical integration and instead have forged strategic partnerships with leading online travel agencies. Given the highly competitive nature of the travel agency business, we believe our customers value our neutrality. As the shift towards the online travel agency channel continues, we believe the traditional travel agencies will increasingly view the GDS-owned online travel agencies as competitive to their core business. As a result, our neutrality gives us an opportunity to capture additional business from both online and traditional travel agencies.
- •
- Robust Technology Capabilities. Our use of Internet and server-based technologies has allowed us to provide travel suppliers and online and traditional travel agencies with products and services that enable custom applications, reduce operating costs, increase productivity and enhance the customer experience. As the leading transaction processor for online travel agencies, we believe we were the first GDS to configure our systems to use Internet Protocol, or IP, from the travel agency site all the way through to our mainframe. Our technological capabilities have allowed us to develop advanced fare and pricing, messaging, flight availability caching, and Web-interface solutions. In addition, our systems and networks are redundant and our hardware, software and data center have significant capacity for expansion. Our key systems utilize IBM's Transaction Processing Facility software platform, or TPF, which is valued for its ability to quickly and dependably process and manage the high number of transactions generated by our travel suppliers and travel agencies. We have an asset management agreement with IBM which expires in June 2008, that allows us to purchase IBM software, services and hardware at favorable
66
- •
- Proven Business Model with Strong Cash Flow Generation. Since our inception in 1990, we have successfully developed a leading global electronic travel distribution and information technology services business within the travel industry. Our ability to leverage our cost structure, grow transaction volumes, enlarge our customer base, and incur moderate ongoing capital expenditure and working capital requirements, enables us to generate significant net cash from operations. From 1999 through 2003, we generated $946 million of net cash from operations, which primarily enabled us to distribute $715 million to our founding airlines from 1999 through the closing of the Acquisition. Additionally, from 1999 to 2003, we accomplished the following: increased total transactions from 154 million to 193 million, representing a compound annual growth rate of 5.8%; increased our total electronic travel distribution revenues at a compound annual growth rate of 8.7%; and increased total revenues by a compound annual growth rate of 6.3%.
- •
- Strong Management Team. In June 2003, Rakesh Gangwal became our Chairman of the Board, Chief Executive Officer and President. Mr. Gangwal is a travel industry leader with extensive experience. He served as President and Chief Executive Officer of U.S. Airways, Inc. between 1998 and 2001 and President and Chief Operating Officer of U.S. Airways between 1996 and 1998. Mr. Gangwal also held a variety of senior executive positions at Air France and United Air Lines. In 1999, Mr. Gangwal was honored by Business Week magazine as one of the 25 top global executives for the year 1998. He is credited with leading the turnaround of Air France, considered one of the most successful global carriers in the world. At the same time, Gregory O'Hara became our Executive Vice President—Corporate Planning and Development. Mr. O'Hara has significant travel and technology industry experience. From 2000 to June 2003, Mr. O'Hara worked on a variety of private equity projects, including participation in the negotiation of the Acquisition. He served as Senior Vice President of Sabre, Inc. between 1997 and 2000. In addition, we have recently augmented our management team with other accomplished professionals and plan to continue to strengthen our management team in the future.
prices. As a result of this agreement, we believe we will be able to increase our processing and computer capabilities without a significant increase in associated software and hardware costs.
Business Strategy
We intend to continue to strengthen our market leadership position, maximize profitability and enhance cash flow through the following strategies:
- •
- Continue to Increase Our Share and the Number of Online Travel Agency Transactions. While we processed over 65% of online airline transactions made in the United States and processed by a GDS in 2003, we believe that there are still opportunities to increase our number of transactions and our market share in the online travel agency channel. Our primary competitors own online travel agencies, and we believe that the channel conflict inherent in our primary competitors' strategy leaves us well positioned to compete for the business of independent online travel agencies. In addition, we believe we can grow our online travel agency business in the European, Asian, Australian, Latin American and other international markets where the use of the online travel agency channel is still developing by utilizing our technical expertise and our relationships with U.S. online travel agencies as such agencies expand globally. We expect that our geographic expansion will enable our U.S.-based online travel agencies to increase their penetration in non-U.S. markets. In addition, we anticipate that our expansion to non-U.S. geographies will allow our emerging non-U.S. online travel agencies, such as OTC, Lastminute.com and eBookers to expand their businesses.
- •
- Increase Our Global Penetration of the Traditional Travel Agency Channel. We have historically focused on selected geographic markets where our founding airlines had significant operations. We believe we have the opportunity to obtain new traditional travel agencies both in and outside the
67
- •
- Capitalize on the Shift by Corporate Travel Departments to Online Travel Services. We believe there will be a substantial opportunity to capitalize on the trend of corporate travel departments toward making bookings for business travel through online services. We are well positioned to benefit from this trend, as Expedia and Orbitz, two of our largest online travel agency customers, have entered the corporate travel market. We believe we have valuable experience in the online sector by virtue of our relationships with four of the six largest online travel agencies in the world, and we plan to use this competency to take advantage of the online corporate direct market. In addition, we have developed a successful online corporate booking tool, Trip Manager. Some of our largest corporate travel subscribers include Federated Department Stores, PNC Bank and The Home Depot. In most cases, we work in conjunction with, rather than compete with, travel agencies using our travel products and services to support their efforts with corporations.
- •
- Increase Hospitality and Destination Services Transactions. We intend to increase our transaction fee revenues from hospitality and destination services, which include car, hotel, tour, cruise and rail. We derived approximately 8% of our transaction revenues for the year ended December 31, 2003 from hospitality and destination services transactions. Hospitality and destination services suppliers have historically not utilized GDSs to the same extent as airlines. However, we expect these future transactions to increase in number, largely as a result of the emergence of the Internet and online travel agencies as a means of facilitating travel commerce. In addition, we believe that many traditional and online travel agencies have identified hospitality and destination services transactions as an area of growth.
- •
- Expand Information Technology Services Business. We intend to expand our existing information technology services business. We believe that airlines and other travel suppliers have been and will be increasingly outsourcing non-core technology functionalities due to the desire to focus on their core travel business, to better manage fixed costs and to leverage the technology of information technology service providers. We are well positioned to take advantage of this shift because we currently provide internal reservation systems, flight operations technology and software development services to the airline industry. In addition, we also provide airlines and other travel-related companies with products and services on a subscription basis, including: Fares and Pricing, which is currently used by Avianca and Emirates Air and the airlines hosted by EDS, such as Aero Mexico, Continental and Virgin Atlantic; Electronic Ticketing, which is currently used by KLM; Worldspan Rapid RepriceSM, which is currently used by United Air Lines, Delta and Northwest; and e-Pricing[nc_cad,176], which is currently used by Northwest.
- •
- Continue to Reduce Costs. Since the Acquisition, we have executed several strategic cost reduction initiatives. We believe that additional opportunities exist to reduce costs and improve profitability. We plan to improve our cost structure by streamlining our programming and processing systems and reducing our network and data center costs, among other initiatives.
United States, particularly in Europe, Asia, Australia and Latin America, where we have not previously concentrated and where travel reservations are not generally made using current Internet technologies. For example, we recently entered into an agreement that enables the immediate transition of travel agencies in Hong Kong and Macau affiliated with TicTas System Automation Ltd. to our GDS. We believe our sophisticated Internet technologies will be attractive to traditional travel agencies as they seek to move towards more modern technologies. In addition, we intend to expand the number of transactions we process for traditional travel agencies in the United States. We believe we can successfully increase our market share in the United States and increase our global penetration in the traditional travel agency segment by providing innovative and low-cost products and services, by focusing on a limited number of opportunities to convert business currently supported by our competitors to us and by launching sales and marketing initiatives aimed at addressing the market for corporate travel departments which use traditional travel agencies.
68
Services
We operate in two business segments: electronic travel distribution and information technology services, which represented approximately 90% and 10%, respectively, of our revenues for the year ended December 31, 2003. Approximately 86% and 14% of our revenues for the year ended December 31, 2003 were generated by our domestic and foreign subsidiaries, respectively.
Electronic Travel Distribution
We are the second largest transaction processor for travel agencies in the United States (the world's largest travel market) and the largest processor globally for online travel agencies as measured by transactions. The GDS industry is a core component of the worldwide travel industry and is organized around two major sets of customers: travel suppliers and travel agencies. Suppliers of travel and travel-related products and services (such as airlines, car rental companies and hotels) utilize GDSs as a means of selling tickets and generating sales. Travel agencies (including traditional travel agencies, online travel agencies and corporate travel departments) utilize GDSs to search schedule, price, availability and other travel information and to process transactions on behalf of consumers. GDSs provide travel agencies with a single, expansive source of travel information, allowing travel agencies to search and process tens of thousands of itinerary and pricing options across multiple travel suppliers within seconds.
Through our GDS, we provide approximately 16,000 traditional travel agency locations in over 70 countries and approximately 50 online travel agencies, including four of the largest online travel agencies, with access to the inventory, reservations and ticketing of travel suppliers, including approximately 465 airlines, 225 hotel chains and 35 car rental companies throughout the world. As compensation for performing these services, we generally charge the travel supplier a fee for every transaction we process. For example, for a roundtrip ticket with one connection each way, a three night hotel stay and a three day car rental, we charge the respective travel suppliers one transaction fee for each segment of the airline ticket, one transaction fee for the hotel stay and one transaction fee for the car rental for a total of six transaction fees. The value of the travel purchase or the length of stay has no impact on our transaction fee.
Travel Suppliers
Our relationships with travel suppliers extend to airlines, hotels, car rental companies, tour operators, cruise companies and others that participate in our GDS. Travel suppliers process, store, display, manage and sell their services through our GDS. Through participating carrier agreements (for airlines) and associate agreements (for hospitality and destination services suppliers), airlines and other travel suppliers are offered varying services and levels of functionality at which they can participate in our GDS. These levels of functionality generally depend upon the type of communications and real-time access allowed with respect to the particular travel supplier's internal systems. We earn a fee, which is generally paid by the travel supplier, for transactions processed by us. We charge premiums for higher levels of functionality selected by the travel suppliers. In addition, we provide the airlines with marketing data generated from transactions we process for fees that vary based on the type and amount of information provided. This information assists airlines in their marketing and sales programs and in the management of their revenues, inventory and yields.
We derive a substantial amount of our revenues from transaction fees paid by travel suppliers. In 2003, approximately 92% of our transaction fee revenues were generated from airlines. While revenues from hospitality and destination services suppliers, primarily car rental companies and hotels, accounted for approximately 8% of our transaction fee revenues in 2003, the number of these transactions processed by us grew at a compound annual rate of 7.3% from 1999 through 2003, compared to a compound annual rate of 5.6% for airline transactions over the same period, reflecting increased travel agency use of our hospitality and destination services processing capabilities. Our top ten travel
69
suppliers, all airlines, accounted for approximately 66% of our total transaction fee revenues and approximately 66% of our total revenues in 2003.
Although most of the world's airlines and many hospitality and destination services travel suppliers participate in our GDS, we believe that this business segment has potential for continued growth. Opportunities for growth include adding new suppliers, increasing the level of participation of existing suppliers and offering new products and services. In marketing to travel suppliers, we emphasize our global distribution capabilities, the quality of our products and services, our contracts with four of the six largest online travel agencies, our extensive network of traditional and online travel agencies and the ability of travel suppliers to display information at no charge until a transaction is processed.
We have recently entered into three-year fare content agreements with Delta, Northwest and United Air Lines. Each airline has agreed to provide our traditional travel agencies in the territories covered by the agreements with substantially all fare content (including web fares) in exchange for monthly fee payments from us. Worldspan has agreed to keep the average fees per transaction paid by each airline steady for traditional travel agency bookings in the territories covered by the agreements. In addition, pursuant to this agreement, each airline has agreed, among other things, to commit to the highest level of participation in our GDS for three years. Further, in February 2004, we executed a three-year fare content agreement with British Airways to provide access to virtually all of their published fares (including web fares) to some of our U.K. travel agencies. We expect that these new fare content agreements will provide our traditional travel agencies in the territories covered by the agreements with access to improved quality and content concerning the flights and fares of the participating airlines and other forms of non-discriminatory treatment. We believe that obtaining similar fare content from our other major airline travel suppliers is important to our ability to compete, since other GDSs have also entered into fare content agreements with various airlines. Consequently, we plan to pursue agreements similar to these fare content agreements with other major airlines in order to obtain access to such content.
Travel Agencies
Approximately 16,000 traditional travel agency locations and 50 online travel agencies worldwide depend on us to provide travel information, book and ticket travel purchases and manage travel information and agency operations. Access to our GDS enables travel agencies to electronically search travel-related data such as schedules, availability, services and prices offered by our travel suppliers. Through our GDS, our travel agencies have access to approximately 465 airlines, 225 hotel chains and 35 car rental companies. Travel agencies access our GDS using hardware and software typically provided by us or a third party. We also provide technical support, training and other assistance to travel agencies. Travel agencies generally pay a fee for access to our GDS and for the equipment, software and services provided. However, this fee is often discounted or waived if the travel agency generates a specified number of transactions processed by us during a specified time period. Additionally, we provide cash incentives or other inducements to a significant number of travel agencies as a means of facilitating greater use of our GDS.
Our travel agencies consist of online travel agencies, traditional travel agencies, and corporate travel departments.
- •
- Online Travel Agencies. We have contracts with approximately 50 online travel agencies, including long-term agreements with three of the largest online travel agencies in the world (Expedia, Orbitz and Priceline). We act as the processing engine for our online travel agencies by providing information to and processing services for these online travel agencies' systems. Our services enable these online travel agencies to provide consumers with travel information and the ability to make travel reservations. Our online travel agency customers accounted for over 65% of online airline transactions in the United States processed by a GDS in 2003. Transactions generated by online travel agencies constituted approximately 47% of the transactions processed by us in 2003. Transactions processed for Expedia, Hotwire, Orbitz and Priceline, our four largest online travel agencies, accounted for approximately 43% of our total transactions in 2003. Our contracts with Expedia, Orbitz and Priceline expire in 2010, 2011 and 2007, respectively. In addition, we have an agreement with Hotwire, another leading online travel agency, to process all of its airline transactions through us, rather than Sabre, its previous provider.
70
- •
- Traditional Travel Agencies. Approximately 16,000 travel agency locations worldwide rely on us to plan, book and ticket travel for their customers, as well as manage travel information and agency operations. We provide traditional travel agencies with access to our GDS and customized hardware and software, often utilizing Web-based technologies, in return for fees that typically vary inversely with productivity, as measured by the number of transactions we process for the traditional travel agency. Such fees are payable monthly over the term of the traditional travel agency's agreement with us, generally five years in the United States and three years in Europe. Some of our largest traditional travel agency customers include American Express, USA Gateway Travel and World Travel/BTI. Transactions processed for traditional travel agencies constituted approximately 53% of the transactions processed by us in 2003. Based upon our analysis of our 1,000 largest traditional travel agencies, the average relationship tenure among those traditional travel agencies is approximately eight years. In 2001, 2002 and 2003, average turnover of our traditional travel agencies in North and South America was approximately 6%. Transactions processed for our top ten traditional travel agencies accounted for approximately 10% of our total transactions in 2003. No individual traditional travel agency accounted for more than 5% of our total transactions in 2003.
- •
- Corporate Travel Departments. We provide GDS-interconnected products and services to corporations through our Trip Manager product offering. Trip Manager allows corporate travel managers or employees to be active in travel planning, pre-travel decision-making and back-end travel expense reporting. Our various products provide corporations with tools to manage travel costs, to ensure employee compliance with corporate travel policies and to provide expense reporting, information regarding vendor relationships, ease of access for booking and quick and flexible distribution of tickets. In most cases, we work in conjunction with our traditional travel agencies in the installation of our travel products with corporations.
Information Technology Services
We provide a comprehensive suite of information technology, or IT, services to airlines, including: (i) internal reservation system services; (ii) flight operations technology services; and (iii) software development and licensing services, which include custom development and integration. Our internal reservation system services include the operation, maintenance, development and hosting of an airline's internal reservation system and include seat availability, reservations, fares and pricing, ticketing and baggage services. The internal reservation system services we provide to our airline customers are a critical component of their operations because they are the means by which they sell tickets. Our flight operations technology services provide operational support to our airline customers, from pre-flight preparation through departure and landing. Some of these services include weight and balance, flight planning and tracking, passenger boarding, flight crew management, passenger manifests and cargo. Our software development services focus on creating innovative software for use in an airline's internal reservation system and flight operations systems. We intend to utilize our airline expertise to offer solutions to other industries that face similar complex operational issues and utilize similar technology platforms, including the airport, railroad, cruise, hotel and car industries.
Our primary customers in the information technology services segment are Delta and Northwest. We have had IT services agreements in place with Delta and Northwest since 1993. Pursuant to technology services agreements entered into with these two airlines at the closing of the Acquisition (called founder airline services agreements or FASAs), we will continue to fulfill the information technology requirements relating to the hosting of core internal reservation system services for each of Delta and Northwest during the term of the agreements. In addition, we provide contract software development and transaction processing services and other airline support services for each of these airlines. The FASAs contain minimum levels of software development services to be provided by us to
71
each of Delta and Northwest. We also provide information technology services for approximately ten other airlines throughout the world.
We also provide airlines and other travel-related companies with specific internal reservation system products and services on a subscription basis. While some airlines elect to have their internal reservation system run by a single IT services provider, others prefer to outsource selected functions to multiple IT services providers. We have developed an array of products and services to meet the needs of airlines which use multiple providers, including Fares and Pricing (which is a fare-shopping tool that enables airlines to outsource fares and pricing functionality to us); Electronic Ticketing (which is a database that enables airlines to outsource electronic ticketing storage and maintenance to us); Worldspan Rapid RepriceSM (which is an automated solution that enables airlines to increase revenues and provide better service by recalculating fares when itineraries change); and e-Pricing[nc_cad,176] (which is a multi-server-based fare search tool, developed jointly by Worldspan and Expedia and is used by our customers to provide their users with a greater selection of travel options).
Strategic Relationships
In order to facilitate the delivery of leading technologies, products and services to our travel suppliers and our travel agencies, we have forged a number of relationships with leading companies. These strategic alliances have helped position us at the forefront of the travel distribution industry.
Online Travel Agencies. We have developed a strategy of partnering with online travel agencies rather than owning an online travel agency. Because we have avoided competing directly with online travel agencies, we believe that we are well positioned to take advantage of the channel shift in bookings to online travel agencies. We have long-term contracts with three of the largest online travel agencies (Expedia, Orbitz and Priceline), which represented approximately 60% of the total U.S. online travel agency market share for airline transactions processed by a GDS in 2003. In addition, we have an agreement with Hotwire, another leading online travel agency, to process its airline transactions through us, rather than Sabre, its previous provider.
Delta and Northwest. We believe that our marketing agreements with Delta and Northwest will assist us in attracting and retaining travel agencies and providing a high level of service to them. Pursuant to these agreements, each of Delta and Northwest have agreed to continue to provide marketing support for our GDS with respect to travel agencies in North and South America (in the case of Delta) and the U.S. and Japan (in the case of Northwest). The marketing support from these airlines is exclusive to us in these territories until June 2006 in the case of Delta and until June 2007 in the case of Northwest, with the exclusivity commitment from these airlines subject to us satisfying transaction fee pricing requirements for our GDS services for each of those two airlines. In addition, the marketing agreements contain commitments from each of Delta (until June 2006) and Northwest (until June 2007) not to terminate its participation in our GDS unless it first terminated its participation in the GDSs of Amadeus, Galileo and Sabre, subject to us satisfying certain GDS transaction fee pricing and other requirements. Each of Delta (until June 2006) and Northwest (until June 2007) also agreed to provide to us no less functionality, inventory, inventory controls or information related thereto in any given country than such airline provides to any other current GDS in that country and to provide to us all fares that it makes available to any other current GDS for distribution to all such other GDS's subscribers on the same terms and conditions, in each case subject to us satisfying certain GDS transaction fee pricing and functionality requirements. Delta recently notified us that, until we modify our GDS transaction fee pricing, it would suspend its marketing support and the discount that it has provided to us for business travel. We are working with Delta to review the relevant data and to resolve these issues.
IBM. We have an asset management agreement with IBM which expires in June 2008. The agreement allows us to purchase IBM software, services and hardware at favorable prices. As a result
72
of this agreement, we believe that we will be able to increase our processing and computer capabilities without a significant increase in associated software and hardware costs.
Customers
Travel Suppliers. Our travel supplier base includes approximately 465 airlines, 225 hotel chains and 35 car rental companies. The table below depicts our largest travel suppliers in the airline, car rental and hotel chain categories in 2003.
| Airlines | Car Rental Companies | Hotels | ||
|---|---|---|---|---|
| American Airlines | Avis | Courtyard by Marriott | ||
| Delta Air Lines | Dollar | Hampton Inns | ||
| Northwest Airlines | Hertz | Hilton Hotels | ||
| United Air Lines | National | Holiday Inn | ||
| US Airways | Thrifty | Marriott |
Our top five and top ten travel suppliers (all of which are airlines) represented approximately 54% and 66%, respectively, of our total revenues in 2003. In 2003, Delta and Northwest represented 19% and 12% of our revenues, respectively. In 2002, Delta and Northwest represented 20% and 14%, respectively. No other supplier represented more than 10% of our total revenues.
Travel Agencies. Our travel agencies include approximately 16,000 traditional travel agency locations in more than 70 countries and approximately 50 online travel agencies, including four of the six largest online travel agencies in the world. The table below depicts our largest travel agencies in the traditional travel agency and online travel agency categories in 2003.
| Traditional | Online | |
|---|---|---|
| American Express | Expedia | |
| MyTravel Group | Hotwire.com | |
| Northwestern Travel Management | Lastminute.com | |
| USA Gateway Travel | Orbitz | |
| World Travel/BTI | Priceline |
Our top five and top ten travel agencies generated approximately 45% and 50%, respectively, of our total transactions in 2003. Expedia generated over 20% of our total transactions in 2003. In 2003, Expedia, Hotwire, Orbitz and Priceline represented approximately 43% or our total transactions, up from 37% in 2002. Expedia alone represented over 20% of our total transactions in 2003 and over 15% in 2002. Orbitz accounted for over 10% of our total transactions in 2003 and 2002.
Sales and Marketing
Our sales and support professionals are located in more than 25 countries and are responsible for maintaining the relationship and growing the business with our large and diverse constituencies of travel suppliers and travel agencies. We employ a dedicated sales and customer support force which specializes in meeting the needs of our travel suppliers and travel agencies.
Travel Supplier/Information Technology Services. Our travel supplier sales and support professionals maintain our business relationships with the hundreds of travel industry suppliers that distribute services electronically. This group also sells our hosting, information technology and transaction-based services. They focus on meeting the needs of their customers on a segmented basis. Dedicated hotel and car industry salespeople serve those respective customers, while airline distribution salespeople sell to airline customers and potential customers. We also maintain a separate team of hosting, information
73
technology and transaction-based salespeople to market the specific services that we offer to airlines and others.
Travel Agencies. We maintain teams of sales and support professionals to service each type of travel agency customer. Dedicated account management teams, consisting of business development, technical support and operational support specialists, maintain the relationship and support the needs of our largest consumer online travel agencies, including Expedia, Hotwire, Orbitz and Priceline. These sales and support professionals are focused on tailoring our e-commerce and other capabilities to meet the specific and unique needs of our online travel agencies.
Our traditional travel agency sales group segments our traditional travel agencies by size and geography. Sales and support professionals contact or visit our traditional travel agencies on a regular basis to promote usage of our GDS, introduce new products and services and negotiate contract renewals. Sales people also call on specifically targeted travel agencies to negotiate and facilitate their use of our GDS. For our largest and most important travel agencies, we employ dedicated strategic accounts sales groups. Most of our smaller traditional travel agencies receive their sales and service support through an efficient and cost-effective inside sales telemarketing group.
Competition
GDS Market. The marketplace for travel distribution is large, multi-faceted and highly competitive. In the GDS market, we compete primarily with three other GDS companies: Amadeus, Galileo and Sabre. Our share of the GDS airline market, based upon 2003 airline transactions totaled approximately 30% in the U.S. and approximately 17% worldwide. Each of our primary competitors offers products and services similar to ours. We believe competition in the GDS market occurs primarily on the basis of the following criteria:
- •
- travel supplier and travel agency relationships;
- •
- product features, functionality and performance;
- •
- travel supplier participation levels and availability of inventory;
- •
- technology;
- •
- customer and marketing support;
- •
- global service capability; and
- •
- service, prices and inducements to travel agencies.
In addition to making their travel-related products and services available through a GDS, travel suppliers are increasingly utilizing alternate channels of distribution designed to directly connect with consumers without the use of a GDS, which may shift business away from us. One alternate method involves travel suppliers giving consumers direct access to their inventory. Examples of this method include travel supplier proprietary websites, internal reservation call centers and ticket offices. A second alternate method involves travel suppliers providing their inventory directly to online and traditional travel agencies without the use of a GDS. Recent examples of this include participation by several airlines, such as American, AmericaWest Airlines, Continental Airlines and Northwest in a direct connect link with Orbitz. The creation of travel supplier joint ventures, such as Orbitz (owned by major U.S. airlines), Opodo (controlled by large European airlines and Amadeus) and Travelweb (owned primarily by several U.S. hotel chains), could enhance development of this method.
74
Although we potentially face new competitors, there are several barriers to entry into the GDS business, including:
- •
- the costs and length of time required to assemble the hardware complexes, develop the sophisticated intellectual property of a GDS, and compile the needed databases of travel information;
- •
- the costs and length of time required to establish new relationships and negotiate distribution agreements with a wide range of travel suppliers; and
- •
- the costs and length of time required to establish new relationships and negotiate agreements with travel agencies, which are generally operating under multi-year contracts with existing GDSs and which incur switching costs in converting to a new GDS.
Information Technology Services Market. Competition within the information technology services market is segmented by the type of service offering. Internal reservation and other system services competitors include Amadeus, EDS, Navitaire, Sabre and Unisys/SITA, as well as airlines that provide the services and support for their own internal reservation system services and also host external airlines, such as Aer Lingus's Astral System or KLM's Corda system. Competitors for data center and network outsourcing services include EDS, Galileo, IBM, Sabre and Unisys/SITA. Our competitors for information technology consulting include Accenture, Booz, Allen & Hamilton Consulting, Capgemini, CSC, EDS, IBM, Sabre and Unisys/SITA.
Technology and Operations
We continuously invest in technology, software and hardware. We believe that we will benefit from economies of scale as our technology and infrastructure are readily expandable and can support incremental volume without significant additional investment. Our GDS is capable of sustained processing of more than 9,500 peak messages per second with currently installed hardware. For the year ended December 31, 2003, the average transaction rate for our TPF systems was 3,519 messages per second. The physical plant is continually being advanced to leverage technologies that improve our efficiency, performance, speed to market, reliability, security and uptime requirements.
Significant efforts over the last three years have moved our infrastructure from one supporting primarily legacy technology protocols and platforms to one focused on IP-based technologies. This has been key to enabling creation of a hybrid computing environment that leverages TPF for very high volume transaction processing but supports seamless incorporation of more open platforms. This hybrid environment provides quicker time to market, options to use third-party software products, richer content support and cost effective hardware choices when very high transaction volumes are not an issue.
We manage a large data network interconnecting customers around the globe. We partner with key global network suppliers to deliver a range of network options to match our diverse customer base. The network solutions are optimized for the location, capacity, reliability and business goals of the customer. We offer two categories of IP-based network solutions. The first leverages the Internet to provide a low cost, high value solution, and the second provides customers with a private managed frame relay network to allow predictable capacity, high availability and security.
We have designed and implemented our Internet network to assure the availability of this strategic connection to the travel marketplace. Our connection to the Internet is maintained through AT&T and Uninet S.A. de C.V. We use Internet connectivity to provide solutions for internal corporate access, business partner connections and consumer access to both Worldspan hosted and branded Internet products and services.
75
We have been a leader in adopting Internet protocol, or IP, networks to support our growth and lower our costs. Through partnerships with global network providers, our customers are able to manage capacity and security issues via standard, open IP-based technologies. We utilize two primary network providers (AT&T and SITA) to provide a frame relay network to connect customers to our data center. AT&T provides services for the North American market, except for Mexico where Uninet provides coverage, and SITA provides services in Europe, the Middle East, Africa and Asia. In some smaller markets local providers provide network services to our customers.
Properties
The table below provides a summary of our principal facilities as of March 31, 2004.
| Location | Total Square Feet | Leased or Owned | Principal Function | |||
|---|---|---|---|---|---|---|
| Atlanta, Georgia | 335,003 | Leased | Headquarters & administration | |||
| Atlanta, Georgia | 120,000 | Leased | Data center | |||
| London, England | 24,068 | Leased | Office space | |||
| Kansas City, Missouri | 200,000 | Leased | Office space | |||
| Ft. Lauderdale, Florida | 21,102 | Leased | Office space | |||
| Mexico City, Mexico | 7,427 | Leased | Office space |
Some of our office leases are on month-to-month renewals, with our primary office leases expiring during various times from December 2004 to December 2014, subject to renewal options. Our data center lease with Delta expires in 2022. In addition, we have an additional 77,857 square feet leased for 36 office locations around the world. We recently renewed our existing headquarters lease through December 2014, reducing the amount of square footage leased. We believe that our headquarters, other offices and data center are adequate for our immediate needs and that additional or substitute space is available if needed to accommodate growth and expansion.
Employees
On March 31, 2004, we had a worldwide staff of about 2,370 employees. Of these, about 1,310 were located at our headquarters and data center in Atlanta, Georgia and about 570 were located in Kansas City, Missouri. Other larger employee facilities include an office in London, England with about 160 employees, an office in Ft. Lauderdale, Florida with about 80 employees, and an office in Mexico City, Mexico with about 50 employees. The balance of the employees are located in smaller facilities in Europe, South America, the Middle East and Asia or are based in field locations or work out of their homes.
Our employees perform a large number of functions including applications and systems programming, data center and telecommunications operations and support, marketing, sales, customer training and support, finance, human resources, and administration. We have organized our employees into the following eight worldwide areas, each with the specified number of employees as of March 31, 2004: Product Solutions—980 employees; Technical Operations—390 employees; Travel Distribution—620 employees; Corporate Planning and Development—50 employees; Finance—160 employees; e-Commerce and Product Planning—130 employees; Legal and Human Resources—40 employees. We consider our current employee relations to be good. None of our employees is represented by a labor union.
GDS Industry Regulation
GDSs are regulated by the U.S., the European Union ("E.U.") and other countries in which we operate. The U.S. Department of Transportation ("DOT") and the European Commission ("EC") are
76
the relevant regulatory authorities in the U.S. and the E.U., respectively. Most of the regulating bodies have reexamined or are reexamining their GDS regulations and appear to be moving toward deregulation.
On January 31, 2004, most DOT rules governing GDSs were lifted. The DOT rules no longer contain any rules that apply uniquely to GDSs that are owned or marketed by airlines. One remaining rule continues an existing requirement that GDSs refrain from biasing flight listings in favor of some airlines to the disadvantage of others. A second prohibits a GDS from requiring an airline to provide all fares as a condition of participation in its system. These remaining DOT rules will be phased out at the end of July 2004.
E.U. regulations continue to address the participation of airline GDS owners in other GDSs. In general, these rules are directed at regulating competitive practices in the E.U.'s electronic travel distribution marketplace. Among the major principles generally addressed in the current E.U. regulations are:
- •
- Displays of airline information. GDSs must provide computer-screen displays of airline services that are non-discriminatory, based on objective criteria, and that do not use airline identity in ordering the display of services;
- •
- Treatment of airlines and airline information by GDSs. Any GDS subject to the regulations ("a Covered GDS") must provide data related to bookings through its system to participating airlines that is as complete, accurate and timely as the information given to its airline owners;
- •
- Non-discrimination in fees charged to airlines for GDS products and services. GDSs must offer the same fees to all airlines for the same level of service and if a Covered GDS offers any enhancements to an airline that is an owner of that GDS, then it is required to offer the enhancements to other airlines on a non-discriminatory basis;
- •
- Participation by airlines owners of a GDS in other GDSs. Covered GDSs must update information for all participating airlines with the same degree of care and timeliness and provide marketing and booking information to participating airlines on non-discriminatory terms;
- •
- Relationships with Covered Subscribers. GDSs must allow subscribers covered by the regulations ("Covered Subscribers") to terminate their GDS subscriber contracts on three months' notice after the first year of the agreement and allow the Covered Subscriber's use of another system; and
- •
- Use of third-party hardware, software and databases. GDS-owner airlines are prohibited from linking the payment of commissions to Covered Subscribers to the Covered Subscriber's use of the GDS of which the airline is an owner, requiring a Covered Subscriber to use the GDS of which the airline is an owner, and banning Covered Subscribers from using hardware or software provided by third parties in connection with the system's equipment, unless that hardware or software threatens to impair the integrity of the system.
The EC has begun the process of reviewing the GDS regulations for possible changes, including eliminating some or all of these regulations. The EC has not yet published any proposed new GDS regulations, and it is unknown when or if the EC may issue proposed and/or final regulations or what form they may take.
There are also GDS regulations in Canada, under the regulatory authority of the Canadian Department of Transport. On April 27, 2004, a significant number of these regulations were lifted. Amendments to the rules include:
- •
- eliminating the "obligated carrier" rule, which required larger airlines in Canada to participate equally in the GDSs; and
77
- •
- elimination of the requirement that transaction fees charged by GDSs to airlines be non-discriminatory.
In the rule-making process leading up to these amendments, Worldspan advocated for complete deregulation of the GDS industry in Canada.
GDS regulations also exist in Peru and there is a possibility of additional regulation in other jurisdictions. Several countries have examined or are examining, the possibility of GDS regulation including Brazil, Australia, and some Middle Eastern countries.
Other Regulation
There also exists privacy and data protection legislation in numerous jurisdictions around the world, including the E.U. through its Data Protection Directive (and implementing statutes of this Directive in the E.U. Member States). This legislation is intended to protect the privacy of personal data that is collected, processed and transmitted in or from the governing jurisdiction. Enforcement takes place under the force of national legislation of the E.U. Member States. In addition, in the aftermath of the terrorist attacks of September 11, 2001, government agencies have been contemplating or developing initiatives to enhance national and aviation security, including the Transportation Security Administration's Computer-Assisted Passenger Prescreening System, known as CAPPS II. These initiatives may result in conflicting legal requirements with respect to data handling. As privacy and data protection has become a more sensitive issue, we may also incur legal defense costs and become exposed to potential liabilities as a result of differing views on the privacy of travel data. Travel businesses have also been subjected to investigations, lawsuits and adverse publicity due to allegedly improper disclosure of passenger information. For example, we are one of the defendants in a class action lawsuit arising from disclosures by Northwest of passenger data to a U.S. government agency. It is expected that our business will continue to be impacted by privacy and data protection legislation.
We may be impacted by regulations affecting issues such as exports of technology, telecommunications and electronic commerce. Some portions of our business, such as our Internet-based travel marketing and distribution, may be affected if regulations are adopted in these areas. Any such regulations may vary among jurisdictions. We believe that we are capable of addressing these regulatory issues as they arise.
In addition, we are subject to a broad range of federal, foreign, state and local laws and regulations relating to the pollution and protection of the environment, health and safety and labor. Based on continuing internal review and advice from independent consultants, we believe that we are currently in substantial compliance with applicable environmental requirements and health and safety and labor laws. We do not currently anticipate any material adverse effect on our operations, financial condition or competitive position as a result of our efforts to comply with environmental requirements.
Legal Proceedings
In September 2003, we received multiple assessments totaling €39.5 million (equating to approximately $49.6 million as of December 31, 2003) from the tax authorities of Greece relating to tax years 1993-2000. We are currently in the process of filing appeals of these assessments, the outcome of which is currently uncertain. The purchase agreement between our founding airlines and us provides that each of our founding airlines will severally indemnify us on a net after-tax basis from and against any of our taxes related to periods prior to the Acquisition. We have informed our founding airlines of the receipt of these assessments and the indemnity obligation of our founding airlines under the purchase agreement relating to the Acquisition. Because of this indemnity, we believe that amounts paid, if any, to settle this assessment will be reimbursed by our founding airlines and will not have an impact upon our business, financial condition or results of operations.
78
In January 2004, we received notice of a class action suit filed in the U.S. District Court for the District of Minnesota in which Worldspan intially was one of the named defendants and which alleges violations of various laws relating to privacy. These allegations arise from disclosures by Northwest of passenger data to a U.S. government agency, a series of events that transpired in 2001 or 2002. We informed our founding airlines of the filing of this suit and their indemnity obligation under the purchase agreement relating to the Acquisition. An amended and consolidated class action lawsuit was recently refiled in this case, and we are no longer a named defendant in the matter. Due to this refiling, indemnity and our analysis of the facts and the law in the case, we believe that any amounts that we are obligated to pay in this matter will not have a material impact upon our business, financial condition or results of operations.
We are involved in various other litigation proceedings as both plaintiff and defendant. In the opinion of our management, none of these other litigation matters, individually or in the aggregate, if determined adversely to us, would have a material adverse effect on our business, financial condition or results of operations.
Intellectual Property Rights
We use software, business processes and other proprietary information to carry out our business. These assets and related copyrights, trade secrets, trademarks, patents and intellectual property rights are significant assets of our business. We rely on a combination of copyright, trade secret, trademark and patent laws, confidentiality procedures and contractual provisions to protect these assets. Our software and related documentation, including our proprietary TPF applications, are protected under trade secret and copyright laws where appropriate. We also seek statutory and common law protection of our trademarks, such as Worldspan, where appropriate. In addition, we are seeking patent protection for key technology and business processes of our business. The laws of some foreign jurisdictions provide less protection than the laws of the United States for our proprietary rights. Unauthorized use of our intellectual property could have a material adverse effect on us and there can be no assurance that our legal remedies would adequately compensate us for the damages to our business caused by such use.
We rely on a number of third-party and jointly developed software licenses which are material to our business. These include the TPF operating system software that we license from IBM and that supports our core GDS technology. The IBM license expires in June 2008. In addition, we developed e-Pricing® jointly with Expedia and share intellectual property rights in this application.
The estimated amount spent on company-sponsored research and development activities was $9.6 million, $10.1 million and $12.7 million for the years ended December 31, 2003, 2002 and 2001, respectively. The estimated amount spent on customer-sponsored research and development activities was $5.0 million, $5.5 million and $5.9 million for the years ended December 31, 2003, 2002 and 2001, respectively.
79
Directors and Executive Officers
We are a holding company, whose stockholders include CVC, OTPP, their respective affiliates and members of our senior management.
Our executive officers and directors are as follows:
| Name | Age | Position | ||
|---|---|---|---|---|
| Rakesh Gangwal | 50 | Chairman, President and Chief Executive Officer and Director | ||
| M. Gregory O'Hara | 38 | Executive Vice President—Corporate Planning and Development and Director | ||
| Ninan Chacko | 39 | Senior Vice President—e-Commerce and Product Planning | ||
| David A. Lauderdale | 43 | Chief Technology Officer and Senior Vice President—Technical Operations | ||
| Michael B. Parks | 44 | Senior Vice President and General Manager—Worldwide Travel Distribution | ||
| Susan J. Powers | 53 | Chief Information Officer and Senior Vice President—Worldwide Product Solutions | ||
| Jeffrey C. Smith | 52 | General Counsel, Secretary and Senior Vice President—Human Resources | ||
| Michael S. Wood | 49 | Senior Vice President and Chief Financial Officer | ||
| Shael J. Dolman | 32 | Director | ||
| Ian D. Highet | 39 | Director | ||
| James W. Leech | 56 | Director | ||
| Dean G. Metcalf | 48 | Director | ||
| Paul C. Schorr IV | 37 | Director | ||
| Joseph M. Silvestri | 42 | Director | ||
| David F. Thomas | 54 | Director |
Rakesh Gangwal, Chairman, President and Chief Executive Officer and Director. Mr. Gangwal has been our Chairman, Chief Executive Officer and President since June 2003. From August 2002 to June 2003, Mr. Gangwal was involved in various consulting projects, including work in connection with the Acquisition. From December 2001 to July 2002, Mr. Gangwal was involved in a variety of business endeavors, including private equity projects and consulting projects. From November 1998 to November 2001, Mr. Gangwal was President and Chief Executive Officer of U.S. Airways Group. From May 1998 to November 2001, Mr. Gangwal was President and Chief Executive Officer of U.S. Airways, Inc. From February 1996 to May 1998, Mr. Gangwal was President and Chief Operating Officer of U.S. Airways Group. U.S. Airways filed for voluntary bankruptcy under Chapter 11 in August 2002, nine months after Mr. Gangwal's departure, and emerged from bankruptcy in March 2003. From 1994 to 1996, Mr. Gangwal was Executive Vice President of Planning and Development for Air France. From 1984 to 1994, he held a variety of executive management positions at United Air Lines, including Senior Vice President of Planning between 1992 and 1994. Mr. Gangwal holds a Bachelor of Technology in mechanical engineering from The Indian Institute of Technology, Kanpur, India and holds an MBA from the University of Pennsylvania's Wharton School. Mr. Gangwal is a director of Boise Cascade Corporation.
M. Gregory O'Hara, Executive Vice President—Corporate Planning and Development and Director. Mr. O'Hara has been our Executive Vice President—Corporate Planning and Development since June 2003. From 2000 until June 2003, Mr. O'Hara worked on a variety of private equity projects. He served as a Senior Vice President of Sabre, Inc. from 1997 to 2000, where he was responsible for deal initiation, strategy and design function. From 1995 to 1996, Mr. O'Hara was an Associate with Perot
80
Systems Corporation. From 1991 to 1995, he was the President and Founder of Advanced Systems International. Mr. O'Hara holds an MBA from Vanderbilt University.
Ninan Chacko, Senior Vice President—e-Commerce and Product Planning. Mr. Chacko has been our Senior Vice President—e-Commerce and Product Planning since January 2004 and our Senior Vice President—Product Planning since October 2003. From 2002 to October 2003, Mr. Chacko served as Senior Vice President of Emerging Business at Sabre Holdings, Inc. From 1997 to 2002, Mr. Chacko served in a variety of management roles at Sabre Inc., including Senior Vice President of Marketing for Travel Marketing and Distribution. Mr. Chacko holds Bachelor of Science and Master of Science degrees in aerospace engineering from the University of Kansas. He also graduated from Harvard Business School's Advanced Management Program.
David A. Lauderdale, Chief Technology Officer and Senior Vice President—Worldwide Technical Operations. Mr. Lauderdale has been with us since 1993, most recently serving as our Chief Technology Officer and Senior Vice President—Worldwide Technical Operations. From 1997 to 2001, Mr. Lauderdale served as our Director—Worldwide E-Commerce and Communications Infrastructure, where he initiated and led the effort to TCP/IP-enable our global distribution network. From 1996 to 1997, Mr. Lauderdale served as our Director—Communications Software. From 1994 to 1996, Mr. Lauderdale was our Director—Computer Operations. Prior to joining us in 1993, Mr. Lauderdale served as Manager—Technical Services for PARS Service Partnership.
Michael B. Parks, Senior Vice President and General Manager—Worldwide Travel Distribution. Mr. Parks has been our Senior Vice President and General Manager—Worldwide Travel Distribution since 2000. From 1997 to 2000, Mr. Parks served as Senior Vice President, Electronic Travel Distribution for Europe, the Middle East and Africa at Sabre. While in this position at Sabre, he directed all aspects of Sabre's electronic travel distribution initiatives, including marketing, sales and product management activities throughout that region of the world. From 1993 to 1997, Mr. Parks served as Senior Vice President for Sabre's Latin American and Caribbean division. Mr. Parks joined Sabre in 1993 after holding various travel technology and sales management positions with Galileo and United Air Lines in North America, Europe and Latin America. He holds a Bachelor of Arts in public administration and political science, as well as a licenciado in inter-American studies from the University of the Pacific.
Susan J. Powers, Chief Information Officer and Senior Vice President—Worldwide Product Solutions. Ms. Powers joined us in 1993 and is currently our Chief Information Officer and Senior Vice President—Worldwide Product Solutions. From 1996 to 2001, she served as our Senior Vice President—Worldwide E-Commerce and Vice President—Sales. From 1993 to 1996, she served as our Vice President—Product and Associates Marketing. From 1991 to 1993, Ms. Powers was Director of Marketing and Distribution for Northwest. Ms. Powers holds a Bachelor of Science in mathematics from Southern Illinois University and an MBA from Northern Illinois University.
Jeffrey C. Smith, General Counsel, Secretary and Senior Vice President—Human Resources. Mr. Smith joined us as our General Counsel, Secretary and Senior Vice President—Human Resources in March 2004. From 2001 to 2003, Mr. Smith served as General Counsel, Corporate Secretary and Chief Human Resources Officer for Cincinnati Bell Inc. (formerly Broadwing Inc.). From 1999 to 2001, he served as Chief Legal and Administrative Officer of Broadwing Inc. From 1997 to 1999, Mr. Smith served as Senior Vice President, Chief Administrative Officer, General Counsel and Secretary at IXC Communications, Inc. before its acquisition by Cincinnati Bell Inc. From 1985 to 1996, Mr. Smith served with The Times Mirror Company, beginning as senior staff counsel and ultimately as Vice President—Planning and Development for the Times Mirror Training Group. He holds a juris doctor from the University of California, Hastings College of the Law, an MBA from Pepperdine University and a Bachelor of Science in business administration from Lewis and Clark College.
Michael S. Wood, Senior Vice President and Chief Financial Officer. Mr. Wood joined us as our Senior Vice President and Chief Financial Officer in February 2004. Prior to joining us, Mr. Wood
81
served as Senior Vice President and General Manager-Emerging Technologies at ChoicePoint. From February 2000 to May 2002, he served as Senior Vice President and Chief Financial Officer at ChoicePoint, responsible for finance, investor relations, human resources and administration. From February 1992 to January 2000, Mr. Wood served in various management roles, including Chief Financial Officer, at Lane Bryant, a division of The Limited, Inc. Prior to this, he served in various financial and auditing roles at General Electric and Primerica Corporation. Mr. Wood holds a Bachelor of Science in accounting from Villanova University and an MBA from Loyola College.
Shael J. Dolman, Director. Mr. Dolman is a Portfolio Manager at the private equity arm of OTPP. Mr. Dolman joined OTPP in 1997 after working in Commercial and Corporate Banking at a Canadian chartered bank. Mr. Dolman received his Bachelor of Arts from University of Western Ontario and his MBA from McGill University.
Ian D. Highet, Director. Mr. Highet is a Partner at CVC. He joined CVC in 1998 after working in mergers and acquisitions at Primedia (formerly K-III Communications). Mr. Highet received his Bachelor of Arts (cum laude) from Harvard College and his MBA from Harvard Business School. He is a director of Valor Telecommunications, LLC.
James W. Leech, Director. Mr. Leech is a Senior Vice President at the private equity arm of OTPP. He joined OTPP in 2001. Previously, he was President and CEO of InfoCast Corporation, an Application Service Provider in the eLearning and Call Centre businesses, (1999 - 2001); Vice-Chair and Co-Founder of Kasten Chase Applied Research Inc., a data security company (1992 - 2001); and President and CEO of Union Energy Inc., one of North America's largest energy companies (1986 - 1992). From 1979 to 1988, Mr. Leech was President of Unicorp Canada Corporation, one of Canada's first public merchant banks. Mr. Leech graduated from the Royal Military College of Canada with a BSc. (Honours Mathematics and Physics) and holds an MBA from Queen's University. His directorships include Yellow Pages Group, Chemtrade Logistics Inc, Harris Steel Group Inc. and Maple Leaf Sports & Entertainment Ltd.
Dean G. Metcalf, Director. Mr. Metcalf is a Vice President at the private equity arm of OTPP. He joined OTPP in 1991. Previously, he worked in commercial and corporate lending for several years and, in particular, provided acquisition financing for mid-market buyouts. Mr. Metcalf received a BA and MBA from York University. He is a director of Shoppers Drug Mart Corporation, Maple Leaf Sports & Entertainment Ltd. and Yellow Pages Group.
Joseph M. Silvestri, Director. Mr. Silvestri is a Partner at CVC. He joined CVC in 1990 after working at Lamar Companies in private equity investments. Mr. Silvestri received his B.S. from Pennsylvania State University and his MBA from Columbia Business School. He is a director of Euramax International, Inc., MacDermid, Incorporated and The Triumph Group, Inc.
Paul C. Schorr IV, Director. Mr. Schorr is a Managing Partner at CVC. He joined CVC in 1996 after working as a consultant with McKinsey & Company, Inc. Mr. Schorr received his Bachelor of Science in Foreign Service (magna cum laude) from Georgetown University's School of Foreign Service and MBA with Distinction from Harvard Business School. He is a director of AMI Semiconductor Inc., ChipPac Inc. and Fairchild Semiconductor International, Inc.
David F. Thomas, Director. Mr. Thomas is the President of CVC. He joined CVC in 1980. Previously, he held various positions with Citibank's Transportation Finance and Acquisition Finance Groups. Prior to joining Citibank, Mr. Thomas was a certified public accountant with Arthur Andersen & Co. Mr. Thomas received degrees in finance and accounting from the University of Akron. He is a director of Flender GmbH and Winergy AG.
Board Composition
Our largest stockholders have rights to designate members of our board pursuant to the terms of a stockholders agreement. Our board of directors currently consists of nine members, including five
82
designees of CVC, three designees of OTPP, and our President and Chief Executive Officer. These rights of designation will expire when the initial ownership of these stockholders falls below defined ownership thresholds. As described in "Certain Relationships and Related Transactions," the board of directors may not take certain significant actions without the approval of each of CVC and OTPP for so long as such stockholders, and their permitted transferees under the stockholders agreement, hold a defined ownership threshold.
Due to the combined ownership of CVC and OTPP, we will be a "controlled company" under the rules of the New York Stock Exchange. As a result, we will qualify for, and intend to rely on, the "controlled company" exception to the board of directors and committee composition requirements under the rules of the New York Stock Exchange. Pursuant to this exception, we will be exempt from the rules requiring that our board of directors be comprised of a majority of "independent directors" and our human resources and nominating and governance committees be comprised solely of "independent directors" as defined under the rules of the New York Stock Exchange. The "controlled company" exception does not modify the independence requirements for the audit committee and we intend to comply with the Sarbanes-Oxley Act and the New York Stock Exchange independence rules for audit committees.
Board Committees
The board of directors will have an audit committee, a human resources committee and a governance and nominating committee.
The audit committee currently consists of Messrs. Highet, Metcalf and Thomas. Prior to the consummation of this offering, we intend to appoint an independent director to the audit committee to replace one of the current members. Within time periods specified by NYSE Rule 303A, we intend to appoint two other directors to the audit committee, satisfying the independence standards of the New York Stock Exchange and the Sarbanes-Oxley Act, to replace the two remaining members who do not meet these standards. The audit committee will review our financial statements and accounting practices and make recommendations to our board of directors regarding the selection of independent auditors.
The human resources committee of the board of directors consists of Messrs. Leech, Schorr and Silvestri. The human resources committee will make recommendations to the board of directors concerning salaries and incentive compensation for our officers and employees and administer our employee benefit plans.
The governance and nominating committee consists of Messrs. , , and . The governance and nominating committee mandate is to identify qualified individuals to become members of the board, to periodically review and recommend to the board updates to our corporate governance guidelines and to oversee an annual evaluation of the board of directors and its committees.
Compensation of Directors
Directors who are also our employees will not receive compensation for service on our board of directors. Each of our other directors will receive an annual board fee of $40,000, meeting fees, and other normal and customary compensation for their service on our board of directors.
Code of Ethics for Financial Professionals
Our Code of Ethics for Financial Professionals applies to our Chairman, President and Chief Executive Officer and all professionals worldwide serving in a finance, accounting, treasury, tax or investor relations role. The Code of Ethics for Financial Professionals is posted on our Internet website athttp://www.worldspan.com. Any waivers of the application of our Code of Ethics for Financial Professionals to our principal executive officer, principal financial officer, principal accounting officer or controller, or persons
83
performing similar functions will be disclosed promptly on our website. Any amendment of the Code of Ethics for Financial Professionals will also be disclosed promptly on our website.
Compensation of Executive Officers
The following table summarizes compensation awarded or paid by us during 2003, 2002 and 2001 to our current Chief Executive Officer, our former Chief Executive Officer and our four next most highly compensated executive officers.
| | | Annual Compensation | Long-Term Compensation Payouts | | |||||||||||||||
|---|---|---|---|---|---|---|---|---|---|---|---|---|---|---|---|---|---|---|---|
| Name and Principal Position | Year | Salary | Bonus(1) | Other Annual Compensation(2) | Restricted Stock Awards | LTIP Payouts(3) | All Other Compensation(4) | ||||||||||||
| Rakesh Gangwal Chairman, President and Chief Executive Officer | 2003 2002 2001 | $ | 500,000 — — | $ | 500,000 — — | $ | 71,561 — — | $ | 862,500 — — | (5) | — — — | $ | 646,203 — — | ||||||
| Paul J. Blackney Former President and Chief Executive Officer | 2003 2002 2001 | 206,500 401,603 384,519 | 136,500 1,647,870 425,000 | — — — | — — — | 498,462 184,462 345,000 | 6,772,036 3,096 3,225 | ||||||||||||
| Douglas L. Abramson Former Senior Vice President—Legal and Human Resources, General Counsel and Secretary | 2003 2002 2001 | 285,145 273,158 242,281 | 169,398 1,020,128 382,067 | — — — | — — — | 241,965 74,805 152,852 | 2,655,237 4,799 4,770 | ||||||||||||
| Susan J. Powers Senior Vice President—Worldwide Product Solutions | 2003 2002 2001 | 263,501 247,352 219,808 | 216,676 933,099 346,875 | — — — | — — — | 224,115 68,580 138,750 | 2,655,113 4,892 4,696 | ||||||||||||
| Dale Messick Former Senior Vice President and Chief Financial Officer | 2003 2002 2001 | 221,340 207,654 185,617 | 131,797 784,805 292,377 | — — — | — — — | 188,257 57,607 117,001 | 2,653,899 4,293 3,985 | ||||||||||||
| Michael B. Parks Senior Vice President and General Manager—Worldwide Travel Distribution | 2003 2002 2001 | 224,344 222,168 207,108 | 189,916 634,338 103,350 | — — — | — — — | 183,225 17,804 — | 2,652,626 4,716 994 | ||||||||||||
- (1)
- The amounts reported as "Bonus" for 2003, 2002 and 2001 include bonuses paid as executive incentive compensation. The amounts reported as "Bonus" for 2002 include payments on retention bonuses. The amounts reported as "Bonus" for 2002 and 2001 include payments on an equity recognition bonus. The executive incentive compensation bonuses paid for the years ended December 31, 2003, 2002 and 2001, respectively, were as follows: Mr. Gangwal—$500,000, $0 and $0; Mr. Blackney—$136,500, $597,870 and $225,000; Mr. Abramson—$169,398, $359,624 and $134,063; Ms. Powers—$216,676, $333,099 and $121,875; Mr. Messick—$131,797, $279,803 and $102,375 and Mr. Parks—$189,916, $286,218 and $103,350. The retention bonus payments for the year ended December 31, 2002 were as follows: Mr. Blackney $1,050,000; Mr. Abramson—$412,500; Ms. Powers—$375,000; Mr. Messick—$315,000; and Mr. Parks—$348,120. The equity recognition bonuses were earned at the earlier of (i) a change-in-control of the company; (ii) an initial public offering of our common stock; or (iii) June 30, 2001 and entitled the named executive officer to a bonus equal
84
two (2) times his or her salary. See "Certain Relationships and Related Transactions—Management Retention Agreements" for more information on change-in-control provisions. Fifty percent (50%) of the bonus was paid in 2001 and fifty percent (50%) was due to be paid in 2002. The equity recognition bonus payments for the years ended December 31, 2002 and 2001, respectively, were as follows: Mr. Abramson—$248,004 and $248,004; Ms. Powers—$225,000 and $225,000; and Mr. Messick—$190,002 and $190,002. The equity recognition bonuses were awarded based upon continued employment on June 30, 2001 and not due to any change-in-control of the company. In 2001, Mr. Blackney received an additional bonus in the amount of $200,000.
- (2)
- The $71,561 reported as "Other Annual Compensation" for Mr. Gangwal for 2003 consisted of $62,561 of expenses related to Mr. Gangwal's relocation to our headquarters and a car allowance of $9,000. The value of certain perquisites and other personal benefits for the other named executive officers is not included in the amounts disclosed because it did not exceed for any such named executive officer the lesser of $50,000 or 10% of the total annual salary and bonus reported for such named executive officer.
- (3)
- Our long-term executive incentive compensation programs in place for the years ended December 31, 2003, 2002 and 2001 provided for the payment of cash bonuses to our executives based upon the attainment of pre-established performance goals over three-year cycles. At the end of each three-year cycle, provided that the executive remained employed by us through the date of payment, the executive received half of any bonus earned on account of such three-year cycle. The second half of the bonus was paid the following year, again, provided that the executive remained employed by us through the date of payment. In connection with the Acquisition, we made accelerated final payments to Messrs. Blackney, Abramson, Messick and Parks and Ms. Powers for the second half of the bonuses due under the 2000 Long-Term Program. In addition, we made accelerated final payments to Messrs. Blackney, Abramson, Messick and Parks and Ms. Powers of prorated amounts due under our 2001, 2002 and 2003 programs. These final payments were as follows: Mr. Blackney—$498,462; Mr. Abramson—$241,965; Ms. Powers—$224,115; Mr. Messick—$188,257; Mr. Parks—$183,225. Mr. Blackney's bonus for 2002 consisted of $120,000 as payment of the second half of the bonus due to him on account of the three-year cycle ending in 2001 and $64,462 as payment of the first half of the bonus due to him on account of the three-year cycle ending in 2002. Mr. Blackney's bonus for 2001 consisted of $225,000 as payment for the second half of the bonus due to him on account of the three-year cycle ending in 2000 and $120,000 as payment of the first half of the bonus due to him on account of the three-year cycle ending in 2001. Mr. Abramson's bonus for 2002 consisted of $41,250 as payment of the second half of the bonus due to him on account of the three-year cycle ending in 2001 and $33,555 as payment of the first half of the bonus due to him on account of the three-year cycle ending in 2002. Mr. Abramson's bonus for 2001 consisted of $111,602 as payment of the second half of the bonus due to him on account of the three-year cycle ending in 2000 and $41,250 as payment of the first half of the bonus due to him on account of the three-year cycle ending in 2001. Ms. Powers' bonus for 2002 consisted of $37,500 as payment of the second half of the bonus due to her on account of the three-year cycle ending in 2001 and $31,080 as payment of the first half of the bonus due to her on account of the three-year cycle ending in 2002. Ms. Powers' bonus for 2001 consisted of $101,250 as payment for the second half of the bonus due to her on account of the three-year cycle ending in 2000 and $37,500 as payment of the first half of the bonus due to her on account of the three-year cycle ending in 2001. Mr. Messick's bonus for 2002 consisted of $31,500 as payment of the second half of the bonus due to him on account of the three-year cycle ending in 2001 and $26,107 as payment of the first half of the bonus due to him on account of the three-year cycle ending in 2002. Mr. Messick's bonus for 2001 consisted of $85,501 as payment of the second half of the bonus due to him on account of the three-year cycle ending in 2000 and $31,500 as payment of the first half of the bonus due to him on account of the three-year cycle ending in 2001. Mr. Parks' bonus for 2002 consisted of $17,804 as payment of the first half of the bonus due to him on account of the three-year cycle ending in 2002.
- (4)
- Includes (a) the compensation element of our group life insurance program for the years ended December 31, 2003, 2002 and 2001, (b) our contributions to individual 401(k) plan accounts for the years ended December 31, 2003, 2002 and 2001, (c) payments made to Messrs. Blackney, Abramson, Messick and Parks and Ms. Powers in connection with the Acquisition and (d) a payment of $637,500 made to Mr. Gangwal to cover federal, state and local withholding tax requirements relating to the grant of 2,702,500 restricted shares of Common Stock. The compensation element of our group life
85
insurance program for the year ended December 31, 2003, 2002 and 2001 respectively, were as follows: Mr. Gangwal—$1,770, $0 and $0; Mr. Blackney—$1,548, $3,096 and $3,225; Mr. Abramson—$1,999, $1,656 and $1,725; Ms. Powers—$1,861, $1,656 and $1,656; Mr. Messick—$584, $626 and $585; and Mr. Parks—$738, $716 and $703. Our contributions to individual 401(k) plan accounts for the years ended December 31, 2003, 2002 and 2001, respectively, were as follows: Mr. Gangwal—$6,933, $0 and $0; Mr. Abramson—$3,924, $3,143 and $3,045; Ms. Powers—$3,938, $3,236 and $3,040; Mr. Messick—$4,000, $3,667 and $3,400; and Mr. Parks—$2,572, $4,000 and $291. In 2003, pursuant to the terms of his employment agreement, upon his resignation as President and Chief Executive Officer following the closing of the Acquisition, Mr. Blackney received payments totaling $1,473,406 in severance payments and accrued benefits. In 2003, pursuant to the terms of each of their employment agreements, Messrs. Blackney, Abramson, Messick and Parks and Ms. Powers received the following change-in-control payments following the closing of the Acquisition: Mr. Blackney—$5,298,630; Mr. Abramson—$2,649,315; Ms. Powers—$2,649,315; Mr. Messick—$2,649,315 and Mr. Parks—$2,649,315.
- (5)
- On June 30, 2003, Mr. Gangwal was granted 2,702,500 shares of Common Stock. The restricted stock will vest in five equal installments on each of the first five anniversaries of the grant, subject to Mr. Gangwal's continuous employment with us. On December 31, 2003, the shares granted had a value of $862,500. Mr. Gangwal is entitled to any dividends and other distributions paid with respect to our Common Stock; provided that, if the dividend or distribution is paid in shares of our Common Stock or other securities or property, such shares, securities or property shall be subject to the same restrictions as the shares with respect to which they were paid.
Option Grants During Year Ended December 31, 2003
The following table sets forth information regarding stock options granted during the fiscal year 2003 to our executive officers and former executive officers named below:
Option Grants During the Year Ended December 31, 2003
| | | Percentage of Total Options Granted to Employees in 2003(1) | | | Potential Realizable Value at Assumed Annual Rates of Stock Price Appreciation for Option Term(3) | ||||||||||
|---|---|---|---|---|---|---|---|---|---|---|---|---|---|---|---|
| | Number of Securities Underlying Options Granted | | | ||||||||||||
| Name | Exercise Price per Share(2) | Expiration Date | |||||||||||||
| 5% | 10% | ||||||||||||||
| Rakesh Gangwal | 750,000 750,000 | 20.5 20.5 | % | $ | 2.11 7.30 | 6/30/2013 6/30/2013 | $ | 149,895 — | $ | 380,843 — | |||||
| Paul J. Blackney | 0 | 0.0 | — | — | — | — | |||||||||
| Douglas L. Abramson | 0 | 0.0 | — | — | — | — | |||||||||
| Susan J. Powers | 40,000 40,000 | 1.1 1.1 | 2.11 7.30 | 12/31/2013 12/31/2013 | 7,994 — | 20,312 — | |||||||||
| Dale Messick | 40,000 40,000 | 1.1 1.1 | 2.11 7.30 | 8/13/2013 8/13/2013 | 7,994 — | 20,312 — | |||||||||
| Michael B. Parks | 30,000 30,000 | 0.8 0.8 | 2.11 7.30 | 8/13/2013 8/13/2013 | 5,996 — | 15,234 — | |||||||||
- (1)
- Options to purchase a total of 3,660,000 shares of Common Stock were issued in 2003.
- (2)
- The options granted in 2003 consisted of "Series 1" and "Series 2" options. Concurrently with the closing of this offering, the option exercise prices then in effect will be fixed. The Series 1 options held by Messrs. Gangwal, Messick and Parks will be $1.95 per share, and the Series 1 options held by Ms. Powers will be $2.11 per share. The Series 2 options held by Messrs. Gangwal, Messick and Parks will be $7.14 per share, and the Series 2 options held by Ms. Powers will be $7.30 per share. The exercise price per share is given as of December 31, 2003.
- (3)
- As of December 31, 2003. The potential realizable value is calculated based on the term of the option at its time of grant (ten years). It is calculated assuming that the fair market value of our Common Stock on the date of grant appreciates at the indicated annual rate compounded annually for the entire term of the option and that the option is exercised and sold on the last day of its term for the appreciated stock price. The fair market value of our Common Stock on the date of grant was approximately $0.32 per share.
86
Aggregate Option Exercises in 2003 and Year-Ended Values
The following table sets forth information regarding 2003 fiscal year-end option values for each of the executive officers and former executive officers named below:
Aggregated Option Exercises in Last Fiscal Year
and Fiscal Year-End Option Values
| | | | Number of Securities Underlying Unexercised Options at Fiscal Year-End | | | ||||||||
|---|---|---|---|---|---|---|---|---|---|---|---|---|---|
| | | | Value of Unexercised In-the-Money Options at Fiscal Year-End ($) | ||||||||||
| | Number of Shares Acquired on Exercise | | |||||||||||
| Name | Value Realized ($) | ||||||||||||
| Exercisable | Unexercisable | Exercisable | Unexercisable | ||||||||||
| Rakesh Gangwal | — | — | — | 1,500,000 | — | $ | 0 | ||||||
Paul J. Blackney | — | — | — | — | — | — | |||||||
Douglas L. Abramson | — | — | — | — | — | — | |||||||
Susan J. Powers | — | — | — | 80,000 | — | 0 | |||||||
Dale Messick | — | — | — | 80,000 | — | 0 | |||||||
Michael B. Parks | — | — | — | 60,000 | — | 0 | |||||||
Equity Compensation Plan Information
The following table sets forth information as of December 31, 2003 regarding all of our existing compensation plans pursuant to which equity securities are authorized for issuance to employees and non-employee directors.
| Plan Category | Number of securities to be issued upon exercise of outstanding options, warrants and rights | Weighted-average exercise price of outstanding options, warrants and rights(1) | Number of Securities remaining available for future issuance under equity compensation plans (excluding securities reflected in column (a))(2) | |||||
|---|---|---|---|---|---|---|---|---|
| | (a) | (b) | (c) | |||||
| Equity compensation plans approved by security holders | — | — | — | |||||
| Equity compensation plans not approved by security holders | 3,625,000 | $ | 4.71 | 3,921,500 | ||||
| Total | 3,625,000 | $ | 4.71 | 3,921,500 | ||||
- (1)
- As of December 31, 2003.
- (2)
- Consists of options to purchase 2,375,000 shares of our Common Stock and 1,546,500 restricted shares of our Common Stock issuable under our stock incentive plan.
Stock Incentive Plan
Under our stock incentive plan, we offer restricted shares of our Common Stock and grant options to purchase shares of Common Stock to selected management employees. The purpose of the stock incentive plan is to promote our long-term financial success by attracting, retaining and rewarding eligible participants. We have reserved 12,580,000 shares of Common Stock for issuance under the stock incentive plan. After giving effect to issuances of restricted stock and options through March 31, 2004, 189,001 shares of Common Stock are available for issuance as restricted stock under the stock
87
incentive plan and options to purchase 2,213,000 shares of Common Stock may be granted under the stock incentive plan.
The stock incentive plan is administered by the human resources committee. If at any time there is not any human resources committee serving, our board of directors will administer the stock incentive plan. The human resources committee has discretionary authority to determine which employees will be eligible to participate in the stock incentive plan and will consider participants recommended by our President and Chief Executive Officer. The human resources committee will establish the terms and conditions of the restricted stock and options awarded under the stock incentive plan. However, in no event may the exercise price of any options granted or (except for certain initial grants of restricted stock made at the closing of the Acquisition) the purchase price for restricted stock offered under the stock incentive plan be less than the fair market value of the underlying shares on the date of grant.
The stock incentive plan permits us to grant both incentive stock options and non-qualified stock options. The human resources committee will determine the number and type of options granted to each participant, the exercise price of each option, the duration of the options (not to exceed ten years), vesting provisions and all other terms and conditions of such options in individual option agreements. However, the human resources committee will not be permitted to exercise its discretion in any way that will disqualify the stock incentive plan under Section 422 of the Code. The stock incentive plan provides that upon termination of employment with us, unless determined otherwise by the human resources committee at the time options are granted, the exercise period for vested options will generally be limited, provided that vested options will be canceled immediately upon a termination for cause. The stock incentive plan provides for the cancellation of all unvested options upon certain terminations of employment with us, unless determined otherwise by the human resources committee at the time options are granted. We do not have the ability to repurchase options, but shares acquired on exercise may generally be repurchased at our option following termination of employment with us prior to an initial public offering, unless otherwise determined by the human resources committee at the time of grant.
The stock incentive plan also permits us to offer participants restricted stock at a purchase price that is at least equal to the fair market value of a share of Common Stock on the date of purchase (except for certain initial grants of restricted stock made at the closing of the Acquisition). The human resources committee will determine the number of shares of restricted stock offered to each participant, the purchase price of the shares of restricted stock, the period the restricted stock is unvested and subject to forfeiture and all other terms and conditions applicable to such restricted stock in individual restricted stock subscription agreements. The stock incentive plan provides that we may repurchase restricted stock upon a participant's termination of employment, unless determined otherwise by the human resources committee at the time of acquisition. CVC and OTPP may repurchase any restricted stock not repurchased by us, unless otherwise determined by the human resources committee at the time of acquisition. All shares of restricted stock offered, and all shares acquired upon exercise of options granted, under the stock incentive plan will be subject to the stockholders agreement described below under "Certain Relationships and Related Transactions—Stockholders Agreement" and the registration rights agreement described below under "Certain Relationships and Related Transactions—Registration Rights Agreement."
The stock incentive plan provides that upon a change-in-control, unless otherwise determined by the human resources committee in an award agreement, all forfeiture conditions imposed on the restricted stock will lapse, and each outstanding service option and each performance option that is exercisable on or prior to the change-in-control shall be canceled in exchange for a payment in cash of an amount equal to the excess of the change in control price over the option price. Alternatively, unless determined otherwise by the human resources committee in an award agreement, the human resources committee may determine that in the event of a change in control, such restricted stock and
88
options shall be honored or assumed, or new rights substituted therefor by the surviving employer on a substantially similar basis and in accordance with the terms and conditions of the stock incentive plan.
Pension Plans
We sponsor a defined benefit plan, the Worldspan Employees' Pension Plan, or Pension Plan, which is intended to qualify under section 401 of the Internal Revenue Code. The Pension Plan covers U.S. salaried and hourly employees hired before January 1, 2002 who are at least 18 years of age and who have completed at least one year of service. The Pension Plan does not permit any employees hired after December 31, 2001 to participate in the Pension Plan. Effective December 31, 2003, to reduce ongoing pension costs, we froze all further benefit accruals under the Pension Plan. Employees who had already become participants in the Pension Plan will, however, continue to receive vesting credit for their future years of service for purposes of determining vesting of their frozen accrued benefit. Similarly, future service with us will be taken into consideration for purposes of determining a participant's eligibility to receive early retirement and similar benefits which are conditioned on the number of a participant's years of service. However, only years of service and earnings history prior to January 1, 2004, will be considered for determining the amount of accrued benefit. The benefits under this plan are based primarily on years of service and remuneration near retirement. Vesting will occur after an employee has completed five years of service.
The Pension Plan provides normal retirement benefits at age 65 determined generally as 60% of the participant's average monthly compensation for the 60 consecutive calendar months which return the highest average, multiplied by a fraction (not to exceed one) the numerator of which is the participant's years of service and the denominator is 30. The Pension Plan offsets 50% of the employee's social security benefit (or if less 30% of the employee's average monthly compensation) multiplied by a fraction (not to exceed one) the numerator of which is the participant's years of service and the denominator is 30. Under the terms of the Pension Plan, the average monthly compensation of an employee includes only compensation reportable on an IRS Form W-2 and specifically does not include payments from or deferrals to any deferred compensation plan established by Worldspan.
An employee who has reached age 52 and completed at least 10 years of service may elect to retire early with reduced benefits. The normal form of benefit under the Pension Plan for an unmarried participant is a single life annuity and for a married participant is a joint and 50% survivor annuity. Other optional forms of benefit, which provide for actuarially reduced pensions, are also available. Under federal law for 2003, benefits from the Pension Plan are limited to $160,000 per year and may be based only on the first $200,000 of a participant's annual compensation.
Additionally, we sponsor the Worldspan Retirement Benefit Restoration Plan, or Restoration Plan, a non-qualified supplemental pension plan. In addition to other eligible employees, all of the named executive officers other than Mr. Gangwal participate in the Restoration Plan. This plan provides benefits on the same basis as the Pension Plan; however, the executives accrue benefits without regard to the federal limits on benefits and compensation imposed on qualified plans. Certain of our executive officers' management retention agreements provided for the attribution of additional years of service or age in calculating benefits under the Restoration Plan. Additionally, deferrals to a deferred compensation plan established by us are included in calculating the executive's average monthly compensation. All benefits offered under the Restoration Plan will be offset by the benefits the executive receives under the Pension Plan. A rabbi trust arrangement has been established to pay benefits under the Restoration Plan, but participants in the Restoration Plan remain unsecured general creditors of ours. The rabbi trust is currently unfunded. Effective December 31, 2003, to reduce ongoing costs, we froze all further benefit accruals under the Restoration Plan. Employees who had already become participants in the Restoration Plan will, however, continue to receive vesting credit for their future years of service for purposes of determining vesting of their frozen accrued benefit. Similarly, future service with us will be taken into consideration for purposes of determining a
89
participant's eligibility to receive early retirement and similar benefits which are conditioned on the number of a participant's years of service.
For illustration purposes, the following table shows estimated combined maximum annual retirement benefits payable under our Pension Plan and our Restoration Plan to our executive officers who retire at age 65, assuming the executive officers receive their benefit as a single life annuity, without survivor benefits.
| | Years of Service | |||||||||||||||||
|---|---|---|---|---|---|---|---|---|---|---|---|---|---|---|---|---|---|---|
| Final Average Compensation | ||||||||||||||||||
| 5 | 10 | 15 | 20 | 25 | 30 | |||||||||||||
| $150,000 | $ | 13,215 | $ | 26,430 | $ | 39,645 | $ | 52,860 | $ | 66,075 | $ | 79,290 | ||||||
| 200,000 | 18,215 | 36,430 | 54,645 | 72,860 | 91,075 | 109,290 | ||||||||||||
| 250,000 | 23,215 | 46,430 | 69,645 | 92,860 | 116,075 | 139,290 | ||||||||||||
| 300,000 | 28,215 | 56,430 | 84,645 | 112,860 | 141,075 | 169,290 | ||||||||||||
| 350,000 | 33,215 | 66,430 | 99,645 | 132,860 | 166,075 | 199,290 | ||||||||||||
| 400,000 | 38,215 | 76,430 | 114,645 | 152,860 | 191,075 | 229,290 | ||||||||||||
| 500,000 | 48,215 | 96,430 | 144,645 | 192,860 | 241,075 | 289,290 | ||||||||||||
| 600,000 | 58,215 | 116,430 | 174,645 | 232,860 | 291,075 | 349,290 | ||||||||||||
| 700,000 | 68,215 | 136,430 | 204,645 | 272,860 | 341,075 | 409,290 | ||||||||||||
As of December 31, 2003, Messrs. Abramson, Blackney, Messick and Parks and Ms. Powers respectively had 28.75, 2.5, 9.5, 2.5 and 12.25 years of service credited under the Pension Plan.
As of December 31, 2003, the fair market value of the Pension Plan's assets was $164.0 million. Its FAS 87 accumulated benefit obligation, or ABO, was $180.0 million and its projected benefit obligation, or PBO, was $180.0 million. Accordingly, the Pension Plan's ABO exceeded its assets by $16.0 million and its PBO exceeded its assets by $16.0 million.
401(k) Plan
We sponsor a defined contribution plan, the Worldspan Retirement Savings Plan, or 401(k) Plan, intended to qualify under section 401 of the Internal Revenue Code. Substantially all of our U.S. employees are eligible to participate in the 401(k) Plan on the first day of the month in which the employee has attained 18 years of age and 30 days of employment. Employees may make pre-tax contribution of 1% - 20% of their eligible compensation, not to exceed the limits under the Internal Revenue Code. During the year ended December 31, 2003, we matched 50% of the employee contributions, up to a maximum of 4% of the employee's eligible compensation. Effective December 31, 2003, we increased the employer match to 100% of the employee contributions, to a maximum of 5% of each eligible employee's compensation. Employees may direct their investments among various pre-selected investment alternatives. Each employee is at all times 100% vested in his or her benefits under the 401(k) Plan, including the employer match.
We have a Supplemental Savings Program for key management employees designated by us whose contributions are limited under the 401(k) Plan by various provisions of the Internal Revenue Code. This program will provide benefits on the same basis as the 401(k) Plan; however, contributions may be made to the Supplemental Savings Program without regard to the federal limits on compensation and contributions imposed on qualified plans. The employer match offered under the Supplemental Savings Program will apply only to amounts contributed by the executive to the Supplemental Savings Program. This employer match will be fully grossed-up to account for any federal, state or other taxes that may be imposed. All employer and employee contributions to the Supplemental Savings Program will be placed in segregated accounts, in the name of the participant, and will not be subject to our creditors. Accordingly, all contributions will be immediately taxable to each participant, and we will receive a compensation deduction equal to the amount of all such contributions.
90
2003 Executive Incentive Compensation Program
In 2003, we had in place an Executive Incentive Compensation Program, or EICP, that was designed to motivate participants to achieve strategic goals and to attract, reward and retain key executives. The EICP sought to accomplish these goals by allowing eligible employees to receive cash awards by achieving certain pre-established company and individual based goals. The EICP had two components, a short-term incentive program, or 2003 Short-Term Program, and a long-term incentive program, or 2003 Long-Term Program. We also maintained liability for bonuses payable under our 2000, 2001 and 2002 Long-Term Programs, which were substantially similar to the 2003 Long-Term Program. In addition to other eligible employees, all of the named executive officers other than Mr. Gangwal participated in both components of the EICP. The EICP is administered and governed by the members of the Worldspan Board human resources committee and the President and CEO. The administrators of the EICP are referred to in this prospectus as the Governing Committee.
2003 Short-Term Program
The purpose of the 2003 Short-Term Program was to provide eligible employees with an incentive for excellence in individual performance and to promote teamwork among our key employees, which is essential for us to realize our annual business objectives. The 2003 Short-Term Program was designed to accomplish these goals by allowing eligible employees to share in our success by receiving monetary awards upon the attainment of pre-established performance goals. These awards are based upon a percentage of the employee's base salary.
Administration and Implementation. The 2003 Short-Term Program was administered by a committee consisting of the President and CEO, the Senior Vice President and Chief Financial Officer and the Senior Vice President Human Resources, General Counsel and Secretary. These individuals are referred to in this prospectus as the Administrative Committee. The Administrative Committee is responsible for overseeing the day-to-day operation of the 2003 Short-Term Program, as well as the selection of key employees to become participants in the 2003 Short-Term Program.
Eligibility. Certain of our key employees who were recommended by the President and CEO and who were approved by the Administrative Committee were eligible to participate in the 2003 Short-Term Program.
Payment of Awards. Under the terms of their management retention agreements and related deferral agreements, both of which are described in "Management," following the closing of the Acquistion, certain of our executive officers, including each of the named executive officers other than Mr. Gangwal, received accelerated payments of amounts due for the first half of 2003. The remaining payouts under the 2003 Short-Term Program will be made by March 31, 2004 and are not vested until paid. Accordingly, a participant in the 2003 Short-Term Program must be employed on the date bonus payments are made to receive a payment under the 2003 Short-Term Program. However, the Administrative Committee, in its sole discretion may determine that a participant who is not employed on the date of payment may still receive an award. The total payments, including anticipated payments to Ms. Powers and Mr. Parks for the second half of 2003, are reported as "Bonus" in the Summary Compensation Table.
Long-Term Programs
The purpose of our Long-Term Programs was to recognize and encourage the achievement of our long-term business strategies and objectives. The Long-Term Programs sought to accomplish these goals by allowing eligible employees to share in our success by receiving monetary awards upon the attainment of certain pre-established performance goals. The Long-Term Programs were designed to reward participants for our continued success over three-year business cycles. At the end of the three-
91
year cycles, awards, if any, were to be based upon a percentage of the employee's base salary. Only a select group of our key employees who were recommended by the Chairman, President and CEO and who were approved by the Administrative Committee were eligible to participate in our Long-Term Programs. These employees included all employees at the level of vice president and above and certain other employees designated by our senior vice presidents and approved by our Chairman, President and Chief Executive Officer.
Since June 2003, under the terms of their management retention agreements, Messrs. Blackney, Abramson, Messick and Parks and Ms. Powers and certain other executive officers received final payments representing the second half of the bonuses due under the 2000 Long-Term Program and prorated amounts due under the 2001, 2002 and 2003 Long-Term Programs. These final payments are reported as "LTIP Payouts" in the Summary Compensation Table. We intend to terminate the Long-Term Programs for all but one of the other eligible employees and to make final payments for all prorated amounts due as of December 31, 2003 to certain participants. Payouts due to participants under our Long-Term Programs are not vested until paid. Accordingly, a participant in our Long-Term Programs must be employed on the dates bonus payments are made to receive a final payment under the Long-Term Programs. However, the Administrative Committee, in its sole discretion may determine that a participant who is not employed on the date of payment may still receive an award.
Employment Agreements
Rakesh Gangwal. Rakesh Gangwal joined us in June 2003. His employment agreement provides for him to serve as our Chairman, President and Chief Executive Officer for a five year initial term, with such initial term automatically extending for additional one year periods unless written notice is given by either of us prior to the termination date. Under this agreement, Mr. Gangwal will receive an annual base salary of $1,000,000, subject to annual merit increases as determined by our board of directors. Under the agreement, Mr. Gangwal is also eligible for an annual performance bonus, with a target payment of 100% of his base salary, adjusted to reflect the actual performance targets achieved. Under the terms of Mr. Gangwal's employment agreement and a side letter agreement, we are also obligated to pay benefits on the same basis as the Pension Plan, which benefits accrued until December 31, 2003 without regard to the federal limits on benefits and compensation imposed on qualified plans. In calculating these benefits, Mr. Gangwal will be credited with 5.5 years of service, and, consistent with our treatment of the participants in our Pension Plan, his average monthly compensation will be frozen as of December 31, 2003. The employment agreement also provides for the equity opportunities described under "Certain Relationships and Related Transactions."
Upon a change-in-control and a termination of Mr. Gangwal's employment in connection with the change-in-control, he will receive a lump sum payment equal to three times his then current base salary and prior year's performance bonus, and a prorated portion of any performance bonuses and continued participation in our health and welfare benefits plans for 36 months. The agreement provides for tax restoration payments to the extent any of the severance benefits are subject to an excise tax imposed on certain payments made in connection with a change-in-control under the Internal Revenue Code. The agreement also contains a customary non-competition provision lasting two years, a non-solicitation covenant lasting three years and confidentiality covenants. In addition, the agreement provides for reasonable relocation costs or a housing allowance, medical, life and disability insurance and participation in our pension plan (or equivalent benefits). In the event Mr. Gangwal resigns for good reason, as defined in the agreement, or if we terminate his employment for any reason other than for cause, Mr. Gangwal will be entitled to receive base salary for three years and a lump sum payment of a prorated portion of his performance bonus for the year in which he was terminated. In addition, Mr. Gangwal may continue to participate in our health and welfare benefit plans for three years and receive other miscellaneous benefits. In the event of his termination as a result of death or disability, Mr. Gangwal (or his beneficiaries) will be entitled to a lump sum payment of a prorated portion of his
92
performance bonus and continued participation in our group health and welfare benefit plans for 12 months.
M. Gregory O'Hara. Gregory O'Hara joined us in June 2003. His employment agreement provides for him to serve as our Executive Vice President of Corporate Planning and Development for a three year initial term, with such initial term automatically extending for additional one year periods unless written notice is given by either of us prior to the termination date. Under this agreement, Mr. O'Hara will receive an annual base salary of $525,000, subject to annual merit increases as determined by our board of directors. Under the agreement, Mr. O'Hara is also eligible for an annual performance bonus, with a target payment of 70% of his base salary, adjusted to reflect the actual performance targets achieved. The agreement also provides for the equity opportunities described under "Certain Relationships and Related Transactions."
Upon a change-in-control and a termination of Mr. O'Hara's employment in connection with the change-in-control, he will receive a lump sum payment equal to one and one half times his then current base salary and prior year's performance bonus, and a prorated portion of any performance bonus and continued participation in our health and welfare benefit plans for 18 months. The agreement provides for tax restoration payments to the extent any of the severance benefits are subject to an excise tax imposed on certain payments made in connection with a change-in-control under the Internal Revenue Code. The agreement also contains customary non-competition and non-solicitation covenants lasting two years and confidentiality covenants. In addition, the agreement provides for reasonable relocation costs, medical, life and disability insurance and participation in our pension plan (or equivalent benefits). In the event Mr. O'Hara resigns for good reason, as defined in the agreement, or if we terminate his employment for any reason other than for cause, Mr. O'Hara will be entitled to receive base salary for one year and a lump sum payment of a prorated portion of his performance bonus for the year in which he was terminated. In addition, Mr. O'Hara may continue to participate in our health and welfare benefits plans for one year and receive other miscellaneous benefits. In the event of his termination as a result of death or disability, Mr. O'Hara (or his beneficiaries) will be entitled to a lump sum payment of a prorated portion of his performance bonus and continued participation in our health and welfare benefit plans for 12 months.
Ninan Chacko. Ninan Chacko joined us in October 2003. His employment agreement provides for him to serve as our Senior Vice President of Product Planning for a three year initial term, with such initial term automatically extending for additional one year periods unless written notice is given by either of us prior to the termination date. Under this agreement, Mr. Chacko will receive an annual base salary of $300,000, subject to annual merit increases as determined by our board of directors. Mr. Chacko is also eligible for an annual performance bonus, with a target payment of between 40% and 50% of his base salary, adjusted to reflect the actual performance targets achieved. The agreement also provides for the equity opportunities described under "Certain Relationships and Related Transactions." Upon entering into this agreement, Mr. Chacko received a $200,000 signing bonus.
Upon a change-in-control and a termination of Mr. Chacko's employment in connection with the change-in-control, he will receive a lump sum payment equal to one and one half times his then current base salary and prior year's performance bonus, and a prorated portion of any performance bonus and continued participation in our health and welfare benefit plans for 18 months. The agreement provides for tax restoration payments to the extent any of the severance benefits are subject to an excise tax imposed on certain payments made in connection with a change-in-control under the Internal Revenue Code. The agreement also contains customary non-competition and non-solicitation covenants lasting two years and confidentiality covenants. In addition, the agreement provides for reasonable relocation costs, medical, life and disability insurance and participation in our pension plan (or equivalent benefits). In the event Mr. Chacko resigns for good reason, as defined in the agreement, or if we terminate his employment for any reason other than for cause, Mr. Chacko will be entitled to receive base salary for one year and a lump sum payment of a prorated portion of his performance bonus for
93
the year in which he was terminated. In addition, Mr. Chacko may continue to participate in our health and welfare benefits for one year and receive other miscellaneous benefits. In the event of his termination as a result of death or disability, Mr. Chacko (or his beneficiaries) will be entitled to a lump sum payment of a prorated portion of his performance bonus and continued participation in our health and welfare benefit plans for 12 months.
Other Executive Officers. We have entered into new employment agreements with Messrs. Lauderdale, Parks, Smith and Wood and Ms. Powers. The initial term of each of the employment agreements is two years, commencing January 1, 2004 in the case of Messrs. Lauderdale and Parks and Ms. Powers, February 16, 2004 in the case of Mr. Wood and March 8, 2004 in the case of Mr. Smith. In each case, the term of the employment agreement automatically extends for an additional one-year period unless either we or the executive officer gives notice of non-renewal at least 90 days before the end of the employment term. Pursuant to each employment agreement, each executive officer will be eligible for annual bonus compensation in accordance with our bonus program. Each employment agreement contains customary non-competition and non-solicitation covenants, in each case lasting 18 months following the executive's termination of employment and confidentiality and non-disparagement covenants.
Each employment agreement provides that if the executive officer terminates his or her employment for good reason, as defined in the applicable employment agreement, or if we terminate the executive officer's employment without cause, as defined in the applicable employment agreement, the executive officer shall receive severance payments equal to 18 months' base salary and shall continue to receive certain group welfare benefits for 18 months. Each employment agreement also provides that if, within one year following a change in control, as defined in the employment agreement, the executive officer terminates his or her employment for good reason, or if we terminate the executive officer's employment without cause, the executive officer shall be entitled (i) to receive a performance bonus prorated for the portion of the year preceding the change in control, (ii) to receive an amount equal to the sum of the executive officer's base salary plus the bonus received by the executive officer in the preceding year, multiplied by 1.5 and (iii) to continue to receive certain group benefits for 18 months. The employment agreements do not provide for any payments or continued benefits if the executive officer voluntarily resigns or is terminated by us for cause.
Consulting Agreements
Paul J. Blackney. In June 2003, Mr. Blackney, the former President and Chief Executive Officer, entered into a consulting agreement with us that provides for him to consult with the President and Chief Executive Officer, speak at travel industry forums, participate in various sales calls, and other services as requested by us. Under this consulting agreement, Mr. Blackney will be paid an annual retainer of $150,000 and annual living expenses of $60,000. The consulting agreement will continue until June 30, 2004 and is renewable as mutually agreed between Mr. Blackney and us.
Pursuant to his former employment agreement, Mr. Blackney was paid severance payments of 330% of his base salary, 100% of the greater of the forecasted actual level and his target level under the 2003 Short-Term Program and 100% of the greater of the forecasted actual levels and his target levels under each of the 2001, 2002 and 2003 Long-Term Programs. Pursuant to a deferral agreement, Mr. Blackney agreed to defer his receipt of the change-in-control payment equal to $5,000,000 until September 16, 2003 in exchange for an additional $250,000 plus interest for the period from July 7, 2003 through September 16, 2003. In addition, he received any earned but unpaid bonuses under the 2000 Long-Term Program, supplemental retirement benefits, pleasure travel privileges on Delta and Northwest and other miscellaneous benefits. Mr. Blackney's former employment agreement also contains customary non-competition and non-solicitation covenants lasting until June 2005, and confidentiality covenants.
94
Douglas L. Abramson. In connection with his retirement on December 31, 2003, Mr. Abramson, our former Senior Vice President—Human Resources, General Counsel and Secretary, entered into an agreement with us covering consulting services relating to travel technology services, systems, and operations to be provided to us by Mr. Abramson during the period from January 1, 2004 to April 30, 2004. Additionally, Mr. Abramson has represented Worldspan in various meetings with regulatory officials in the U.S., Canada and the E.U. Under this consulting agreement, Mr. Abramson was paid a total of $92,308 in four equal monthly installments for services provided during the term.
Jesse M. Liebman. In connection with his retirement on December 31, 2003, Mr. Liebman, our former Senior Vice President—Strategic Planning, entered into a consulting agreement with us covering services to be provided to us by Mr. Liebman during the period from January 1, 2004 to September 30, 2004. Under this consulting agreement, Mr. Liebman will be paid a total of $213,000 in nine equal monthly installments for services provided during the term.
Dale Messick. Dale Messick, our former Senior Vice President and Chief Financial Officer, has entered into a consulting agreement with us covering services to be provided to us by Mr. Messick during the period from February 16, 2004 to August 31, 2004. Pursuant to this agreement, Mr. Messick will provide consulting services as requested by our President and Chief Executive Officer, including assisting with the transition of our new Senior Vice President and Chief Financial Officer and providing support to us in connection with this offering. Under this consulting agreement, Mr. Messick will be paid a total of $132,300 in seven monthly installments for services provided during the term. Pursuant to the terms of his employment agreement, Mr. Messick is entitled to receive as severance his base salary for a period of 18 months commencing September 1, 2004 and continued participation in our group life insurance, health and dental plans for a period of 18 months commencing February 16, 2004. Additionally, unless his consulting agreement is terminated by us for good cause, 16,000 of Mr. Messick's options to purchase Common Stock will vest and 37,500 of his restricted shares of Common Stock will become unrestricted on or prior to August 31, 2004. At the discretion of our Chief Executive Officer, an additional 16,000 of Mr. Messick's stock options may vest and an additional 37,500 shares of his restricted stock may become unrestricted as of a date of our Chief Executive Officer's choosing.
Human Resources Committee Interlocks and Insider Participation
The human resources committee currently consists of Messrs. Leech, Schorr and Silvestri. None of the members of the human resources committee are currently or have been, at any time since the time of our formation, one of our officers or employees, except that Messrs. Schorr and Silvestri were officers of ours prior to the Acquisition. None of our executive officers currently serve, or in the past has served, as a member of the board of directors or compensation committee of any entity that has one or more executive officers serving on our board of directors or human resources committee.
95
CERTAIN RELATIONSHIPS AND RELATED TRANSACTIONS
Stock Subscription Agreements
On June 30, 2003, we entered into separate stock subscription agreements with CVC (and certain of its affiliates and certain members of its management) and OTPP. CVC (and certain of its affiliates and certain members of its management) purchased shares of Common Stock, at a purchase price of $0.319 per share, and Series A Preferred Stock, at a purchase price of $1,000.00 per share, having an aggregate value of approximately $206.5 million. OTPP purchased shares of Common Stock, Class B Convertible Common Stock and Series A Preferred Stock, at purchase prices of $0.319 per share, $0.319 per share, and $1,000.00 per share respectively, having an aggregate value of approximately $137.7 million. In connection with its stock purchase, OTPP was paid a one-time equity placement fee of approximately $5.8 million, plus reimbursement of costs and expenses related to the Acquisition. In connection with the issuance of shares of Common Stock and Series A Preferred Stock to certain members of our management, we were given the right to repurchase from CVC and OTPP up to an aggregate of 2,452,140 shares of Common Stock and 459.902 shares of Series A Preferred Stock on a pro rata basis at a price equal to the original purchase price. In connection with our sale of approximately $0.8 million of restricted stock to certain of our executive officers in the third and fourth quarters of 2003 and in March of 2004, we have repurchased an aggregate of 2,326,500 shares of Common Stock and 459.902 shares of Series A Preferred Stock from CVC and OTPP.
On June 30, 2003, we entered into separate management stock subscription agreements with Messrs. Blackney, Gangwal, Messick and O'Hara. Mr. Blackney purchased shares of Common Stock and Series A Preferred Stock having an aggregate value of approximately $0.5 million. Mr. Gangwal purchased shares of Common Stock and Series A Preferred Stock having an aggregate value of approximately $1.5 million. Mr. Messick purchased shares of Common Stock and Series A Preferred Stock having an aggregate value of approximately $0.1 million. Under each of these agreements, Common Stock was sold at a purchase price of $0.319 per share and Series A Preferred Stock was sold at a purchase price of $1,000.00 per share. In consideration of Mr. O'Hara's services in connection with the Acquisition, we granted shares of Common Stock and Series A Preferred Stock to Mr. O'Hara having an aggregate value of approximately $1.8 million and also paid Mr. O'Hara an additional $1.0 million to cover taxes associated with the issuance of such shares. Additionally, Mr. O'Hara purchased shares of Common Stock and Series A Preferred Stock, at purchase prices of $0.319 per share and $1,000.00 per share respectively, having an aggregate value of approximately $0.5 million and was granted a one-year option to purchase additional shares of Common Stock and Series A Preferred Stock having an aggregate value of approximately $0.5 million. In March 2004, Mr. O'Hara exercised this option in full. Messrs. Blackney, Gangwal, Messick and O'Hara generally purchased Common Stock and Series A Preferred Stock on the same terms and subject to the same conditions as CVC and OTPP and the shares granted to Mr. O'Hara were granted in the same percentages of Common Stock and Series A Preferred Stock applicable to purchased shares and are otherwise subject to the same conditions as CVC and OTPP. Unlike shares to be purchased by management employees under our stock incentive plan, any shares acquired by Messrs. Blackney, Gangwal, Messick or O'Hara pursuant to these separate management stock subscription agreements are not subject to vesting.
Option and Restricted Stock Grants
Pursuant to our stock incentive plan, on June 30, 2003, we granted to Messrs. Gangwal and O'Hara restricted shares of Common Stock having an aggregate value of approximately $0.9 million and $0.4 million, respectively, and provided them with an additional approximately $0.6 million and $0.2 million, respectively, to cover taxes associated with such grants. In addition, Mr. Messick purchased restricted shares of Common Stock having an aggregate value of approximately $0.1 million on June 30, 2003. In March 2004, we repurchased shares of Common Stock with an aggregate value of approximately $0.05 million from Mr. Messick for a purchase price equal to the price paid by Mr. Messick plus interest from June 30, 2003 to the date of repurchase. In the fall of 2003, we sold restricted shares of Common Stock to certain of our other executive officers for an aggregate purchase
96
price of approximately $0.2 million. In March 2004, we sold restricted shares of Common Stock to Messrs. Chacko, Gangwal, Lauderdale, O'Hara, Smith and Wood and Ms. Powers for an aggregate purchase price of approximately $0.5 million. The restricted stock will vest in five equal installments, subject to the employee's continuous employment with us, and will be subject to the terms and conditions of our stock incentive plan, including our (and CVC and OTPP, if applicable) repurchase rights upon termination of employment. Vesting of the shares granted to Messrs. Gangwal and O'Hara may be accelerated upon certain terminations of their employment, and the repurchase of Mr. Gangwal's vested shares are subject to his prior consent.
From time to time, we expect to grant options pursuant to our stock incentive plan to selected management employees. We expect to grant two series of non-qualified options. The exercise price will be set at a substantial premium above the fair market value of the shares on the grant date, with such exercise price declining annually on the second through the fifth anniversaries of grant to a price equal to the fair market value of the shares on the grant date in the case of one series of options, and to a price equal to a multiple of the fair market value of the shares on the grant date in the case of the other series of options. If all of our Series A Preferred Stock is redeemed or repurchased or is exchanged for Common Stock, the option exercise price then in effect shall remain in effect for the term of the option. Following the Acquisition, options to purchase 1,500,000 and 600,000 shares of Common Stock were granted to Messrs. Gangwal and O'Hara, respectively. After giving effect to issuances of restricted stock and options through March 26, 2004, 189,001 shares of Common Stock are available for issuance as restricted stock under the stock incentive plan and options to purchase 2,185,000 shares of Common Stock may be granted under the stock incentive plan.
Management Retention Agreements
In 2003, we had management retention agreements with the following nine executive officers: Messrs. Abramson, Blackney, Lauderdale, Liebman, Messick, Parks and Sullivan and Ms. McClam-Mitchell and Ms. Powers. In addition to customary non-competition, non-solicitation and confidentiality covenants, the agreements set the participation levels under the EICP for the applicable executive officers. Each of these agreements, other than Mr. Blackney's, were terminated as of December 31, 2003. Mr. Blackney's agreement was terminated as of June 30, 2003.
In anticipation of a sale of Worldspan, our founding airlines included retention bonuses and change-in-control payments in the management retention agreements. Under separate deferral agreements, the executive officers agreed to defer their receipt of the retention bonuses and change-in-control payments due upon the Acquisition until September 19, 2003, in exchange for a 5% increase in the total payments and interest for the period from the date the payments were originally due through the new date of payment. The agreements of Messrs. Abramson, Messick, Parks and Sullivan and Ms. Powers provided for the payment of a retention bonus, equal to 300% of each executive officer's base salary as of June 30, 2002. One-half of this bonus was paid in 2002 and the balance of the bonus was paid on September 19, 2003. In addition, due upon the Acquisition, the agreements entitled all of the executive officers with these retention agreements (other than Ms. McClam-Mitchell) to a change-in-control bonus, ranging individually from $500,000 to $2,500,000. The change-in-control bonuses payable to Messrs. Abramson, Messick, Parks and Sullivan and Ms. Powers were payable in lieu of the second installment of the retention bonuses otherwise payable to these individuals. The retention agreements further provided that, upon the Acquisition, each of the executive officers was entitled to his or her maximum level under the 2003 Short-Term Program and (except in the cases of Mr. Lauderdale and Ms. McClam-Mitchell) the greater of the forecasted actual levels and his or her target levels under each of the Long-Term Programs, in each case, prorated for the portion of the year or EICP period which had passed as of the date of the Acquisition. Pursuant to the purchase agreement, the costs of these retention bonuses and change-in-control payments (other than the 5% premium and interest payable as a result of the deferral) were the responsibility of our founding airlines.
97
Severance Payments
Two of our former executive officers, Ms. McClam-Mitchell and Mr. Sullivan will receive severance payments in accordance with the terms of their employment agreements. The terms of these employment agreements are identical to those described under "Management—Employment Agreements—Other Executive Officers."
Stockholders Agreement
We and our current stockholders, including CVC and OTPP, are parties to a stockholders agreement. After this offering, the stockholders agreement will restrict the transfer of shares of our common stock covered by this agreement. Exceptions to this restriction include transfers to affiliates, transfers for regulatory reasons, transfers for estate planning purposes, transfers by stockholders who own less than 5% of our outstanding common stock and transfers pursuant to registrations rights of the stockholders, in each case so long as any transferee agrees to be bound by the terms of the stockholders agreement. In addition, CVC has "drag-along" rights to cause OTPP and the other stockholders who are parties to the stockholders agreement to sell their shares on a pro rata basis with CVC and/or its affiliates in significant sales to third parties.
Registration Rights Agreement
For a description of registration rights with respect to our common stock, see "Description of Capital Stock."
Advisory Agreements
We are a party to an advisory agreement with CVC Management LLC, or CVC Management, pursuant to which CVC Management may provide financial, advisory and consulting services to us. In exchange for these services, CVC Management is entitled to an annual advisory fee. CVC Management's advisory fee is $0.9 million per year, plus reasonable out-of-pocket expenses. Pursuant to the terms of the advisory agreement with CVC Management, we have the ability concurrently with this offering to calculate the net present value of the advisory fees payable from the time of calculation until the expiration of the ten-year term and to prepay these advisory fees in an amount equal to this net present value calculation. We intend to pay CVC Management $5.3 million within 90 days of the closing of this offering to prepay and terminate the advisory fees effective upon closing of this offering. At the closing of the Acquisition, we paid CVC Management a transaction fee of approximately $8.8 million, plus reasonable out-of-pocket expenses. In addition, CVC Management shall be entitled to a transaction fee in connection with each acquisition, divestiture or financing by us or Worldspan in an amount to be mutually agreed by CVC Management and us and approved by our independent directors, plus reasonable out-of-pocket expenses. The advisory agreement has an initial term of ten years, subject to termination by either party upon written notice 90 days prior to the expiration of the initial term or any extension thereof. There are no minimum levels of service required to be provided pursuant to the advisory agreements. The advisory agreement includes customary indemnification provisions in favor of CVC Management.
We are a party to an advisory agreement with Worldspan pursuant to which we may provide financial, advisory and consulting services to Worldspan. In exchange for these services, we are entitled to an annual advisory fee. Our advisory fee is $1.5 million per year, plus reasonable out-of-pocket expenses. Pursuant to the terms of the advisory agreement with Worldspan, Worldspan has the ability at any time to calculate the net present value of the advisory fees payable from the time of calculation until the expiration of the ten-year term and to prepay these advisory fees in an amount equal to this net present value calculation. At the closing of the Acquisition, we received a transaction fee of approximately $14.6 million, plus reasonable out-of-pocket expenses. In addition, we shall be entitled to a transaction fee in connection with each acquisition, divestiture or financing by us in an amount to be mutually agreed by Worldspan and us, plus reasonable out-of-pocket expenses. The advisory agreement has an initial term of ten years, subject to termination by either party upon written notice 90 days prior to the expiration of the initial term or any extension thereof. There are no minimum levels of service required to be provided pursuant to the advisory agreement. The advisory agreement includes customary indemnification provisions in favor of us.
Purchase of Notes
An affiliate of CVC acquired $30.0 million in principal amount of our senior notes from the initial purchasers. In connection with such acquisition, the initial purchasers did not receive a discount on their purchase of such notes, but we paid CVC's affiliate a placement fee equal to $0.9 million. The senior notes held by this affiliate of CVC may be redeemed in whole or in part in connection with the repurchase of a portion of the senior notes upon the consummation of this offering.
98
PRINCIPAL AND SELLING STOCKHOLDERS
The following table sets forth certain information regarding the beneficial ownership of our common stock, as of , 2004, and as adjusted to give effect to this offering by (i) each person or entity known to us to own more than 5% of any class of our outstanding common stock, (ii) each member of our board of directors and each of our named executive officers and (iii) all of members of our board of directors and all of our executive officers as a group. Our outstanding common stock consists of approximately 83,037,152 shares of Common Stock and 11,000,000 shares of Class B Convertible Common Stock. This table does not include shares of Common Stock issuable upon conversion of Class B Convertible Common Stock. To our knowledge, each of such stockholders have sole voting and investment power as to the stock shown unless otherwise noted. Beneficial ownership of the securities listed in the table has been determined in accordance with the applicable rules and regulation promulgated under the Exchange Act. The numbers shown in the table below assume no exercise by the underwriters of their over-allotment option. The selling stockholders granted the underwriters an option to purchase up to additional shares of Common Stock to cover over-allotments, if any.
| | Common Stock(13) | Class B Convertible Common Stock | | |||||||||||||||
|---|---|---|---|---|---|---|---|---|---|---|---|---|---|---|---|---|---|---|
| | | Without Over-Allotment | With Over-Allotment | | | | | |||||||||||
| | | Percent Beneficially Owned | Percent Beneficially Owned | | | | | |||||||||||
| | | | Percent Beneficially Owned | | ||||||||||||||
| | | | Percent of all common stock after the Offering | |||||||||||||||
| | Number of shares prior to Offering(1) | Before Offering | After Offering | Before Offering | After Offering | Number of shares owned | Before Offering | After Offering | ||||||||||
| Greater than 5% Stockholders: | ||||||||||||||||||
| Citigroup Venture Capital Equity Partners, L.P.(2) 399 Park Avenue, 14th Floor New York, NY 10022 | 50,858,250 | 61.2 | % | 61.2 | % | — | — | |||||||||||
| Ontario Teachers' Pension Plan Board 5650 Yonge Street Toronto, Ontario M2M 4H5 | 23,522,809 | 28.3 | % | 28.3 | % | 11,000,000 | 100% | |||||||||||
| Named Executive Officers and Directors: | ||||||||||||||||||
| Rakesh Gangwal(3)(4) | 3,464,373 | 4.2 | % | 4.2 | % | — | — | |||||||||||
| Paul J. Blackney(5) | 125,640 | * | * | |||||||||||||||
| Douglas L. Abramson(3) | — | — | — | — | — | |||||||||||||
| Susan J. Powers(3) | 194,215 | * | * | — | — | |||||||||||||
| Dale Messick(3) | 106,410 | * | * | — | — | |||||||||||||
| Michael B. Parks(3) | 194,215 | * | * | — | — | |||||||||||||
| M. Gregory O'Hara(3)(6) | 2,208,106 | 2.7 | % | 2.7 | % | — | — | |||||||||||
| Shael J. Dolman(7)(8) | 23,522,809 | 28.3 | % | 28.3 | % | 11,000,000 | 100% | |||||||||||
| Ian D. Highet(2)(9) | 50,883,378 | 61.3 | % | 61.3 | % | — | — | |||||||||||
| James W. Leech(7) | — | — | — | — | — | |||||||||||||
| Dean G. Metcalf(7)(8) | 23,522,809 | 28.3 | % | 28.3 | % | 11,000,000 | 100% | |||||||||||
| Paul C. Schorr IV(2)(9)(10) | 50,895,942 | 61.3 | % | 61.3 | % | — | — | |||||||||||
| Joseph M. Silvestri(2)(9)(11) | 50,921,070 | 61.3 | % | 61.3 | % | — | — | |||||||||||
| David F. Thomas(2)(9) | 50,983,890 | 61.4 | % | 61.4 | % | — | — | |||||||||||
| All executive officers and directors as a group (15 persons)(12) | 82,029,907 | 98.8 | % | 98.8 | % | 11,000,000 | 100% | |||||||||||
- *
- indicates less than 1%
- (1)
- Pursuant to Rule 13d-3 under the Securities Exchange Act of 1934, as amended, a person has beneficial ownership of any securities as to which such person, directly or indirectly, through any contract, arrangement, undertaking, relationship or otherwise has or shares voting power and/or investment power and as to which such person has the right to acquire such voting and/or investment power within 60 days. Percentage of beneficial ownership as to any person as of a particular date is calculated by dividing the number of shares beneficially owned by such person by the sum of the number of shares outstanding as of such date and the number of shares as to which such person has the right to acquire voting and/or investment power within 60 days.
99
- (2)
- Includes 49,901,433 shares of Common Stock held by Citigroup Venture Capital Equity Partners, L.P., 505,984 shares of Common Stock held by CVC/SSB Employee Fund, L.P. and 450,833 shares of Common Stock held by CVC Executive Fund LLC.
- (3)
- The address of each of Mr. Gangwal, Mr. O'Hara, Mr. Abramson, Ms. Powers, Mr. Messick and Mr. Parks is c/o Worldspan, L.P., 300 Galleria Parkway, N.W., Atlanta, Georgia 30339.
- (4)
- Includes 26,255 shares of Common Stock held by Mr. Gangwal as custodian for the benefit of Parul Gangwal under the Virginia Uniform Transfers to Minors Act.
- (5)
- The address of Mr. Blackney is 949 W. Marietta Street, Suite X103, Atlanta, GA 30318.
- (6)
- Includes 125,000 shares of Common Stock held by the O'Hara 2004 Retained Annuity Trust.
- (7)
- The address of each of Mr. Dolman, Mr. Leech and Mr. Metcalf is c/o Ontario Teachers' Pension Plan Board, 5650 Yonge Street, Toronto, Ontario M2M4H5.
- (8)
- Includes 23,522,809 shares of Common Stock and 11,000,000 shares of Class B Convertible Common Stock held by OTPP. Each of Mr. Dolman and Mr. Metcalf may be deemed to have the power to dispose of the shares held by OTPP due to a delegation of authority from the board of directors of OTPP and each expressly disclaims beneficial ownership of such shares.
- (9)
- Each of Mr. Highet, Mr. Schorr, Mr. Silvestri and Mr. Thomas is a member of management of CVC and disclaims beneficial ownership of the shares held by CVC, Court Square Capital Limited, CVC/SSB Employee Fund, L.P. and CVC Executive Fund LLC. The address of each of Mr. Highet, Mr. Schorr, Mr. Silvestri and Mr. Thomas is c/o Citigroup Venture Capital Equity Partners, L.P., 399 Park Avenue, 14th Floor, New York, NY 10022.
- (10)
- Includes 27,692 shares of Common Stock held by BG Partners L.P. and 10,000 shares of Common Stock held by Paul C. Schorr, III as trustee of The Schorr Family Trust, dated December 7, 2001.
- (11)
- Includes 62,820 shares of Common Stock held by Silvestri 2002 Trust.
- (12)
- Does not include 232,050 shares of Common Stock held by Mr. Abramson, Mr. Blackney and Mr. Messick, who are no longer employed by us.
- (13)
- Does not include shares of common stock issuable upon conversion of Series A Preferred Stock. The following table sets forth information with respect to the security ownership of the Series A Preferred Stock. All of the outstanding shares of Series A Preferred Stock are being redeemed for cash in connection with this offering at the public offering.
| | Series A Preferred Stock | ||||
|---|---|---|---|---|---|
| Name of Beneficial Owner | |||||
| Number | Percent | ||||
| Greater than 5% Stockholders: | |||||
| Citigroup Venture Capital Equity Partners, L.P. 399 Park Avenue, 14th Floor New York, NY 10022 | 185,890.152 | 58.0 | % | ||
| Ontario Teachers' Pension Plan Board 5650 Yonge Street Toronto, Ontario M2M 4H5 | 126,186.421 | 39.4 | % | ||
| Named Executive Officers and Directors: | |||||
| Rakesh Gangwal | 1,379.707 | * | |||
| Paul J. Blackney | 459.902 | * | |||
| Douglas L. Abramson | 0 | — | |||
| Susan J. Powers | 0 | — | |||
| Dale Messick | 114.976 | * | |||
| Michael B. Parks | 0 | — | |||
| M. Gregory O'Hara | 2,579.361 | * | |||
| Shael J. Dolman | 126,186.421 | 39.4 | % | ||
| Ian D. Highet | 185,982.132 | 58.1 | % | ||
| James W. Leech | 0 | — | |||
| Dean G. Metcalf | 126,186.421 | 39.4 | % | ||
| Paul C. Schorr IV | 186,028.123 | 58.1 | % | ||
| Joseph M. Silvestri | 186,120.103 | 58.1 | % | ||
| David F. Thomas | 186,350.054 | 58.2 | % | ||
| All executive officers and directors as a group (15 persons) | 316,995.445 | 98.9 | % | ||
100
General Matters
Upon completion of this offering, the total amount of our authorized capital stock will consist of shares of Common Stock and shares of Class B Convertible Common Stock and shares of undesignated preferred stock. After giving effect to this offering and the application of our net proceeds from this offering and the merger with a wholly-owned subsidiary of ours to affect the recapitalization of our capital stock, assuming an initial public offering price of $ per share, the mid-point of the range set forth on the cover of this prospectus, we will have shares of Common Stock, shares of Class B Convertible Common Stock and no shares of preferred stock outstanding. As of March 31, 2004, we had stockholders of record with respect to our common stock. The following summary of provisions of our capital stock describes all material provisions of, but does not purport to be complete and is subject to and qualified in its entirety by, our certificate of incorporation and our bylaws to be effective upon the closing of this offering, which are included as exhibits to the registration statement of which this prospectus forms a part and by the provisions of applicable law.
Common Stock
Our Certificate of Incorporation provides that we may issue shares of Common Stock and shares of Class B Convertible Common Stock. The holders of Common Stock are entitled to one vote of each share held of record on all matters submitted to a vote of the stockholders. The holders of Class B Convertible Common Stock are entitled to one vote of each share held of record on all matters submitted to a vote of the stockholders except the election of directors. All shares of our Common Stock and Class B Convertible Common Stock are entitled to share equally in any dividends our board of directors may declare from legally available sources. Our senior credit facility imposes restrictions on our ability to declare dividends with respect to our common stock.
Preferred Stock
Upon the closing of this offering, the board of directors will be authorized, subject to any limitations imposed by law, without stockholder approval, from time to time to issue up to a total of shares of preferred stock, par value of $0.01 per share, in one or more series, each series to have rights and preferences, including voting rights, dividend rights, conversion rights, redemption privileges and liquidation preferences, as the board of directors may determine. The issuance of preferred stock, while providing desirable flexibility in connection with possible acquisitions and other corporate purposes, could have the effect of making it more difficult for a third party to acquire, or of discouraging a third party from attempting to acquire, a majority of our voting stock outstanding. We have no present plans to issue any shares of preferred stock.
Anti-takeover Provisions
Delaware law and provisions of our charter documents could discourage potential acquisition proposals and could delay, deter or prevent a change in control. The anti-takeover provisions of Delaware law impose various impediments to the ability of a third party to acquire control of us, even if a change in control would be beneficial to our existing stockholders. However, we have elected not to be governed by Section 203 of Delaware law, which means that we have elected not to take advantage of anti-takeover protection related to transactions with interested stockholders.
Registration Rights
CVC and certain of its affiliates, OTPP, and the other parties to the stockholders agreement are parties to a registration rights agreement. Pursuant to the registration rights agreement, upon the
101
written request of CVC or OTPP following this offering, we have agreed to (subject to customary exceptions) on one or more occasions prepare and file a registration statement with the SEC concerning the distribution of all or part of the shares of our common stock held by CVC and certain of its affiliates or OTPP, as the case may be, and use our best efforts to cause the registration statement to become effective. Subject to certain exceptions, if at any time we file a registration statement for our common stock pursuant to a request by CVC, OTPP or otherwise, we will use our best efforts to allow the other parties to the registration rights agreement to have their shares of common stock (or a portion of their shares under specified circumstances) included in the offering of common stock if the registration form proposed to be used may be used to register the shares. These rights do not apply in connection with this offering. Registration expenses of the selling stockholders (other than underwriting discounts and commissions and transfer taxes applicable to the shares sold by such stockholders or the fees and expenses of any accountants or other representatives retained by a selling stockholder) will be paid by us. We have agreed to indemnify the stockholders against certain customary liabilities in connection with any registration. In addition, each stockholder has agreed to not sell any shares of common stock within seven days prior to and ninety days after the effective date of any registration statement registering our equity securities (other than a registration on Form S-4, Form S-8 or any successor form), except as part of such registration or unless the underwriters managing the registration agree otherwise.
Listing
We intend to apply to list our Common Stock on the New York Stock Exchange under the symbol "WS".
Transfer Agent and Registrar
The transfer agent and registrar for our Common Stock is EquiServe Trust Company, N.A., and its telephone number is (816) 843-4299.
102
SHARES ELIGIBLE FOR FUTURE SALE
Prior to this offering, there was no market for our Common Stock. We can make no predictions as to the effect, if any, that sales of shares or the availability of shares for sale will have on the market price prevailing from time to time. Nevertheless, sales of significant amounts of our common stock in the public market, or the perception that those sales may occur, could adversely affect prevailing market prices and impair our future ability to raise capital through the sale of our equity at a time and price we deem appropriate.
Upon completion of this offering, we will have shares of common stock outstanding, which includes shares of Common Stock and shares of Class B Convertible Common Stock. In addition, shares of Common Stock are issuable upon the exercise of stock options. All shares of Common Stock sold in this offering will be freely tradeable without restriction or further registration under the Securities Act.
Of the remaining shares of common stock, shares were issued and sold by us in reliance on exemptions from the registration requirements of the Securities Act. A portion of these shares will be subject to lock-up agreements, described below, on the date of this prospectus. Upon the expiration of the lock-up agreements, shares will become eligible for sale pursuant to Rule 144, Rule 144(k) and Rule 701.
Rule 144
In general, under Rule 144 as currently in effect, an affiliate of our company will be entitled to sell in the public market a number of shares within any three-month period that does not exceed the greater of 1% of the then outstanding shares of the common stock or the average weekly reported volume of trading of the Common Stock on the New York Stock Exchange during the four calendar weeks preceding the sale. The holder may sell those shares only through "brokers' transactions" or in transactions directly with a "market maker," as those terms are defined in Rule 144. Sales under Rule 144 are also subject to requirements regarding providing notice of those sales and the availability of current public information concerning us.
Registration on Form S-8
We intend to file registration statements on Form S-8 under the Securities Act of 1933 to register shares of common stock issuable under our stock incentive plan. These registration statements will be filed following the effective date of the registration statement of which this prospectus forms a part and will be effective upon filing. Shares issued upon the exercise of stock options or pursuant to our stock incentive plan after the effective date of the Form S-8 registration statements will be eligible for resale in the public market without restriction, subject to Rule 144 limitations applicable to affiliates and the lock-up agreements described below.
Lock-Up Agreements
We have agreed that we will not offer, sell, contract to sell, pledge or otherwise dispose of, directly or indirectly, or file with the SEC a registration statement under the Securities Act relating to, any shares of our common stock or securities convertible into or exchangeable or exercisable for any shares of our common stock, or publicly disclose the intention to make any offer, sale, pledge, disposition or filing, without the prior written consent of Lehman Brothers Inc. and J.P. Morgan Securities Inc., on behalf of the underwriters, for a period of 180 days after the date of this prospectus except for the issuance of shares upon exercise of outstanding options.
Our officers and certain of our directors and holders of our common stock, who in the aggregate represent approximately % of our outstanding shares of common stock as of , 2004, have agreed that they will not offer for sale, sell, pledge or otherwise dispose of (or enter into any
103
transaction or device that is designed to, or could be expected to, result in the disposition by any person at any time in the future of) any shares of common stock (including, without limitation, shares of common stock that may be deemed to be beneficially owned by them in accordance with the rules and regulations of the SEC and shares of common stock that may be issued upon exercise of any option or warrant) or securities convertible into or exchangeable for common stock (other than the shares in this offering) owned by the undersigned on the date of execution of the lock-up agreement or on the date of the completion of this offering, or (2) enter into any swap or other derivatives transaction that transfers to another, in whole or in part, any of the economic benefits or risks of ownership of such shares of common stock, without, in each case, the prior written consent of Lehman Brothers Inc. and J.P. Morgan Securities Inc., on behalf of the underwriters, for a period of 180 days after the date of this prospectus. These restrictions do not apply with respect to shares to be sold pursuant to the exercise, if any, of the over-allotment option, bona fide gifts, intra-family transfers or transfers to trusts and other family entities for estate planning, so long as, in each case, the transferee agrees to be bound by these restrictions.
The underwriters have advised us that they have no present intention to release any shares subject to the lock-up agreements prior to the date set forth in the agreements. However, Lehman Brothers Inc. and J.P. Morgan Securities Inc., in their sole discretion, on behalf of the underwriters, may release the shares subject to the lock-up agreements in whole or in part at anytime with or without notice. When determining whether or not to release shares from the lock-up agreements, Lehman Brothers Inc. and J.P. Morgan Securities Inc. will consider, among other factors, the shareholder's reasons for requesting the release, the number of shares for which the release is being requested and market conditions at the time.
Registration Rights
For a description of registration rights with respect to our common stock, see "Description of Capital Stock."
104
MATERIAL UNITED STATES TAX CONSEQUENCES TO NON-U.S. HOLDERS OF COMMON STOCK
The following discussion summarizes certain U.S. federal income and estate tax consequences of the ownership and disposition of Common Stock by "Non-U.S. holders." You are a "Non-U.S. holder" for U.S. federal income tax purposes if you are:
- •
- a non-resident alien individual,
- •
- a foreign corporation,
- •
- a foreign partnership or other foreign entity treated as a partnership for U.S. federal income tax purposes,
- •
- an estate the income of which is not subject to U.S. federal income tax on a net income basis, or
- •
- a foreign trust, which is any trust if (a) a U.S. court is not able to exercise primary jurisdiction over its administration, and (b) one or more U.S. persons do not have the authority to control all of its substantial decisions.
- •
- if you are a partner in a partnership holding common stock, your tax treatment will generally depend on your tax status and upon the activities of the partnership. If you are a partner in a partnership holding common stock you should consult your own tax advisors.
This discussion only applies if the Common Stock is held as a capital asset. This discussion does not consider the specific facts and circumstances that may be relevant to particular holders (including, but not limited to, banks, financial institutions, U.S. expatriates, insurance companies, dealers in securities or currencies, traders in securities, partnerships or other pass-through entities, tax-exempt organizations and persons holding the common stock as part of a "straddle," "hedge," "conversion transaction" or other integrated transaction) and does not address the treatment of holders of Common Stock under the laws of any state, local or foreign taxing jurisdiction. This discussion is based on the tax laws of the U.S., including the Internal Revenue Code, as amended to the date hereof, existing and proposed regulations thereunder, and administrative and judicial interpretation thereof, all as currently in effect. These laws are subject to change, possibly on a retroactive basis.
You should consult your own tax advisors with regard to the application of the U.S. federal income tax laws to your particular situation, as well as to the applicability and effect of any state, local or foreign tax laws to which you may be subject.
Dividends
Distributions on our Common Stock will constitute dividends to the extent of our current or accumulated earnings and profits as determined for U.S. federal income tax purposes.
If you are a Non-U.S. holder of our Common Stock, dividends paid to you are subject to withholding of U.S. federal income tax at a 30% rate or at a lower rate if so provided in an applicable tax treaty. You will be required to provide an IRS Form W-8BEN to claim tax treaty benefits. Except to the extent otherwise provided under an applicable tax treaty, you generally will be taxed in the same manner as a U.S. holder on dividends paid that are effectively connected with your conduct of a trade or business in the U.S. Dividends that are effectively connected with your conduct of a trade or business in the U.S. will be exempt from the 30% withholding tax discussed above provided that you provide an IRS Form W-8FCI.
Effectively connected dividends received by a corporate Non-U.S. holder may, under certain circumstances, be subject to an additional "branch profits tax" at a 30% rate or at a lower rate if so specified in an applicable tax treaty.
105
Gain on Disposition of Common Stock
If you are a Non-U.S. holder you generally will not be subject to U.S. federal income tax on gain recognized on a disposition of Common Stock unless:
- •
- the gain is effectively connected with your conduct of a trade or business in the U.S.;
- •
- you are an individual, you hold the Common Stock as a capital asset and you are present in the U.S. for 183 or more days in the taxable year of the sale and certain other conditions exist; or
- •
- we are or have been a "United States real property holding corporation" for U.S. federal income tax purposes and at any time, you held, directly or indirectly, more than 5% of our Common Stock during the five-year period ending on the date of your disposition. We have not been, are not, and do not anticipate becoming a "United States real property holding corporation" for federal income tax purposes.
Effectively connected gains recognized by a corporate Non-U.S. holder may also, under certain circumstances, be subject to an additional "branch profits tax" at a 30% rate or at a lower rate if so specified in an applicable tax treaty.
Federal Estate Taxes
Common Stock held by an individual Non-U.S. holder at the time of death will be included in the holder's gross estate for U.S. federal estate tax purposes and may be subject to U.S. federal estate taxes, unless an applicable tax treaty provides otherwise. The U.S. federal estate tax was recently repealed; however, the repeal does not take effect until 2010. In addition, the legislation repealing the estate tax expires in 2011, and thus the estate tax will be reinstated in 2011 unless future legislation extends the repeal.
Information Reporting and Backup Withholding
U.S. backup withholding tax will not apply to dividends paid on our Common Stock to a Non-U.S. holder, provided the Non-U.S. holder certifies its Non-U.S. status under penalties of perjury on an IRS Form W-8BEN or otherwise establishes an exemption. Dividends paid on our common shares to a Non-U.S. holder will, however, be reported to the IRS and to such Non-U.S. holder on Form 1042-S.
Information reporting and backup withholding generally will not apply to a payment of the proceeds of a sale of Common Stock effected outside the U.S. by a foreign office of a foreign broker. However, information reporting requirements (but not backup withholding) will apply to a payment of the proceeds of a sale of common stock effected outside the U.S. by a foreign office of a broker if the broker (i) is a U.S. person, (ii) derives 50 percent or more of its gross income for certain periods from the conduct of a trade or business in the U.S., (iii) is a "controlled foreign corporation" for U.S. federal income tax purposes, or (iv) is a foreign partnership that, at any time during its taxable year is 50 percent or more (by income or capital interest) owned by U.S. persons or is engaged in the conduct of a U.S. trade or business, unless in any such case the broker has documentary evidence in its records that the holder is a Non-U.S. holder and certain conditions are met, or the holder otherwise establishes an exemption. Payment of the proceeds of a sale of common stock by a U.S. office of a broker will be subject to both backup withholding and information reporting unless the holder certifies its non-U.S. status under penalties of perjury or otherwise establishes an exemption.
Any amounts withheld under the backup withholding rules may be allowed as a refund or a credit against that holder's U.S. federal income tax liability provided the required information is timely furnished to the IRS.
106
Under the terms of an underwriting agreement, which is filed as an exhibit to the registration statement relating to this prospectus, each of the underwriters named below, for whom Lehman Brothers Inc., J.P. Morgan Securities Inc., (Lehman Brothers Inc. and J.P. Morgan Securities Inc. acting as joint book-running managers) Goldman, Sachs & Co., UBS Securities LLC, CIBC World Markets Corp. and RBC Capital Markets Corporation are acting as representatives, have severally agreed to purchase from us the respective number of shares of Common Stock opposite their names below:
| Underwriters | Number of Shares | ||
|---|---|---|---|
| Lehman Brothers Inc. | |||
| J.P. Morgan Securities Inc. | |||
| Goldman, Sachs & Co. | |||
| UBS Securities LLC | |||
| CIBC World Markets Corp. | |||
| RBC Capital Markets Corporation | |||
Total | |||
The underwriting agreement provides that the underwriters' obligation to purchase shares of our Common Stock depends on the satisfaction of the conditions contained in the underwriting agreement including:
- •
- the obligation to purchase all of the shares of Common Stock offered hereby, if any of the shares are purchased;
- •
- the representations and warranties made by us and the selling stockholders to the underwriters are true;
- •
- there is no material change in the financial markets; and
- •
- we and the selling stockholders deliver customary closing documents to the underwriters.
Commissions and Expenses:
The following table summarizes the underwriting discounts and commissions we and the selling stockholders will pay to the underwriters. These amounts are shown assuming both no exercise and full exercise of the underwriters' over-allotment option to purchase additional shares. The underwriting fee is the difference between the initial price to the public and the amount the underwriters pay to us and the selling stockholders for the shares.
| | No Exercise | Full Exercise | ||||
|---|---|---|---|---|---|---|
| Per share | $ | $ | ||||
Total | $ | $ | ||||
The representatives of the underwriters have advised us that the underwriters propose to offer shares of Common Stock directly to the public at the public offering price on the cover of this prospectus and to selected dealers, who may include the underwriters, at the public offering price less a selling concession not in excess of $ per share. The underwriters may allow, and the selected dealers may re-allow, a discount from the concession not in excess of $ per share to other dealers. After the offering, the underwriters may change the public offering price and other offering terms.
The expenses of the offering, excluding underwriting discounts and commissions, that are payable by us are estimated to be $ . We have agreed to pay expenses incurred by the selling stockholders in connection with the offering, other than the underwriting discounts and commissions.
107
Over-Allotment Option
The selling stockholders have granted the underwriters an option to purchase up to an aggregate of additional shares of Common Stock, exercisable to cover over-allotments, if any, at the public offering price less the underwriting discounts and commissions shown on the cover page of this prospectus. The underwriters may exercise this option on one occasion until 45 days after the date of the underwriting agreement. To the extent the underwriters exercise this option, each underwriter will be committed, so long as the conditions of the underwriting agreement are satisfied, to purchase a number of additional shares of common stock proportionate to that underwriter's initial commitment as indicated in the preceding table, and the selling stockholders will be obligated to sell the additional shares of Common Stock to the underwriters.
Lock-Up Agreements
We, our officers and certain of our directors and holders of our common stock, who in the aggregate represent approximately % of our outstanding shares of common stock as of , 2004, have agreed not to offer to sell, sell or otherwise dispose of, directly or indirectly, any shares of capital stock or any securities that may be converted into or exchanged for any shares of capital stock for a period of 180 days from the date of this prospectus without the prior written consent of Lehman Brothers Inc. and J.P. Morgan Securities Inc., except that we may issue and grant options to purchase shares of common stock under our option plans and except for the other exceptions summarized under "Shares Eligible For Future Sale—Lock-Up Agreements."
Offering Price Determination
Prior to this offering, there has been no public market for our Common Stock. The initial public offering price will be negotiated between the representatives and us. In determining the initial public offering price of our Common Stock, the representatives will consider:
- •
- prevailing market conditions;
- •
- the stage of our product development efforts;
- •
- estimates of our business potential and earnings prospects;
- •
- our historical performance and capital structure;
- •
- an overall assessment of our management; and
- •
- the consideration of these factors in relation to market valuation of companies in related businesses.
Indemnification
We and the selling stockholders have agreed to indemnify the underwriters against certain liabilities, including liabilities under the Securities Act, liabilities arising from breaches of the representations and warranties contained in the underwriting agreement and liabilities incurred in connection with the directed share program referred to below, and to contribute to payments that the underwriters may be required to make for these liabilities.
Discretionary Shares
The underwriters have informed us that they do not intend to sell to discretionary accounts shares in excess of 5% of the total number of shares of our Common Stock offered by them.
108
Stabilization, Short Positions and Penalty Bids
The underwriters may engage in over-allotment, stabilizing transactions, syndicate covering transactions and penalty bids or purchases for the purpose of pegging, fixing or maintaining the price of our Common Stock, in accordance with Regulation M under the Exchange Act of 1934:
- •
- Over-allotment involves sales by the underwriters of shares in excess of the number of shares the underwriters are obligated to purchase, which creates a syndicate short position. The short position may be either a covered short position or a naked short position. In a covered short position, the number of shares over-allotted by the underwriters is not greater than the number of shares that they may purchase in the over-allotment option. In a naked short position, the number of shares involved is greater than the number of shares in the over-allotment option. The underwriters may close out any short position by either exercising their over-allotment option and/or purchasing shares in the open market.
- •
- Stabilizing transactions permit bids to purchase the underlying security so long as the stabilizing bids do not exceed a specified maximum.
- •
- Syndicate covering transactions involve purchases of the Common Stock in the open market after the distribution has been completed in order to cover syndicate short positions. In determining the source of shares to close out the short position, the underwriters will consider, among other things, the price of shares available for purchase in the open market as compared to the price at which they may purchase shares through the over-allotment option. If the underwriters sell more shares than could be covered by the over-allotment option, a naked short position, the position can only be closed out by buying shares in the open market. A naked short position is more likely to be created if the underwriters are concerned that there could be downward pressure on the price of the shares in the open market after pricing that could adversely affect investors who purchase in the offering.
- •
- Penalty bids permit the representatives to reclaim a selling concession from a syndicate member when the common stock originally sold by the syndicate member is purchased in a stabilizing or syndicate covering transaction to cover syndicate short positions.
These stabilizing transactions, syndicate covering transactions and penalty bids may have the effect of raising or maintaining the market price of our Common Stock or preventing or retarding a decline in the market price of our common stock. As a result, the price of our common stock may be higher than the price that might otherwise exist in the open market. These transactions may be effected on the New York Stock Exchange or otherwise and, if commenced, may be discontinued at any time.
Neither we nor any of the underwriters make any representation or prediction as to the direction or magnitude of any effect that the transactions described above may have on the price of the Common Stock. In addition, neither we nor any of the underwriters make any representation that the underwriters will engage in these stabilizing transactions or that any transaction, once commenced, will not be discontinued without notice.
Electronic Distribution
A prospectus in electronic format may be made available on the Internet sites or through other online services maintained by one or more of the underwriters and/or selling group members participating in this offering, or by their affiliates. In those cases, prospective investors may view offering terms online and, depending upon the particular underwriter or selling group member, prospective investors may be allowed to place orders online. The underwriters may agree with us to allocate a specific number of shares for sale to online brokerage account holders. Any such allocation for online distributions will be made by the representatives on the same basis as other allocations.
109
Other than the prospectus in electronic format, the information on any underwriter's or selling group member's web site and any information contained in any other web site maintained by an underwriter or selling group member is not part of the prospectus or the registration statement of which this prospectus forms a part, has not been approved and/or endorsed by us or any underwriter or selling group member in its capacity as underwriter or selling group member and should not be relied upon by investors.
Stamp Taxes
If you purchase shares of Common Stock offered in this prospectus, you may be required to pay stamp taxes and other charges under the laws and practices of the country of purchase, in addition to the offering price listed on the cover page of this prospectus. Accordingly, we urge you to consult a tax advisor with respect to whether you may be required to pay those taxes or charges, as well as any other tax consequences that may arise under the laws of the country of purchase.
Directed Share Program
At our request, the underwriters have reserved for sale at the initial public offering price up to shares offered hereby for officers, directors, employees and certain other persons associated with us. The number of shares available for sale to the general public will be reduced to the extent such persons purchase such reserved shares. Any reserved shares not so purchased will be offered by the underwriters to the general public on the same basis as the other shares offered hereby.
Relationships
Certain of the underwriters and their affiliates have in the past and may in the future perform investment banking and advisory services for us from time to time for which they have received or will receive customary fees and expenses. The underwriters may, from time to time, engage in transactions with or perform services for us in the ordinary course of their business. In particular, affiliates of some of the underwriters act as the administrative agent and lender under our existing senior credit facility and will act as administrative agent and lender under our new senior credit facility.
Offers and Sales in Canada
This prospectus is not, and under no circumstances is to be construed as, an advertisement or a public offering of shares in Canada or any province or territory thereof. Any offer or sale of shares in Canada will be made only under an exemption from the requirements to file a prospectus with the relevant Canadian securities regulators and only by a dealer properly registered under applicable provincial securities laws or, alternatively, pursuant to an exemption from the dealer registration requirement in the relevant province or territory of Canada in which such offer or sale is made.
Offers and Sales in the United Kingdom
Each underwriter has represented, warranted and agreed that: (i) it has not offered or sold and, prior to the expiry of a period of six months from the closing date of this offering, will not offer or sell any shares to persons in the United Kingdom except to persons whose ordinary activities involve them in acquiring, holding, managing or disposing of investments (as principal or agent) for the purposes of their businesses or otherwise in circumstances which have not resulted and will not result in an offer to the public in the United Kingdom within the meaning of the Public Offers of Securities Regulation 1995; (ii) it has only communicated or caused to be communicated and will only communicate or cause to be communicated any invitation or inducement to engage in investment activity (within the meaning of section 21 of the Financial Services and Markets Act 2000 ("FSMA")) received by it in connection with the issue or sale of any shares in circumstances in which section 21(1) of the FSMA does not apply to WTI; and (iii) it has complied and will comply with all applicable provisions of the FSMA with respect to anything done by it in relation to the shares in, from or otherwise involving the United Kingdom.
110
Offers and Sales in the Netherlands
The shares may not be offered or sold, transferred or delivered, as part of their initial distribution or at any time thereafter, directly or indirectly, to any individual or legal entity in the Netherlands other than to individuals or legal entities who or which trade or invest in securities in the conduct of their profession or trade, which includes banks, securities intermediaries, insurance companies, pension funds, other institutional investors and commercial enterprises which, as an ancillary activity, regularly trade or invest in securities.
The validity of the securities offered hereby will be passed upon for us by Dechert LLP, Philadelphia, Pennsylvania. Certain legal matters related to this offering will be passed upon for the underwriters by Latham & Watkins LLP, New York, New York.
The consolidated financial statements as of December 31, 2002 and 2003 and for each of the two years in the period ended December 31, 2002, for the six months ended June 30, 2003 and for the six months ended December 31, 2003 included in this Prospectus have been so included in reliance on the reports of PricewaterhouseCoopers LLP, independent accountants, given on the authority of said firm as experts in auditing and accounting.
WHERE YOU CAN FIND MORE INFORMATION
We have filed with the SEC a registration statement on Form S-1, which we refer to as the registration statement and which term shall encompass all amendments, exhibits, annexes and schedules to said registration statement, under the Securities Act and the rules and regulations promulgated under the Securities Act, with respect to the shares of our common stock. This prospectus, which constitutes a part of the registration statement, does not contain all the information set forth in the registration statement, parts of which are omitted in compliance with the rules and regulations of the SEC. For further information with respect to us and our common stock, reference is made to the registration statement. Statements made in this prospectus as to the contents of any contract, agreement or other document referred to are not necessarily complete. With respect to each contract, agreement or other document filed as an exhibit to the registration statement, reference is made to the exhibit for a more complete description of the document or matter involved and each of these statements shall be deemed qualified in its entirety by this reference.
The registration statement, including the exhibits thereto, can be inspected and copied at the public reference facilities maintained by the SEC at Room 1024, 450 Fifth Street, N.W., Washington, D.C. 20549 (telephone number: 1-800-SEC-0330). Copies of these materials can be obtained from the Public Reference Section of the SEC at 450 Fifth Street, N.W., Washington, D.C. 20549, at prescribed rates. The SEC maintains a website that contains reports, proxy and information statements and other information regarding registrants that file electronically with the SEC. The address of the site is http://www.sec.gov.
We are currently subject to the informational requirements of the Securities Exchange Act of 1934 and, consequently, are required to file periodic reports and other information with the SEC. The reports and other information filed by us with the SEC may be inspected and copied at the public reference facilities maintained by the SEC as described above. These reports and such other information do not constitute part of this prospectus.
We intend to furnish our stockholders with annual reports containing financial statements audited by an independent accounting firm and to make available quarterly reports containing unaudited financial information for the first three quarters of each year.
111
INDEX TO CONSOLIDATED FINANCIAL STATEMENTS
| | Page | |
|---|---|---|
| Worldspan Technologies Inc. | ||
Reports of Independent Auditors | F-2 | |
| Consolidated Balance Sheets | F-4 | |
| Consolidated Statements of Operations | F-5 | |
| Consolidated Statements of Partners' Capital | F-6 | |
| Consolidated Statement of Stockholders' Deficit | F-7 | |
| Consolidated Statements of Cash Flows | F-8 | |
| Notes to Consolidated Financial Statements | F-9 |
F-1
Report of Independent Auditors
To the Board of Directors and
Stockholders of Worldspan Technologies Inc.:
In our opinion, the accompanying consolidated balance sheet and the related consolidated statements of operations, partners' capital and cash flows present fairly, in all material respects, the financial position of Worldspan, L.P. and its subsidiaries (predecessor company to Worldspan Technologies Inc.) (the "Partnership") at December 31, 2002, and the results of their operations and their cash flows for each of the two years in the period ended December 31, 2002, and the results of their operations and their cash flows for the six months ended June 30, 2003, in conformity with accounting principles generally accepted in the United States of America. In addition, in our opinion, the financial statement schedule presents fairly, in all material respects, the information set forth therein when read in conjunction with the related consolidated financial statements. These financial statements are the responsibility of the Partnership's management; our responsibility is to express an opinion on these financial statements based on our audits. We conducted our audits of these statements in accordance with auditing standards generally accepted in the United States of America, which require that we plan and perform the audit to obtain reasonable assurance about whether the financial statements are free of material misstatement. An audit includes examining, on a test basis, evidence supporting the amounts and disclosures in the financial statements, assessing the accounting principles used and significant estimates made by management, and evaluating the overall financial statement presentation. We believe that our audits provide a reasonable basis for our opinion.
/S/ PRICEWATERHOUSECOOPERS LLP
March 26, 2004
Atlanta, Georgia
F-2
Report of Independent Auditors
To the Board of Directors and
Stockholders of Worldspan Technologies Inc.:
In our opinion, the accompanying consolidated balance sheet and the related consolidated statement of operations, stockholders' deficit and cash flows present fairly, in all material respects, the financial position of Worldspan Technologies Inc. and its subsidiaries (the "Company") at December 31, 2003, and the results of their operations and their cash flows for the six months ended December 31, 2003, in conformity with accounting principles generally accepted in the United States of America. In addition, in our opinion, the financial statement schedule presents fairly, in all material respects, the information set forth therein when read in conjunction with the related consolidated financial statements. These financial statements are the responsibility of the Company's management; our responsibility is to express an opinion on these financial statements based on our audit. We conducted our audit of these statements in accordance with auditing standards generally accepted in the United States of America, which require that we plan and perform the audit to obtain reasonable assurance about whether the financial statements are free of material misstatement. An audit includes examining, on a test basis, evidence supporting the amounts and disclosures in the financial statements, assessing the accounting principles used and significant estimates made by management, and evaluating the overall financial statement presentation. We believe that our audit provides a reasonable basis for our opinion.
/S/ PRICEWATERHOUSECOOPERS LLP
March 26, 2004
Atlanta, Georgia
F-3
Worldspan Technologies Inc.
Consolidated Balance Sheets
(in thousands, except per share data)
| | Predecessor Basis | Successor Basis | ||||||||||
|---|---|---|---|---|---|---|---|---|---|---|---|---|
| | December 31, 2002 | December 31, 2003 | March 31, 2004 | |||||||||
| | | | (unaudited) | |||||||||
| Assets | ||||||||||||
| Current assets | ||||||||||||
| Cash and cash equivalents | $ | 132,101 | $ | 43,846 | $ | 33,087 | ||||||
| Trade accounts receivable, net | 62,791 | 103,122 | 142,041 | |||||||||
| Related party accounts receivable, net | 34,933 | — | — | |||||||||
| Prepaid expenses and other current assets | 22,984 | 23,479 | 15,347 | |||||||||
| Total current assets | 252,809 | 170,447 | 190,475 | |||||||||
| Property and equipment, less accumulated depreciation | 115,610 | 120,510 | 137,406 | |||||||||
| Deferred charges | 35,920 | 33,544 | 34,899 | |||||||||
| Debt issuance costs, net | — | 13,626 | 12,419 | |||||||||
| Supplier and agency relationships, net | — | 304,752 | 296,319 | |||||||||
| Developed technology, net | 19,524 | 228,322 | 222,813 | |||||||||
| Trade name | — | 72,142 | 72,142 | |||||||||
| Goodwill | — | 109,740 | 109,788 | |||||||||
| Other intangible assets, net | — | 34,722 | 34,021 | |||||||||
| Investments | 6,865 | 6,377 | 6,115 | |||||||||
| Other long-term assets | 24,138 | 25,263 | 22,510 | |||||||||
| Total assets | $ | 454,866 | $ | 1,119,445 | $ | 1,138,907 | ||||||
| Liabilities, Series A Preferred Stock Subject to Mandatory Redemption, Stockholders' Deficit and Partners' Capital | ||||||||||||
| Current liabilities | ||||||||||||
| Accounts payable | $ | 18,502 | $ | 19,675 | $ | 18,452 | ||||||
| Accrued expenses | 145,608 | 144,590 | 162,125 | |||||||||
| Current portion of capital lease obligations | 25,868 | 16,136 | 20,107 | |||||||||
| Current portion of long-term debt | — | 8,000 | 12,250 | |||||||||
| Total current liabilities | 189,978 | 188,401 | 212,934 | |||||||||
| Long-term portion of capital lease obligations | 67,688 | 55,002 | 67,045 | |||||||||
| Long-term debt | — | 471,490 | 440,240 | |||||||||
| Pension and postretirement benefits | 54,401 | 68,405 | 65,959 | |||||||||
| Other long-term liabilities | 7,197 | 6,310 | 8,020 | |||||||||
| Total liabilities | 319,264 | 789,608 | 794,198 | |||||||||
Commitments and contingencies | ||||||||||||
Series A Preferred Stock subject to mandatory redemption | — | 336,000 | 344,734 | |||||||||
Stockholders' deficit | ||||||||||||
| Common Stock, $0.01 par; 125,000,000 shares authorized; 83,000,001 and 83,037,152 shares issued and outstanding at December 31, 2003 and March 31, 2004, respectively | — | 830 | 830 | |||||||||
| Class B Convertible Common Stock, $0.01 par; 11,000,000 shares authorized, issued and outstanding | — | 110 | 110 | |||||||||
| Class C Convertible Common Stock, $0.01 par; 125,000,000 shares authorized; no shares issued or outstanding | — | — | ||||||||||
| Additional paid in capital—common stock | — | 12,616 | 18,062 | |||||||||
| Deferred compensation | — | (1,154 | ) | (13,942 | ) | |||||||
| Retained deficit | — | (18,565 | ) | (5,085 | ) | |||||||
| Total stockholders' deficit | — | (6,163 | ) | (25 | ) | |||||||
| Partners' capital | 135,602 | — | — | |||||||||
| Total liabilities, Series A preferred stock subject to mandatory redemption, stockholders' deficit and Partners' capital | $ | 454,866 | $ | 1,119,445 | $ | 1,138,907 | ||||||
The accompanying notes are an integral part of these consolidated financial statements.
F-4
Worldspan Technologies Inc.
Consolidated Statements of Operations
(in thousands, except per share data)
| | Predecessor Basis | | | ||||||||||||||||||
|---|---|---|---|---|---|---|---|---|---|---|---|---|---|---|---|---|---|---|---|---|---|
| | Year ended December 31, | | | Successor Basis | |||||||||||||||||
| | 2001 | 2002 | Three months ended March 31, 2003 | Six months ended June 30, 2003 | Six months ended December 31, 2003 | Three months ended March 31, 2004 | |||||||||||||||
| | | | (unaudited) | | | (unaudited) | |||||||||||||||
| Revenues | |||||||||||||||||||||
| Electronic travel distribution | |||||||||||||||||||||
| Third party | $ | 483,795 | $ | 511,914 | $ | 135,272 | $ | 272,968 | $ | 396,488 | $ | 232,539 | |||||||||
| Related party | 278,509 | 295,181 | 71,672 | 141,965 | — | — | |||||||||||||||
| Information technology services | |||||||||||||||||||||
| Third party | 12,336 | 13,285 | 3,484 | 6,572 | 32,974 | 15,992 | |||||||||||||||
| Related party | 113,713 | 94,489 | 23,917 | 45,967 | — | — | |||||||||||||||
| Total revenues | 888,353 | 914,869 | 234,345 | 467,472 | 429,462 | 248,531 | |||||||||||||||
| Operating Expenses | |||||||||||||||||||||
| Cost of revenues | |||||||||||||||||||||
| Cost of revenues excluding developed technology amortization | 588,633 | 605,845 | 162,852 | 334,469 | 319,603 | 170,337 | |||||||||||||||
| Developed technology amortization | 12,827 | 15,244 | 3,961 | 7,359 | 11,015 | 5,508 | |||||||||||||||
| Total cost of revenues | 601,460 | 621,089 | 166,813 | 341,828 | 330,618 | 175,845 | |||||||||||||||
| Selling, general and administrative | 206,315 | 181,813 | 40,278 | 76,141 | 72,424 | 36,255 | |||||||||||||||
| Amortization of intangible assets | — | — | — | — | 18,270 | 9,135 | |||||||||||||||
| Total operating expenses | 807,775 | 802,902 | 207,091 | 417,969 | 421,312 | 221,235 | |||||||||||||||
| Operating income | 80,578 | 111,967 | 27,254 | 49,503 | 8,150 | 27,296 | |||||||||||||||
| Other Income (Expense) | |||||||||||||||||||||
| Interest income | 5,812 | 2,085 | 251 | 401 | 295 | 99 | |||||||||||||||
| Interest expense | (6,515 | ) | (5,481 | ) | (1,368 | ) | (2,756 | ) | (25,481 | ) | (13,160 | ) | |||||||||
| Gain on sale of marketable securities | 9,148 | — | — | — | — | — | |||||||||||||||
| Equity in (loss) gain of investees, net | (2,141 | ) | 68 | 3 | 130 | 278 | (50 | ) | |||||||||||||
| Write-down of impaired investments | (19,784 | ) | (10,330 | ) | — | — | (1,232 | ) | — | ||||||||||||
| Change-in-control expense | — | — | — | (17,259 | ) | — | — | ||||||||||||||
| Other, net | (4,819 | ) | 7,768 | (781 | ) | (1,461 | ) | (11 | ) | (265 | ) | ||||||||||
| Total other expense, net | (18,299 | ) | (5,890 | ) | (1,895 | ) | (20,945 | ) | (26,151 | ) | (13,376 | ) | |||||||||
| Income (loss) before provision for income taxes | 62,279 | 106,077 | 25,359 | 28,558 | (18,001 | ) | 13,920 | ||||||||||||||
| Income tax (benefit) expense | (890 | ) | 1,258 | 57 | 144 | 989 | 229 | ||||||||||||||
| Net income (loss) | $ | 63,169 | $ | 104,819 | $ | 25,302 | $ | 28,414 | (18,990 | ) | 13,691 | ||||||||||
| Series A Preferred Stock dividends | 16,000 | 8,400 | |||||||||||||||||||
| Net (loss) income available to common stockholders | (34,990 | ) | 5,291 | ||||||||||||||||||
| Class B Convertible Common Stock dividends | 450 | — | |||||||||||||||||||
| Net (loss) income available to Class B Convertible Common Stock and Common Stock stockholders | $ | (35,440 | ) | $ | 5,291 | ||||||||||||||||
| Pro forma income tax expense | $ | 9,502 | $ | 10,701 | |||||||||||||||||
| Pro forma net income | $ | 15,800 | $ | 17,713 | |||||||||||||||||
| Basic net (loss) income per Class B Convertible Common Stock | $ | (0.34 | ) | $ | 0.06 | ||||||||||||||||
| Diluted net (loss) income per Class B Convertible Common Stock | $ | (0.34 | ) | $ | 0.06 | ||||||||||||||||
| Basic weighted average number of Class B Convertible Common Stock | 11,000,000 | 11,000,000 | |||||||||||||||||||
| Diluted weighted average number of Class B Convertible Common Stock | 11,000,000 | 11,000,000 | |||||||||||||||||||
| Basic net (loss) income per Common Stock | $ | (0.39 | ) | $ | 0.06 | ||||||||||||||||
| Diluted net (loss) income per Common Stock | $ | (0.39 | ) | $ | 0.06 | ||||||||||||||||
| Basic weighted average number of Common Stock | 80,756,205 | 77,692,229 | |||||||||||||||||||
| Diluted weighted average number of Common Stock | 80,756,205 | 84,519,527 | |||||||||||||||||||
The accompanying notes are an integral part of these consolidated financial statements.
F-5
Worldspan Technologies Inc.
Consolidated Statements of Partners' Capital
(in thousands)
| | Partners' Capital | Accumulated Other Comprehensive Income | Total | ||||||||
|---|---|---|---|---|---|---|---|---|---|---|---|
| Predecessor Basis | |||||||||||
| Balance at December 31, 2000 | $ | 249,052 | $ | (2,505 | ) | $ | 246,547 | ||||
| Comprehensive income: | |||||||||||
| Net income | 63,169 | — | 63,169 | ||||||||
| Unrealized holding loss on investment | — | (6,408 | ) | (6,408 | ) | ||||||
| Reclassification adjustment for realized loss on investment included in net income | — | 9,438 | 9,438 | ||||||||
| Additional minimum pension liability | — | (390 | ) | (390 | ) | ||||||
| Comprehensive income: | 65,809 | ||||||||||
| Distribution to Partners | (175,000 | ) | — | (175,000 | ) | ||||||
| Balance at December 31, 2001 | 137,221 | 135 | 137,356 | ||||||||
| Comprehensive income: | |||||||||||
| Net income | 104,819 | — | 104,819 | ||||||||
| Unrealized holding loss on investment | — | (458 | ) | (458 | ) | ||||||
| Additional minimum pension liability | — | (6,115 | ) | (6,115 | ) | ||||||
| Comprehensive income: | 98,246 | ||||||||||
| Distribution to Partners | (100,000 | ) | — | (100,000 | ) | ||||||
| Balance at December 31, 2002 | 142,040 | (6,438 | ) | 135,602 | |||||||
| Comprehensive income: | |||||||||||
| Net income | 28,414 | — | 28,414 | ||||||||
| Unrealized holding gain on investment | — | 210 | 210 | ||||||||
| Comprehensive income: | 28,624 | ||||||||||
| Distribution to Partners | (110,000 | ) | — | (110,000 | ) | ||||||
| Balance at June 30, 2003 | $ | 60,454 | $ | (6,228 | ) | $ | 54,226 | ||||
The accompanying notes are an integral part of these consolidated financial statements.
F-6
Worldspan Technologies Inc.
Consolidated Statement of Stockholders' Equity (Deficit)
(in thousands)
| | Partners' Capital | Common Stock | Class B Convertible Common Stock | Additional Paid in Capital | Deferred Compensation | Retained Deficit | Accumulated Other Comprehensive Income | Total | ||||||||||||||||||||||
|---|---|---|---|---|---|---|---|---|---|---|---|---|---|---|---|---|---|---|---|---|---|---|---|---|---|---|---|---|---|---|
| | | Shares | Cost | Shares | Cost | | | | | | ||||||||||||||||||||
| Successor Basis: | ||||||||||||||||||||||||||||||
| Balance at June 30, 2003 | $ | 60,454 | — | $ | — | — | $ | — | $ | — | $ | — | $ | — | $ | (6,228 | ) | $ | 54,226 | |||||||||||
| Elimination of prior Partners' capital | (60,454 | ) | — | — | — | — | — | — | — | 6,228 | (54,226 | ) | ||||||||||||||||||
| Issuance of Common Stock | — | 83,000 | 830 | — | — | 25,659 | — | — | — | 26,489 | ||||||||||||||||||||
| Issuance of Common Stock | — | — | — | 11,000 | 110 | 3,401 | — | — | — | 3,511 | ||||||||||||||||||||
| Paid-in-kind dividends on Series A Preferred Stock | — | — | — | — | — | (16,000 | ) | — | — | — | (16,000 | ) | ||||||||||||||||||
| Cash dividends on Class B Convertible Common Stock | — | — | — | — | — | (450 | ) | — | — | — | (450 | ) | ||||||||||||||||||
| Restricted stock grants | — | — | — | — | — | — | (1,282 | ) | — | — | (1,282 | ) | ||||||||||||||||||
| Stock-based compensation | — | — | — | — | — | 6 | 128 | — | — | 134 | ||||||||||||||||||||
| Comprehensive income: | ||||||||||||||||||||||||||||||
| Net loss | — | — | — | — | — | — | — | (18,990 | ) | — | (18,990 | ) | ||||||||||||||||||
| Unrealized holding gain on investment | — | — | — | — | — | — | — | — | 425 | 425 | ||||||||||||||||||||
| Balance at December 31, 2003 | — | 83,000 | 830 | 11,000 | 110 | 12,616 | (1,154 | ) | (18,990 | ) | 425 | (6,163 | ) | |||||||||||||||||
| Paid-in-kind dividends on Series A Preferred stock (unaudited) | — | — | — | — | — | (8,400 | ) | — | — | — | (8,400 | ) | ||||||||||||||||||
| Issuance of Common Stock (unaudited) | — | 37 | — | — | — | 11 | — | — | — | 11 | ||||||||||||||||||||
| Restricted stock (unaudited) | — | — | — | — | — | 12,938 | (12,938 | ) | — | — | — | |||||||||||||||||||
| Stock-based compensation (unaudited) | — | — | — | — | — | 897 | 150 | — | — | 1,047 | ||||||||||||||||||||
| Comprehensive income: Net income (unaudited) | — | — | — | — | — | — | — | 13,691 | — | 13,691 | ||||||||||||||||||||
| Unrealized holding loss on investment (unaudited) | — | — | — | — | — | — | — | — | (211 | ) | (211 | ) | ||||||||||||||||||
| Balance at March 31, 2004 | $ | — | 83,037 | $ | 830 | 11,000 | $ | 110 | $ | 18,062 | $ | (13,942 | ) | $ | (5,299 | ) | $ | 214 | $ | (25 | ) | |||||||||
The accompanying notes are an integral part of these consolidated financial statements.
F-7
Worldspan Technologies Inc.
Consolidated Statements of Cash Flows
(in thousands)
| | Predecessor Basis | | | ||||||||||||||||||
|---|---|---|---|---|---|---|---|---|---|---|---|---|---|---|---|---|---|---|---|---|---|
| | Year ended December 31, | | | Successor Basis | |||||||||||||||||
| | 2001 | 2002 | Three months ended March 31, 2003 | Six months ended June 30, 2003 | Six months ended December 31, 2003 | Three months ended March 31, 2004 | |||||||||||||||
| | | | (unaudited) | | | (unaudited) | |||||||||||||||
| Cash flows from operating activities: | |||||||||||||||||||||
| Net income (loss) | $ | 63,169 | $ | 104,819 | $ | 25,302 | $ | 28,414 | $ | (18,990 | ) | $ | 13,691 | ||||||||
| Adjustments to reconcile net income (loss) to net cash provided by operating activities: | |||||||||||||||||||||
| Depreciation and amortization | 83,425 | 79,215 | 17,146 | 32,322 | 52,955 | 25,063 | |||||||||||||||
| Amortization of debt issuance costs | — | — | — | — | 1,311 | 1,207 | |||||||||||||||
| Stock-based compensation | — | — | — | — | 134 | 1,048 | |||||||||||||||
| Gain on sale of investment | (9,148 | ) | — | — | — | — | — | ||||||||||||||
| Equity in loss (gain) of investees, net | 2,141 | (68 | ) | (3 | ) | (130 | ) | (278 | ) | 51 | |||||||||||
| Write-down of impaired investments | 19,784 | 10,330 | — | — | 1,232 | — | |||||||||||||||
| Loss on disposal of property and equipment, net | 2,608 | 826 | 175 | 1,010 | 610 | (18 | ) | ||||||||||||||
| Other | — | 243 | — | 300 | 141 | — | |||||||||||||||
| Changes in operating assets and liabilities: | |||||||||||||||||||||
| Trade accounts receivable, net | (158 | ) | (3,326 | ) | (14,933 | ) | (17,075 | ) | 17,100 | (38,919 | ) | ||||||||||
| Related party accounts receivable, net | (14,467 | ) | 7,786 | (7,031 | ) | (3,396 | ) | — | — | ||||||||||||
| Prepaid expenses and other current assets | 73 | (11,384 | ) | 7,738 | 5,412 | (5,907 | ) | 8,132 | |||||||||||||
| Deferred charges | 1,659 | 7,003 | 1,767 | 1,945 | 431 | (1,355 | ) | ||||||||||||||
| Other long-term assets | 284 | (13,995 | ) | (5,653 | ) | (16,840 | ) | 2,594 | (783 | ) | |||||||||||
| Accounts payable | (3,926 | ) | 587 | (5,506 | ) | 640 | 850 | (1,223 | ) | ||||||||||||
| Accrued expenses | 20,025 | 4,934 | (15,621 | ) | 6,330 | (7,297 | ) | 17,484 | |||||||||||||
| Pension and postretirement benefits | (3,802 | ) | (101 | ) | 2,008 | 3,203 | 4,339 | (2,446 | ) | ||||||||||||
| Other long-term liabilities | (461 | ) | (120 | ) | (969 | ) | (1,112 | ) | 227 | 1,710 | |||||||||||
| Net cash provided by operating activities | 161,206 | 186,749 | 4,420 | 41,023 | 49,452 | 23,642 | |||||||||||||||
| Cash flows from investing activities: | |||||||||||||||||||||
| Purchase of property and equipment | (22,337 | ) | (12,375 | ) | (7,574 | ) | (4,236 | ) | (15,961 | ) | (2,862 | ) | |||||||||
| Proceeds from sale of property and equipment | 779 | 559 | 146 | 396 | 75 | 20 | |||||||||||||||
| Capitalized software for internal use | (3,613 | ) | (3,056 | ) | (1,036 | ) | (1,367 | ) | (1,395 | ) | — | ||||||||||
| Purchase of investments | (9,371 | ) | (327 | ) | — | — | — | — | |||||||||||||
| Proceeds from sale of investment | 9,148 | — | — | — | — | — | |||||||||||||||
| Net cash used in investing activities | (25,394 | ) | (15,199 | ) | (8,464 | ) | (5,207 | ) | (17,281 | ) | (2,842 | ) | |||||||||
| Cash flows from financing activities: | |||||||||||||||||||||
| Distribution to Partners | (175,000 | ) | (100,000 | ) | (60,000 | ) | (110,000 | ) | — | — | |||||||||||
| Payments to seller airlines | — | — | — | — | (702,846 | ) | — | ||||||||||||||
| Cash dividends paid | — | — | — | — | (450 | ) | (34 | ) | |||||||||||||
| Transaction costs | — | — | �� | — | (40,040 | ) | — | ||||||||||||||
| Proceeds from issuance of debt, net of debt issuance costs | — | — | — | — | 390,063 | — | |||||||||||||||
| Proceeds from issuance of common and Series A Preferred Stock | — | — | — | — | 346,913 | 380 | |||||||||||||||
| Principal payments on capital leases | (16,046 | ) | (25,390 | ) | (7,014 | ) | (13,986 | ) | (13,896 | ) | (4,905 | ) | |||||||||
| Principal payments on debt | — | — | — | — | (12,000 | ) | (27,000 | ) | |||||||||||||
| Net cash used in financing activities | (191,046 | ) | (125,390 | ) | (67,014 | ) | (123,986 | ) | (32,256 | ) | (31,559 | ) | |||||||||
| Net (decrease) increase in cash and cash equivalents | (55,234 | ) | 46,160 | (71,058 | ) | (88,170 | ) | (85 | ) | (10,759 | ) | ||||||||||
| Cash and cash equivalents at beginning of period | 141,175 | 85,941 | 132,101 | 132,101 | 43,931 | 43,846 | |||||||||||||||
| Cash and cash equivalents at end of period | $ | 85,941 | $ | 132,101 | $ | 61,043 | $ | 43,931 | $ | 43,846 | $ | 33,087 | |||||||||
| Supplemental disclosure of cash flow information: | |||||||||||||||||||||
| Interest paid | $ | 6,515 | $ | 6,695 | 1,271 | $ | 2,433 | $ | 18,967 | 3,500 | |||||||||||
| Income taxes paid (recovered) | $ | 1,519 | $ | (81 | ) | 161 | $ | 564 | $ | (538 | ) | 372 | |||||||||
Non-cash financing activities:
- (1)
- Capital lease obligations of $30,703 and $41,053 were incurred in 2001 and 2002, respectively, $17,237 and $12,134 for the six months ended June 30, 2003 and six months ended December 31, 2003, respectively, and $10,707 and $20,919 for the three months ended March 31, 2003 and 2004, respectively, when the Partnership entered into leases for new equipment.
The accompanying notes are an integral part of these consolidated financial statements
F-8
Worldspan Technologies Inc.
Notes to Consolidated Financial Statements
(dollars in thousands, except per share data)
1. Summary of Significant Accounting Policies
Nature of Business. On March 3, 2003, Citigroup Venture Capital Equity Partners, L.P. ("CVC") and Ontario Teachers' Pension Plan Board ("OTPP") formed Worldspan Technologies Inc. ("WTI" or the "Company"), formerly Travel Transaction Processing Corporation ("TTPC"). On June 30, 2003, the Company indirectly acquired 100% of the outstanding partnership interests of Worldspan, L.P. ("Worldspan" or the "Partnership) from affiliates of Delta Air Lines, Inc. ("Delta"), Northwest Airlines, Inc. ("Northwest") and American Airlines, Inc. ("American") (the "Acquisition"). The Company had no operations, assets, or revenues from the period of inception to June 30, 2003. The Partnership is a Delaware limited partnership formed in 1990. The Company owns all of the general partnership interests in the Partnership. WS Holdings LLC ("WS Holdings"), which is owned by the Company, is the sole limited partner of the Partnership, owning all of the limited partnership interests. Prior to the Acquisition, Delta, Northwest and American (collectively, our "founding airlines") each owned approximately 40%, 34% and 26% general partnership interests in the Partnership, respectively, and NEWCRS Limited, Inc. ("NEWCRS"), which was owned by our founding airlines, owned all of the limited partnership interests. American acquired its interest in the Partnership as part of its acquisition of substantially all of the assets of Trans World Airlines, Inc. ("TWA") in April 2001.
The Company provides information, reservations, transaction processing and related services for airlines, travel agencies and other travel-related entities. The Company owns and operates a global distribution system ("GDS"), and provides subscribers with access to and use of this GDS. The Company also charges Delta, Northwest and others for the use of the GDS.
Basis of Presentation. The accompanying financial statements represent the consolidated statements of the Company and its wholly owned subsidiaries. The Company accounts for its investments in certain investee companies (ownership 20%-50%) under the equity method of accounting, due to the Company having significant influence, but not control of the investee. Less than 20%-owned investees are included in the financial statements at the cost of the Company's investment, as the Company does not have significant influence of the investee. All material intercompany transactions and balances have been eliminated in consolidation.
The accompanying unaudited consolidated financial statements have been prepared in accordance with accounting principles generally accepted in the United States for interim financial information and with the instructions to Form 10-Q and Article 10 of Regulation S-X. Accordingly, they do not include all of the information and footnotes required by accounting principles generally accepted in the United States for complete financial statements. In the opinion of management these financial statements contain all adjustments, consisting of normal recurring accruals, necessary to present fairly the financial position, results of operations and cash flows for the periods indicated. The preparation of financial statements in accordance with accounting principles generally accepted in the United States requires management to make estimates and assumptions that affect the amounts reported in the financial statements and the accompanying notes. Operating results for the three months ended March 31, 2004 are not necessarily indicative of results that may be expected for any other interim period or for the year ending December 31, 2004.
The consolidated financial statements present the Company for the period July 1, 2003 through December 31, 2003 and for the three months ended March 31, 2004 ("successor basis" reflecting the Acquisition and associated basis) and the period January 1, 2001 through June 30, 2003 and the three months ended March 31, 2003 ("predecessor basis" for the period of Delta's, Northwest's and American's ownership of the Partnership and associated basis).
F-9
In accordance with the requirements of purchase accounting, the assets and liabilities of the Company were adjusted to their estimated fair values and the resulting goodwill computed for the Acquisition (see Note 8). The application of purchase accounting generally results in higher depreciation and amortization expense in future periods. Accordingly, and because of other effects of purchase accounting, the accompanying consolidated financial statements as of and for the period prior to the Acquisition are not comparable with those periods subsequent to the Acquisition.
Cash and cash equivalents. Cash equivalents consist of commercial paper and overnight investments with original maturities of three months or less when purchased.
Fair Value of Financial Instruments. The carrying amounts of the Company's financial instruments, exclusive of the depository certificates discussed in Note 2, approximate their fair values due to their short maturities. Based on borrowing rates currently available to the Company, the carrying value of capital lease obligations approximates fair value.
Foreign Currency. The U.S. dollar is considered to be the functional currency of the Company's foreign subsidiaries. The Company had cash and cash equivalents, accounts receivable and accounts payable denominated in foreign currencies of approximately $6,962, $1,805 and $1,793, respectively, at December 31, 2002, $2,131, $2,529 and $2,742, respectively, at December 31, 2003, and $1,494 (unaudited), $2,853 (unaudited) and $787 (unaudited), resepctively, at March 31, 2004. These amounts have been translated into U.S. dollars based upon exchange rates in effect at December 31, 2002 and 2003 and the related transaction gains and losses are included in "Other, net" in the accompanying consolidated statements of operations.
Consolidated Statements of Cash Flows. For purposes of the consolidated statements of cash flows, the Company considers all short-term, highly liquid investments readily convertible into cash with original maturity at date of purchase of three months or less to be cash equivalents. At December 31, 2002 and 2003 and March 31, 2004, the Company had cash equivalents of approximately $113,924, $39,375 and $20,495 (unaudited), respectively.
Property and equipment. Property and equipment are recorded at cost and depreciated over their estimated useful lives using the straight-line method. Property and equipment held under capital leases are amortized over the shorter of the lease term or the estimated useful life of the related asset. Upon retirement or sale, the cost of the assets disposed of and the related accumulated depreciation are removed from the accounts and any resulting gain or loss is credited or charged to income. Repairs and maintenance costs are expensed as incurred.
Capitalized Software for Internal Use. Under the provisions of Statement of Position No. 98-1,Accounting for the Costs of Computer Software Developed or Obtained for Internal Use ("SOP 98-1"), capitalization of costs begins when the preliminary project stage is completed, management has authorized further funding for the project and management deems it probable that the software will be completed and used to perform the function intended. The Company amortizes capitalized software development costs when the project is substantially complete and ready for its intended use. Amortization is provided on a straight-line basis over the estimated useful life of the software, which is approximately three to seven years. Amortization of capitalized software was $3,280 and $5,697, respectively, for the years ended December 31, 2001 and 2002, $3,139 and $254, respectively, for the six months ended June 30, 2003 and December 31, 2003 and $1,574 (unaudited) and $125 (unaudited), respectively, for the three months ended March 31, 2003 and 2004. Research and development costs incurred in software development was $12,708 and $10,087, respectively, for the years ended December 31, 2001 and 2002, $5,103 and $4,465, respectively, for the six months ended June 30, 2003 and December 31, 2003 and $2,668 (unaudited) and $2,151 (unaudited), respectively, for the three months ended March 31, 2003 and 2004. Software maintenance costs are expensed as incurred.
F-10
Long-Lived Assets. Long-lived assets are reviewed for impairment when changes in circumstances indicate that the carrying amount of an asset may not be recoverable. If it is determined that such indicators are present, an undiscounted future net cash flow projection is prepared for the assets. In preparing this projection, a number of assumptions are made, including without limitation, future transactions levels, price levels and rates of increase in operating expenses. If the projection of undiscounted future cash flows is in excess of the carrying value of the recorded asset, no impairment is recorded. If the carrying value of the assets exceeds the projected undiscounted net cash flows, an impairment is recorded. The amount of the impairment charge is determined by discounting the projected net cash flows.
Revenue Recognition. The Company provides electronic travel distribution services through the Worldspan GDS. These services are provided for airline carriers, rental car companies, hotels and other providers of travel products and services (collectively referred to as "associates"). The Company charges the associates fees for reservations booked through the Worldspan GDS and the fee per transaction is based upon the participation level of the respective associate. Each participation level has a different level of functionality, which impacts the nature of the services provided through the Worldspan GDS. Revenue for airline travel transactions made through the Worldspan GDS is recognized at the time the transactions are processed. However, if a transaction is subsequently canceled, the transaction fee or fees must be credited or refunded to the airline. Therefore, revenues are recorded net of an estimated amount reserved to account for cancellations which may occur in a future month. This reserve is calculated based on historical cancellation rates. In estimating the amount of future cancellations that will require a transaction fee to be refunded, the Company assumes that a significant percentage of cancellations are followed by an immediate re-booking, without a net loss of revenues. This assumption is based on historical rates of cancellations and re-bookings and has a significant impact on the amount reserved. Revenue for car rental, hotel and other travel provider transactions is recognized at the time the reservation is used by the traveler.
The Company also enters into subscriber service agreements, primarily with travel agencies, providing the user with access to the Worldspan GDS. Revenue for subscriber agreements is recognized as the service is provided.
As part of the Acquisition, the Company entered into a founder airline services agreement ("FASA") with each of Delta and Northwest. The FASAs replaced existing agreements between the Company and these two founding airlines covering substantially the same information technology services provided by the Company at substantially the same prices. The services provided under the FASAs include (i) internal reservation system services; (ii) flight operations technology services; and (iii) software development services, which include custom development and integration of software for use in an airline's internal reservation system and flight operations system. Under the terms of the FASAs, revenue is earned in relation to the actual monthly cost incurred to provide each of the services. Revenue is recognized in the period the services are provided and the associated costs are incurred. The FASAs contain an obligation by the Company to provide FASA credits and make FASA credit payments (collectively referred to as "FASA credits") to Delta and Northwest during the term. For the six months ended December 31, 2003 and the three months ended March 31, 2004, Delta and Northwest earned FASA credits of $16,667 and $8,333 (unaudited), respectively, which were accounted for as contra-revenue in accordance with Emerging Issues Task Force Issue No. 01-9,Accounting for Consideration Given by a Vendor to a Customer (Including a Reseller of the Vendor's Products) ("EITF No. 01-9").
The Company also provides technology services to other companies in the travel industry on a fixed fee per transaction basis. Revenue is recognized as the service is provided.
The Company has entered into fare content agreements with certain airlines pursuant to which these airlines will give the Company access to their schedule information, seat availability and publicly
F-11
available fares (including web fares) for flights for sale in the territories covered in the respective agreements. Monthly payments made in conjunction with these agreements are accounted for as contra-revenue in accordance with EITF No. 01-9.
Advertising Costs. Advertising costs are expensed as incurred.
Subscriber Incentives. Subscriber incentive costs include ongoing programs to assist in the sale of Worldspan products and services. Costs may increase or decrease depending on total Worldspan system transaction volumes generated by certain subscribers. These subscriber incentives may be paid at the time of signing a long-term agreement, at specified intervals of time, upon reaching specified transaction thresholds or for each transaction processed through the Worldspan GDS. Subscriber incentives that are payable on a per transaction basis are expensed in the month the transactions are generated. Subscriber incentives payable upon the achievement of specified objectives are assessed as to the likelihood and amount of ultimate payment and expensed over the term of the contract. Subscriber incentives paid at contract signing or payable at specified dates or upon the achievement of specified objectives are capitalized and amortized over the expected life of the travel agency contract, which is generally four years. Deferred charges represent the unamortized balance of the capitalized payments to subscribers. Amortization of deferred charges was $24,078 and $25,117, respectively, for the years ended December 31, 2001 and 2002, $11,172 and $10,096, respectively, for the six months ended June 30, 2003 and December 31, 2003 and $5,331 (unaudited) and $5,133 (unaudited), respectively, for the three months ended March 31, 2003 and 2004. Deferred charges are reviewed for recoverability on a quarterly basis, or when circumstances change, based upon the expected future cash flows from transactions processed by the related subscribers. If the estimate for future recoverability differs from the amount recorded, the difference is written off.
In accordance with EITF No. 01-9, subscriber incentive costs are recorded as a reduction of electronic travel distribution revenue. To the extent these costs reduce the revenue associated with the subscriber service agreements to zero, the remaining subscriber incentive costs are included in cost of revenues excluding developed technology amortization on the consolidated statements of operations.
Goodwill and Other Intangible Assets. The Company accounts for goodwill and other intangible assets in accordance with Statement of Financial Accounting Standards ("SFAS") No. 142,Goodwill and Other Intangible Assets. SFAS No. 142 requires goodwill and intangible assets with indefinite lives to no longer be amortized. Goodwill and other intangible assets will be subject to an impairment test annually or when changes in circumstances indicate that the carrying value may not be recoverable.
Stock-Based Compensation. Under the Company's stock incentive plan, the Company offers restricted shares of its Common Stock and grants options to purchase shares of its Common Stock to certain employees. The Company accounts for employee stock options and restricted shares of Common Stock in accordance with SFAS No. 123,Accounting for Stock Based Compensation ("SFAS No. 123"). The Company values stock options based upon a binomial option-pricing model. As the options and restricted shares of Common Stock are being granted to employees, the Company recognizes this value as an expense over the period in which the options and restricted shares vest.
Income (Loss) Per Share. Basic income (loss) per share has been computed based upon the weighted average of Class B Convertible Common Stock and Common Stock outstanding. Diluted income (loss) per share gives effect to outstanding stock options. Net income (loss), after deduction for Class B Convertible Common Stock dividends, has been allocated between Class B Convertible Common Stock and Common Stock based on their relative shares outstanding at each period end due to their equal rights to dividends. The following table sets forth the calculation of basic and diluted
F-12
income (loss) per share for Class B Convertible Common Stock and for Common Stock for the six months ended December 31, 2003 and the three months ended March 31, 2004:
| | Successor Basis | ||||||
|---|---|---|---|---|---|---|---|
| | Six months ended December 31, 2003 | Three months ended March 31, 2004 | |||||
| | | (unaudited) | |||||
| Net (loss) income | $ | (18,990 | ) | $ | 13,691 | ||
| Less: Series A Preferred Stock dividends | 16,000 | 8,400 | |||||
| Net (loss) income available to common stockholders | (34,990 | ) | 5,291 | ||||
| Less: Class B Convertible Common Stock dividends | 450 | — | |||||
| Undistributed net (loss) income available to Class B Convertible Common Stock and Common Stock stockholders | $ | (35,440 | ) | $ | 5,291 | ||
| Net (loss) income available to Class B Convertible Common Stock stockholders: | |||||||
| Class B Convertible Common Stock dividends | $ | 450 | $ | — | |||
| Amount of undistributed (losses) income allocated to Class B Convertible Common Stock stockholders | (4,147 | ) | 619 | ||||
| Net (loss) income available to Class B Convertible Common Stock stockholders | $ | (3,697 | ) | $ | 619 | ||
| Net (loss) income allocated to Common Stock stockholders | $ | (31,293 | ) | $ | 4,672 | ||
| Basic weighted average number of Class B Convertible Common Stock | 11,000,000 | 11,000,000 | |||||
| Weighted average of common share equivalents of Class B Convertible Common Stock | — | — | |||||
| Diluted weighted average number of Class B Convertible Common Stock | 11,000,000 | 11,000,000 | |||||
| Basic weighted average number of Common Stock | 80,756,205 | 77,692,229 | |||||
| Weighted average of common share equivalents of Common Stock | — | 6,827,298 | |||||
| Diluted weighted average number of Common Stock | 80,756,205 | 84,519,527 | |||||
Net (loss) income per Class B Convertible Common Stock share: | |||||||
| Basic | $ | (0.34 | ) | $ | 0.06 | ||
| Diluted | $ | (0.34 | ) | $ | 0.06 | ||
Net (loss) income per Common Stock share: | |||||||
| Basic | $ | (0.39 | ) | $ | 0.06 | ||
| Diluted | $ | (0.39 | ) | $ | 0.06 | ||
For the six months ended December 31, 2003 and three months ended March 31, 2004, diluted net income (loss) per Class B Convertible Common Stock share does not differ from basic net income (loss) per Class B Convertible Common Stock share since there are no options or other contracts to issue Class B Convertible Common Stock outstanding during these periods. For the six months ended December 31, 2003, diluted net loss per Common Stock share does not differ from basic net loss per Common Stock share since potential common shares from the exercise of Common Stock options would have been antidilutive. The Company had 3,624,000 and 312,500 Common Stock options outstanding which were antidilutive for the six months ended December 31, 2003 and the three months ended March 31, 2004, respectively.
Retirement Plans. Pension costs recorded as charges to operations include actuarially determined current service costs and an amount equivalent to amortization of prior service costs in accordance with the provisions set forth in SFAS No. 87,Employers' Accounting for Pensions. The Company accounts for postretirement benefits other than pensions in accordance with SFAS No. 106,Employers' Accounting
F-13
for Postretirement Benefits Other Than Pensions. The Company accounts for the cost of these benefits, which are for health care and life insurance, by accruing them during the employee's active working career. In October 2003, the Company approved changes that resulted in the curtailment of these retirement plans. As required by SFAS Nos. 87, 106 and 141, the Company has recognized the effects of those actions in measuring the projected benefit obligation as part of purchase accounting.
Income Taxes. Prior to July 1, 2003, all income or losses of the Partnership were allocated to the general and limited partners for inclusion in their respective income tax returns and, consequently, no provision or benefit for U.S. federal or state income taxes were made in the Partnership's financial statements. In 2001, there was a one-time federal income tax expense associated with a Foreign Sales Corporation ("FSC"), which was wholly-owned by the Partnership. The Partnership was subject to income tax in foreign countries where it maintained operations. With the exception of the tax incurred by the FSC, the income tax provision consisted only of foreign taxes.
The Company determines its deferred tax provision using the liability method. Under the liability method, deferred income tax assets and liabilities are determined based on differences between financial reporting and income tax bases of assets and liabilities and are measured using the tax rates and laws in effect at the time of such determination. The measurement of deferred tax assets is adjusted by a valuation allowance, if necessary, to recognize the extent to which, based on available evidence, the future tax benefits more likely than not will not be realized.
Use of Estimates. The preparation of financial statements in conformity with generally accepted accounting principles requires management to make estimates and assumptions that affect the reported amounts of assets and liabilities and disclosure of contingent assets and liabilities at the date of the financial statements, and the reported amounts of revenues and expenses during the reporting period. Actual results could differ from those estimates.
Risks and Uncertainties. The Company derives substantially all of its revenues from the travel industry. Accordingly, events affecting the travel industry, particularly airline travel and participating airlines, can significantly affect the Company's business, financial condition and results of operations. The Company's customers are primarily located in the United States and Europe.
Travel agencies are the primary channel of distribution for the services offered by travel vendors. If the Company were to lose and not replace the transactions generated by any significant travel agencies, its business, financial condition and results of operations could be adversely affected. For the year ended December 31, 2002, the six months ended June 30, 2003 and December 31, 2003 and the three months ended March 31, 2003 and 2004, one subscriber generated transactions in our electronic travel distribution segment which resulted in revenue of approximately $134,993, $89,322, $93,334, $43,040 (unaudited) and $63,187 (unaudited), respectively. These amounts represented 15%, 19%, 22%, 18% (unaudited) and 25% (unaudited), respectively, of the Company's total operating revenue.
Furthermore, the Company charges associates for electronic travel distribution services and information technology services. Revenues generated by two associates for the year ended December 31, 2002, the six months ended June 30, 2003 and December 31, 2003, and the three months ended March 31, 2003 and 2004 were $304,320, $152,506, $129,744, $78,692 (unaudited) and $69,337 (unaudited), respectively. These amounts, included in the electronic travel distribution segment and the information technology services segment, represented approximately 33% of total operating revenues for the year ended December 31, 2002 and the six months ended June 30, 2003, 30% of total operating revenues for the six months ended December 31, 2003 and 34% (unaudited) and 28% (unaudited), respectively, of total operating revenues for the three months ended March 31, 2003 and 2004. At December 31, 2003 and March 31, 2004, accounts receivable from these same two associates was approximately $32,704, $40,670 (unaudited), respectively or 32% and 29% (unaudited), respectively of the Company's total net accounts receivable. Such amounts have been collected subsequent to year end.
F-14
The Company maintained an allowance for doubtful accounts of approximately $18,447, $15,530 and $15,689 (unaudited) at December 31, 2002 and 2003 and March 31, 2004, respectively.
Cost of Revenues. Cost of revenues consists primarily of inducements paid to travel agencies, technology development and operations personnel, software costs, network costs, hardware leases, maintenance of computer and network hardware, depreciation of computer hardware and the data center building and other travel agency support headcount.
Selling, General and Administrative. Selling, general and administrative expenses consist primarily of sales and marketing, labor and associated costs, advertising services, professional fees, a portion of the expenses associated with our facilities, depreciation of computer equipment, furniture and fixtures and leasehold improvements, internal management costs and expenses for finance, legal, human resources and other administrative functions.
Recently Issued Accounting Pronouncements. In January 2003, the FASB issued FIN 46,Consolidation of Variable Interest Entities. FIN 46 expands upon existing accounting guidance that addresses when a company should include in its financial statements the assets, liabilities and activities of a variable interest entity. The consolidation requirements of FIN 46 apply immediately to variable interest entities created after January 31, 2003. The consolidation requirements apply to older entities in the first fiscal year or interim period beginning after June 15, 2003. The adoption of FIN 46 did not have a significant effect on the Company's financial position or results of operations.
In May 2003, the FASB issued SFAS No. 150,Accounting for Certain Financial Instruments with Characteristics of Both Liabilities and Equity. The Statement specifies that instruments within its scope embody obligations of the issuer and that, therefore, the issuer must classify them as liabilities. SFAS 150 prohibits entities from restating financial statements for earlier years presented. SFAS 150 became effective for the Company at the beginning of the third quarter of 2003. The Company does not currently have financial instruments with the characteristics of liabilities and equity. Accordingly, the implementation of SFAS 150 did not have any impact on the Company's consolidated financial position or results of operations.
Reclassifications. Certain reclassifications have been made in prior years' financial statements to conform to classifications used in the current year.
2. Investments
The Company has entered into strategic investments with various technology and Internet companies that offer travel related products and services. These investments are strategic in that the primary purpose of the investments is either to enhance the content offered on the Worldspan GDS or to enable the Company to offer new and/or enhanced travel related products.
At December 31, 2002 and 2003, the Company held an investment in a publicly traded company that is classified as an available-for-sale marketable security. The Company's basis in this investment at December 31, 2002 was approximately $562, after recording an impairment charge of $9,438 during 2001 based on the determination that the decline in fair value below cost was other-than-temporary, as defined in SFAS No. 115,Accounting for Certain Investments in Debt and Equity Securities, and related guidance (see discussion below). At December 31, 2003, the Company's basis in this investment was approximately $841. The increase in the basis of the investment resulted from the application of purchase accounting whereby the investment was adjusted to its estimated fair value. The fair value of this investment at December 31, 2002 and 2003 and March 31, 2004 was $630, $1,262 and $1,055 (unaudited), respectively. The fair value of this investment has been determined using a value supplied by an independent pricing service. For the years ended December 31, 2002 and 2003, there were no sales of securities classified as available-for-sale.
F-15
As discussed in Note 1, the Company accounts for its investments in certain non-public investee companies (ownership 20%-50%) under the equity method of accounting. For the years ended December 31, 2001 and 2002, the Company recognized a net loss of $2,141 and a net gain of $68, respectively, for its equity in the gains and losses of the investees. For the six months ended June 30, 2003 and December 31, 2003 and the three months ended March 31, 2003 and 2004, the Company recognized a gain of $130, $278 and $3 (unaudited) and a net loss of $51 (unaudited), respectively, for its equity in the gains and losses of an investee. Less than 20%-owned non-public investees are included in the financial statements at the cost of the Company's investment. For the years ended December 31, 2001 and 2002, the Company invested $7,411 and $327, respectively, in companies accounted for under the cost method.
The Company classifies all of its investments as noncurrent since it is the Company's intent to hold the investments for a period of time greater than one year.
The Company assesses on a regular basis whether any significant decline in the fair value of an investment below the Company's cost is other-than-temporary. In performing this assessment, the Company considers all available evidence to evaluate whether the decline in an investment is other-than-temporary. This includes consideration of the current market price (for those investments that are publicly traded), specific factors or events (if any) that have caused the decline, recent news and events at the investee, general market conditions and the duration and extent to which an investment's market value has been below the Company's cost. To the extent that a decline in value is determined to be other-than-temporary, the investment is written down to its estimated fair value with an impairment charge to current earnings.
For the years ended December 31, 2001 and 2002 and the six months ended December 31, 2003, the Company recorded impairment charges of $10,346, $10,330 and $1,232, respectively, to write-off its investment in various non-public investee companies. The impairment charges recorded were based upon management's estimate of the fair value. The decline in the estimated fair value of each investment was considered to be other-than-temporary since the Company concluded that it was unclear over what period a recovery, if any, would take place; therefore, the positive evidence suggesting that the investment would recover to at least the Company's purchase price was not sufficient to overcome the presumption that there was a permanent impairment in value.
At December 31, 2000, the Company owned approximately 447 depository certificates representing beneficial ownership of common stock of Equant N.V. ("Equant"), a telecommunications company affiliated with Societe Internationale de Telecommunications Aeronautiques ("SITA"). The SITA Foundation issued the depository certificates and the allocation of the depository certificates to the SITA members was based upon the members' level of usage of the SITA network over a period of time. The SITA Foundation held the underlying Equant shares to the depository certificates. In November 2000, in connection with Equant's announcement of a planned merger with France Telecom's Global One business, the SITA Foundation entered into an agreement to exchange its approximately 68 million Equant shares for France Telecom shares at an approximate conversion rate of 1 Equant share to 0.4545 France Telecom share. The merger was completed during the first half of 2001. Certain restrictions limited the Company's ability to dispose of its depository certificates. In July 2001, the Company disposed of its remaining zero cost basis depository certificates, realizing a gain of approximately $9,148.
F-16
3. Property and Equipment
Property and equipment are comprised of the following:
| | | Predecessor Basis | Successor Basis | |||||||||
|---|---|---|---|---|---|---|---|---|---|---|---|---|
| | Estimated Useful Life | December 31, 2002 | December 31, 2003 | March 31, 2004 | ||||||||
| | | | | (unaudited) | ||||||||
| Subscriber computer equipment | 3 years | $ | 98,819 | $ | 16,195 | $ | 17,539 | |||||
| Furniture, fixtures and equipment | 3 to 5 years | 96,463 | 33,322 | 34,691 | ||||||||
| Assets acquired under capital leases | 3 to 19 years | 97,130 | 89,082 | 113,536 | ||||||||
| Purchased software | 3 to 7 years | 61,367 | 4,029 | 4,075 | ||||||||
| Leasehold improvements | Lesser of lease term or useful life | 10,422 | 1,023 | 1,099 | ||||||||
| Land | 470 | 525 | 525 | |||||||||
| Total property and equipment | 364,671 | 144,176 | 171,465 | |||||||||
| Less accumulated depreciation and amortization | (249,061 | ) | (23,666 | ) | (34,059 | ) | ||||||
| Property and equipment, net | $ | 115,610 | $ | 120,510 | 137,406 | |||||||
Depreciation and amortization expense of property and equipment was $70,598 and $63,971, respectively, for the years ended December 31, 2001 and 2002, $24,965 and $23,666, respectively, for the six months ended June 30, 2003 and December 31, 2003 and $13,185 (unaudited) and $10,420 (unaudited), respectively for the three months ended March 31, 2003 and 2004. Accumulated depreciation of assets acquired under capital leases at December 31, 2002, 2003 and March 31, 2004 was $33,782, $11,503 and $16,617 (unaudited), respectively. Assets acquired under capital leases primarily consist of mainframe equipment and acquired software. In accordance with the requirements of purchase accounting, property and equipment was adjusted to its estimated fair value. Accordingly, depreciation is accumulated only since the date of the Acquisition.
4. Related Party Transactions
Prior to the Acquisition, all transactions with Delta, Northwest, American and TWA were related party transactions, as described below. As of July 1, 2003, our founding airlines are no longer related parties; therefore, all transactions with our founding airlines subsequent to the Acquisition are considered third party transactions.
Predecessor Basis
Revenues. The Partnership charges Delta, Northwest, American and TWA for services related to information, reservations, ticket processing and other computer related services ("Information Technology Services"). The Partnership also charges Delta, Northwest, American and TWA for electronic travel distribution fees related to their airline reservations processed through the Worldspan GDS. Revenues earned from Delta represented approximately 20% of consolidated total revenues for the years ended December 31, 2001 and 2002, the three months ended March 31, 2003 and the six months ended June 30, 2003. Revenues earned from Northwest represented approximately 14% of consolidated total revenues for the years ended December 31, 2001 and 2002 and three months ended March 31, 2003 and 13% of consolidated total revenues for the six months ended June 30, 2003.
F-17
Electronic travel distribution fees revenue billed to Delta, Northwest, American and TWA were as follows:
| | Year ended December 31, | Three months ended March 31, 2003 | Six months ended June 30, 2003 | ||||||||
|---|---|---|---|---|---|---|---|---|---|---|---|
| | 2001 | 2002 | |||||||||
| | | | (unaudited) | | |||||||
| Delta | $ | 115,879 | $ | 123,716 | 32,842 | $ | 65,261 | ||||
| Northwest | 89,202 | 86,419 | 21,933 | 41,278 | |||||||
| American | 61,527 | (1) | 85,046 | 16,897 | 35,426 | ||||||
| TWA | 11,901 | (2) | — | — | — | ||||||
| $ | 278,509 | $ | 295,181 | 71,672 | $ | 141,965 | |||||
Information technology services revenue billed to Delta, Northwest, American and TWA were as follows:
| | Year ended December 31, | Three months ended March 31, 2003 | Six months ended June 30, 2003 | ||||||||
|---|---|---|---|---|---|---|---|---|---|---|---|
| | 2001 | 2002 | |||||||||
| | | | (unaudited) | | |||||||
| Delta | $ | 58,935 | $ | 56,441 | 13,979 | $ | 26,762 | ||||
| Northwest | 38,517 | 37,744 | 9,938 | 19,205 | |||||||
| American | 10,365 | (1) | 304 | — | — | ||||||
| TWA | 5,896 | (2) | — | — | — | ||||||
| $ | 113,713 | $ | 94,489 | 23,917 | $ | 45,967 | |||||
- (1)
- for the eight-month period ended December 31, 2001
- (2)
- for the four-month period ended April 30, 2001
Operating Expenses. The Partnership purchases services and leases facilities from Delta, Northwest and TWA primarily in connection with the operations of the Worldspan GDS. In connection with these services, the Partnership incurred costs with Delta, Northwest and TWA/American of $8,299, $10,452 and $128, respectively, for the year ended December 31, 2001, $4,829, $1,225 and $0, respectively, for the year ended December 31, 2002, $1,789 (unaudited), $307 (unaudited) and $0 (unaudited), respectively, for the three months ended March 31, 2003, and $3,579, $662, and $0, respectively, for the six months ended June 30, 2003.
Accounts Receivable and Accounts Payable. Net related party accounts receivable and accounts payable include the following:
| | December 31, 2002 | ||||||||
|---|---|---|---|---|---|---|---|---|---|
| | Receivable | Payable | Net Receivable | ||||||
| Delta | $ | 14,589 | $ | 1,159 | $ | 13,430 | |||
| Northwest | 18,846 | 1,618 | 17,228 | ||||||
| American | 4,275 | — | 4,275 | ||||||
| $ | 37,710 | $ | 2,777 | $ | 34,933 | ||||
Amounts are receivable and payable under contractual arrangements among the parties. Such transactions are in the ordinary course of business under terms comparable to those of transactions with other parties. For information technology services, the fees charged by the Partnership equal the Partnership's cost of providing the services to the applicable airline (including an allocation of any costs
F-18
for services shared with other service recipients), except for software development service fees, which equal the Partnership's cost of providing the services to the applicable airline (including an allocation of any costs for services shared with other service recipients) plus 20%.
Successor Basis
Advisory Agreements. In connection with the Acquisition, the Company entered into an advisory agreement with CVC Management pursuant to which CVC Management may provide financial, advisory and consulting services to the Company. In exchange for these services, CVC Management will be entitled to an annual advisory fee of $900. The advisory agreement has an initial term of ten years. These expenses are included in "Selling, general and administrative" expenses in the accompanying consolidated statements of operations. During the six months ended December 31, 2003, the Company distributed $450 to CVC Management pursuant to this advisory agreement.
Stock-Based Compensation. Under the stock incentive plan, the Company offers restricted shares of its Common Stock and grants options to purchase shares of its Common Stock to certain employees. As the options and restricted shares are being granted to employees, the Company recognizes this value as an expense over the period in which the options and restricted shares vest.
Class B Convertible Common Stock Dividends. During the six months ended December 31, 2003, the Company declared and paid Class B Convertible Common Stock dividends of $450 to OTPP.
5. Accrued Expenses
Accrued expenses are comprised of the following:
| | Predecessor Basis | Successor Basis | |||||||
|---|---|---|---|---|---|---|---|---|---|
| | December 31, 2002 | December 31, 2003 | March 31, 2004 | ||||||
| | | | (unaudited) | ||||||
| Subscriber incentives | $ | 68,429 | $ | 80,198 | 83,803 | ||||
| Employee compensation | 38,159 | 23,086 | 20,917 | ||||||
| Booking cancellation reserve | 13,874 | 9,661 | 14,576 | ||||||
| Other accrued expenses | 25,146 | 31,645 | 42,829 | ||||||
| Total | $ | 145,608 | $ | 144,590 | $ | 162,125 | |||
6. Employee Benefit Plans
The Company sponsors noncontributory defined benefit pension plans covering substantially all U.S. employees. Pension coverage for employees of the Company's non-U.S. subsidiaries is provided, to the extent deemed appropriate, through separate plans governed by local statutory requirements. The plans provide for payment of retirement benefits, mainly commencing between the ages of 52 and 65. After meeting certain qualifications, an employee acquires a vested right to future benefits. The benefits payable under the plans are generally determined on the basis of an employees' length of service and earnings. Annual contributions to the plans are sufficient to satisfy legal funding requirements. Effective January 1, 2002, the defined benefit pension plan was amended to exclude employees hired on or after January 1, 2002. Effective December 31, 2003, the Company froze all further benefit accruals under the defined benefit pension plan. Employees who already became participants in the defined benefit pension plan will, however, continue to receive credit for their future years of service for purposes of determining vesting in their accrued benefits and for purposes of determining their eligibility to receive benefits, such as early retirement, that are conditioned on the number of a participant's years of service.
F-19
The Company provides postretirement health care and life insurance benefits to retirees in the United States and certain employee groups outside the United States. Most employees and retirees outside the United States are covered by government health care programs. Effective January 1, 2002, the plan covering these benefits was amended to exclude employees hired on or after January 1, 2002. In October 2003, the Company approved additional changes to this plan. Employees, other than those in a limited grandfathered group, retiring after December 31, 2003 will not be eligible for retiree health care coverage.
The predecessor basis reflects a September 30 measurement date for financial statements prepared as of and for the period ended December 31, and a March 31 measurement date for financial statements prepared for the period ended June 30. The successor basis reflects a December 31 measurement date for financial statements prepared as of and for the period ended December 31.
The changes made to the plans during the second half of 2003 resulted in the curtailment of the plans. As required by SFAS Nos. 87, 106 and 141, the Company has recognized the effects of those actions in measuring the projected benefit obligation as part of purchase accounting. In addition, the changes in the intangible asset and accumulated other comprehensive income amounts that were related to the pension plan resulted from purchase accounting.
The components of net pension and postretirement costs are as follows:
| | Pension benefits | ||||||||||||||||||
|---|---|---|---|---|---|---|---|---|---|---|---|---|---|---|---|---|---|---|---|
| | Predecessor Basis | Successor Basis | |||||||||||||||||
| | Year ended December 31, | Three months Ended March 31, 2003 | Six months ended June 30, 2003 | Six months ended December 31, 2003 | Three months Ended March 31, 2004 | ||||||||||||||
| | 2001 | 2002 | |||||||||||||||||
| | | | (unaudited) | | | (unaudited) | |||||||||||||
| Service cost | $ | 8,604 | $ | 9,630 | $ | 2,742 | $ | 5,483 | $ | 8,809 | $ | — | |||||||
| Interest cost | 9,278 | 10,773 | 3,030 | 6,061 | 5,273 | 2,762 | |||||||||||||
| Expected return on plan assets | (11,415 | ) | (13,299 | ) | (3,531 | ) | (7,061 | ) | (6,340 | ) | (3,389 | ) | |||||||
| Amortization of transition obligation | 173 | 173 | 43 | 86 | — | — | |||||||||||||
| Amortization of prior service cost | 136 | 125 | 30 | 59 | — | — | |||||||||||||
| Recognized net actuarial (gain) loss | (567 | ) | 20 | 107 | 214 | — | — | ||||||||||||
| Net periodic cost (benefit) | $ | 6,209 | $ | 7,422 | $ | 2,421 | $ | 4,842 | $ | 7,742 | $ | (627 | ) | ||||||
| | Postretirement benefits | |||||||||||||||||
|---|---|---|---|---|---|---|---|---|---|---|---|---|---|---|---|---|---|---|
| | Predecessor Basis | | | |||||||||||||||
| | Successor Basis | |||||||||||||||||
| | Year ended December 31, | | | |||||||||||||||
| | Three months Ended March 31, 2003 | Six months ended June 30, 2003 | Six months ended December 31, 2003 | Three months Ended March 31, 2004 | ||||||||||||||
| | 2001 | 2002 | ||||||||||||||||
| | | | (unaudited) | | | (unaudited) | ||||||||||||
| Service cost | $ | 1,424 | $ | 1,774 | $ | 479 | $ | 955 | $ | 163 | $ | 82 | ||||||
| Interest cost | 2,248 | 2,900 | 841 | 1,681 | 834 | 418 | ||||||||||||
| Expected return on plan assets | — | — | — | — | — | — | ||||||||||||
| Amortization of transition obligation | — | — | — | — | — | — | ||||||||||||
| Amortization of prior service cost | (850 | ) | (850 | ) | (213 | ) | (425 | ) | — | — | ||||||||
| Recognized net actuarial (gain) loss | — | 82 | 114 | 228 | — | — | ||||||||||||
| Net periodic cost (benefit) | $ | 2,822 | $ | 3,906 | $ | 1,221 | $ | 2,439 | $ | 997 | $ | 500 | ||||||
F-20
The reconciliation of the beginning and ending balances of benefit obligations and fair value of plan assets, and the funded status of the plans are as follows:
| | Pension benefits | Postretirement benefits | ||||||||||||||||||
|---|---|---|---|---|---|---|---|---|---|---|---|---|---|---|---|---|---|---|---|---|
| | Predecessor Basis | Successor Basis | Predecessor Basis | Successor Basis | ||||||||||||||||
| | Year ended December 31, 2002 | Six months ended June 30, 2003 | Six months ended December 31, 2003 | Year ended December 31, 2002 | Six months ended June 30, 2003 | Six months ended December 31, 2003 | ||||||||||||||
| Change in benefit obligation: | ||||||||||||||||||||
| Benefit obligation at beginning of period | $ | 144,786 | $ | 181,629 | $ | 178,201 | $ | 39,298 | $ | 39,256 | $ | 28,902 | ||||||||
| Service cost | 9,630 | 5,483 | 8,809 | 1,774 | 955 | 163 | ||||||||||||||
| Interest cost | 10,773 | 6,061 | 5,273 | 2,900 | 1,681 | 834 | ||||||||||||||
| Actuarial loss (gain) | 20,458 | 44,467 | (9,065 | ) | (3,040 | ) | 8,718 | (445 | ) | |||||||||||
| Amendments | 27 | — | — | — | — | — | ||||||||||||||
| Benefits paid | (4,045 | ) | (2,611 | ) | (3,243 | ) | (1,676 | ) | (947 | ) | (1,605 | ) | ||||||||
| Benefit obligation at end of period | $ | 181,629 | $ | 235,029 | $ | 179,975 | $ | 39,256 | $ | 49,663 | $ | 27,849 | ||||||||
| Change in plan assets: | ||||||||||||||||||||
| Fair value of plan assets at beginning of period | $ | 126,251 | $ | 125,301 | $ | 142,490 | $ | — | $ | — | $ | — | ||||||||
| Actual return on plan assets | (7,037 | ) | 1,756 | 21,398 | — | — | — | |||||||||||||
| Employer contributions | 10,132 | 1,860 | 3,309 | 1,676 | 947 | 1,605 | ||||||||||||||
| Benefits paid | (4,045 | ) | (2,611 | ) | (3,243 | ) | (1,676 | ) | (947 | ) | (1,605 | ) | ||||||||
| Fair value of plan assets at end of period | $ | 125,301 | $ | 126,306 | $ | 163,954 | $ | — | $ | — | $ | — | ||||||||
| Reconciliation of funded status: | ||||||||||||||||||||
| Funded status | $ | (56,328 | ) | $ | (108,723 | ) | $ | (16,021 | ) | $ | (39,256 | ) | $ | (49,663 | ) | $ | (27,849 | ) | ||
| Unrecognized actuarial loss (gain) | 52,572 | 102,130 | (24,091 | ) | 1,811 | 10,301 | (444 | ) | ||||||||||||
| Unrecognized transition obligation | 346 | 259 | — | — | — | — | ||||||||||||||
| Unrecognized prior service cost | 1,887 | 1,827 | — | (7,560 | ) | (7,135 | ) | — | ||||||||||||
| Other | 430 | 1,681 | — | 435 | 838 | — | ||||||||||||||
| Net amount recognized | $ | (1,093 | ) | $ | (2,826 | ) | $ | (40,112 | ) | $ | (44,570 | ) | $ | (45,659 | ) | $ | (28,293 | ) | ||
| Amounts recognized in the consolidated balance sheets: | ||||||||||||||||||||
| Accrued benefit liability | $ | (9,831 | ) | $ | (40,112 | ) | ||||||||||||||
| Intangible asset | 2,233 | — | ||||||||||||||||||
| Accumulated other comprehensive income | 6,505 | — | ||||||||||||||||||
| Net amount recognized | $ | (1,093 | ) | $ | (40,112 | ) | ||||||||||||||
F-21
The weighted-average assumptions used to determine benefit obligations are as follows:
| | Pension benefits | Postretirement benefits | ||||||||||
|---|---|---|---|---|---|---|---|---|---|---|---|---|
| | Predecessor Basis | Successor Basis | Predecessor Basis | Successor Basis | ||||||||
| | December 2002 | June 2003 | December 2003 | December 2002 | June 2003 | December 2003 | ||||||
| Discount rate | 6.75% | 6.50% | 6.25% | 6.75% | 6.50% | 6.25% | ||||||
| Rate of compensation increase | 4.00% | 4.00% | — | — | — | — | ||||||
The weighted-average assumptions used to determine net periodic benefit cost are as follows:
| | Pension benefits | Postretirement benefits | ||||||||||||||
|---|---|---|---|---|---|---|---|---|---|---|---|---|---|---|---|---|
| | Predecessor Basis | Successor Basis | Predecessor Basis | Successor Basis | ||||||||||||
| | Year ended December 31, 2001 | Year ended December 31, 2002 | Six months ended June 30, 2003 | Six months ended December 31, 2003 | Year ended December 31, 2001 | Year ended December 31, 2002 | Six months ended June 30, 2003 | Six months ended December 31, 2003 | ||||||||
| Discount rate | 7.50% | 7.50% | 6.75% | 6.00% | 7.50% | 7.50% | 6.75% | 6.00% | ||||||||
| Rate of compensation increase | 4.50% | 4.50% | 4.00% | 4.00% | — | — | — | — | ||||||||
| Expected long-term rate of return on plan assets | 9.00% | 9.00% | 9.00% | 9.00% | — | — | — | — | ||||||||
For U.S. plans with accumulated benefit obligations in excess of plan assets, the projected benefit obligation, accumulated benefit obligation and fair value of plan assets were $179,975, $179,975 and $163,953, respectively, as of December 31, 2003 and $181,629, $135,561 and $125,301, respectively, as of December 31, 2002. The Company estimates that its pension plan contributions during the year ended December 31, 2004 will be approximately $3,187.
For postretirement benefits, the Company has not assumed a health care cost trend rate since the Company's benefit obligations are only at rate for medical inflation through 2003. Beyond 2003, participants will pay for substantially all of the full price increases in medical costs. The assumed health care cost trend rate used in measuring the health care portion of the postretirement cost for 2002 is 15% for medical and 6% for dental. Assumed health care cost trend rates have a significant effect on the amounts reported for postretirement benefits. A 1% increase in assumed health care cost trend rates would increase the total of the service and interest cost components for 2002 by $38 and the postretirement benefit obligation as of December 31, 2002 by $327. A 1% decrease in assumed health care cost trend rates would decrease the total of the service and interest cost components for 2002 by $38 and the postretirement benefit obligation as of December 31, 2002 by $327.
The Company determined its assumptions for the expected long-term rate of return on plan assets based on historical asset class returns, current market conditions, and long-term return analysis for global fixed income and equity markets. The Company considers the expected long-term rate of return on plan assets a longer-term assessment of return expectations and does not anticipate changing this assumption annually unless there are significant changes in economic conditions.
The Company's pension plan investment strategies are to maximize return within reasonable and prudent levels of risk in order to provide benefits to participants. The investment strategies are targeted to produce a total return that, when combined with the Company's contributions to the plan, will maintain the plan's ability to pay all benefit and expense obligations when due. Risk is controlled through diversification of asset types and investments in domestic and international equities, fixed income securities and cash. Investment risk is monitored on an ongoing basis through quarterly investment portfolio reviews. The target asset allocation is 75% equities and 25% debt securities. The
F-22
Company's pension plan weighted-average asset allocation by asset category based on asset fair values is as follows:
| | Percentage of Pension Plan Assets | ||||||
|---|---|---|---|---|---|---|---|
| | Predecessor Basis | Successor Basis | |||||
| Asset category | December 31, 2002 | June 30, 2003 | December 31, 2003 | ||||
| Equity securities | 64.5 | % | 63.5 | % | 75.2 | % | |
| Debt securities | 35.5 | % | 36.5 | % | 24.8 | % | |
| Total | 100.0 | % | 100.0 | % | 100.0 | % | |
The Company sponsors a number of defined contribution plans. Contributions are determined under various formulas. Costs related to such plans amounted to $2,466, and $2,450 for the years ended December 31, 2001 and 2002, respectively, $1,414 for the six months ended June 30, 2003 and $1,010 for the six months ended December 31, 2003.
In December 2003, the United States enacted into law the Medicare Prescription Drug, Improvement and Modernization Act of 2003 (the "Act"). The Act establishes a prescription drug benefit under Medicare, known as "Medicare Part D," and a federal subsidy to sponsors of retiree health care benefit plans that provide a benefit that is at least actuarially equivalent to Medicare Part D. In January 2004, the FASB issued FASB Staff Position No. 106-1. "Accounting and Disclosure Requirements Related to the Medicare Prescription Drug, Improvement and Modernization Act of 2003" ("FSP 106-1"). The Company has elected to defer accounting for the effects of the Act, as permitted by FSP 106-1. Therefore, in accordance with FSP 106-1, the Company's accumulated postretirement benefit obligation and net postretirement health care costs included in the consolidated financial statements and accompanying notes do not reflect the effects of the Act on the plan. Specific authoritative guidance on the accounting for the federal subsidy is pending, and that guidance, when issued, could require the Company to change previously reported information.
The Company reserves the right to modify or terminate its employee benefit plans as to all participants and beneficiaries at any time, except as restricted by the Internal Revenue Code or the Employee Retirement Income Security Act (ERISA).
7. Stock-Based Compensation
Under the Company's stock incentive plan, the Company offers restricted shares of its Common Stock and grants options to purchase shares of its Common Stock to selected management employees. The Company has reserved 12,580,000 shares of its Common Stock for issuance under the stock incentive plan. Up to 6,580,000 shares may be offered as restricted stock, and up to 6,000,000 shares may be subject to options. The options expire ten years from date of grant. The exercise price of any options granted or the purchase price for restricted stock offered under the stock incentive plan is determined by the Board of Directors.
The Company accounts for employee stock options and restricted shares of Common Stock in accordance with SFAS No. 123. The options granted in 2003 and the first quarter of 2004 consisted of "Series 1" and "Series 2" options. For the 2003 grants, the Series 1 options were issued with an initial exercise price of $2.11 per share, which will decrease to $0.32 per share in six month increments over a period of four and a half years from the grant date. The Series 2 options were issued with an initial exercise price of $7.30 per share, which will decrease to $5.29 per share in six month increments over a period of five years from the grant date. For the first quarter 2004 grants, the Series 1 options were issued with an initial exercise price of $1.95 per share, which will decrease to $0.32 per share in six-
F-23
month increments over a period of four years from the grant date. The Series 2 options were issued with an initial exercise price of $7.14 per share, which will decrease to $5.29 per share in six-month increments over a period of four and a half years from the grant date.
The per share weighted-average fair value of stock options granted in 2003 was $0.04 on the date of grant using the binomial option-pricing model with the following assumptions: expected dividend yield of 0%, risk-free interest rate of 2.74%, expected volatility of 0%, and an expected life of approximately five years. The per share weighted-average fair value of stock options granted during the first quarter of 2004 was $4.55 on the date of grant using the binomial option-pricing model with the following assumptions: expected dividend yield of 0%, risk-free interest rate of 2.95%, expected volatility of 0%, and an expected life of approximately five years. The stock options vest over five years, which is deemed to be the service period over which the stock-based compensation expense is recognized. The Company recognized stock-based compensation expense of $6 and $27 (unaudited) during the six months ended December 31, 2003 and the three months ended March 31, 2004, respectively, attributable to stock options.
�� Information concerning stock options issued to employees of the Company is presented in the following table. The weighted-average exercise price per share is given as of December 31, 2003 and March 31, 2004. None of the stock options were exercisable at December 31, 2003 and March 31, 2004. The weighted-average remaining contractual life was 9.6 years.
| | Series 1 | Series 2 | |||||||||
|---|---|---|---|---|---|---|---|---|---|---|---|
| | Number of Shares | Weighted-average exercise price | Number of shares | Weighted-average exercise price | |||||||
| Balance at June 30, 2003 | — | $ | — | — | $ | — | |||||
| Granted | 1,830,000 | 2.11 | 1,830,000 | 7.30 | |||||||
| Exercised | — | — | — | — | |||||||
| Forfeited | (18,000 | ) | 2.11 | (18,000 | ) | 7.30 | |||||
| Balance at December 31, 2003 | 1,812,000 | $ | 2.11 | 1,812,000 | $ | 7.30 | |||||
| Granted (unaudited) | 160,000 | 1.95 | 160,000 | 7.14 | |||||||
| Exercised (unaudited) | — | — | — | — | |||||||
| Forfeited (unaudited) | (95,000 | ) | 1.95 | (95,000 | ) | 7.14 | |||||
| Balance at March 31, 2004 (unaudited) | 1,877,000 | $ | 1.95 | 1,877,000 | $ | 7.14 | |||||
During 2003, the Company granted 4,018,000 restricted shares of its Class A Common Stock to certain members of the Partnership's management having an aggregate value of $1,283. These restricted shares vest over five years, which is deemed to be the service period over which the stock-based compensation expense is recognized. The Company recognized stock-based compensation expense of $128 and $64 (unaudited) during the six months ended December 31, 2003 and the three months ended March 31, 2004, respectively, attributable to restricted stock grants. During the first quarter of 2004, the Company entered into a series of restricted stock subscription agreements with certain members of the Partnership's management having an aggregate value of $12,938 (unaudited) for 1,587,500 restricted shares of Class A Common Stock. These restricted shares vest over approximately five years, which is deemed to be the service period over which the stock-based compensation expense is recognized. The Company recognized stock-based compensation expense of $86 (unaudited) during the three months ended March 31, 2004 attributable to restricted stock. Also during the first quarter of 2004, the Company entered into a stock subscription agreement with a member of the Partnership's management having a value of $819 (unaudited) for 100,512 shares of Class A Common Stock. Since there is no vesting or service period associated with these shares, the entire stock-based compensation expense for these shares was recognized during the first quarter of 2004.
F-24
8. Acquisition of Worldspan
On June 30, 2003, the Company indirectly acquired 100% of the outstanding partnership interests of Worldspan from affiliates of Delta, Northwest and American. The aggregate consideration for the Acquisition was $901,500, consisting of $817,500 in cash and the issuance by the Company of $84,000 of holding company subordinated seller notes payable by the Company to American and Delta. The resulting net aggregate consideration for the Acquisition was $837,766. The Acquisition has been accounted for as a purchase transaction in accordance with SFAS No. 141,Business Combinations.
The $109,788 excess of the purchase price over the estimated fair values of the net tangible assets and separately identifiable intangible assets of the Partnership was recorded as goodwill, which is expected to be tax deductible by the Company. The purchase price was allocated among tangible and intangible assets acquired and liabilities assumed based on estimated fair values at the transaction date. The following represents the allocation of the purchase price at the time of the acquisition:
| Current assets | $ | 178,756 | |||
| Property and equipment | 129,504 | ||||
| Deferred charges | 33,975 | ||||
| Other long-term assets | 59,901 | ||||
| Goodwill | 109,788 | ||||
| Other identifiable intangibles | 666,723 | ||||
| Current liabilities | (203,085 | ) | |||
| Pension and postretirement benefits | (64,067 | ) | |||
| Long-term portion of capital lease obligations | (62,640 | ) | |||
| Other long-term liabilities | (11,089 | ) | |||
| Allocated purchase price | $ | 837,766 | |||
The $109,788 of goodwill was allocated as follows: $96,677 to the electronic travel distribution segment and $13,111 to the information technology services segment.
Other identifiable intangibles acquired consist of the following:
| Asset | Fair Value | Estimated Useful Life | |||
|---|---|---|---|---|---|
| Supplier and agency relationships | $ | 321,618 | 8-11 years | ||
| Information technology services contracts | 36,126 | 5-15 years | |||
| Developed technology | 236,837 | 11 years | |||
| Tradename | 72,142 | Indefinite | |||
The weighted average life of acquired identifiable intangibles, subject to amortization, is approximately nine years. Goodwill and tradename are not amortized but will be tested for impairment on an annual basis or at an interim date if indicators of impairment exist.
The following unaudited financial information presents the results of operations of the Company as if the Acquisition had occurred at the beginning of each of the periods presented. Adjustments related to the Acquisition that affect the results of operations include the FASA credits, interest expense associated with the debt issued in conjunction with the Acquisition, depreciation of the step-up of fixed assets, amortization of the fair value of amortizing intangible assets, and the advisory fee payable to CVC. This pro forma information does not purport to be indicative of what would have
F-25
occurred had the Acquisition occurred as of January 1 or of results of operations that may occur in the future.
| | Predecessor Basis | | |||||||||||
|---|---|---|---|---|---|---|---|---|---|---|---|---|---|
| | Year ended December 31, | | | ||||||||||
| | Three months ended March 31, 2003 | Six months ended June 30, 2003 | |||||||||||
| | 2001 | 2002 | |||||||||||
| | | | (unaudited) | | |||||||||
| Revenues | $ | 855,020 | $ | 881,536 | $ | 226,012 | $ | 450,805 | |||||
| Net loss | $ | (61,973 | ) | $ | (19,768 | ) | $ | (3,800 | ) | $ | (16,979 | ) | |
9. Goodwill and Other Intangible Assets
Goodwill and other intangible assets consisted of the following:
| | | Predecessor Basis | Successor Basis | |||||||||||||||||
|---|---|---|---|---|---|---|---|---|---|---|---|---|---|---|---|---|---|---|---|---|
| | | December 31, 2002 | December 31, 2003 | March 31, 2004 | ||||||||||||||||
| | Estimated Useful Life | Cost | Accumulated Amortization | Cost | Accumulated Amortization | Cost | Accumulated Amortization | |||||||||||||
| | | | | | | (unaudited) | (unaudited) | |||||||||||||
| Supplier and agency relationships | 8-11 years | $ | — | $ | — | $ | 321,618 | $ | 16,866 | 321,618 | 25,299 | |||||||||
| Information technology services contracts | 5-15 years | — | — | 36,126 | 1,404 | 36,126 | 2,106 | |||||||||||||
| Developed technology | 5-11 years | 134,789 | 115,265 | 239,340 | 11,018 | 239,340 | 16,527 | |||||||||||||
| Goodwill | Indefinite | — | — | 109,740 | — | 109,788 | — | |||||||||||||
| Tradename | Indefinite | — | — | 72,142 | — | 72,142 | — | |||||||||||||
| $ | 134,789 | $ | 115,265 | $ | 778,966 | $ | 29,288 | $ | 779,014 | $ | 43,932 | |||||||||
The Company recorded amortization expense for its amortized intangible assets of $12,827 and $15,244, respectively, for the years ended December 31, 2001 and 2002, $7,358 and $29,288, respectively, for the six months ended June 30, 2003 and December 31, 2003 and $3,961 (unaudited) and $14,643 (unaudited), respectively, for the three months ended March 31, 2003 and 2004. Estimated amortization expense for the Company's intangible assets, excluding the $14,643 amortization recorded for the three months ended March 31, 2004, is as follows:
| Year ended December 31, | | |
|---|---|---|
| 2004 | 43,928 | |
| 2005 | 58,571 | |
| 2006 | 58,571 | |
| 2007 | 58,571 | |
| 2008 | 58,321 | |
| Thereafter | 275,191 | |
| 553,153 | ||
F-26
10. Debt
In conjunction with the Acquisition, Worldspan issued and sold $280,000 aggregate principal amount of 95/8% Senior Notes due 2011 ("Senior Notes") and borrowed $125,000 under the term loan facility portion of a senior credit facility due 2007 ("Term Loan"). The Senior Notes are subordinated to the Term Loan. The interest rate applicable to borrowings under the Term Loan is based on the LIBOR rate, or, at the Partnership's option, the higher of several other common indices. At March 31, 2004, the interest rate on the Term Loan was 4.85%. The Partnership is required to pay a commitment fee of 0.50% per annum on the difference between committed amounts and amounts actually utilized under the Term Loan.
At the closing of the Acquisition, the Company issued to American and Delta holding company subordinated seller notes due 2011 ("Seller Notes") in the original principal amounts of $39,000 and $45,000, respectively. The American and Delta Seller Notes bears interest at an annual rate of 12% and 10%, respectively. So long as Worldspan is not in default under, and is in compliance with all financial covenants of, the Term Loan and the indenture governing the Senior Notes and continues to maintain a fixed charge coverage ratio (as defined in the indenture) of 2.25x or better, the Company will pay interest equal to 5% of the outstanding principal amount of the Seller Notes in cash, with the remaining interest payable in cash or in kind at the Company's option.
Debt covenants require the Company to maintain certain financial ratios, including a minimum fixed charge coverage ratio, a minimum interest coverage ratio, a maximum senior secured leverage ratio and a maximum total leverage ratio. In addition, certain non-financial covenants restrict the activities of the Company. At December 31, 2003 and March 31, 2004, the Company was in compliance with these covenants.
Long-term debt consisted of the following:
| | Successor Basis | |||||
|---|---|---|---|---|---|---|
| | December 31, 2003 | March 31, 2004 | ||||
| | | (unaudited) | ||||
| Senior Notes | $ | 280,000 | $ | 280,000 | ||
| Term Loan | 113,000 | 86,000 | ||||
| Seller Notes | 86,490 | 86,490 | ||||
| 479,490 | 452,490 | |||||
| Less current portion of long-term debt | 8,000 | 12,250 | ||||
| Long-term debt, excluding current portion | $ | 471,490 | $ | 440,240 | ||
Long-term debt repayments are due as follows:
| Remaining in 2004 | $ | 6,000 | |
| 2005 | 25,000 | ||
| 2006 | 25,000 | ||
| 2007 | 30,000 | ||
| 2008 | — | ||
| Thereafter | 418,475 | ||
| $ | 504,475 | ||
F-27
11. Lines of Credit
The Partnership had a line of credit with one bank as of December 31, 2002 that was cancelled on June 30, 2003. This line of credit allowed the Partnership to borrow up to $50,000 at the following options: the bank's base rate or the euro option (LIBOR rate plus applicable bank margin). The line of credit required that the Partnership keep a minimum of $2,000 in a demand deposit account and $2,000 in an investment account. Commitment fees incurred on the unused portion of the line of credit were approximately $70 and $62 during 2001 and 2002, respectively.
On June 30, 2003, the Company entered into a syndicated revolving credit facility, which matures on June 30, 2007. This facility allows the Company to borrow up to $50,000 in revolving credit loans and standby letters of credit. The revolving loans have the following rate options: the bank's designated base rate, the euro rate or the euro base rate. Commitment fees incurred on the unused portion of the credit facility are payable quarterly in arrears at a rate of1/2 of 1% per annum and were $128 and $63 (unaudited) during the six months ended December 31, 2003 and the three months ended March 31, 2004, respectively.
12. Common and Preferred Stock
The Company is authorized to issue 330 shares of preferred stock, all of which is designated as Series A Preferred Stock. The Series A Preferred Stock has a par value of $0.01 per share and is entitled to annual dividends, if and when declared, which are cumulative and accrue at a rate of 10%, compounding semi-annually. The Series A Preferred Stock is senior to all common stock and has no voting rights. On or after June 30, 2013, each Series A Preferred Stock holder shall have the right, at such holder's option, to require the Company to repurchase such Series A Preferred Stock, in whole or in part, at a price per share of $1,000, plus accrued and unpaid dividends to the date of repurchase. The Company may redeem the Series A Preferred Stock at its option at any time at a price per share of $1,000, plus accrued and unpaid dividends to the date of redemption. Concurrently with an initial public offering of Common Stock, the Series A Preferred Stock may be converted into shares of Common Stock at the option of the Company. If the Company does not elect to convert all of the Series A Preferred Stock, the holders of Series A Preferred Stock may elect to convert their shares into Common Stock. The conversion rate for Series A Preferred Stock is equal to $1,000, plus accrued and unpaid dividends at the date of conversion, divided by the fair market value for Common Stock at the date of conversion.
The Company is authorized to issue 261,000 shares of common stock, consisting of (i) 125,000 shares of Common Stock with a par value of $0.01 per share, (ii) 11,000 shares of Class B Convertible Common Stock with a par value of $0.01 per share and (iii) 125,000 shares of Class C Convertible Common Stock with a par value of $0.01 per share. The holders of Common Stock are entitled to one vote per share on all matters submitted to a vote of the stockholders, and the holders of Class B Convertible Common Stock and Class C Convertible Common Stock are entitled to one vote per share on all matters submitted to a vote of the stockholders other than the election of directors. Holders of Common Stock may convert any or all of their shares into an equal number of shares of Class C Convertible Common Stock, and holders of Class B Convertible Common Stock or Class C Convertible Common Stock may convert any or all of their shares into an equal number of shares of Common Stock. The holders of Class B Convertible Common Stock are entitled to an annual special dividend equal to an aggregate amount of $600 per year for a period of ten years following the closing of the Acquisition. During the six months ended December 31, 2003, the Company declared and paid Class B Convertible Common Stock dividends of $450. As of December 31, 2003, all of the Class B Convertible Common Stock is held by OTPP.
F-28
13. Other Significant Events
Substantially all of TWA's assets, including its 26% interest in the Partnership, were sold to American during the first half of 2001. With this transaction, it was anticipated that the Partnership would no longer be providing the information technology services to TWA after the migration of TWA off of the Worldspan GDS. This migration was completed in December 2001. For the year ended December 31, 2001, information technology services billed to TWA was $16,261. As a result of the financial impact of the pending TWA migration, the Partnership announced a workforce reduction in February 2001. The total charge recorded for the reduction, which affected approximately 220 employees, was $7,350, all of which was for severance and benefits This amount is included in "Selling, general and administrative" expenses in the accompanying consolidated statements of income. Most of these payments were made during 2001. At December 31, 2002, there was no remaining liability associated with this workforce reduction.
In October 2001, the Partnership announced an additional workforce reduction. This reduction was a result of decreased travel, and related booking volumes, caused by the events of September 11, 2001. The total charge recorded for this reduction, which affected approximately 200 employees, was $7,160, all of which was for severance and benefits. This amount is included in "Selling, general and administrative" expenses in the accompanying consolidated statements of income. At December 31, 2002, there was no remaining liability associated with this workforce reduction.
In December 2001, the Partnership recorded a charge of $8,199 as a result of Delta's and Northwest's discontinued participation in a subscriber incentive program. This program was structured such that Delta, Northwest and TWA contributed, in the aggregate, approximately 40% of the total anticipated annual cost of the program. This annual contribution was paid by the Partners over a 36-month period, which was intended to correlate with the subscribers' usage of their incentives. When the Partner participation in the program was discontinued, the Partnership recorded a fourth quarter 2001 charge to write-off the asset associated with the outstanding payments.
In November 2002, the Partnership announced a voluntary severance program. The total charge recorded for this workforce reduction, which affected approximately 130 employees, was $6,143, all of which was for severance and benefits. This amount is included in "Selling, general and administrative" expenses in the accompanying consolidated statements of income. At December 31, 2002 and 2003, the remaining liability associated with this workforce reduction was $5,899 and $0, respectively.
In April 2003, the Partnership announced a workforce reduction, which included both a voluntary and an involuntary program. This reduction was a result of decreased travel, and related booking volumes, caused by several factors including the war in Iraq, concerns over SARS and the weakened economy. The total charge recorded for this workforce reduction, which affected approximately 200 employees, was $4,600, all of which was for severance and benefits. This amount is included in "Selling, general and administrative" expenses in the accompanying consolidated statements of income. The $4,600 charge included $3,987 for the electronic travel distribution segment and $613 for the information technology services segment. At December 31, 2003, there was no remaining liability associated with this workforce reduction.
Upon the closing of the Acquisition, certain members of management received change-in-control payments. The total charge recorded was approximately $17,259.
During the first quarter of 2004, the Company announced a workforce reduction. This reduction was the result of improved organizational efficiency and the outsourcing of programming for certain applications. The total charge recorded for this workforce reduction, which affected approximately 125 employees, was $1,290 (unaudited), all of which was for severance and benefits. This amount is included in "Selling, general and administrative" expenses in the accompanying consolidated statements of income. The $1,290 (unaudited) charge included $960 (unaudited) for the electronic travel
F-29
distribution segment and $330 (unaudited) for the information technology services segment. At March 31, 2004, the remaining liability associated with this workforce reduction was $230 (unaudited).
14. Income Taxes
The income tax provision is as follows:
| | | | | | ||||||||||
|---|---|---|---|---|---|---|---|---|---|---|---|---|---|---|
| | Predecessor Basis | | ||||||||||||
| | Successor Basis | |||||||||||||
| | Year ended December 31, | | ||||||||||||
| | Six months ended June 30, 2003 | Six months ended December 31, 2003 | ||||||||||||
| | 2001 | 2002 | ||||||||||||
| Current provision: | ||||||||||||||
| Federal | $ | 968 | $ | — | $ | — | $ | — | ||||||
| State | — | — | — | — | ||||||||||
| Foreign | (1,858 | ) | 1,258 | 144 | 989 | |||||||||
| Total current | (890 | ) | 1,258 | 144 | 989 | |||||||||
| Deferred provision: | ||||||||||||||
| Federal | — | — | — | — | ||||||||||
| State | — | — | — | — | ||||||||||
| Foreign | — | — | — | — | ||||||||||
| Total deferred | — | — | — | — | ||||||||||
| Total provision for income taxes | $ | (890 | ) | $ | 1,258 | $ | 144 | $ | 989 | |||||
The provision for income taxes relating to continuing operations differs from amounts computed at the statutory federal income tax rate as follows:
| | | | | | |||||||||
|---|---|---|---|---|---|---|---|---|---|---|---|---|---|
| | Predecessor Basis | | |||||||||||
| | Successor Basis | ||||||||||||
| | Year ended December 31, | | |||||||||||
| | Six months ended June 30, 2003 | Six months ended December 31, 2003 | |||||||||||
| | 2001 | 2002 | |||||||||||
| Statutory federal income tax rate | $ | — | $ | — | $ | — | $ | (6,300 | ) | ||||
| State income tax rate, net of federal tax benefit | — | — | — | (588 | ) | ||||||||
| Permanent differences at statutory rates | 968 | — | — | 202 | |||||||||
| Change in valuation allowance | — | — | — | 7,478 | |||||||||
| Foreign tax rate different than U.S. statutory rate | (1,858 | ) | 1,258 | 144 | 197 | ||||||||
| $ | (890 | ) | $ | 1,258 | $ | 144 | $ | 989 | |||||
F-30
The deferred tax assets resulted from temporary differences associated with the following:
| �� | Predecessor Basis | Successor Basis | |||||||
|---|---|---|---|---|---|---|---|---|---|
| | December 31, 2002 | December 31, 2003 | |||||||
| Employee benefit plans | $ | — | $ | 28,164 | |||||
| Net operating loss carryforwards | 137 | 12,772 | |||||||
| Accrued expenses | — | 12,140 | |||||||
| Depreciation and amortization | 4,274 | 6,113 | |||||||
| Other | 1,401 | 2,603 | |||||||
Total deferred tax assets | 5,812 | 61,792 | |||||||
Valuation allowance | (5,812 | ) | (61,792 | ) | |||||
Net deferred tax asset | $ | — | $ | — | |||||
As a result of the Company's acquisition of all of the outstanding partnership interests in Worldspan, the Company recorded a deferred tax asset of approximately $54,314. This deferred tax asset represents the net tax benefit of the potential future tax deductions of the temporary differences related to the assets and liabilities contributed. Certain of the Company's foreign subsidiaries have recorded a deferred tax asset primarily as a result of temporary differences in depreciation. Because the Company has experienced a three-year history of net operating losses on a pro-forma basis, we do not believe that it is more likely than not that the Company will be able to utilize the deferred tax assets. Accordingly, a full valuation allowance has been recorded with respect to these assets.
As of December 31, 2003, the Company has net operating loss carryforwards of approximately $34,087 that will begin expiring in 2023.
Federal income taxes in the amount of $968 were paid in 2001 for a Foreign Sales Corporation that was wholly owned by Worldspan. No provision for U.S. federal and state income taxes was recorded during the years ended December 31, 2001 and 2002 or the six months ended June 30, 2003, as such liability was the responsibility of our founding airlines, rather than of Worldspan. No current provision for U.S. federal and state income taxes was recorded for the six months ended December 31, 2003 as there was no taxable income. During the quarter, ended March 31, 2004, the Company recognized pre-tax book earnings. As such, a provision for U.S. federal and state income taxes would ordinarily have been recorded; however, the net operating losses carried forward into the quarter are sufficient to eliminate any taxable income. If a cash payment had been required for the three months ended March 31, 2004, the Company would have received distributions from Worldspan sufficient to fund its income tax liabilities, as permitted by the senior credit facility and the indenture governing the senior notes.
Undistributed earnings of the Company's foreign subsidiaries amounted to approximately $2,357 at December 31, 2003. Those earnings are considered to be indefinitely reinvested, and accordingly, no provision for U.S. federal and state income taxes and foreign withholding taxes have been made. Upon distribution of those earnings, the Company would be subject to U.S. income taxes (subject to a reduction for foreign tax credits) and the Company would be subject to withholding taxes payable to the various foreign countries. Determination of the amount of unrecognized deferred U.S. income tax liability is not practicable; however, unrepatriated foreign tax credit amounts would be available to reduce some portion of the U.S. liability. Withholding taxes of approximately $161 would be payable upon remittance of all previously unremitted earnings at December 31, 2003.
F-31
15. Commitments and Contingencies
The Company has operating lease agreements which are principally for software, equipment and office facilities. Rent expense relating to these lease agreements was approximately $30,918 and $41,863 for the years ended December 31, 2001 and 2002, respectively, and approximately $31,585 and $35,288 for the six months ended June 30, 2003 and December 31, 2003, respectively.
The Company leases equipment under noncancelable capital lease obligations. Under these arrangements, an asset and liability are recorded at the lower of the present value of the minimum lease payments or the fair market value of the asset. The interest rate used in computing the present value of the minimum lease payments ranges from approximately 4.0% to 12.0% depending on the asset being leased. The annual lease payments under capital lease obligations are allocated between a reduction in the liability and interest payments using the effective interest method.
Future minimum lease payments under noncancelable operating leases and capital leases at December 31, 2003 are as follows:
| | Operating | Capital | |||||
|---|---|---|---|---|---|---|---|
| 2004 | $ | 53,464 | $ | 21,287 | |||
| 2005 | 46,373 | 18,343 | |||||
| 2006 | 45,278 | 15,756 | |||||
| 2007 | 45,998 | 7,152 | |||||
| 2008 | 25,048 | 4,864 | |||||
| Thereafter | 28,105 | 45,547 | |||||
| Total | $ | 244,266 | 112,949 | ||||
| Less amount representing interest | (41,811 | ) | |||||
| Present value of net minimum lease payments | 71,138 | ||||||
| Less current maturities | (16,136 | ) | |||||
| Long-term maturities | $ | 55,002 | |||||
The Company has an Asset Management Offering agreement with IBM (the "IBM AMO"), expiring in 2008, that enables the Company to integrate additional IBM technology into the Company's growing line of travel solutions. The Company has accounted for the IBM AMO as a multiple element arrangement of hardware, software, and services. Under the terms of the agreement, the Company has a remaining aggregate minimum commitment of $272,815 at December 31, 2003, plus additional contingent payments dependent upon the rate of growth of electronic travel distribution transaction volumes. Of the minimum amount, approximately $185,401 represents future minimum lease payments for leases classified as operating at December 31, 2003 and approximately $17,112 represents future minimum lease payments for leases classified as capital at December 31, 2003. These amounts have been reflected above in the future minimum lease payments under noncancelable operating leases and capital leases at December 31, 2003. The remaining $70,302 represents the Company's future commitment for various other technology and service elements of the arrangement at December 31, 2003.
F-32
The future minimum amounts payable under the IBM AMO are as follows at December 31, 2003:
| | Total IBM AMO | IBM AMO Operating Leases at December 31, 2003 | IBM AMO Capital Leases at December 31, 2003 | ||||||
|---|---|---|---|---|---|---|---|---|---|
| 2004 | $ | 68,600 | $ | 42,726 | $ | 6,171 | |||
| 2005 | 58,300 | 39,820 | 3,239 | ||||||
| 2006 | 60,702 | 40,789 | 3,091 | ||||||
| 2007 | 59,342 | 41,367 | 3,080 | ||||||
| 2008 | 25,871 | 20,699 | 1,531 | ||||||
| $ | 272,815 | $ | 185,401 | $ | 17,112 | ||||
The payment stream of the IBM AMO is such that in the earlier years, the payments required under the agreement exceed the value of the technology and service elements received. This prepaid element at December 31, 2003 of $14,689 is included in "Other long-term assets" in the accompanying consolidated balance sheet.
In March 2004, the Company entered into an agreement to purchase data network services for the Company's U.S. and Canadian offices and travel agency customers that expires in 2007. In addition, the agreement includes voice services for the Company's U.S. and Canadian offices. The minimum commitment over the term of the agreement is $30.0 million.
During 1998, the Partnership filed suit against Abacus Distribution Systems Pte Ltd. ("Abacus") for fraud, breach of contract and misappropriation of the Partnership's trade secrets and a separate action against Sabre Holdings Corporation ("Sabre") for tortious interference, misappropriation of the Partnership's trade secrets and other claims. In August 2000, a Tribunal of arbitrators in London acting under the authority of the International Chamber of Commerce found in favor of the Partnership in its proceedings against Abacus and granted joint and several monetary damages and costs to the Partnership of approximately $39,557 (included in "Other, net" in the accompanying consolidated statements of operations), which was paid by Abacus in 2000. Abacus filed a counterclaim against the Partnership, which has been dismissed. In 1998, the Partnership initiated a lawsuit against Sabre and other Sabre-affiliated entities for claims arising from the termination of the Partnership's relationship with Abacus. In June 2002, the Partnership's claims against Sabre were pending before the U.S. District Court for the Northern District of Georgia and the U.S. Court of Appeals for the Eleventh Circuit. On June 18, 2002 the Partnership and Sabre executed a Settlement Agreement containing a mutual release of all pending claims. The settlement was paid in full by Sabre in July 2002. In addition, the Partnership is currently involved in various claims related to matters arising from the ordinary course of business. Management believes the ultimate disposition of these actions will not materially affect the financial position or results of operations of the Partnership.
In September 2003, the Company received multiple assessments totaling €39,503 from the tax authorities of Greece relating to tax years 1993-2000. The Company is currently in the process of filing appeals of these assessments, the outcome of which is currently uncertain. The Partnership Interest Purchase Agreement, dated March 3, 2003, provides that each of our founding airlines shall severally indemnify Company and hold Company harmless on a net after-tax basis from and against any and all taxes of Worldspan and its subsidiaries related to periods prior to the sale of the Partnership on June 30, 2003. The Company has informed our founding airlines of the receipt of these assessments and the indemnity obligation of our founding airlines under the Partnership Interest Purchase Agreement. Because of this indemnity, the Company believes that amounts paid, if any, to settle this assessment will be reimbursed by our founding airlines and will not have an effect on the Company's financial position or results of operations.
In January 2004, the Company received notice of a class action suit filed in the U.S. District Court in St. Paul, Minnesota in which the Company initially was one of the named defendants and which
F-33
alleges violations of various laws relating to privacy. These allegations arise from disclosures by Northwest of passenger data to a U.S. government agency, a series of events that transpired in 2001 or 2002. The Company has informed our founding airlines of the filing of this suit and the indemnity obligation of our founding airlines under the Partnership Interest Purchase Agreement. Due to this indemnity and following the analysis of the facts and the law in the case, the Company believes that any amounts paid in this matter will not have a material impact upon the Company's business, financial position or results of operations. An amended and consolidated class action lawsuit was recently refiled in this case, and the Company is no longer a named defendant in this matter. The Company is evaluating whether there is any future liability arising from this matter.
During 2003, the Company exercised its right to terminate an agreement with a technology provider. This termination is effective October 2004. As a result of the termination, the Company recorded a second quarter 2003 charge of $2,604, which represents the Company's contractual commitment for the period November 2004 to October 2006. During the fourth quarter 2003, the Company terminated its remaining relationship with this technology provider. The Company recorded an additional charge of $2,084, which represents the Company's contractual commitment for the period December 2003 to October 2004.
16. Business Segment Information
The Company's operations are classified into two reportable business segments: electronic travel distribution and information technology services. The Company's two reportable business segments are managed separately based on fundamental differences in their operations. In addition, each business segment offers different products and services. The electronic travel distribution segment distributes travel services of its associates to subscribers of the Worldspan GDS. By having access to the Worldspan GDS, subscribers are able to book reservations with the associates. The information technology services segment provides technology services to Delta and Northwest and other companies in the travel industry.
F-34
The Company evaluates performance and allocates resources based on operating income. The accounting policies of the reportable segments are the same as those described in the summary of significant accounting policies. There are no intersegment sales.
| | Predecessor Basis | | | ||||||||||||||||||
|---|---|---|---|---|---|---|---|---|---|---|---|---|---|---|---|---|---|---|---|---|---|
| | Year ended December 31, | | | Successor Basis | |||||||||||||||||
| | 2001 | 2002 | Three months ended March 31, 2003 | Six months ended June 30, 2003 | Six months ended December 31, 2003 | Three months ended March 31, 2004 | |||||||||||||||
| | | | (unaudited) | | | (unaudited) | |||||||||||||||
| Revenues | |||||||||||||||||||||
| Electronic travel distribution | $ | 762,304 | $ | 807,095 | $ | 206,944 | $ | 414,933 | $ | 396,488 | $ | 232,539 | |||||||||
| Information technology services | 126,049 | 107,774 | 27,401 | 52,539 | 32,974 | 15,992 | |||||||||||||||
| Total revenues | $ | 888,353 | $ | 914,869 | $ | 234,345 | $ | 467,472 | $ | 429,462 | $ | 248,531 | |||||||||
| Operating income | |||||||||||||||||||||
| Electronic travel distribution | $ | 74,369 | $ | 105,855 | $ | 24,735 | $ | 45,803 | $ | 27,069 | $ | 36,437 | |||||||||
| Information technology services | 6,209 | 6,112 | 2,519 | 3,700 | (18,919 | ) | (9,141 | ) | |||||||||||||
| Total operating income | $ | 80,578 | $ | 111,967 | $ | 27,254 | $ | 49,503 | $ | 8,150 | $ | 27,296 | |||||||||
| Depreciation and amortization | |||||||||||||||||||||
| Electronic travel distribution | $ | 68,703 | $ | 65,828 | $ | 14,036 | $ | 26,701 | $ | 42,888 | $ | 20,483 | |||||||||
| Information technology services | 14,722 | 13,387 | 3,110 | 5,621 | 10,067 | 4,580 | |||||||||||||||
| Total depreciation and amortization | $ | 83,425 | $ | 79,215 | $ | 17,146 | $ | 32,322 | $ | 52,955 | $ | 25,063 | |||||||||
| Geographic areas | |||||||||||||||||||||
| Total revenues | |||||||||||||||||||||
| United States | $ | 762,960 | $ | 786,244 | $ | 202,453 | $ | 406,854 | $ | 362,104 | $ | 213,207 | |||||||||
| Foreign | 125,393 | 128,625 | 31,892 | 60,618 | 67,358 | 35,324 | |||||||||||||||
| Total | $ | 888,353 | $ | 914,869 | $ | 234,345 | $ | 467,472 | $ | 429,462 | $ | 248,531 | |||||||||
| Long-lived assets | |||||||||||||||||||||
| United States | $ | 187,300 | $ | 167,486 | $ | 173,912 | $ | 173,362 | $ | 917,633 | $ | 915,842 | |||||||||
| Foreign | 39,900 | 33,602 | 32,872 | 31,772 | 31,365 | 32,590 | |||||||||||||||
| Total | $ | 227,200 | $ | 201,088 | $ | 206,784 | $ | 205,134 | $ | 948,998 | $ | 948,432 | |||||||||
F-35
17. Supplemental Guarantor/Non-Guarantor Financial Information
Concurrent with the closing of the Acquisition discussed in Note 8, the Senior Notes became fully and unconditionally guaranteed on a senior unsecured basis by the domestic operations and assets of the Partnership (referred to as "Worldspan, L.P.—Guarantor" in the accompanying financial information). Included in Worldspan, L.P—Guarantor are Worldspan, L.P. and all of its wholly-owned domestic subsidiaries including WS Financing Corp. These domestic subsidiaries collectively represent less than one percent of the Partnership's total assets, Partners' capital, total revenues, net income, and cash flows from operating activities. The guarantees of each of the legal entities comprised by Worldspan, L.P.—Guarantor are joint and several. The foreign subsidiaries (referred to as "Non-Guarantor Subsidiaries" in the accompanying financial information) represent the foreign operations of the Partnership. WS Financing Corp., the co-issuer, was established June 6, 2003. WS Financing Corp. does not have any substantial operations, assets or revenues. The following financial information presents condensed consolidating balance sheets, statements of operations and statements of cash flows for Worldspan, L.P—Guarantor and Non-Guarantor Subsidiaries. The information has been presented as if Worldspan, L.P—Guarantor accounted for its ownership of the Non-Guarantor Subsidiaries using the equity method of accounting.
F-36
Condensed Consolidating Balance Sheets
as of December 31, 2002
(Predecessor Basis)
| | Worldspan, L.P. Guarantor | Non-Guarantor Subsidiaries | Eliminating Entries | WTI Consolidated | ||||||||||
|---|---|---|---|---|---|---|---|---|---|---|---|---|---|---|
| Assets | ||||||||||||||
| Current assets | ||||||||||||||
| Cash and cash equivalents | $ | 125,140 | $ | 6,961 | $ | — | $ | 132,101 | ||||||
| Trade accounts receivable, net | 60,986 | 1,805 | — | 62,791 | ||||||||||
| Related party accounts receivable, net | 34,933 | — | — | 34,933 | ||||||||||
| Prepaid expenses and other current assets | 20,320 | 2,664 | — | 22,984 | ||||||||||
| Total current assets | 241,379 | 11,430 | — | 252,809 | ||||||||||
| Property and equipment, less accumulated depreciation | 105,987 | 9,623 | — | 115,610 | ||||||||||
| Deferred charges | 19,413 | 16,507 | — | 35,920 | ||||||||||
| Other intangible assets, net | 19,524 | — | — | 19,524 | ||||||||||
| Investments | 5,053 | 1,812 | — | 6,865 | ||||||||||
| Investments in subsidiaries | 9,154 | — | (9,154 | ) | — | |||||||||
| Other long-term assets | 18,478 | 5,660 | — | 24,138 | ||||||||||
| Total assets | $ | 418,988 | $ | 45,032 | $ | (9,154 | ) | $ | 454,866 | |||||
Liabilities and Partners' Capital | ||||||||||||||
| Current liabilities | ||||||||||||||
| Accounts payable | $ | 16,708 | $ | 1,794 | $ | — | $ | 18,502 | ||||||
| Intercompany accounts payable (receivable) | (10,203 | ) | 10,203 | — | — | |||||||||
| Accrued expenses | 121,804 | 23,804 | — | 145,608 | ||||||||||
| Current portion of capital lease obligations | 25,868 | — | — | 25,868 | ||||||||||
| Total current liabilities | 154,177 | 35,801 | — | 189,978 | ||||||||||
| Long-term portion of capital lease obligations | 67,688 | — | — | 67,688 | ||||||||||
| Pension and postretirement benefits | 54,401 | — | — | 54,401 | ||||||||||
| Other long-term liabilities | 7,120 | 77 | — | 7,197 | ||||||||||
| Total liabilities | 283,386 | 35,878 | — | 319,264 | ||||||||||
| Commitments and contingencies | ||||||||||||||
| Partners' capital | 135,602 | 9,154 | (9,154 | ) | 135,602 | |||||||||
| Total liabilities and Partners' capital | $ | 418,988 | $ | 45,032 | $ | (9,154 | ) | $ | 454,866 | |||||
F-37
Condensed Consolidating Balance Sheets
as of December 31, 2003
(Successor Basis)
| | WTI | Worldspan, L.P. Guarantor | Non-Guarantor Subsidiaries | Eliminating Entries | WTI Consolidated | |||||||||||||
|---|---|---|---|---|---|---|---|---|---|---|---|---|---|---|---|---|---|---|
| Assets | ||||||||||||||||||
| Current assets | ||||||||||||||||||
| Cash and cash equivalents | $ | 100 | $ | 41,615 | $ | 2,131 | $ | — | $ | 43,846 | ||||||||
| Trade accounts receivable, net | — | 100,593 | 2,529 | — | 103,122 | |||||||||||||
| Prepaid expenses and other current assets | — | 21,422 | 2,207 | (150 | ) | 23,479 | ||||||||||||
| Total current assets | 100 | 163,630 | 6,867 | (150 | ) | 170,447 | ||||||||||||
| Property and equipment, less accumulated depreciation | — | 113,321 | 7,189 | — | 120,510 | |||||||||||||
| Deferred charges | — | 17,472 | 16,072 | — | 33,544 | |||||||||||||
| Debt issuance costs, net | — | 13,626 | — | — | 13,626 | |||||||||||||
| Goodwill | — | 109,740 | — | — | 109,740 | |||||||||||||
| Other intangible assets, net | — | 639,938 | — | — | 639,938 | |||||||||||||
| Investments | — | 5,064 | 1,313 | — | 6,377 | |||||||||||||
| Investments in subsidiaries | 416,552 | 7,845 | — | (424,397 | ) | — | ||||||||||||
| Other long-term assets | — | 18,472 | 6,791 | — | 25,263 | |||||||||||||
| Total assets | $ | 416,652 | $ | 1,089,108 | $ | 38,232 | $ | (424,547 | ) | $ | 1,119,445 | |||||||
Liabilities, Series A Preferred Stock Subject to Mandatory Redemption, Stockholders' Equity and Partners' Capital | ||||||||||||||||||
| Current liabilities | ||||||||||||||||||
| Accounts payable | $ | — | $ | 16,933 | $ | 2,742 | $ | — | $ | 19,675 | ||||||||
| Intercompany accounts payable (receivable) | — | (1,226 | ) | 1,226 | — | — | ||||||||||||
| Accrued expenses | 325 | 117,944 | 26,471 | (150 | ) | 144,590 | ||||||||||||
| Current portion of capital lease obligations | — | 16,136 | — | — | 16,136 | |||||||||||||
| Current portion of long-term debt | — | 8,000 | — | — | 8,000 | |||||||||||||
| Total current liabilities | 325 | 157,787 | 30,439 | (150 | ) | 188,401 | ||||||||||||
| Long-term portion of capital lease obligations | — | 55,002 | — | — | 55,002 | |||||||||||||
| Long-term debt | 86,490 | 385,000 | — | — | 471,490 | |||||||||||||
| Pension and postretirement benefits | — | 68,439 | (34 | ) | — | 68,405 | ||||||||||||
| Other long-term liabilities | — | 6,328 | (18 | ) | — | 6,310 | ||||||||||||
| Total liabilities | 86,815 | 672,556 | 30,387 | (150 | ) | 789,608 | ||||||||||||
| Commitments and contingencies | ||||||||||||||||||
Series A Preferred Stock subject to mandatory redemption | 336,000 | — | — | — | 336,000 | |||||||||||||
Stockholders' equity | ||||||||||||||||||
| Common Stock, $0.01 par; 125,000,000 shares authorized; 83,000,001 shares issued and outstanding | 830 | — | — | — | 830 | |||||||||||||
| Class B Convertible Common Stock, $0.01 par; 11,000,000 shares authorized, issued and outstanding | 110 | — | — | — | 110 | |||||||||||||
| Class C Convertible Common Stock, $0.01 par; 125,000,000 shares authorized; no shares issued or outstanding | — | — | — | — | — | |||||||||||||
| Additional paid in capital—common stock | 12,610 | — | — | — | 12,610 | |||||||||||||
| Deferred compensation | (1,154 | ) | — | — | — | (1,154 | ) | |||||||||||
| Retained deficit | (18,559 | ) | — | — | — | (18,559 | ) | |||||||||||
| Total stockholders' equity | (6,163 | ) | — | — | — | (6,163 | ) | |||||||||||
| Partners' capital | — | 416,552 | 7,845 | (424,397 | ) | — | ||||||||||||
| Total liabilities, Series A preferred stock subject to mandatory redemption, stockholders' equity and Partners' capital | $ | 416,652 | $ | 1,089,108 | $ | 38,232 | $ | (424,547 | ) | $ | 1,119,445 | |||||||
F-38
Condensed Consolidating Balance Sheets
as of March 31, 2004
(Successor Basis)
(unaudited)
| | WTI | Worldspan, L.P. Guarantor | Non-Guarantor Subsidiaries | Eliminating Entries | WTI Consolidated | |||||||||||||
|---|---|---|---|---|---|---|---|---|---|---|---|---|---|---|---|---|---|---|
| Assets | ||||||||||||||||||
| Current assets | ||||||||||||||||||
| Cash and cash equivalents | $ | 983 | $ | 30,610 | $ | 1,494 | $ | — | $ | 33,087 | ||||||||
| Trade accounts receivable, net | 225 | 139,188 | 2,853 | (225 | ) | 142,041 | ||||||||||||
| Prepaid expenses and other current assets | 1,336 | 10,912 | 3,099 | — | 15,347 | |||||||||||||
| Total current assets | 2,544 | 180,710 | 7,446 | (225 | ) | 190,475 | ||||||||||||
| Property and equipment, less accumulated depreciation | — | 130,792 | 6,614 | — | 137,406 | |||||||||||||
| Deferred charges | — | 17,391 | 17,508 | — | 34,899 | |||||||||||||
| Debt issuance costs, net | — | 12,419 | — | — | 12,419 | |||||||||||||
| Goodwill | — | 109,788 | — | — | 109,788 | |||||||||||||
| Other intangible assets, net | — | 625,295 | — | — | 625,295 | |||||||||||||
| Investments | — | 4,803 | 1,312 | — | 6,115 | |||||||||||||
| Investments in subsidiaries | 432,971 | 9,423 | — | (442,394 | ) | — | ||||||||||||
| Other long-term assets | — | 15,354 | 7,156 | — | 22,510 | |||||||||||||
| Total assets | $ | 435,515 | $ | 1,105,975 | $ | 40,036 | $ | (442,619 | ) | $ | 1,138,907 | |||||||
Liabilities, Series A Preferred Stock Subject to Mandatory Redemption, Stockholders' Equity and Partners' Capital | ||||||||||||||||||
| Current liabilities | ||||||||||||||||||
| Accounts payable | $ | 494 | $ | 17,171 | $ | 787 | $ | — | $ | 18,452 | ||||||||
| Intercompany accounts payable (receivable) | — | (2,339 | ) | 2,339 | — | — | ||||||||||||
| Accrued expenses | 2,538 | 132,317 | 27,495 | (225 | ) | 162,125 | ||||||||||||
| Current portion of capital lease obligations | — | 20,107 | — | — | 20,107 | |||||||||||||
| Current portion of long-term debt | — | 12,250 | — | — | 12,250 | |||||||||||||
| Total current liabilities | 3,032 | 179,506 | 30,621 | (225 | ) | 212,934 | ||||||||||||
| Long-term portion of capital lease obligations | — | 67,045 | — | — | 67,045 | |||||||||||||
| Long-term debt | 86,490 | 353,750 | — | — | 440,240 | |||||||||||||
| Pension and postretirement benefits | — | 66,001 | (42 | ) | — | 65,959 | ||||||||||||
| Other long-term liabilities | 1,284 | 6,702 | 34 | — | 8,020 | |||||||||||||
| Total liabilities | 90,806 | 673,004 | 30,613 | (225 | ) | 794,198 | ||||||||||||
| Commitments and contingencies | ||||||||||||||||||
Series A Preferred Stock subject to mandatory redemption | 344,734 | — | — | — | 344,734 | |||||||||||||
Stockholders' equity | ||||||||||||||||||
| Common Stock, $0.01 par; 125,000,000 shares authorized; 83,000,001 shares issued and outstanding | 830 | — | — | — | 830 | |||||||||||||
| Class B Convertible Common Stock, $0.01 par; 11,000,000 shares authorized, issued and outstanding | 110 | — | — | — | 110 | |||||||||||||
| Class C Convertible Common Stock, $0.01 par; 125,000,000 shares authorized; no shares issued or outstanding | — | — | — | — | — | |||||||||||||
| Additional paid in capital—common stock | 18,062 | — | — | — | 18,062 | |||||||||||||
| Deferred compensation | (13,942 | ) | — | — | — | (13,942 | ) | |||||||||||
| Retained deficit | (5,085 | ) | — | — | — | (5,085 | ) | |||||||||||
| Total stockholders' equity | (25 | ) | — | — | — | (25 | ) | |||||||||||
| Partners' capital | — | 432,971 | 9,423 | (442,394 | ) | — | ||||||||||||
| Total liabilities, Series A preferred stock subject to mandatory redemption, stockholders' equity and Partners' capital | $ | 435,515 | $ | 1,105,975 | $ | 40,036 | $ | (442,619 | ) | $ | 1,138,907 | |||||||
F-39
Condensed Consolidating Statements of Operations
for the Year Ended December 31, 2001
(Predecessor Basis)
| | Worldspan, L.P. Guarantor | Non-Guarantor Subsidiaries | Eliminating Entries | WTI Consolidated | |||||||||||
|---|---|---|---|---|---|---|---|---|---|---|---|---|---|---|---|
| Revenues | $ | 762,960 | $ | 125,393 | $ | — | $ | 888,353 | |||||||
| Operating expenses | 678,184 | 129,591 | — | 807,775 | |||||||||||
| Operating income (loss) | 84,776 | (4,198 | ) | — | 80,578 | ||||||||||
| Other income (expense) | |||||||||||||||
| Interest income | 5,671 | 141 | — | 5,812 | |||||||||||
| Interest expense | (6,515 | ) | — | — | (6,515 | ) | |||||||||
| Gain on sale of marketable securities | 9,148 | — | — | 9,148 | |||||||||||
| Equity in loss of investees, net | (2,141 | ) | — | — | (2,141 | ) | |||||||||
| Write-down of impaired investments | (9,346 | ) | (10,438 | ) | — | (19,784 | ) | ||||||||
| Loss from subsidiaries | (13,712 | ) | — | 13,712 | — | ||||||||||
| Other, net | (3,744 | ) | (1,075 | ) | — | (4,819 | ) | ||||||||
| Total other expense, net | (20,639 | ) | (11,372 | ) | 13,712 | (18,299 | ) | ||||||||
| Income (loss) before income taxes | 64,137 | (15,570 | ) | 13,712 | 62,279 | ||||||||||
| Income tax expense (benefit) | 968 | (1,858 | ) | — | (890 | ) | |||||||||
| Net income (loss) | $ | 63,169 | $ | (13,712 | ) | $ | 13,712 | $ | 63,169 | ||||||
Condensed Consolidating Statements of Operations
for the Year Ended December 31, 2002
(Predecessor Basis)
| | Worldspan, L.P. Guarantor | Non-Guarantor Subsidiaries | Eliminating Entries | WTI Consolidated | |||||||||||
|---|---|---|---|---|---|---|---|---|---|---|---|---|---|---|---|
| Revenues | $ | 786,244 | $ | 128,625 | $ | — | $ | 914,869 | |||||||
| Operating expenses | 673,417 | 129,485 | — | 802,902 | |||||||||||
| Operating income (loss) | 112,827 | (860 | ) | — | 111,967 | ||||||||||
| Other income (expense) | |||||||||||||||
| Interest income | 1,949 | 136 | — | 2,085 | |||||||||||
| Interest expense | (5,477 | ) | (4 | ) | — | (5,481 | ) | ||||||||
| Equity in gain of investee, net | 68 | — | — | 68 | |||||||||||
| Write-down of impaired investments | (5,080 | ) | (5,250 | ) | — | (10,330 | ) | ||||||||
| Loss from subsidiaries | (6,236 | ) | — | 6,236 | — | ||||||||||
| Other, net | 6,768 | 1,000 | — | 7,768 | |||||||||||
| Total other expense, net | (8,008 | ) | (4,118 | ) | 6,236 | (5,890 | ) | ||||||||
| Income (loss) before income taxes | 104,819 | (4,978 | ) | 6,236 | 106,077 | ||||||||||
| Income tax expense | — | 1,258 | — | 1,258 | |||||||||||
| Net income (loss) | $ | 104,819 | $ | (6,236 | ) | $ | 6,236 | $ | 104,819 | ||||||
F-40
Condensed Consolidating Statements of Operations
for the Three Months Ended March 31, 2003
(Predecessor Basis)
(unaudited)
| | Worldspan, L.P. Guarantor | Non-Guarantor Subsidiaries | Eliminating Entries | WTI Consolidated | |||||||||||
|---|---|---|---|---|---|---|---|---|---|---|---|---|---|---|---|
| Revenues | $ | 202,453 | $ | 31,892 | $ | — | $ | 234,345 | |||||||
| Operating expenses | 173,775 | 33,316 | — | 207,091 | |||||||||||
| Operating income(loss) | 28,678 | (1,424 | ) | — | 27,254 | ||||||||||
| Other income (expense) | |||||||||||||||
| Interest income | 227 | 24 | — | 251 | |||||||||||
| Interest expense | (1,368 | ) | — | — | (1,368 | ) | |||||||||
| Equity in gain of investee, net | 3 | — | — | 3 | |||||||||||
| Loss from subsidiaries | (1,516 | ) | — | 1,516 | — | ||||||||||
| Other, net | (722 | ) | (59 | ) | — | (781 | ) | ||||||||
| Total other expense, net | (3,376 | ) | (35 | ) | 1,516 | (1,895 | ) | ||||||||
| Income (loss) before income taxes | 25,302 | (1,459 | ) | 1,516 | 25,359 | ||||||||||
| Income tax expense | — | 57 | — | 57 | |||||||||||
| Net income (loss) | $ | 25,302 | $ | (1,516 | ) | $ | 1,516 | $ | 25,302 | ||||||
Condensed Consolidating Statements of Operations
for the Six Months Ended June 30, 2003
(Predecessor Basis)
| | Worldspan, L.P. Guarantor | Non-Guarantor Subsidiaries | Eliminating Entries | WTI Consolidated | |||||||||||
|---|---|---|---|---|---|---|---|---|---|---|---|---|---|---|---|
| Revenues | $ | 406,854 | $ | 60,618 | $ | — | $ | 467,472 | |||||||
| Operating expenses | 351,447 | 66,522 | — | 417,969 | |||||||||||
| Operating income (loss) | 55,407 | (5,904 | ) | — | 49,503 | ||||||||||
| Other income (expense) | |||||||||||||||
| Interest income | 360 | 41 | — | 401 | |||||||||||
| Interest expense | (2,756 | ) | — | — | (2,756 | ) | |||||||||
| Equity in gain of investee, net | 130 | — | — | 130 | |||||||||||
| Loss from subsidiaries | (5,632 | ) | — | 5,632 | — | ||||||||||
| Change-in-control expense | (17,259 | ) | — | — | (17,259 | ) | |||||||||
| Other, net | (1,836 | ) | 375 | — | (1,461 | ) | |||||||||
| Total other expense, net | (26,993 | ) | 416 | 5,632 | (20,945 | ) | |||||||||
| Income (loss) before income taxes | 28,414 | (5,488 | ) | 5,632 | 28,558 | ||||||||||
| Income tax expense | — | 144 | — | 144 | |||||||||||
| Net income (loss) | $ | 28,414 | $ | (5,632 | ) | $ | 5,632 | $ | 28,414 | ||||||
F-41
Condensed Consolidating Statements of Operations
for the Six Months Ended December 31, 2003
(Successor Basis)
| | WTI | Worldspan, L.P. Guarantor | Non-Guarantor Subsidiaries | Eliminating Entries | WTI Consolidated | |||||||||||||
|---|---|---|---|---|---|---|---|---|---|---|---|---|---|---|---|---|---|---|
| Revenues | $ | 750 | $ | 362,104 | $ | 67,358 | $ | (750 | ) | $ | 429,462 | |||||||
| Operating expenses | 450 | 359,014 | 62,598 | (750 | ) | 421,312 | ||||||||||||
| Operating income | 300 | 3,090 | 4,760 | — | 8,150 | |||||||||||||
| Other income (expense) | ||||||||||||||||||
| Interest income | — | 186 | 109 | — | 295 | |||||||||||||
| Interest expense | (4,590 | ) | (20,891 | ) | — | — | (25,481 | ) | ||||||||||
| Equity in gain of investee | — | 278 | — | — | 278 | |||||||||||||
| Write-down of impaired investments | — | (732 | ) | (500 | ) | — | (1,232 | ) | ||||||||||
| Income from subsidiaries | (14,700 | ) | 5,375 | — | 9,325 | — | ||||||||||||
| Other, net | — | (2,006 | ) | 1,995 | — | (11 | ) | |||||||||||
| Total other income (expense), net | (19,290 | ) | (17,790 | ) | 1,604 | 9,325 | (26,151 | ) | ||||||||||
| Income before income taxes | (18,990 | ) | (14,700 | ) | 6,364 | 9,325 | (18,001 | ) | ||||||||||
| Income tax expense | — | — | 989 | — | 989 | |||||||||||||
| Net income | $ | (18,990 | ) | $ | (14,700 | ) | $ | 5,375 | $ | 9,325 | $ | (18,990 | ) | |||||
Consdensed Consolidating Statements of Operations
for the Three Months Ended March 31, 2004
(Successor Basis)
(unaudited)
| | WTI | Worldspan, L.P. Guarantor | Non-Guarantor Subsidiaries | Eliminating Entries | WTI Consolidated | |||||||||||||
|---|---|---|---|---|---|---|---|---|---|---|---|---|---|---|---|---|---|---|
| Revenues | $ | 375 | $ | 213,207 | $ | 35,324 | $ | (375 | ) | $ | 248,531 | |||||||
| Operating expenses | 470 | 187,830 | 33,310 | (375 | ) | 221,235 | ||||||||||||
| Operating income | (95 | ) | 25,377 | 2,014 | — | 27,296 | ||||||||||||
| Other income (expense) | ||||||||||||||||||
| Interest income | — | 44 | 55 | — | 99 | |||||||||||||
| Interest expense | (2,366 | ) | (10,794 | ) | — | — | (13,160 | ) | ||||||||||
| Equity in loss of investee | — | (50 | ) | — | — | (50 | ) | |||||||||||
| Income from subsidiaries | 16,152 | 1,579 | — | (17,731 | ) | — | ||||||||||||
| Other, net | — | (7 | ) | (258 | ) | — | (265 | ) | ||||||||||
| Total other income (expense) | 13,786 | (9,228 | ) | (203 | ) | (17,731 | ) | (13,376 | ) | |||||||||
| Income before income taxes | 13,691 | 16,149 | 1,811 | (17,731 | ) | 13,920 | ||||||||||||
| Income tax expense | — | (3 | ) | 232 | — | 229 | ||||||||||||
| Net income | $ | 13,691 | $ | 16,152 | $ | 1,579 | $ | (17,731 | ) | $ | 13,691 | |||||||
F-42
Condensed Consolidating Statements of Cash Flows
for the Year Ended December 31, 2001
(Predecessor Basis)
| | Worldspan, L.P. Guarantor | Non-Guarantor Subsidiaries | Eliminating Entries | WTI Consolidated | |||||||||||
|---|---|---|---|---|---|---|---|---|---|---|---|---|---|---|---|
| Net cash provided by operating activities | $ | 148,673 | $ | 12,533 | $ | — | $ | 161,206 | |||||||
| Cash flows from investing activities: | |||||||||||||||
| Purchase of property and equipment | (15,184 | ) | (7,153 | ) | — | (22,337 | ) | ||||||||
| Proceeds from sale of property and equipment | 779 | — | — | 779 | |||||||||||
| Capitalized software development costs | (3,613 | ) | — | — | (3,613 | ) | |||||||||
| Purchase of investments | (4,871 | ) | (4,500 | ) | — | (9,371 | ) | ||||||||
| Proceeds from sale of investment | 9,148 | — | — | 9,148 | |||||||||||
| Investments in subsidiaries | (3,174 | ) | — | 3,174 | — | ||||||||||
| Net cash used in investing activities | (16,915 | ) | (11,653 | ) | 3,174 | (25,394 | ) | ||||||||
| Cash flows from financing activities: | |||||||||||||||
| Distribution to Partners | (175,000 | ) | — | — | (175,000 | ) | |||||||||
| Principal payments on capital leases | (16,046 | ) | — | — | (16,046 | ) | |||||||||
| Contributions to subsidiaries | — | 3,174 | (3,174 | ) | — | ||||||||||
| Net cash (used in) provided by financing activities | (191,046 | ) | 3,174 | (3,174 | ) | (191,046 | ) | ||||||||
| Net (decrease) increase in cash and cash equivalents | (59,288 | ) | 4,054 | — | (55,234 | ) | |||||||||
| Cash and cash equivalents at beginning of year | 139,688 | 1,487 | — | 141,175 | |||||||||||
| Cash and cash equivalents at end of year | $ | 80,400 | $ | 5,541 | $ | — | $ | 85,941 | |||||||
F-43
Condensed Consolidating Statements of Cash Flows
for the Year Ended December 31, 2002
(Predecessor Basis)
| | Worldspan, L.P. Guarantor | Non-Guarantor Subsidiaries | Eliminating Entries | WTI Consolidated | ||||||||||
|---|---|---|---|---|---|---|---|---|---|---|---|---|---|---|
| Net cash provided by operating activities | $ | 182,666 | $ | 4,083 | $ | — | $ | 186,749 | ||||||
| Cash flows from investing activities: | ||||||||||||||
| Purchase of property and equipment | (9,355 | ) | (3,020 | ) | — | (12,375 | ) | |||||||
| Proceeds from sale of property and equipment | 559 | — | — | 559 | ||||||||||
| Capitalized software development costs | (3,056 | ) | — | (3,056 | ) | |||||||||
| Purchase of investments | (327 | ) | — | — | (327 | ) | ||||||||
| Investments in subsidiaries | (357 | ) | — | 357 | — | |||||||||
| Net cash used in investing activities | (12,536 | ) | (3,020 | ) | 357 | (15,199 | ) | |||||||
| Cash flows from financing activities: | ||||||||||||||
| Distribution to Partners | (100,000 | ) | — | — | (100,000 | ) | ||||||||
| Principal payments on capital leases | (25,390 | ) | — | — | (25,390 | ) | ||||||||
| Contributions to subsidiaries | — | 357 | (357 | ) | — | |||||||||
| Net cash (used in) provided by financing activities | (125,390 | ) | 357 | (357 | ) | (125,390 | ) | |||||||
| Net increase in cash and cash equivalents | 44,740 | 1,420 | — | 46,160 | ||||||||||
| Cash and cash equivalents at beginning of year | 80,400 | 5,541 | — | 85,941 | ||||||||||
| Cash and cash equivalents at end of year | $ | 125,140 | $ | 6,961 | $ | — | $ | 132,101 | ||||||
F-44
Condensed Consolidating Statements of Cash Flows
for the Three Months Ended March 31, 2003
(Predecessor Basis)
(unaudited)
| | Worldspan, L.P.— Guarantor | Non-Guarantor Subsidiaries | Eliminating Entries | WTI Consolidated | |||||||||||
|---|---|---|---|---|---|---|---|---|---|---|---|---|---|---|---|
| Net cash provided by operating activities | $ | 6,318 | $ | (1,898 | ) | $ | — | $ | 4,420 | ||||||
| Cash flows from investing activities: | |||||||||||||||
| Purchase of property and equipment | (6,399 | ) | (1,175 | ) | — | (7,574 | ) | ||||||||
| Proceeds from sale of property and equipment | 146 | — | — | 146 | |||||||||||
| Capitalized software development costs | (1,036 | ) | — | — | (1,036 | ) | |||||||||
| Investments in subsidiaries | (55 | ) | — | 55 | — | ||||||||||
| Net cash used in investing activities | (7,344 | ) | (1,175 | ) | 55 | (8,464 | ) | ||||||||
| Cash flows from financing activities: | |||||||||||||||
| Distribution to Partners | (60,000 | ) | — | — | (60,000 | ) | |||||||||
| Principal payments on capital leases | (7,014 | ) | — | — | (7,014 | ) | |||||||||
| Contributions to subsidiaries | — | 55 | (55 | ) | — | ||||||||||
| Net cash (used in) provided by financing activities | (67,014 | ) | 55 | (55 | ) | (67,014 | ) | ||||||||
| Net decrease in cash and cash equivalents | (68,040 | ) | (3,018 | ) | — | (71,058 | ) | ||||||||
| Cash and cash equivalents at beginning of year | 125,140 | 6,961 | — | 132,101 | |||||||||||
| Cash and cash equivalents at end of year | $ | 57,100 | 3,943 | $ | — | $ | 61,043 | ||||||||
Condensed Consolidating Statements of Cash Flows
for the Six Months Ended June 30, 2003
(Predecessor Basis)
| | Worldspan, L.P. Guarantor | Non-Guarantor Subsidiaries | Eliminating Entries | WTI Consolidated | |||||||||||
|---|---|---|---|---|---|---|---|---|---|---|---|---|---|---|---|
| Net cash provided by (used in) operating activities | $ | 44,815 | $ | (3,792 | ) | $ | — | $ | 41,023 | ||||||
| Cash flows from investing activities: | |||||||||||||||
| Purchase of property and equipment | (2,102 | ) | (2,134 | ) | — | (4,236 | ) | ||||||||
| Proceeds from sale of property and equipment | 396 | — | — | 396 | |||||||||||
| Capitalized software development costs | (1,367 | ) | — | — | (1,367 | ) | |||||||||
| Investments in subsidiaries | (55 | ) | — | 55 | — | ||||||||||
| Net cash used in investing activities | (3,128 | ) | (2,134 | ) | 55 | (5,207 | ) | ||||||||
| Cash flows from financing activities: | |||||||||||||||
| Distribution to Partners | (110,000 | ) | — | — | (110,000 | ) | |||||||||
| Principal payments on capital leases | (13,986 | ) | — | — | (13,986 | ) | |||||||||
| Contributions to subsidiaries | — | 55 | (55 | ) | — | ||||||||||
| Net cash (used in) provided by financing activities | (123,986 | ) | 55 | (55 | ) | (123,986 | ) | ||||||||
| Net decrease in cash and cash equivalents | (82,299 | ) | (5,871 | ) | — | (88,170 | ) | ||||||||
| Cash and cash equivalents at beginning of period | 125,140 | 6,961 | — | 132,101 | |||||||||||
| Cash and cash equivalents at end of period | $ | 42,841 | $ | 1,090 | $ | — | $ | 43,931 | |||||||
F-45
Condensed Consolidating Statements of Cash Flows
for the Six Months Ended December 31, 2003
(Successor basis)
| | WTI | Worldspan, L.P. Guarantor | Non-Guarantor Subsidiaries | Eliminating Entries | WTI Consolidated | ||||||||||||
|---|---|---|---|---|---|---|---|---|---|---|---|---|---|---|---|---|---|
| Net cash provided by operating activities | $ | (16,041 | ) | $ | 47,123 | $ | 3,805 | $ | 14,565 | $ | 49,452 | ||||||
| Cash flows from investing activities: | |||||||||||||||||
| Purchase of property and equipment | — | (14,307 | ) | (1,654 | ) | — | (15,961 | ) | |||||||||
| Proceeds from sale of property and equipment | — | 75 | — | — | 75 | ||||||||||||
| Capitalized software development costs | — | (1,395 | ) | — | — | (1,395 | ) | ||||||||||
| Investments in subsidiaries | (330,322 | ) | 1,109 | — | 329,213 | — | |||||||||||
| Net cash used in investing activities | (330,322 | ) | (14,518 | ) | (1,654 | ) | 329,213 | (17,281 | ) | ||||||||
| Cash flows from financing activities: | |||||||||||||||||
| Payments to our founding airlines | — | (702,846 | ) | — | — | (702,846 | ) | ||||||||||
| Equity contribution from Parent, net of transaction costs | — | 306,967 | — | (347,007 | ) | (40,040 | ) | ||||||||||
| Distribution to Partners | — | (2,120 | ) | — | 2,120 | — | |||||||||||
| Proceeds from issuance of debt, net of debt issuance costs | — | 390,063 | — | — | 390,063 | ||||||||||||
| Proceeds of issuance of common and preferred stock | 346,913 | — | — | — | 346,913 | ||||||||||||
| Cash dividends paid | (450 | ) | — | — | — | (450 | ) | ||||||||||
| Principal payments on capital leases | — | (13,896 | ) | — | — | (13,896 | ) | ||||||||||
| Principal payments on debt | — | (12,000 | ) | — | — | (12,000 | ) | ||||||||||
| Contributions to subsidiaries | — | — | (1,109 | ) | 1,109 | — | |||||||||||
| Net cash (used in) provided by financing activities | 346,463 | (33,832 | ) | (1,109 | ) | (343,778 | ) | (32,256 | ) | ||||||||
| Net (decrease) increase in cash and cash equivalents | 100 | (1,227 | ) | 1,042 | — | (85 | ) | ||||||||||
| Cash and cash equivalents at beginning of period | — | 42,841 | 1,090 | — | 43,931 | ||||||||||||
| Cash and cash equivalents at end of period | $ | 100 | $ | 41,614 | $ | 2,132 | $ | — | $ | 43,846 | |||||||
F-46
Condensed Consolidating Statements of Cash Flows
for the Three Months Ended March 31, 2004
(Successor Basis)
(unaudited)
| | WTI | Worldspan, L.P.— Guarantor | Non-Guarantor Subsidiaries | Eliminating Entries | WTI Consolidated | |||||||||||||
|---|---|---|---|---|---|---|---|---|---|---|---|---|---|---|---|---|---|---|
| Net cash provided by operating activities | $ | 16,188 | $ | 25,256 | $ | (1,582 | ) | $ | (16,220 | ) | $ | 23,642 | ||||||
| Cash flows from investing activities: | ||||||||||||||||||
| Purchase of property and equipment | — | (2,228 | ) | (634 | ) | — | (2,862 | ) | ||||||||||
| Proceeds from sale of property and equipment | — | 20 | — | — | 20 | |||||||||||||
| Investments in subsidiaries | (15,651 | ) | (1,579 | ) | — | 17,230 | — | |||||||||||
| Net cash used in investing activities | (15,651 | ) | (3,787 | ) | (634 | ) | 17,230 | (2,842 | ) | |||||||||
| Cash flows from financing activities: | ||||||||||||||||||
| Distribution to Partners | — | (569 | ) | — | 569 | — | ||||||||||||
| Principal payments on capital leases | — | (4,905 | ) | — | — | (4,905 | ) | |||||||||||
| Principal payments on debt | — | (27,000 | ) | — | — | (27,000 | ) | |||||||||||
| Proceeds from issuance of common and preferred stock | 380 | — | — | — | 380 | |||||||||||||
| Cash dividends paid | (34 | ) | — | — | — | (34 | ) | |||||||||||
| Contributions to subsidiaries | — | — | 1,579 | (1,579 | ) | — | ||||||||||||
| Net cash (used in) provided by financing activities | 346 | (32,474 | ) | 1,579 | (1,010 | ) | (31,559 | ) | ||||||||||
| Net increase (decrease) in cash and cash equivalents | 883 | (11,005 | ) | (637 | ) | — | (10,759 | ) | ||||||||||
| Cash and cash equivalents at beginning of year | 100 | 41,615 | 2,131 | — | 43,846 | |||||||||||||
| Cash and cash equivalents at end of year | $ | 983 | $ | 30,610 | $ | 1,494 | $ | — | $ | 33,087 | ||||||||
18. Subsequent Event (unaudited)
On May 5, 2004, the Company announced that it had been informed by Expedia that Expedia intends to move a portion of its transactions to another GDS provider in order to diversify its GDS relationships beyond using a single provider to process substantially all of its GDS transactions.
F-47
Shares
PROSPECTUS
, 2004
| Joint Book-Running Managers | ||
Lehman Brothers | JPMorgan | |
Goldman, Sachs & Co. | UBS Investment Bank | |
CIBC World Markets | RBC Capital Markets | |
PART II
INFORMATION NOT REQUIRED IN PROSPECTUS
ITEM 13. OTHER EXPENSES OF ISSUANCE AND DISTRIBUTION.
The following table sets forth the various expenses, other than the underwriting discounts and commissions, payable by us in connection with the sale and distribution of the securities being registered. All amounts shown are estimates, except the Securities and Exchange Commission registration fee and the listing fees.
| Securities and Exchange Commission registration fee | $ | 94,391.50 | ||
| NASD filing fee | 30,500.00 | |||
| New York Stock Exchange application fee | * | |||
| Blue sky qualification fees and expenses | * | |||
| Printing and engraving expenses | * | |||
| Legal fees and expenses | * | |||
| Accounting fees and expenses | * | |||
| Transfer agent and registrar fees | * | |||
| Miscellaneous expenses | * | |||
| Total | $ | |||
- *
- To be completed by amendment.
ITEM 14. INDEMNIFICATION OF DIRECTORS AND OFFICERS.
Indemnification: Section 145 of the Delaware General Corporation Law provides that a corporation may indemnify directors and officers as well as other employees and individuals against expenses (including attorneys' fees), judgments, fines and amounts paid in settlement actually and reasonably incurred by such person in connection with any threatened, pending or completed actions, suits or proceedings in which such person is made a party by reason of such person being or having been a director, officer, employee of or agent to Worldspan Technologies Inc. The statute provides that it is not exclusive of other rights to which those seeking indemnification may be entitled under any bylaw, agreement, vote of stockholders or disinterested directors or otherwise. Worldspan Technologies Inc.'s bylaws provide for indemnification by Worldspan Technologies Inc. of any director or officer (as such term is defined in the bylaws) of Worldspan Technologies Inc. or a constituent corporation absorbed in a consolidation or merger, or any person who, at the request of Worldspan Technologies Inc. or a constituent corporation, is or was serving as a director or officer of, or in any other capacity for, any other enterprise, except to the extent that such indemnification is prohibited by law. The bylaws also provide that Worldspan Technologies Inc. shall advance expenses incurred by a director or officer in defending a proceeding prior to the final disposition of such proceeding. The board of directors, by majority vote of a quorum consisting of directors not parties to the proceeding, must determine whether the applicable standards of any applicable statute have been met. The bylaws do not limit Worldspan Technologies Inc.'s ability to provide other indemnification and expense reimbursement rights to directors, officers, employees, agents and other persons otherwise than pursuant to the bylaws. Worldspan Technologies Inc. may purchase insurance covering the potential liabilities of the directors and officers of Worldspan Technologies Inc. or any constituent corporations or any person who, at the request of Worldspan Technologies Inc. or a constituent corporation, is or was serving as a director or officer of, or in any other capacity for, any other enterprise.
Limitation of Liability: Section 102(b)(7) of the Delaware General Corporation Law permits a corporation to provide in its certificate of incorporation that a director of the corporation shall not be personally liable to the corporation or its stockholders for monetary damages for breach of fiduciary duty as a director, except for liability (i) for any breach of the director's duty of loyalty to the corporation or its stockholders, (ii) for acts or omissions not in good faith or which involve intentional
II-1
misconduct or a knowing violation of law, (iii) for payments of unlawful dividends or unlawful stock repurchases or redemptions, or (iv) for any transaction from which the director derived an improper personal benefit. Worldspan Technologies Inc.'s certificate of incorporation provides for such limitation of liability.
ITEM 15. RECENT SALES OF UNREGISTERED SECURITIES.
Stock Subscription Agreements
On June 30, 2003, we entered into separate stock subscription agreements with CVC (and certain of its affiliates and certain members of its management), OTPP and certain directors and employees of the Company. Pursuant to these agreements, an aggregate of 83,000,001 shares of Common Stock, and 11,000,000 shares of Class B Convertible Common Stock, were sold at a price of $0.319 per share, for an aggregate purchase price of $27,700,326. Under these same agreements an aggregate of 319,999.999 shares of Series A Preferred Stock were sold at a price of $1,000.00 per share for an aggregate purchase price of approximately $320.0 million. These securities were deemed exempt from registration under the Securities Act in reliance on Rule 506 promulgated thereunder.
On November 19, 2003, we entered into a series of restricted stock subscription agreements under which executive officers of ours purchased an aggregate of 610,000 shares of Common Stock at a price of approximately $0.319 per share, for an aggregate purchase price of $194,681. On December 31, 2003, we entered into a restricted stock subscription agreement under which an executive officer of ours purchased an aggregate of 170,000 shares of Common Stock at a price of approximately $0.319 per share, for an aggregate purchase price of $54,255. On March 17, 2004, we entered into a series of restricted stock subscription agreements under which executive officers of ours purchased an aggregate of 1,587,499 shares of Common Stock at a price of approximately $0.319 per share, for an aggregate purchase price of $506,648.62. The shares purchased pursuant to these agreements are restricted, and therefore not alienable for five years from the date of purchase, subject to certain exceptions for re-sale to us. These restrictions shall lapse as to 20% of the shares held by each holder on the first five anniversaries of the agreement. These securities were exempt from registration under the Securities Act in reliance on Rule 701 promulgated thereunder as transactions pursuant to compensatory benefit plans and contracts relating to compensation. The recipients of securities in each such transaction represented their intention to acquire the securities for investment only and not with a view to or for sale in connection with any distribution thereof and appropriate legends were affixed to the share certificates and other instruments issued in such transactions.
On March 26, 2004, we entered into a stock subscription agreement under which an officer of ours purchased 100,512 shares of Common Stock and 367.922 shares of Series A Preferred Stock, for an aggregate purchase price of $400,000. Also on March 26, 2004, we entered into a stock subscription agreement in connection with the exercise by an executive officer of ours of his option to purchase 125,640 shares of Common Stock and 459.902 shares of Series A Preferred Stock for an aggregate purchase price of $534,106.21. Both of these sales were exempt from registration under the Securities Act in reliance on Rule 506 promulgated thereunder.
Stock Options
From time to time we issued stock options and shares of our Common Stock upon the exercise of stock options granted under our stock incentive plan prior to the time we became subject to the reporting requirements of the Exchange Act. These securities were deemed exempt from registration under the Securities Act in reliance on Rule 701 promulgated thereunder as transactions pursuant to compensatory benefit plans and contracts relating to compensation. The recipients of securities in each such transaction represented their intention to acquire the securities for investment only and not with a view to or for sale in connection with any distribution thereof and appropriate legends were affixed to the share certificates and other instruments issued in such transactions.
II-2
There were no underwriters employed in connection with any of the transactions set forth in this Item 15.
ITEM 16. EXHIBITS AND FINANCIAL STATEMENT SCHEDULES.
- (a)
- Exhibits
The following exhibits are filed herewith unless otherwise indicated:
| 1.1 | Underwriting Agreement* | |
| 2.1 | Partnership Interest Purchase Agreement, dated as of March 3, 2003, among Delta Air Lines, Inc., NWA Inc., American Airlines, Inc., NewCRS Limited, Inc., Worldspan, L.P. and Worldspan Technologies Inc., as amended(1) | |
| 3.1 | Amended and Restated Certificate of Incorporation of Worldspan Technologies Inc.* | |
| 3.2 | Bylaws of Worldspan Technologies Inc.* | |
| 4.1 | Indenture, dated as of June 30, 2003, among WS Merger LLC, WS Financing Corp., the guarantors as named therein and The Bank of New York, as trustee.(1) | |
| 4.2 | Form of 95/8% Senior Note Due 2011 (included in Exhibit 4.1).(1) | |
| 4.3 | Registration Rights Agreement, dated as of June 30, 2003, by and among WS Merger LLC, WS Financing Corp., the guarantors named therein, Lehman Brothers Inc., Deutsche Bank Securities Inc., Citigroup Global Markets Inc. and J.P. Morgan Securities Inc.(1) | |
| 5.1 | Opinion of Dechert LLP* | |
| 10.1 | Credit Agreement, dated as of June 30, 2003, among Worldspan Technologies Inc., WS Holdings LLC, Worldspan, L.P., the Several banks and other financial institutions or entities from time to time parties thereto, Lehman Brothers Inc., as sole and exclusive advisor, Lehman Brothers Inc. and Deutsche Bank Securities Inc., as joint lead arrangers and joint book runners, Deutsche Bank Securities Inc., as syndication agent, JPMorgan Chase Bank, Citicorp North America, Inc. and Dymas Funding Company, LLC, as documentation agents, and Lehman Commercial Paper Inc., as administrative agent.(1) | |
| 10.2 | Stockholders Agreement, dated as of June 30, 2003, among Worldspan Technologies Inc., Citigroup Venture Capital Equity Partners, L.P., CVC Executive Fund LLC, CVC/SSB Employee Fund, L.P., Court Square Capital Limited, Ontario Teachers' Pension Plan Board and the other stockholders as named therein.(1) | |
| 10.3 | Registration Rights Agreement, dated as of June 30, 2003, among Worldspan Technologies Inc., Citigroup Venture Capital Equity Partners, L.P., CVC Executive Fund LLC, CVC/SSB Employee Fund, L.P., Court Square Capital Limited, Ontario Teachers' Pension Plan Board and the other stockholders as named therein.(1) | |
| 10.4 | Delta Founder Airline Services Agreement, dated as of June 30, 2003, by and between Delta Air Lines, Inc. and Worldspan, L.P.(1)*** | |
| 10.5 | Northwest Founder Airline Services Agreement, dated as of June 30, 2003, by and between Northwest Airlines, Inc. and Worldspan, L.P.(1)*** | |
| 10.6 | American Airlines Collateral Services Agreement, dated as of June 30, 2003, by and between American Airlines, Inc. and Worldspan, L.P.(1)*** | |
| 10.7 | Delta Marketing Support Agreement, dated as of June 30, 2003, by and between Delta Air Lines, Inc. and Worldspan, L.P.(1)*** | |
| 10.8 | Northwest Marketing Support Agreement, dated as of June 30, 2003, by and between Northwest Airlines, Inc. and Worldspan, L.P.(1)*** | |
| 10.9 | Non-Competition Agreement, dated as of June 30, 2003, by and among American Airlines, Inc., Worldspan, L.P. and Worldspan Technologies Inc.(1) | |
| 10.10 | Non-Competition Agreement, dated as of June 30, 2003, by and among Delta Air Lines, Inc., Worldspan, L.P. and Worldspan Technologies Inc.(1) | |
| 10.11 | Non-Competition Agreement, dated as of June 30, 2003, by and among Northwest Airlines, Inc., Worldspan, L.P. and Worldspan Technologies Inc.(1) | |
| 10.12 | Consulting Agreement, dated as of June 30, 2003, by and between Worldspan, L.P. and Paul J. Blackney.(1) | |
| 10.13 | Employment Agreement, dated as of June 30, 2003, among Worldspan Technologies Inc., Rakesh Gangwal and Worldspan, L.P., as amended.(1) | |
| 10.14 | Employment Agreement, dated as of June 30, 2003, among Worldspan Technologies Inc., M. Gregory O'Hara and Worldspan, L.P., as amended.(1) | |
II-3
| 10.15 | Employment Agreement, dated as of February 20, 2001, by and between Worldspan, L.P. and Douglas L. Abramson.(1) | |
| 10.16 | Employment Agreement, dated as of August 29, 2003, by and among Worldspan, L.P., Worldspan Technologies Inc. and Dale Messick.(1) | |
| 10.17 | Employment Agreement, dated as of February 20, 2001, by and between Worldspan, L.P. and Dale Messick.(1) | |
| 10.18 | Employment Agreement, dated as of August 29, 2003, by and among Worldspan, L.P., Worldspan Technologies Inc. and Michael B. Parks.(1) | |
| 10.19 | Employment Agreement, dated as of February 20, 2001, by and between Worldspan, L.P. and Michael B. Parks.(1) | |
| 10.20 | Employment Agreement, dated as of February 20, 2001, by and between Worldspan, L.P. and Susan J. Powers.(1) | |
| 10.21 | Advisory Agreement, dated as of June 30, 2003, by and between Worldspan, L.P. and Worldspan Technologies Inc.(1) | |
| 10.22 | Advisory Agreement, dated as of June 30, 2003, by and between Worldspan Technologies Inc. and CVC Management LLC.(1) | |
| 10.23 | Stock Subscription Agreement, dated as of June 30, 2003, between Worldspan Technologies Inc., Citigroup Venture Capital Equity Partners, L.P., CVC/SSB Employee Fund, L.P., CVC Executive Fund LLC, Court Square Capital Limited and the other investors named therein.(1) | |
| 10.24 | Stock Subscription Agreement, dated as of June 30, 2003, between Worldspan Technologies Inc. and Ontario Teachers' Pension Plan Board.(1) | |
| 10.25 | Management Stock Subscription Agreement, dated as of June 30, 2003, between Worldspan Technologies Inc. and Paul J. Blackney.(1) | |
| 10.26 | Management Stock Subscription Agreement, dated as of June 30, 2003, between Worldspan Technologies Inc. and Rakesh Gangwal.(1) | |
| 10.27 | Restricted Stock Subscription Agreement, dated as of June 30, 2003, between Worldspan Technologies Inc. and Rakesh Gangwal.(1) | |
| 10.28 | Management Stock Subscription Agreement, dated as of June 30, 2003, between Worldspan Technologies Inc. and Dale Messick.(1) | |
| 10.29 | Restricted Stock Subscription Agreement, dated as of June 30, 2003, between Worldspan Technologies Inc. and Dale Messick.(1) | |
| 10.30 | Management Stock Subscription Agreement, dated as of June 30, 2003, between Worldspan Technologies Inc. and M. Gregory O'Hara.(1) | |
| 10.31 | Restricted Stock Subscription Agreement, dated as of June 30, 2003, between Worldspan Technologies Inc. and M. Gregory O'Hara.(1) | |
| 10.32 | Stock Option Agreement, dated as of June 30, 2003, between Worldspan Technologies Inc. and Rakesh Gangwal.(1) | |
| 10.33 | Stock Option Agreement, dated as of June 30, 2003, between Worldspan Technologies Inc. and M. Gregory O'Hara.(1) | |
| 10.34 | Stock Option Agreement (one-year agreement) dated as of June 30, 2003, between Worldspan Technologies Inc. and M. Gregory O'Hara.(1) | |
| 10.35 | Stock Option Agreement, dated as of September 22, 2003, between Worldspan Technologies Inc. and Dale Messick.(1) | |
| 10.36 | Restricted Stock Subscription Agreement, dated as of September 22, 2003, by and between Worldspan Technologies Inc. and Michael B. Parks.(1) | |
| 10.37 | Stock Option Agreement, dated as of September 22, 2003, between Worldspan Technologies Inc. and Michael B. Parks.(1) | |
| 10.38 | International Business Machines Corporation Worldspan Asset Management Offering Agreement, effective July 1, 2002, among Worldspan, L.P., International Business Machines Corporation and IBM Credit Corporation, as amended by Amendment No. 1.(1)*** | |
| 10.39 | Global Telecommunications Services Agreement, dated May 8, 2000, between Worldspan Services Limited and Societe Internationale de Telecommunications Aeronautiques.(1) | |
| 10.40 | AT&T InterSpan Data Communications Services Agreement, dated February 1, 1996, between AT&T Corp. and Worldspan L.P., as amended.(1) | |
| 10.41 | Worldspan Participating Carrier Agreement, dated February 1, 1991, between Worldspan, L.P. and American Airlines, Inc., as amended.(1) | |
| 10.42 | Worldspan Participating Carrier Agreement, dated February 1, 1991, between Worldspan, L.P. and Delta Air Lines Inc., as amended.(1) | |
II-4
| 10.43 | Worldspan Participating Carrier Agreement, dated February 1, 1991, between Worldspan, L.P. and Northwest Airlines, Inc., as amended.(1) | |
| 10.44 | Worldspan Participating Carrier Agreement, dated February 1, 1991, between Worldspan, L.P. and United Air Lines, as amended.(1) | |
| 10.45 | Worldspan Participating Carrier Agreement, dated February 1, 1991, between Worldspan, L.P. and USAir, Inc., as amended.(1) | |
| 10.46 | Worldspan Participating Carrier Agreement, dated February 1, 1991, between Worldspan, L.P. and Continental Airlines, Inc., as amended.(1) | |
| 10.47 | CRS Marketing, Services and Development Agreement, dated December 15, 1995, between Microsoft Corporation and Worldspan, L.P., as amended.(1)*** | |
| 10.48 | Amended and Restated Agreement for CRS Access and Related Services dated November 1, 2001 between Orbitz, LLC and Worldspan, L.P., as amended.(1)*** | |
| 10.49 | Worldspan Subscriber Entity Agreement dated October 1, 2001 between Worldspan, L.P. and priceline.com Incorporated, as amended.(1)*** | |
| 10.50 | Office Lease Agreement, dated January 16, 2004, between 300 Galleria Parkway Associates and Worldspan, L.P.(2) | |
| 10.51 | Lease Agreement, dated February 7, 1990, between Worldspan, L.P. and Delta Air Lines, Inc., as amended by Data Center Lease Amendment, dated March 3, 2003, between Worldspan, L.P. and Delta Air Lines, Inc.(1) | |
| 10.52 | Worldspan Executive Group Life Insurance Program.(1) | |
| 10.53 | Worldspan Retirement Benefit Restoration Plan.(1) | |
| 10.54 | Worldspan Executive Deferred Compensation Plan.(1) | |
| 10.55 | 2003 Executive Incentive Compensation Program (short-term and long-term plans).(1) | |
| 10.56 | 2002 Executive Incentive Compensation Program (long-term plan).(1) | |
| 10.57 | 2001 Executive Incentive Compensation Program (long-term plan).(1) | |
| 10.58 | 2000 Executive Incentive Compensation Program (long-term plan).(1) | |
| 10.59 | Worldspan Technologies Inc. Stock Incentive Plan.(1) | |
| 10.60 | Employment Agreement, dated as of October 20, 2003, by and among Worldspan, L.P., Worldspan Technologies Inc. and Ninan Chacko.(1) | |
| 10.61 | Restricted Stock Subscription Agreement, dated as of October 20, 2003, between Worldspan Technologies Inc. and Ninan Chacko.(1) | |
| 10.62 | Stock Option Agreement, dated as of October 20, 2003, between Worldspan Technologies Inc. and Ninan Chacko.(1) | |
| 10.63 | Amendment No. 2 to the International Business Machines Corporation Worldspan Asset Management Offering Agreement, dated December 24, 2003.(3) | |
| 10.64 | Second Amendment to the Amended and Restated Agreement for CRS Access and Related Services, dated January 28, 2004, between Obitz, LLC and Worldspan, L.P.(4) | |
| 10.65 | Employment Agreement, dated as of December 31, 2003, by and among Worldspan, L.P., Worldspan Technologies Inc. and Susan J. Powers.(4) | |
| 10.66 | Side Letter Agreement regarding pension benefits, dated March 12, 2004, among Rakesh Gangwal, Worldspan, L.P. and Worldspan Technologies Inc.(4) | |
| 10.67 | Consulting Agreement, dated December 3, 2003, between Douglas L. Abramson and Worldspan, L.P.(4) | |
| 10.68 | Consulting Agreement, dated February 16, 2004, between Dale Messick and Worldspan, L.P.(4) | |
| 10.69 | Letter Agreement, dated March 5, 2004 among Worldspan Technologies Inc., Dale Messick, Citigroup Venture Capital Equity Partners, L.P. and Ontario Teachers' Pension Plan Board.(4) | |
| 10.70 | Employment Agreement, dated as of March 8, 2004, by and among Worldspan, L.P., Worldspan Technologies Inc. and Jeffrey C. Smith.(4) | |
| 10.71 | Employment Agreement, dated as of February 16, 2004, by and among Worldspan, L.P., Worldspan Technologies Inc. and Michael S. Wood.(4) | |
| 10.72 | Worldspan Supplemental Savings Program.(4) | |
| 10.73 | Global Telecommunications Services Agreement, dated February 1, 2004, by and between Worldspan, L.P. and Societe Internationale de Telecommunications Aeronautiques.(4)*** | |
| 10.74 | Global Telecommunications Services Agreement, dated February 1, 2004, by and between Worldspan Services Limited and Societe Internationale de Telecommunications Aeronautiques.(4)*** | |
| 10.75 | AT&T Interspan Data Communication Services Agreement, dated March 29, 2004, between AT&T Corp. and Worldspan, L.P.(4)*** | |
II-5
| 10.76 | The First Amendment to the Delta Founder Airline Services Agreement, dated as of March 26, 2004, by and between Delta Air Lines, Inc. and Worldspan, L.P.(5) | |
| 10.77 | The First Amendment to the Northwest Founder Airline Services Agreement, dated as of May 10, 2004 by and between Northwest Airlines, Inc. and Worldspan, L.P.(5) | |
| 10.78 | Amendment No. 9 to the CRS Marketing, Services and Development Agreement dated as of March 11, 2004 between Worldspan, L.P. and Expedia, Inc.(6)*** | |
| 21.1 | Subsidiaries of Worldspan Technologies Inc. | |
| 23.1 | Consent of Dechert LLP* | |
| 23.2 | Consent of PricewaterhouseCoopers LLP | |
| 24 | Powers of Attorney† |
- (1)
- Filed as a like numbered exhibit to Worldspan, L.P.'s Registration Statement on Form S-4 (File No. 333-109064) and incorporated herein by reference.
- (2)
- Filed as Exhibit 10.1 to Worldspan, L.P.'s Current Report on Form 8-K filed January 21, 2004 and incorporated herein by reference.
- (3)
- Filed as Exhibit 10.1 to Worldspan, L.P.'s Current Report on Form 8-K filed January 6, 2004 and incorporated herein by reference.
- (4)
- Filed as a like numbered exhibit to Worldspan, L.P.'s Annual Report on Form 10-K for the year ended December 31, 2003 and incorporated herein by reference.
- (5)
- Filed as a like numbered exhibit to Worldspan, L.P.'s Quarterly Report on Form 10-Q filed on May 13, 2004 for the quarter ended March 31, 2004 and incorporated herein by reference.
- (6)
- Filed as Exhibit 10.1 to Worldspan, L.P's Current Report on Form 8-K filed April 6, 2004 and incorporated herein by reference.
- †
- Previously filed.
- *
- To be filed by amendment.
- ***
- Certain portions of this document have been omitted pursuant to a confidential treatment request.
- (b)
- Financial Statement Schedules:
Schedules not listed below are omitted because of the absence of the conditions under which they are required or because of the information required by such omitted schedules is set forth in the financial statements or the notes thereto.
II-6
Schedule II—Valuation and Qualifying Accounts
For the Years Ended December 31, 2001, 2002, and 2003
| | | Additions | | | |||||||||||
|---|---|---|---|---|---|---|---|---|---|---|---|---|---|---|---|
| Description | Balance at Beginning of Period | Charged to Costs and Expenses | Charged to Other Accounts | Deductions | Balance at End of Period | ||||||||||
| | (In Thousands) | ||||||||||||||
| Predecessor Basis: | |||||||||||||||
| Year ended December 31, 2001 | |||||||||||||||
| Allowance for doubtful accounts | $ | 8,895 | $ | 5,140 | $ | — | $ | (1,177 | ) | $ | 12,858 | ||||
| Booking cancellation reserve | 7,959 | 12,500 | — | (6,028 | ) | 14,431 | |||||||||
| Deferred tax asset valuation allowance | 4,364 | 452 | — | (38 | ) | 4,778 | |||||||||
Year ended December 31, 2002 | |||||||||||||||
| Allowance for doubtful accounts | $ | 12,858 | $ | 5,589 | $ | — | $ | — | $ | 18,447 | |||||
| Booking cancellation reserve | 14,431 | 3,250 | — | (3,807 | ) | 13,874 | |||||||||
| Deferred tax asset valuation allowance | 4,778 | 1,034 | — | — | 5,812 | ||||||||||
Six months ended June 30, 2003 | |||||||||||||||
| Allowance for doubtful accounts | $ | 18,447 | $ | 1,575 | $ | — | $ | (4,377 | ) | $ | 15,645 | ||||
| Booking cancellation reserve | 13,874 | 1,563 | — | (1,191 | ) | 14,246 | |||||||||
| Deferred tax asset valuation allowance | 5,812 | 9 | — | (542 | ) | 5,279 | |||||||||
Successor Basis: | |||||||||||||||
| Six ended December 31, 2003 | |||||||||||||||
| Allowance for doubtful accounts | $ | 15,645 | $ | 1,284 | $ | — | $ | (1,399 | ) | $ | 15,530 | ||||
| Booking cancellation reserve | 14,246 | 1,631 | — | (6,216 | ) | 9,661 | |||||||||
| Deferred tax asset valuation allowance | 5,279 | 57,415 | — | (902 | ) | 61,792 | |||||||||
ITEM 17. UNDERTAKINGS.
(a) The undersigned Registrant hereby undertakes to provide to the underwriters at the closing specified in the underwriting agreement certificates in such denominations and registered in such names as required by the underwriters to permit prompt delivery to each purchaser.
(b) Insofar as indemnification for liabilities arising under the Securities Act may be permitted to directors, officers and controlling persons of the Registrant pursuant to the provisions described under "Item 14—Indemnification of Directors and Officers" above, or otherwise, the Registrant has been advised that in the opinion of the Securities and Exchange Commission such indemnification is against public policy as expressed in the Securities Act and is, therefore, unenforceable. In the event that a claim for indemnification against such liabilities (other than the payment by the Registrant of expenses incurred or paid by a director, officer or controlling person of the Registrant in the successful defense of any action, suit or proceeding) is asserted by such director, officer or controlling person in connection with the securities being registered, the Registrant will, unless in the opinion of its counsel the matter has been settled by controlling precedent, submit to a court of appropriate jurisdiction the question whether such indemnification by it is against public policy as expressed in the Securities Act and will be governed by the final adjudication of such issue.
(c) The undersigned Registrant hereby undertakes that:
(1) For purposes of determining any liability under the Securities Act, the information omitted from the form of prospectus filed as part of this Registration Statement in reliance upon Rule 430A and contained in a form of prospectus filed by the Registrant pursuant to Rule 424(b)(1) or (4) or 497(h) under the Securities Act shall be deemed to be part of this Registration Statement as of the time it was declared effective.
(2) For the purposes of determining any liability under the Securities Act, each post-effective amendment that contains a form of prospectus shall be deemed to be a new registration statement relating to the securities offered therein and the offering of such securities at that time shall be deemed to be the initial bona fide offering thereof.
II-7
Pursuant to the requirements of the Securities Act of 1933, the registrant has duly caused this registration statement to be signed on its behalf by the undersigned, thereunto duly authorized, in the City of Atlanta, State of Georgia, on May 13, 2004.
| WORLDSPAN TECHNOLOGIES INC. | ||||
By: | /s/ RAKESH GANGWAL Name: Rakesh Gangwal Title: Chairman, President & Chief Executive Officer and Director | |||
Pursuant to the requirements of the Securities Act of 1933, this Amendment No. 1 to the Registration Statement has been signed by the following persons in the capacities and on the dates indicated.
| Signature | Title | Date | ||
|---|---|---|---|---|
| /s/ RAKESH GANGWAL Rakesh Gangwal | Chairman, President & Chief Executive Officer and Director (Principal Executive Officer) | May 13, 2004 | ||
* Michael S. Wood | Senior Vice President and Chief Financial Officer (Principal Financial and Accounting Officer) | May 13, 2004 | ||
* M. Gregory O'Hara | Executive Vice President Corporate Planning and Development and Director | May 13, 2004 | ||
* Shael J. Dolman | Director | May 13, 2004 | ||
* Ian D. Highet | Director | May 13, 2004 | ||
* James W. Leech | Director | May 13, 2004 | ||
II-8
* Dean G. Metcalf | Director | May 13, 2004 | ||
* Paul C. Schorr IV | Director | May 13, 2004 | ||
* Joseph M. Silvestri | Director | May 13, 2004 | ||
* David F. Thomas | Director | May 13, 2004 | ||
* Signed by attorney-in-fact | ||||
/s/ JEFFREY C. SMITH Jeffrey C. Smith, Attorney-in-fact | ||||
II-9
TABLE OF CONTENTS
PROSPECTUS SUMMARY
RISK FACTORS
Risks Relating To Our Business
Risks Related to this Offering
FORWARD-LOOKING STATEMENTS
INDUSTRY AND MARKET DATA
USE OF PROCEEDS
DIVIDEND POLICY
CAPITALIZATION
DILUTION
UNAUDITED PRO FORMA CONDENSED CONSOLIDATED FINANCIAL STATEMENTS
Unaudited Pro Forma Condensed Consolidated Statement of Operations for the Year Ended December 31, 2003
Unaudited Pro Forma Condensed Consolidated Statement of Operations for the Three Months Ended March 31, 2004
Unaudited Pro Forma Condensed Consolidated Balance Sheet as of March 31, 2004
Notes to Unaudited Pro Forma Condensed Consolidated Financial Statements (dollars in thousands)
SELECTED HISTORICAL FINANCIAL DATA
MANAGEMENT'S DISCUSSION AND ANALYSIS OF FINANCIAL CONDITION AND RESULTS OF OPERATIONS
BUSINESS
MANAGEMENT
Summary Compensation Table
Option Grants During the Year Ended December 31, 2003
Aggregated Option Exercises in Last Fiscal Year and Fiscal Year-End Option Values
CERTAIN RELATIONSHIPS AND RELATED TRANSACTIONS
PRINCIPAL AND SELLING STOCKHOLDERS
DESCRIPTION OF CAPITAL STOCK
SHARES ELIGIBLE FOR FUTURE SALE
MATERIAL UNITED STATES TAX CONSEQUENCES TO NON-U.S. HOLDERS OF COMMON STOCK
UNDERWRITING
LEGAL MATTERS
EXPERTS
WHERE YOU CAN FIND MORE INFORMATION
INDEX TO CONSOLIDATED FINANCIAL STATEMENTS
Report of Independent Auditors
Report of Independent Auditors
Worldspan Technologies Inc. Consolidated Balance Sheets (in thousands, except per share data)
Worldspan Technologies Inc. Consolidated Statements of Operations (in thousands, except per share data)
Worldspan Technologies Inc. Consolidated Statements of Partners' Capital (in thousands)
Worldspan Technologies Inc. Consolidated Statement of Stockholders' Equity (Deficit) (in thousands)
Worldspan Technologies Inc. Consolidated Statements of Cash Flows (in thousands)
Worldspan Technologies Inc. Notes to Consolidated Financial Statements (dollars in thousands, except per share data)
PART II INFORMATION NOT REQUIRED IN PROSPECTUS
SIGNATURES