Exhibit 99.1
| November 28, 2006 Friedman, Billings, Ramsey and Co. 2006 Investor Conference |

| Forward Looking Statements Changes in or elimination of laws, tariffs, trade or other controls or enforcement practices such as: national, state or local energy policy; federal ethanol tax incentives; regulation currently under consideration pursuant to the passage of the Energy Policy Act of 2005, which contains a renewable fuel standard and other legislation mandating the usage of ethanol or other oxygenate additives; state and federal regulation restricting or banning the use of Methyl Tertiary Butyl Ether, a fuel derived from methanol (‘‘MTBE’’); environmental laws and regulations applicable to our operations and the enforcement thereof; Changes in weather and general economic conditions; Overcapacity within the ethanol and petroleum refining industries; Total United States consumption of gasoline; Availability and costs of products and raw materials, particularly corn, coal and natural gas; Labor relations; Fluctuations in petroleum prices; Our or our employees’ failure to comply with applicable laws and regulations; Our ability to generate free cash flow to invest in our business and service our indebtedness; Limitations and restrictions contained in the instruments and agreements governing our indebtedness; Our ability to raise additional capital and secure additional financing, and our ability to service such debt, if obtained; Our ability to retain key employees; Liability resulting from actual or potential future litigation; Competition; Plant shutdowns or disruptions at our plant or plants whose products we market; Availability of rail cars and barges; Renewal of alliance partner contracts; Our ability to receive and/or renew permits to construct and/or commence operations of our proposed capacity additions in a timely manner, or at all; and Other factors described in our filings with the Securities and Exchange Commission. Certain information included in this presentation may be deemed to be ‘‘forward looking statements’’ within the meaning of Section 27A of the Securities Act and Section 21E of the Exchange Act. All statements, other than statements of historical facts, included in this presentation, are forward looking statements. In particular, statements that we make related to our overall volume trends, industry forces, margin trends, anticipated capital expenditures and our strategies are forward looking statements. When used in this document, the words ‘‘believe,’’ ‘‘expect,’’ ‘‘anticipate,’’ ‘‘estimate,’’ ‘‘project,’’ ‘‘plan,’’ ‘‘should,’’ ‘‘would,’’ ‘‘could’’ and similar expressions are intended to identify forward looking statements. These statements are based on assumptions and assessments made by our management in light of their experience and their perception of historical trends, current conditions, expected future developments and other factors they believe to be appropriate. Any forward looking statements are not guarantees of our future performance and are subject to risks and uncertainties that could cause actual results, developments and business decisions to differ materially from those contemplated by such forward looking statements. We disclaim any duty to update any forward looking statements. Some of the factors that may cause actual results, developments and business decisions to differ materially from those contemplated by such forward looking statements include, but are not limited to the following: |
| Ajay Sabherwal Chief Financial Officer Company AttendeesRon Miller President and CEO Les Nelson Director – Investor Relations |
| What We Will Cover Ethanol Industry Aventine Update Aventine Growth Financial Overview |
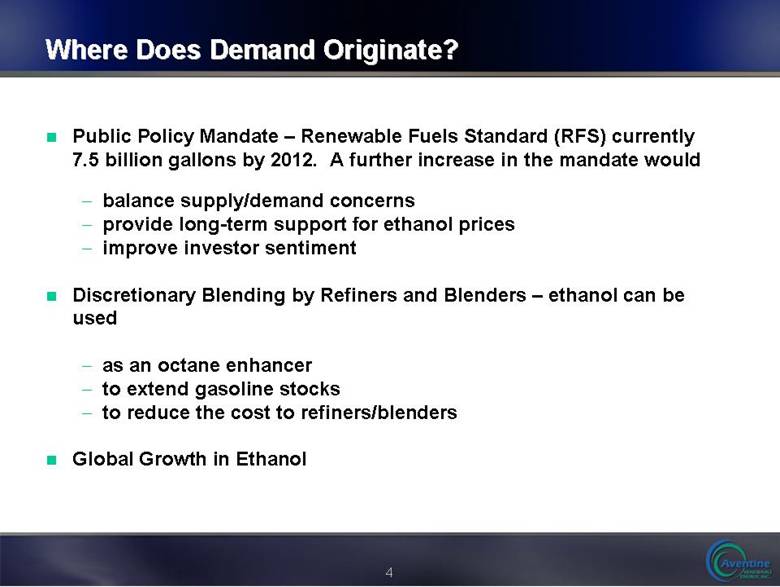
| Where Does Demand Originate? Public Policy Mandate – Renewable Fuels Standard (RFS) currently 7.5 billion gallons by 2012. A further increase in the mandate wouldbalance supply/demand concerns provide long-term support for ethanol prices improve investor sentimentDiscretionary Blending by Refiners and Blenders – ethanol can be used as an octane enhancer to extend gasoline stocks to reduce the cost to refiners/blenders Global Growth in Ethanol |
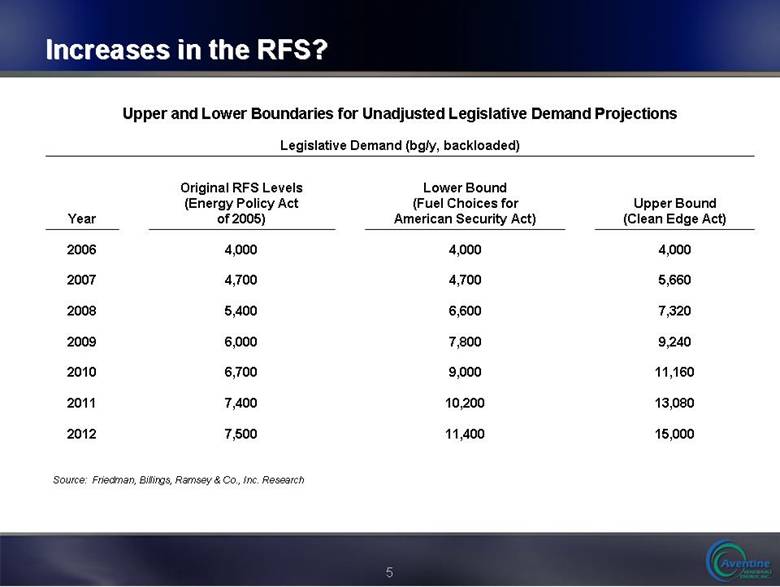
| Increases in the RFS? Source: Friedman, Billings, Ramsey & Co., Inc. Research15,000 11,400 7,500 2012 13,080 10,200 7,400 2011 11,160 9,000 6,700 2010 9,240 7,800 6,000 2009 7,320 6,600 5,400 2008 5,660 4,700 4,700 2007 4,000 4,000 4,000 2006 Upper Bound (Clean Edge Act) Lower Bound (Fuel Choices for American Security Act) Original RFS Levels (Energy Policy Act of 2005) Year Legislative Demand (bg/y, backloaded) Upper and Lower Boundaries for Unadjusted Legislative Demand Projections |
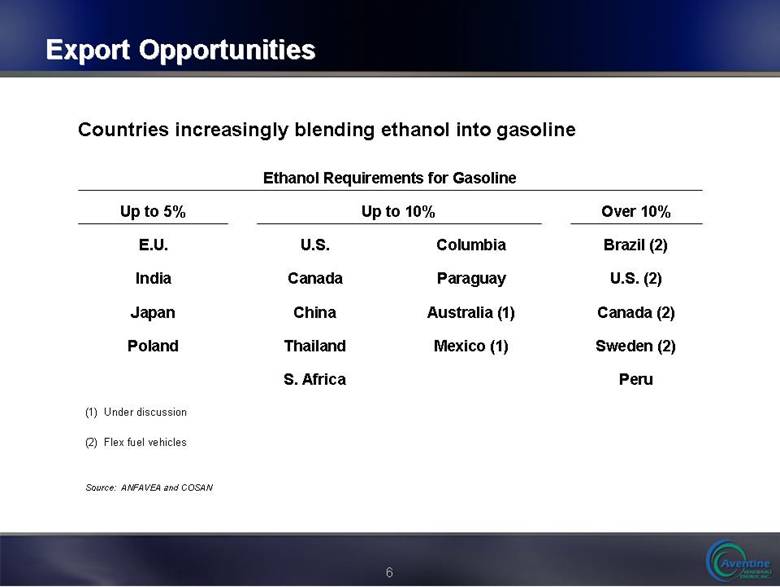
| Export Opportunities Countries increasingly blending ethanol into gasoline Source: ANFAVEA and COSAN(2) Flex fuel vehicles (1) Under discussion Peru S. Africa Sweden (2) Mexico (1) Thailand Poland Canada (2) Australia (1) China Japan U.S. (2) Paraguay Canada India Brazil (2) Columbia U.S. E.U. Over 10% Up to 10% Up to 5% Ethanol Requirements for Gasoline |
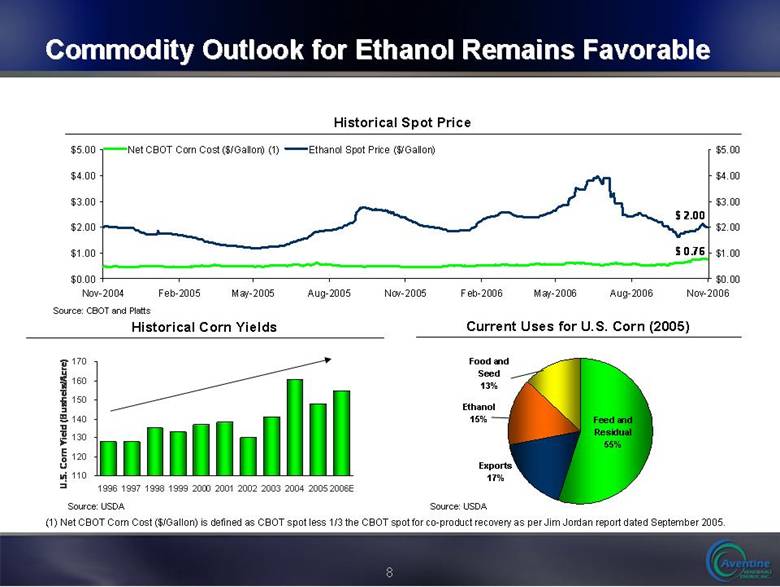
| Current Commodity Market Status Spot Ethanol prices recovering – up 35% since September Commodity spreads remain healthy - $0.50 increase per bushel of corn equates to only a $0.12 per gallon cost increase in ethanol Cash corn market still below CBOT Ample corn supply Natural gas prices lower |

| Commodity Outlook for Ethanol Remains Favorable .Historical Corn Yields Current Uses for U.S. Corn (2005) Historical Spot Price Source: USDA Source: USDA Feed and Residual 55% Exports 17% Ethanol 15% Food and Seed 13% Source: CBOT and Platts (1) Net CBOT Corn Cost ($/Gallon) is defined as CBOT spot less 1/3 the CBOT spot for co-product recovery as per Jim Jordan report dated September 2005.$0.00$1.00$2.00$3.00$4.00$5.00Nov-2004Feb-2005May-2005Aug-2005Nov-2005Feb-2006May-2006Aug-2006Nov-2006$0.00$1.00$2.00$3.00$4.00$5.00 Net CBOT Corn Cost ($/Gallon) (1)Ethanol Spot Price ($/Gallon)$ 2.00 $ 0.76 11012013014015016017019961997199819992000200120022003200420052006EU.S. Corn Yield (Bushels/Acre) |
| Aventine Offers Value Healthy industry and commodity fundamentals Unmatched distribution infrastructure Significant future capacity additions Strong track record with significant free cash flow Low-cost and diversified operations Industry-leading management team Ability to develop strategic relationships |
| Aventine Is the Face of Ethanol to Its Customers Dependable supplier of ethanol in large volumes Brings national market to Midwest ethanol producers Current production in eight states provides distribution flexibility Fragmented industry provides acquisition opportunities |
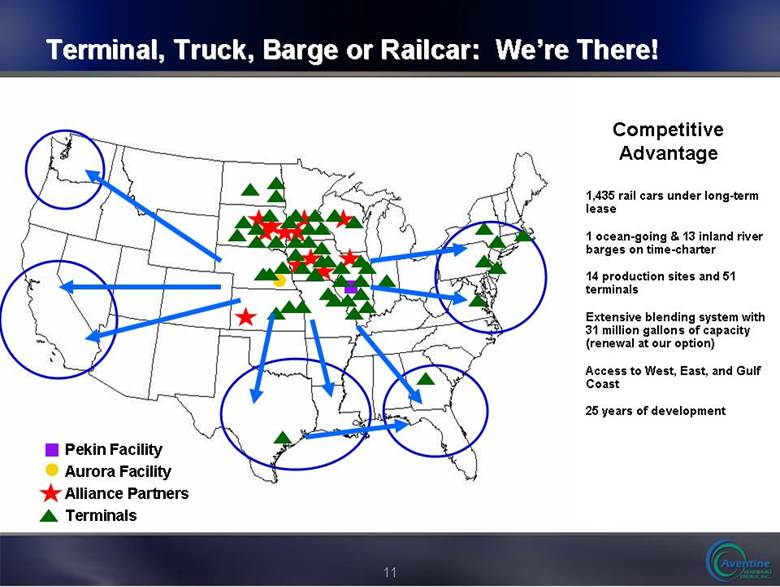
| Terminal, Truck, Barge or Railcar: We’re There! 1,435 rail cars under long-term lease 1 ocean-going & 13 inland river barges on time-charter 14 production sites and 51 terminals Extensive blending system with 31 million gallons of capacity (renewal at our option) Access to West, East, and Gulf Coast 25 years of development Competitive Advantage Pekin Facility Aurora Facility Alliance Partners Terminals |
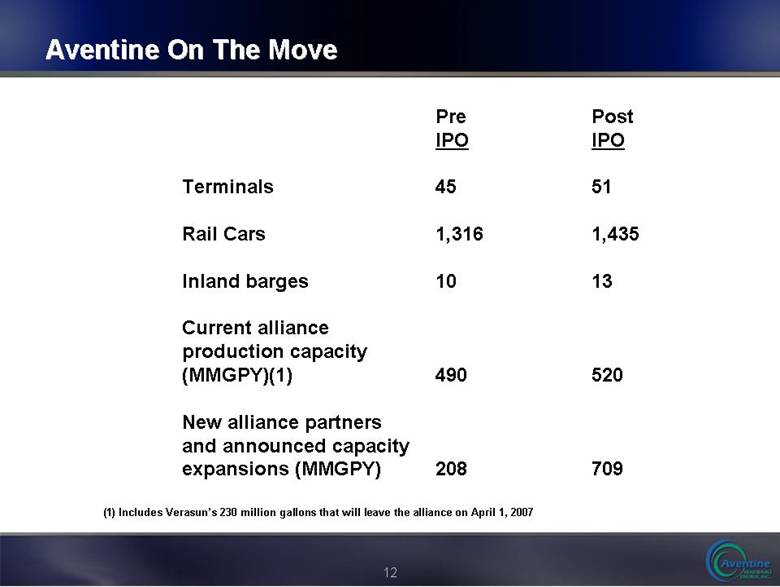
| Aventine On The Move Pre Post IPO IPO Terminals 45 51 Rail Cars 1,316 1,435 Inland barges 10 13 Current alliance production capacity (MMGPY)(1) 490 520 New alliance partners and announced capacity expansions (MMGPY) 208 709(1) Includes Verasun’s 230 million gallons that will leave the alliance on April 1, 2007 |
| Integration Drives Long-Term Relationships Fully-integrated ethanol pure-play Ability to reliably deliver product to customers Multiple modes of transportation (truck, rail, and barge) Difficult to replicate terminal infrastructure Economies of scale Consistency of fee-based revenue from alliance partners Key Customer Relationships |
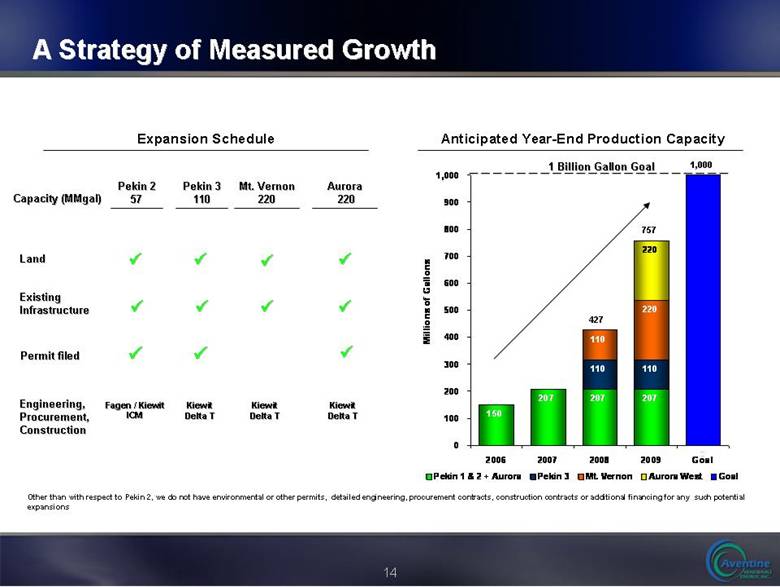
| A Strategy of Measured Growth Anticipated Year-End Production Capacity Expansion Schedule 757 1 Billion Gallon Goal Pekin 2 57 Pekin 3 110 Mt. Vernon 220 Aurora 220 Land Existing Infrastructure Engineering, Procurement, Construction üüüüüüüüKiewit Delta T 1,000 427 Capacity (MMgal) Fagen / Kiewit ICM Kiewit Delta T Kiewit Delta T Other than with respect to Pekin 2, we do not have environmental or other permits, detailed engineering, procurement contracts, construction contracts or additional financing for any such potential expansionsPermit filed üüü150207 207207011011011022022001002003004005006007008009001,0002006200720082009GoalMillions of Gallons Pekin 1 & 2 + AuroraPekin 3Mt. VernonAurora WestGoal |
| Mt. Vernon Site Location |
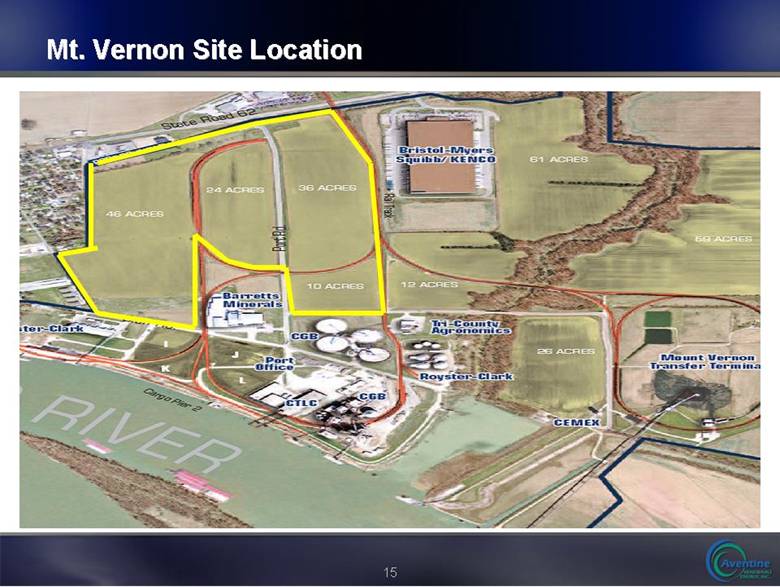
| Mt. Vernon Site is Well Positioned 220 million gallon nameplate capacity facility to be built 116 acre site leased from Ports of Indiana Site has existing infrastructure including roads, rail and dock access to river system Site will source grain from Consolidated Grain and Barge’s (CGB) 10 million bushel elevator system in the Mt. Vernon area Initial production is expected by the end of 2008 |
| Strategic Agreement with CGB CGB Enterprises operates over 70 locations across the U.S. and through its subsidiary CGB Co., is a significant principle in the U.S. grain industryCGB will market the DDGS for export to Europe, Japan, and AsiaCGB to be responsible for ethanol and DDGS loading at facility Aventine to get first look at ethanol facilities at other CGB’s existing grain locations CGB to get first look to provide grain origination at other Aventine future ethanol facilities |
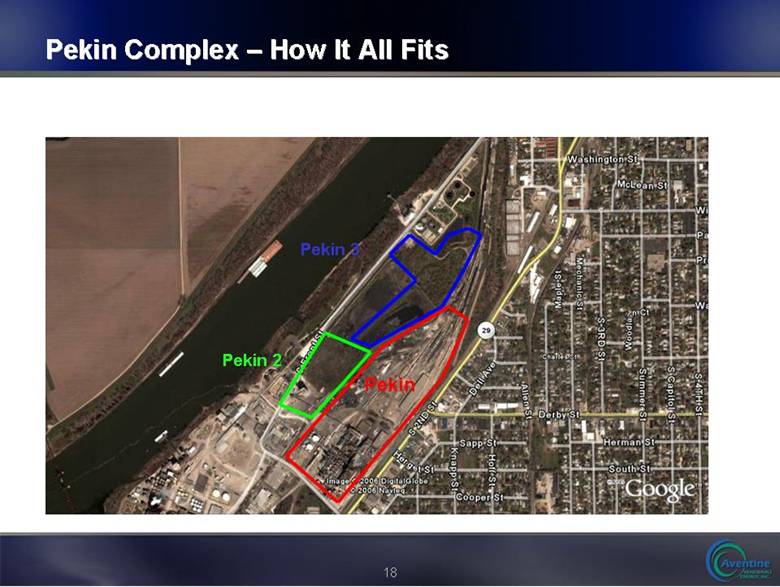
| Pekin Complex – How It All Fits Pekin Pekin 2 Pekin 3 |
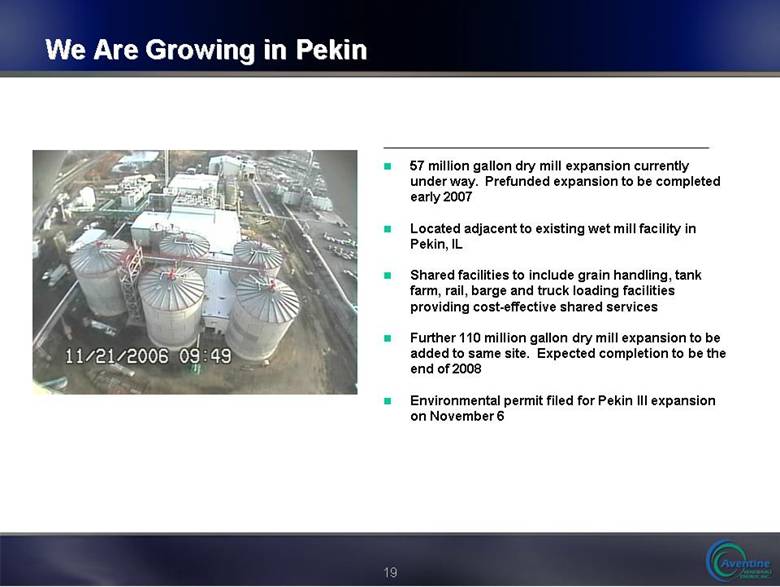
| We Are Growing in Pekin 57 million gallon dry mill expansion currently under way. Prefunded expansion to be completed early 2007 Located adjacent to existing wet mill facility in Pekin, IL Shared facilities to include grain handling, tank farm, rail, barge and truck loading facilities providing cost-effective shared services Further 110 million gallon dry mill expansion to be added to same site. Expected completion to be the end of 2008 Environmental permit filed for Pekin III expansion on November 6 |
| Where is Aurora West Complex? |
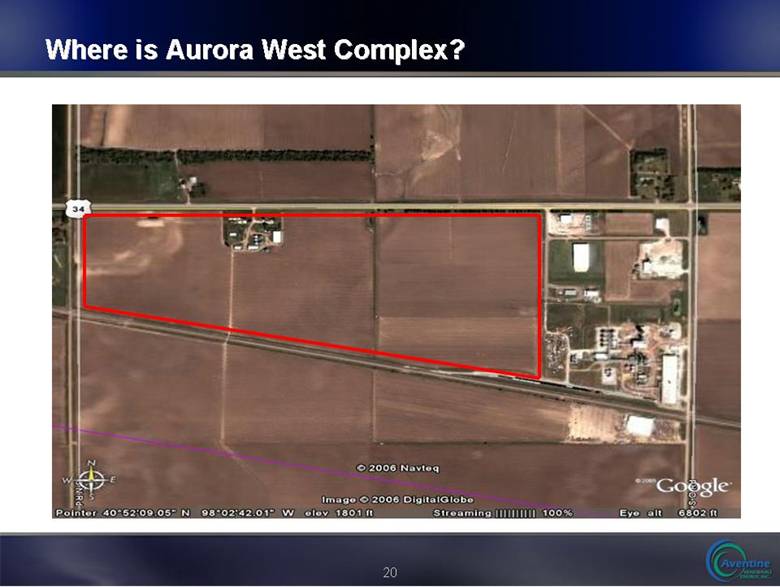
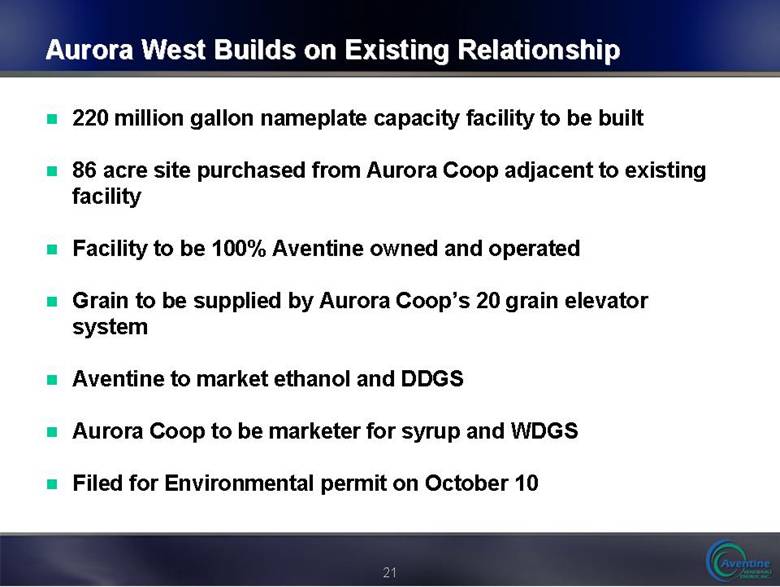
| Aurora West Builds on Existing Relationship 220 million gallon nameplate capacity facility to be built 86 acre site purchased from Aurora Coop adjacent to existing facility Facility to be 100% Aventine owned and operated Grain to be supplied by Aurora Coop’s 20 grain elevator system Aventine to market ethanol and DDGS Aurora Coop to be marketer for syrup and WDGS Filed for Environmental permit on October 10 |
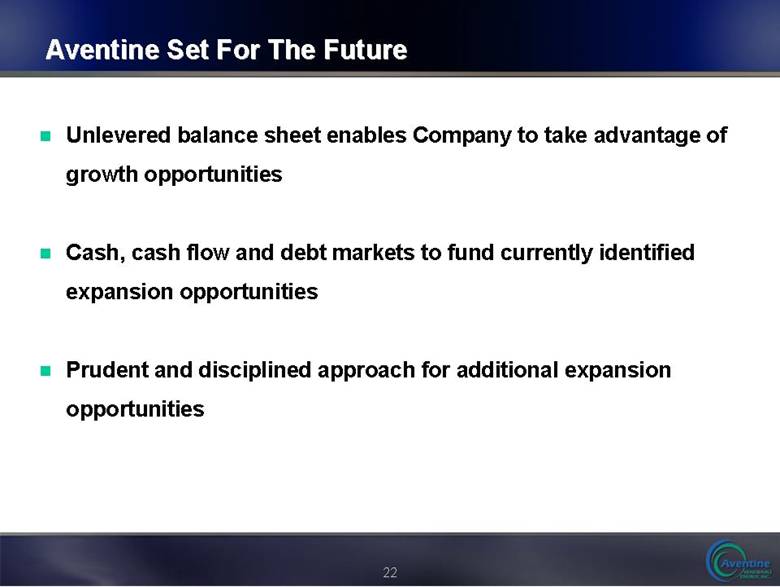
| Aventine Set For The Future Unlevered balance sheet enables Company to take advantage of growth opportunities Cash, cash flow and debt markets to fund currently identified expansion opportunities Prudent and disciplined approach for additional expansion opportunities |
| Financial Overview Ajay Sabherwal Chief Financial Officer |
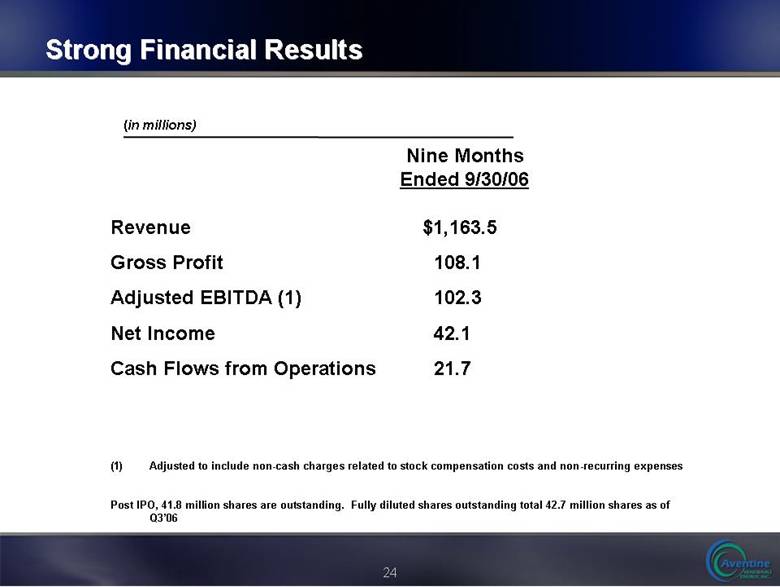
| Strong Financial Results Revenue $1,163.5 Gross Profit 108.1 Adjusted EBITDA (1) 102.3 Net Income 42.1 Cash Flows from Operations 21.7 Adjusted to include non-cash charges related to stock compensation costs and non-recurring expenses Post IPO, 41.8 million shares are outstanding. Fully diluted shares outstanding total 42.7 million shares as of Q3’06 Nine Months Ended 9/30/06 (in millions) |
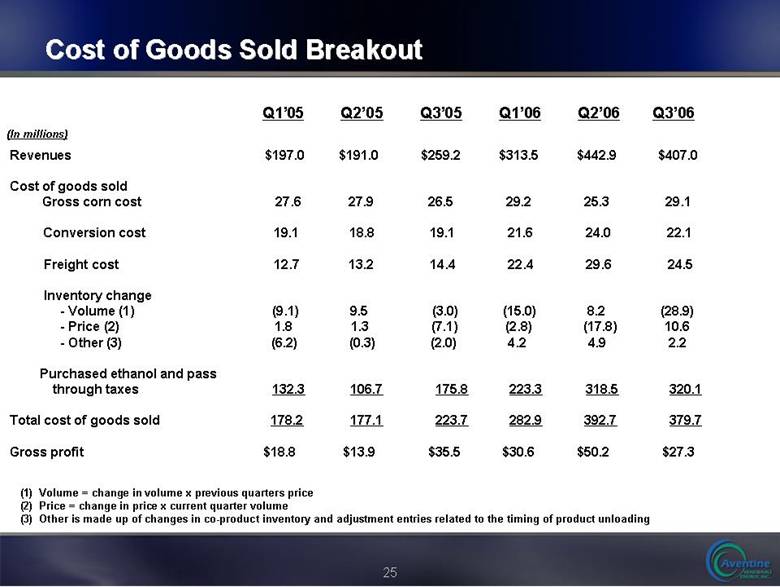
| Cost of Goods Sold Breakout Q1’05 Q2’05 Q3’05 Q1’06 Q2’06 Q3’06 Revenues $197.0 $191.0 $259.2 $313.5 $442.9 $407.0 Cost of goods sold Gross corn cost 27.6 27.9 26.5 29.2 25.3 29.1 Conversion cost 19.1 18.8 19.1 21.6 24.0 22.1 Freight cost 12.7 13.2 14.4 22.4 29.6 24.5 Inventory change - Volume (1) (9.1) 9.5 (3.0) (15.0) 8.2 (28.9) - Price (2) 1.8 1.3 (7.1) (2.8) (17.8) 10.6 - Other (3) (6.2) (0.3) (2.0) 4.2 4.9 2.2 Purchased ethanol and pass through taxes 132.3 106.7 175.8 223.3 318.5 320.1 Total cost of goods sold 178.2 177.1 223.7 282.9 392.7 379.7 Gross profit $18.8 $13.9 $35.5 $30.6 $50.2 $27.3 (In millions) (1) Volume = change in volume x previous quarters price (2) Price = change in price x current quarter volume (3) Other is made up of changes in co-product inventory and adjustment entries related to the timing of product unloading |
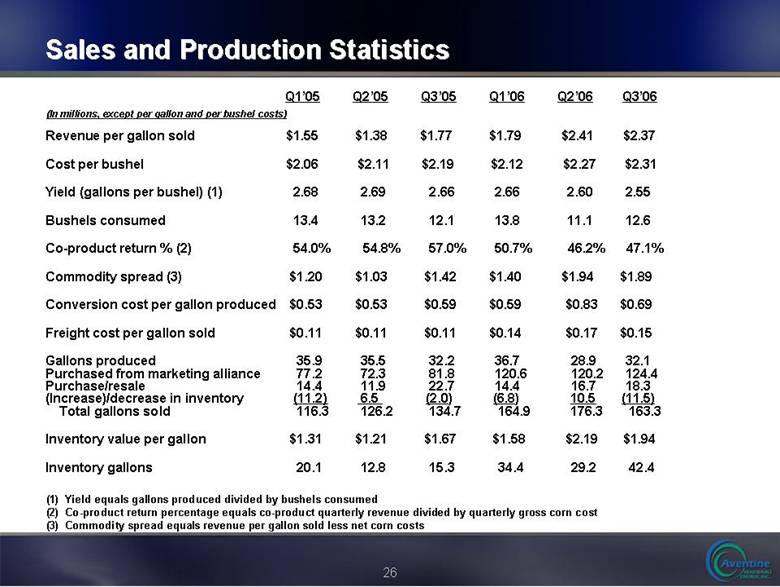
| Sales and Production Statistics Revenue per gallon sold $1.55 $1.38 $1.77 $1.79 $2.41 $2.37 Cost per bushel $2.06 $2.11 $2.19 $2.12 $2.27 $2.31 Yield (gallons per bushel) (1) 2.68 2.69 2.66 2.66 2.60 2.55 Bushels consumed 13.4 13.2 12.1 13.8 11.1 12.6 Co-product return % (2) 54.0% 54.8% 57.0% 50.7% 46.2% 47.1% Commodity spread (3) $1.20 $1.03 $1.42 $1.40 $1.94 $1.89 Conversion cost per gallon produced $0.53 $0.53 $0.59 $0.59 $0.83 $0.69 Freight cost per gallon sold $0.11 $0.11 $0.11 $0.14 $0.17 $0.15 Gallons produced 35.9 35.5 32.2 36.7 28.9 32.1 Purchased from marketing alliance 77.2 72.3 81.8 120.6 120.2 124.4 Purchase/resale 14.4 11.9 22.7 14.4 16.7 18.3 (Increase)/decrease in inventory (11.2) 6.5 (2.0) (6.8) 10.5 (11.5) Total gallons sold 116.3 126.2 134.7 164.9 176.3 163.3 Inventory value per gallon $1.31 $1.21 $1.67 $1.58 $2.19 $1.94 Inventory gallons 20.1 12.8 15.3 34.4 29.2 42.4 Q1’05 Q2’05 Q3’05 Q1’06 Q2’06 Q3’06 (In millions, except per gallon and per bushel costs) (1) Yield equals gallons produced divided by bushels consumed (2) Co-product return percentage equals co-product quarterly revenue divided by quarterly gross corn cost (3) Commodity spread equals revenue per gallon sold less net corn costs |
| Financial Reconciliations |
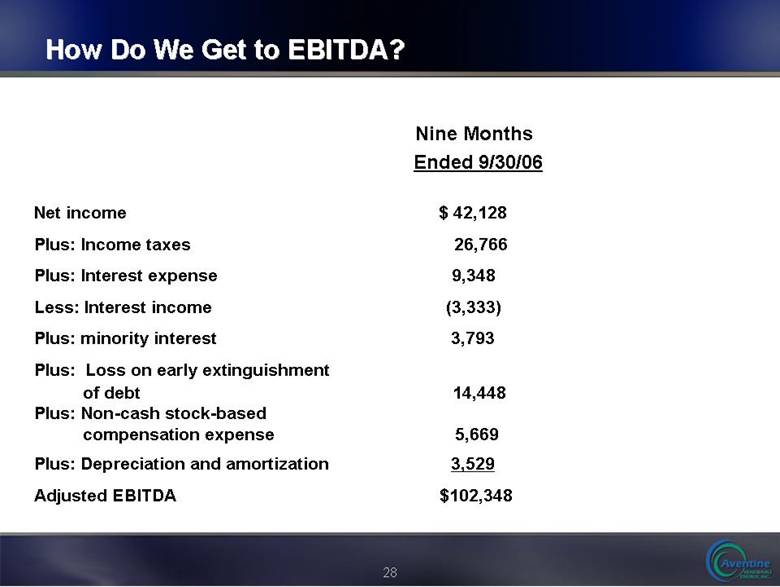
| How Do We Get to EBITDA? Net income $ 42,128 Plus: Income taxes 26,766 Plus: Interest expense 9,348 Less: Interest income (3,333) Plus: minority interest 3,793 Plus: Loss on early extinguishment of debt 14,448 Plus: Non-cash stock-based compensation expense 5,669 Plus: Depreciation and amortization 3,529 Adjusted EBITDA $102,348Nine Months Ended 9/30/06 |
|
|