SECURITIES AND EXCHANGE COMMISSION
Washington, D.C. 20549
FORM 10-K
(Mark One)
| x | Annual report pursuant to Section 13 or 15(d) of the Securities Exchange Act of 1934 |
For the fiscal year ended December 31, 2007.
OR
| o | Transition report pursuant to Section 13 or 15(d) of the Securities Exchange Act of 1934 |
For the transition period from ___________ to ___________
Commission File Number 000-50923
WILSHIRE BANCORP, INC.
(Exact name of registrant as specified in its charter)
| | |
California | 20-0711133 |
State or other jurisdiction of
incorporation or organization | I.R.S. Employer
Identification Number |
| | |
3200 Wilshire Blvd. | |
Los Angeles, California | 90010 |
| Address of principal executive offices | Zip Code |
| |
(213) 387-3200 |
| Registrant’s telephone number, including area code |
| |
Securities registered pursuant to Section 12(b) of the Act: Common Stock, no par value
Securities registered pursuant to Section 12(g) of the Act: None
Indicate by check mark if the registrant is a well-known seasoned issuer, as defined in Rule 405 of the Securities Act. Yes o No x
Indicate by check mark if the registrant is not required to file reports pursuant to Section 13 or Section 15(d) of the Act. Yes o No x
Indicate by check mark whether the registrant (1) has filed all reports required to be filed by Section 13 or 15(d) of the Securities Exchange Act of 1934 during the preceding 12 months (or for such shorter period that the registrant was required to file such reports), and (2) has been subject to such filing requirements for the past 90 days. Yes x No o
Indicate by check mark if disclosure of delinquent filers pursuant to Item 405 of Regulation S-K is not contained herein, and will not be contained, to the best of registrant’s knowledge, in definitive proxy or information statements incorporated by reference in Part III of this Form 10-K or any amendment to this Form 10-K. o
Indicate by check mark whether the registrant is a large accelerated filer, an accelerated filer, a non-accelerated filer, or a smaller reporting company. See the definitions of “large accelerated filer,” “accelerated filer” and “smaller reporting company” in Rule 12b-2 of the Exchange Act. (Check one):
Large accelerated filer o | Accelerated filer x |
Non-accelerated filer o | (Do not check if a smaller reporting company) Smaller reporting company o |
| | |
Indicate by check mark whether the registrant is a shell company (as defined in Rule 12b-2 of the Act). Yes o No x
The aggregate market value of the voting common stock held by non-affiliates of the registrant as of June 30, 2007 was approximately $211 million (computed based on the closing sale price of the common stock at $12.18 per share as of such date). Shares of common stock held by each officer and director and each person owning more than ten percent of the outstanding common stock have been excluded in that such persons may be deemed to be affiliates. This determination of the affiliate status is not necessarily a conclusive determination for other purposes.
The number of shares of Common Stock of the registrant outstanding as of February 29, 2008 was 29,257,311.
DOCUMENTS INCORPORATED BY REFERENCE
Portions of the registrant’s Proxy Statement relating to the registrant’s 2008 Annual Meeting of Shareholders are incorporated by reference into Part III of this Annual Report on Form 10-K, where indicated.
TABLE OF CONTENTS
| | | Page |
| Cautionary Statement Regarding Forward-Looking Statements and Information | | 3 |
| | | | |
| PART I | | | 3 |
| Item 1. | Business | | 3 |
| Item 1A. | Risk Factors | | 23 |
| Item 1B. | Unresolved Staff Comments | | 29 |
| Item 2. | Properties | | 29 |
| Item 3. | Legal Proceedings | | 31 |
| Item 4. | Submission of Matters to a Vote of Security Holders | | 31 |
| | | | |
| PART II | | | 32 |
| Item 5. | Market for Registrant’s Common Equity, Related Stockholder Matters and Issuer Purchases of Equity Securities | | 32 |
| Item 6. | Selected Financial Data | | 35 |
| Item 7. | Management’s Discussion and Analysis of Financial Condition and Results of Operations | | 37 |
| Item 7A. | Quantitative and Qualitative Disclosures About Market Risk | | 70 |
| Item 8. | Financial Statements and Supplementary Data | | 72 |
| Item 9. | Changes in and Disagreements with Accountants on Accounting and Financial Disclosure | | 72 |
| Item 9A. | Controls and Procedures | | 72 |
| Item 9B. | Other Information | | 75 |
| | | | |
| PART III | | | |
| Item 10. | Directors and Executive Officers of the Registrant | | |
| Item 11. | Executive Compensation | | |
| Item 12. | Security Ownership of Certain Beneficial Owners, Management and Related Shareholder Matters | | |
| Item 13. | Certain Relationships and Related Transactions | | |
| Item 14. | Principal Accounting Fees and Services | | |
| | | | |
| PART IV | | | 76 |
| Item 15. | Exhibits, Financial Statement Schedules | | 76 |
CAUTIONARY STATEMENT REGARDING FORWARD-LOOKING STATEMENTS AND INFORMATION
This Annual Report on Form 10-K, or the “Report,” the other reports, statements, and information that we have previously filed or that we may subsequently file with the Securities and Exchange Commission (“SEC”) and public announcements that we have previously made or may subsequently make include, may include, incorporate by reference or may incorporate by reference certain statements that are “forward-looking statements” within the meaning of the Private Securities Litigation Reform Act of 1995 and are intended to enjoy the benefits of that act. The forward-looking statements included or incorporated by reference in this Form 10-K and those reports, statements, information and announcements address activities, events or developments that Wilshire Bancorp, Inc. (together with its subsidiaries hereinafter referred to as “the Company,” “we,” “us,” “our” or “Wilshire Bancorp”) expects or anticipates will or may occur in the future. Any statements in this document about expectations, beliefs, plans, objectives, assumptions or future events or performance are not historical facts and are forward-looking statements. These statements are often, but not always, made through the use of words or phrases such as “may,” “should,” “could,” “predict,” “potential,” “believe,” “will likely result,” “expect,” “will continue,” “anticipate,” “seek,” “estimate,” “intend,” “plan,” “projection,” “would” and “outlook,” and similar expressions. Accordingly, these statements involve estimates, assumptions and uncertainties, which could cause actual results to differ materially from those expressed in them. Any forward-looking statements are qualified in their entirety by reference to the factors discussed throughout this document. All forward-looking statements concerning economic conditions, rates of growth, rates of income or values as may be included in this document are based on information available to us on the dates noted, and we assume no obligation to update any such forward-looking statements. It is important to note that our actual results may differ materially from those in such forward-looking statements due to fluctuations in interest rates, inflation, government regulations, economic conditions, customer disintermediation and competitive product and pricing pressures in the geographic and business areas in which we conduct operations, including our plans, objectives, expectations and intentions and other factors discussed elsewhere in this Report, including the discussion under the section entitled “Risk Factors.”
The risk factors referred to in this Report could cause actual results or outcomes to differ materially from those expressed in any forward-looking statements made by us, and you should not place undue reliance on any such forward-looking statements. Any forward-looking statement speaks only as of the date on which it is made and we do not undertake any obligation to update any forward-looking statement or statements to reflect events or circumstances after the date on which such statement is made or to reflect the occurrence of unanticipated events. New factors emerge from time to time, and it is not possible for us to predict which will arise. In addition, we cannot assess the impact of each factor on our business or the extent to which any factor, or combination of factors, may cause actual results to differ materially from those contained in any forward-looking statements.
PART I
General
Wilshire Bancorp, Inc. is a bank holding company offering a broad range of financial products and services primarily through our main subsidiary, Wilshire State Bank, a California state-chartered commercial bank, or the “Bank.” Our corporate headquarters and primary banking facilities are located at 3200 Wilshire Boulevard, Los Angeles, California 90010. In addition, we have 20 full-service Bank branch offices in Southern California, Texas, New Jersey, and the greater New York City metropolitan area. We also have 6 loan production offices, or LPOs, utilized primarily for the origination of loans under our Small Business Administration, or SBA, lending program in Colorado, Georgia, New Jersey, Texas, Virginia, and Washington.
The Bank is an insured bank up to the maximum limits authorized under the Federal Deposit Insurance Act, as amended, or the “FDIA.” Like most state-chartered banks of our size in California, we are not a member of the Federal Reserve System, but we are a member of Federal Home Loan Bank of San Francisco, a congressionally chartered Federal Home Loan Bank. At December 31, 2007, we had approximately $2.20 billion in assets, $1.81 billion in total loans and $1.76 billion in deposits.
We operate a community bank focused on the general commercial banking business, with our primary market encompassing the multi-ethnic population of the Los Angeles County area. Our full-service offices are located primarily in areas where a majority of the businesses are owned by Korean-speaking immigrants, with many of the remaining businesses owned by other minority groups. Our branches in Huntington Park and Garden Grove are located in predominantly Hispanic and Vietnamese communities respectively. Our client base reflects the multi-ethnic composition of these communities.
To address the needs of our multi-ethnic customers, we have many multilingual employees who are able to converse with our clientele in their native languages. We believe that the ability to speak the native language of our customers assists us in tailoring products and services for our customers’ needs.
Available Information
We maintain an Internet website at www.wilshirebank.com. We post our filings with the SEC on the Investor Relations component of our website, which are available free of charge, including our Annual Report on Form 10-K, our Quarterly Reports on Form 10-Q, our Current Reports on Form 8-K, our proxy and information statements and any amendments to those reports or statements as soon as reasonably practicable after such reports are filed or furnished under the Securities Exchange Act of 1934, as amended, or Exchange Act. In addition to our SEC filings, our Code of Professional Conduct and our Personal and Business Code of Conduct can be found on the Investor Relations page of our website. In addition, we post separately on our website all filings made by persons pursuant to Section 16 of the Exchange Act. You may also read and copy any materials we file with the SEC at the SEC’s Public Reference Room at 100 F Street, N.E., Washington, D.C. 20549. You may obtain information on the operation of the Public Reference Room by calling the SEC at 1-800-SEC-0220. The SEC maintains an Internet site that contains reports, proxy and information statements, and other information regarding issuers that file electronically with the SEC at http://www.sec.gov.
Expansion
As part of our efforts to achieve stable and long-term profitability and respond to a changing economic environment in Southern California, we constantly evaluate a variety of options to augment our traditional focus by broadening the services and products we provide. Possible avenues of growth include more branch locations, expanded days and hours of operation and new types of lending products. To date, we have not expanded into areas of brokerage, annuity, insurance or similar investment products and services but rather have concentrated primarily on the core businesses of accepting deposits, making loans and extending credit.
Over the past few years, our network of branches and LPOs has been expanded geographically. We currently maintain 20 branch offices and 6 LPOs. We previously added two branches and expanded into the greater New York City metropolitan area by acquiring Liberty Bank of New York (“Liberty Bank”) in May 2006. In July 2007, we exchanged our Flushing branch in New York with Royal Bank America (“RBA”) for its Fort Lee branch in New Jersey. Immediately subsequent to the branch exchange in July 2007, we opened a new Bayside branch in New York. Hence, the net result of this branch exchange transaction was an addition of a new branch, and an extension of our service into the state of New Jersey. In addition to our expansion into the states of New York and New Jersey, which we generally regard as the “New York/New Jersey area”, we further expanded our banking network within California. In December 2007, we also opened another new branch office, Rancho Hannam, in Rancho Cucamonga, California.
As part of the branch exchange transaction with RBA, we purchased selected fixed assets and assumed selected liabilities of RBA, including a portion of RBA’s time deposits. As consideration, the Bank gave to RBA selected intangible and fixed assets, and selected liabilities, including a portion of time deposits, intangible liabilities, and lease obligations. The amounts involved in the branch exchange transaction were insignificant except for the time deposits exchanged, with both parties transferring deposits in the amount of approximately $6 million. The branch exchange transaction was accounted for as an exchange of assets and liabilities.
In 2008, we expect the New York/New Jersey market to continue to be a critical market for our expansion strategy. We believe the New York/New Jersey Korean-American niche is underserved relative to Los Angeles. According to U.S. Census data, approximately 17% of all Korean-Americans reside in New York or New Jersey, and New York and New Jersey are home to the second and third most Korean-American firms in the United States. We believe our East Coast expansion was successful in 2007. For example, we began our operation in Fort Lee, New Jersey in the third quarter and already have a $31.7 million deposit portfolio in less than six months. Our two other New York branches have also exceeded our expectations in terms of loan and deposit growth, more than doubling since their acquisition. To build on our success, we expect to open our second New Jersey branch in Palisades Park during the third quarter of 2008. In addition, we expect that we will open another Los Angeles branch during the second quarter of 2008.
In contrast to our branch expansion, we have decreased the number of our LPOs. The Palisades Park, New Jersey LPO was opened in July 2007. However, we closed our California and Nevada LPOs in January 2008 and March 2008, respectively. The LPOs were closed as a result of a drop in the loan production levels of those offices. Accordingly, our total number of LPOs decreased from seven to six.
Our expansion plans for 2008 are influenced by the changing conditions in the U.S. economy. The moderate pace of economic growth that occurred during the first half of fiscal 2007 slowed during the second half of fiscal 2007, primarily reflecting the significant and broad-based illiquidity in the residential real estate and credit markets. Concerns about the impact of subprime loans led to a “credit crisis,” wherein the subprime related and broader credit markets declined considerably over the course of the third and fourth quarters of 2007.
During 2008, we plan to closely monitor and review the loan production levels of our LPOs, and to evaluate the need for their continued existence. Also, in response to the credit crisis discussed above, we plan to be cautious about our expansion and opening of new LPOs.
Business Segments
We operate in three primary business segments: Banking Operations, Trade Finance Services, and Small Business Administration Lending Services. We determine operating results of each segment based on an internal management system that allocates certain expenses to each segment. These segments are described in additional detail below:
| | | Banking Operations: Raises funds from deposits and borrowings for loans and investments and provides lending products including commercial, consumer and real estate loans to customers. |
| | | Trade Finance Services: Assists our import/export customers with international transactions. Trade finance products include the issuance and collection of letters of credit, international collection and import/export financing. |
| | | Small Business Administration Lending Services: Provides loans through the SBA guaranteed lending program. |
More detailed information about the financial performance of these business segments can be found in Note 20 of the financial statements included in this Report beginning on page F-1.
Lending Activities
General
Our loan policies set forth the basic guidelines and procedures by which we conduct our lending operations. These policies address the types of loans available, underwriting and collateral requirements, loan terms, interest rate and yield considerations, compliance with laws and regulations and our internal lending limits. Our Bank Board of Directors reviews and approves our loan policies on an annual basis. We supplement our own supervision of the loan underwriting and approval process with periodic loan audits by experienced external loan specialists who review credit quality, loan documentation and compliance with laws and regulations. We engage in a full complement of lending activities, including:
| | | commercial real estate and home mortgage lending, |
| | | commercial business lending and trade finance, |
Loan Procedures
Loan applications may be approved by the Director Loan Committee of our Bank Board of Directors, or by our management or lending officers to the extent of their loan authority. Our Bank Board of Directors authorizes our lending limits. The President, Chief Lending Officer and Chief Credit Administrator of the Bank are responsible for evaluating the authority limits for individual credit officers and recommending lending limits for all other officers to the Bank Board of Directors for approval.
We grant individual lending authority to the President, Chief Lending Officer and selected department managers of the Bank. The President has an administrative secured lending authority of $500,000. The next highest secured lending authority of $400,000 is reserved for the Bank’s Chief Lending Officer. Loans for which direct and indirect borrower liability exceeds an individual’s lending authority are referred to the Senior Loan Committee of the Bank, which is a five-member committee comprised of the President, Chief Lending Officer, Senior Loan Officer, Chief Credit Administrator, and Chief Operations Administrator, or our Bank Director Loan Committee.
At December 31, 2007, our authorized legal lending limits were $39.0 million for unsecured loans, plus an additional $26.0 million for specific secured loans. Legal lending limits are calculated in conformance with California law, which prohibits a bank from lending to any one individual or entity or its related interests an aggregate amount which exceeds 15% of shareholders’ equity, plus the allowance for loan losses and capital notes and debentures, on an unsecured basis, plus an additional 10% on a secured basis. The Bank’s shareholders’ equity plus allowance for loan losses and capital notes and debentures at December 31, 2007 totaled $259.7 million.
We seek to mitigate the risks inherent in our loan portfolio by adhering to our underwriting policies. The review of each loan application includes analysis of the applicant’s prior credit history, income level, cash flow and financial condition, tax returns, cash flow projections, and the value of any collateral to secure the loan, based upon reports of independent appraisers and audits of accounts receivable or inventory pledged as security. In the case of real estate loans over a specified amount, the review of collateral value includes an appraisal report prepared by an independent Bank-approved appraiser. From time to time, we purchase participation interests in loans made by other financial institutions. These loans are generally subject to the same underwriting criteria and approval process as loans made directly by us.
Real Estate Loans and Home Mortgages
We offer commercial real estate loans to finance the acquisition of, or to refinance the existing mortgages on commercial properties, which include retail shopping centers, office buildings, industrial buildings, warehouses, hotels, automotive industry facilities and apartment buildings. Our commercial real estate loans are typically collateralized by first or junior deeds of trust on specific commercial properties, and, when possible, subject to corporate or individual guarantees from financially capable parties. The properties collateralizing real estate loans are principally located in the markets where our retail branches are located, which include Southern California, Texas, New Jersey, and the greater New York City metropolitan area. However, we also provide commercial real estate loans through our LPOs. Real estate loans typically bear an interest rate that floats with our base rate, the prime rate or another established index. We do, however, offer fixed rate commercial mortgage loans with maturities not to exceed 5 to 7 years. At December 31, 2007, real estate loans constituted approximately 79.9% of our loan portfolio.
Commercial real estate loans typically have 7-year maturities with up to 25-year amortization of principal and interest and loan-to-value ratios of 65-70% of the appraised value or purchase price, whichever is lower. We usually impose a prepayment penalty during the period within three to five years of the date of the loan.
Construction loans are provided to build new structures, or to substantially improve the existing structure of commercial, residential and income-producing properties. These loans generally have one to two year terms, with options to extend for additional periods to complete construction and to accommodate the lease-up period. We usually require 20-25% equity capital investment by the developer and loan-to-value ratios of not more than 65-70% of anticipated completion value. We also offer mini-perm loans as take-out financing with our construction loans. Mini-perm loans are generally made with an amortization schedule ranging from 15 to 25 years with a lump sum balloon payment due in one to seven years.
We offer a wide selection of residential mortgage programs, including non-traditional mortgages such as interest only and payment option adjustable rate mortgages. Most of our salable loans are transferred to the secondary market, but we retain a portion on our books as portfolio loans. Our total home mortgage loan portfolio outstanding at the end of 2007 and 2006 was $38.0 million and $40.6 million, respectively. The residential mortgage loans with unconventional terms such as interest only mortgage and option adjustable rate mortgage at December 31, 2007 were $2.9 million and $1.2 million, respectively, inclusive of loans held temporarily for sale or refinancing. These same loan categories were $4.6 million and $1.1 million, respectively, at December 31, 2006.
We consider subprime mortgages to be loans secured by real property made to a borrower (or borrowers) with a diminished or impaired credit rating or with a limited credit history. We are focused on producing loans with only prime rated borrowers. As of result, our portfolio currently has 0% subprime exposure.
| | | a possible downturn in the economies of our primary markets, |
| | | reduction in real estate values in our primary markets, |
| | | increased competition in pricing and loan structure, and |
| | | environmental risks, including natural disasters. |
We strive to reduce the exposure to such risks by (a) reviewing each new loan request and renewal individually, (b) using a dual signature approval system for the approval of each loan request for loans over a certain dollar amount, (c) adherence to written loan policies, including, among other factors, minimum collateral requirements, maximum loan-to-value ratio requirements, cash flow requirements and personal guarantees, (d) independent appraisals, (e) external independent credit review, and (f) conducting environmental reviews, where appropriate. We review each loan request on the basis of our ability to recover both principal and interest in view of the inherent risks.
Commercial Business Lending
We offer commercial business loans to sole proprietorships, partnerships and corporations. These loans include business lines of credit and business term loans to finance operations, to provide working capital or for specific purposes, such as to finance the purchase of assets, equipment or inventory. Since a borrower’s cash flow from operations is generally the primary source of repayment, our policies provide specific guidelines regarding required debt coverage and other important financial ratios.
Lines of credit are extended to businesses or individuals based on the financial strength and integrity of the borrower and are secured primarily by business assets such as accounts receivable and inventory, and have a maturity of one year or less. Such lines of credit bear an interest rate that floats with our base rate, the prime rate, or another established index.
Business term loans are typically made to finance the acquisition of fixed assets, refinance short-term debts or to finance the purchase of businesses. Business term loans generally have terms from one to seven years. They may be collateralized by the assets being acquired or other available assets and bear interest rates, which either float with our base rate, prime rate, or another established index or is fixed for the term of the loan.
We also provide other banking services tailored to the small business market. We have focused recently on diversifying our loan portfolio, which has led to an increase in commercial business loans to small and medium-sized businesses.
Our portfolio of commercial loans is subject to certain risks, including:
| | | a possible downturn of economy in our primary markets, |
| | | interest rate increases, and |
| | | deterioration of a borrower’s or guarantor’s financial capabilities. |
We attempt to reduce the exposure to such risks through (a) reviewing each new loan request and renewal individually, (b) relying heavily on a committee approval system where inputs from experienced committee members with different types and level of lending experience are fully utilized, (c) strict adherence to written loan policies, and (d) external independent credit review. In addition, loans based on short-term assets such as account receivables and inventories are monitored on a monthly or at minimum quarterly basis. In general, we receive and review financial statements of borrowing customers on an ongoing basis during the term of the relationship and respond to any deterioration noted.
Small Business Administration Lending Services
Small Business Administration, or SBA, lending is an important part of our business. Our SBA lending business places an emphasis on minority-owned businesses. Our SBA market area includes the geographic areas encompassed by our full-service banking offices in Southern California, Texas, New Jersey, and the New York City metropolitan area, as well as the multi-ethnic population areas surrounding our LPOs in other states. We are a SBA Preferred Lender nationwide, which permits us to approve SBA guaranteed loans in all our lending areas without further approval from the SBA. As an SBA Preferred Lender, we provide quicker and more efficient service to our clientele, enabling them to obtain SBA loans in order to acquire new businesses, expand existing businesses and acquire locations in which to do business, without having to go through the time-consuming SBA approval process that would be necessary if a prospective SBA borrower were to utilize a lender that is not an SBA Preferred Lender.
We have made efforts to diversify our banking and financial services in order to reduce our substantial revenue reliance on SBA loans. Nonetheless, SBA loans continue to remain an important component of our business. The net revenue from our SBA department represented 25.5%, 29.9%, and 29.2% of our total net revenue in 2007, 2006 and 2005, respectively.
Although our participation in the SBA program is subject to the legislative power of Congress and the continued maintenance of our approved status by the SBA, we have no reason to believe that this program (and our participation therein) will not continue, particularly in view of the historic longevity of the SBA program nationally.
Consumer Loans
Consumer loans include personal loans, auto loans, and other loans typically made by banks to individual borrowers. Since 2003, we have increased our focus on consumer lending as an effort to diversify our product lines by actively offering automobile loans. Due to the emergence of a credit crisis in 2007, however, and in consideration of the higher comparative risk of consumer loans relative to our other core lending products, we reduced our efforts in actively pursuing consumer-lending opportunities. Instead, we provided only limited consumer loan products as an added service to our existing customers.
Despite some increased focus on consumer lending in recent years, our consumer loan production has always been comparatively small, historically representing less than 5% of our total loan portfolio. As of December 31, 2007, our consumer loan portfolio represented 1.9% of the loan portfolio as compared to 3.4% in both 2006 and 2005.
Our consumer loan portfolio is subject to certain risks, including:
| | | general economic conditions of the markets we serve, |
| | | interest rate increases, and |
| | | consumer bankruptcy laws which allow consumers to discharge certain debts. |
We attempt to reduce the exposure to such risks through the direct approval of all consumer loans by:
| | | reviewing each loan request and renewal individually, |
| | | using a dual signature system of approval, |
| | | strict adherence to written credit policies, and |
| | | utilizing external independent credit review. |
Trade Finance Services
Our Trade Finance Department is an integral part of our business and assists our import/export customers with their international transactions. Trade Finance products include the issuance and negotiation of commercial and standby letters of credit, as well as handling of documentary collections. On the export side, we provide advising and negotiation of commercial letters of credit, and we transfer and issue back-to-back letters of credit.
We also provide importers with trade finance lines of credit, which allow for issuance of commercial letters of credit and financing of documents received under such letters of credit, as well as documents received under documentary collections.
Exporters are assisted through export lines of credit as well as through immediate financing of clean documents presented under export letters of credit. We work closely with the SBA through their Export Working Capital Program.
Most of our revenue from the Trade Finance Department consists of fee income from providing facilities to support import/export customers and interest income from extensions of credit. Our Trade Finance Department’s fee income was $1.3 million, $1.6 million and $1.8 million in 2007, 2006 and 2005, respectively, but its net revenue was $1.0 million, $4.5 million and $5.3 million in 2007, 2006, and 2005, respectively. The decrease in net revenue was primarily due to the increase in provision for loan losses to $3.4 million in 2007 from $1.3 million in 2006, and recovery of loan loss provision of $0.3 million in 2005.
Deposit Activities and Other Sources of Funds
Our primary sources of funds are deposits and loan repayments. Scheduled loan repayments are a relatively stable source of funds, whereas deposit inflows and outflows and unscheduled loan prepayments (which are influenced significantly by general interest rate levels, interest rates available on other investments, competition, economic conditions and other factors) are less stable. Customer deposits remain a primary source of funds, but these balances may be influenced by adverse market changes in the industry. Other borrowings may be used:
| | | on a short-term basis to compensate for reductions in deposit inflows to less than projected levels, and |
| | | on a longer-term basis to support expanded lending activities and to match the maturity of repricing intervals of assets. |
We offer a variety of accounts for depositors which are designed to attract both short-term and long-term deposits. These accounts include certificates of deposit (“CDs”), regular savings accounts, money market accounts, checking and negotiable order of withdrawal (“NOW”) accounts, installment savings accounts, and individual retirement accounts (“IRAs”). These accounts generally earn interest at rates established by management based on competitive market factors and management’s desire to increase or decrease certain types or maturities of deposits. As needed, we augment these customer deposits with brokered deposits. The more significant deposit accounts offered by us and other sources of funds are described below:
Certificates of Deposit
We offer several types of CDs with a maximum maturity of five years. The majority of our CDs have a maturity of one to 12 months and typically pay simple interest credited monthly or at maturity.
Regular Savings Account.
We offer savings accounts that allow for unlimited deposits and withdrawals, provided that depositors maintain a $100 minimum balance. Interest is compounded daily and credited quarterly.
Money Market Accounts
Money market accounts pay a variable interest rate that is tiered depending on the balance maintained in the account. Minimum opening balances vary. Interest is compounded daily and paid monthly.
Checking and NOW Account
Checking and NOW accounts are generally non-interest and interest bearing accounts, respectively, and may include service fees based on activity and balances. NOW accounts pay interest, but require a higher minimum balance to avoid service charges.
Federal Home Loan Bank Borrowings
To supplement our deposits as a source of funds for lending or investment, we borrow funds in the form of advances from the Federal Home Loan Bank. We may use Federal Home Loan Bank advances as part of our interest rate risk management, primarily to extend the duration of funding to match the longer term fixed rate loans held in the loan portfolio.
As a member of the Federal Home Loan Bank system, we are required to invest in Federal Home Loan Bank stock based on a predetermined formula. Federal Home Loan Bank stock is a restricted investment security that can only be sold to other Federal Home Loan Bank members or redeemed by the Federal Home Loan Bank. As of December 31, 2007, we owned $8,695,100 in FHLB stock.
Advances from the Federal Home Loan Bank are secured by the Federal Home Loan Bank stock we own and a blanket lien on our loan portfolio and may be also secured by other assets, mainly consisting of securities which are obligations of or guaranteed by the U.S. government. At December 31, 2007, our borrowing limit with the Federal Home Loan Bank was approximately $460.6 million.
Internet Banking
We offer Internet banking, which allows our customers to access their deposit and loan accounts through the Internet. Customers are able to obtain transaction history and account information, transfer funds between accounts and make on-line bill payments. We intend to improve and develop our Internet banking products and other delivery channels as the need arises and our resources permit.
Other Services
We also offer ATM machines located at selected branch offices, customer access to an ATM network and armored carrier services.
Marketing
We do not currently have any plans to develop any new lines of business which would require a material amount of capital investment on our part.
Competition
Regional Branch Competition
We currently operate 20 branch offices, with 16 in California, 1 in Texas, 1 in New Jersey, and 2 in the greater New York City metropolitan area. We consider our Bank to be a community bank focused on the general commercial banking business, with our primary market encompassing the multi-ethnic population of the Los Angeles County area. Our full-service branch offices are located primarily in areas where a majority of the businesses are owned by Korean-speaking immigrants, with many of the remaining businesses owned by other minority groups. Our branches in Huntington Park and Garden Grove are located in predominantly Hispanic and Vietnamese communities respectively. Our client base reflects the multi-ethnic composition of these communities. To further extend our market coverage and gain market share, we are scheduled to open our second New Jersey branch in Palisades Park during the third quarter of 2008, and we also expect to open another Los Angeles branch during the second quarter of 2008.
Our market has become increasingly competitive in recent years with respect to virtually all products and services which we offer. Although the general banking market is dominated by a relatively small number of major banks with numerous offices covering a wide geographic area, we compete in our niche market directly with smaller community banks which focus on Korean-American and other minority consumers and businesses.
There is a high level of competition within the ethnic banking market. In the greater Los Angeles metropolitan area, our primary competitors include thirteen locally-owned and operated Korean-American banks. These banks have branches located in many of the same neighborhoods in which we operate, provide similar types of products and services, and use the same Korean language publications and media for their marketing purposes. Unlike many other Korean-ethnic community banks, we also focus a significant portion of our marketing efforts on non-Korean customers. We seek to distinguish ourselves from these competitors through superior customer service quality provided with our service motto, the “Four S’s - Smile, Sincerity, Speed and Simplicity.”
A less significant source of competition in our primary market includes branch offices of major national and international banks which maintain a limited bilingual staff for Korean-speaking customers. Although such banks have not traditionally focused their marketing efforts on the minority customer base in our market, their competitive influence could increase should they choose to focus on this market in the future. Large commercial bank competitors have, among other advantages, the ability to finance wide-ranging and effective advertising campaigns and to allocate their investment resources to areas of highest yield and demand. Many of the major banks operating in our market area offer certain services that we do not offer directly (but some of which we offer through correspondent institutions). By virtue of their greater total capitalization, such banks likely also have substantially higher lending limits than we do. In order to compete effectively, we provide quality, personalized service and fast, local decision making which we feel distinguishes us from many of our major bank competitors. For customers whose loan demands exceed our internal lending limit, we attempt to arrange for such loans on a participation basis with our correspondent banks. Similarly, we assist customers requiring services that we do not currently offer in obtaining such services from our correspondent banks.
Regional Loan Production Office Competition
We operate LPOs, in Aurora, Colorado (the Denver area); Atlanta, Georgia; Palisades Park, New Jersey; Houston, Texas; Annandale, Virginia, and Seattle, Washington. The California and Nevada LPOs were closed in January 2008 and March 2008, respectively. The LPO closures were in response to a decrease in the loan production levels of those offices. In 2006 and 2005, the New York and Dallas LPOs were consolidated with the new branches that were established in those locations. In most of our LPO sites, we are competing with local lenders as well as Los Angeles-based Korean-American community lenders operating out-of-state LPOs. We anticipate more competition from Korean-American community lenders in most of our LPO sites in the future. In anticipation of a potential slowdown of the United States’ economy and a decrease in real estate market activity, we plan to maintain a balance of market coverage and operating costs. In 2008, we plan to grow our lending business cautiously with a focus on credit quality and safety. As a result, we plan to close our Seattle, Washington LPO in the first half of 2008, and we expect to merge the Palisades Park, New Jersey LPO into our branch operation following the scheduled opening of our Palisades Park branch in the third quarter of 2008. In the near future, we anticipate adding new LPOs only as needed and after thorough market evaluation.
Other Competitive Factors
In addition to other banks, our competitors include savings institutions, credit unions and numerous non-banking institutions, such as finance companies, leasing companies, insurance companies, brokerage firms and investment banking firms. In recent years, increased competition has also developed from specialized finance and non-finance companies that offer money market and mutual funds, wholesale finance, credit card and other consumer finance services, including on-line banking services and personal finance software. Strong competition for deposit and loan products affects the rates of those products as well as the terms on which they are offered to customers.
The more general competitive trends in the industry include increased consolidation and competition. Strong competitors, other than financial institutions, have entered banking markets with focused products targeted at highly profitable customer segments. Many of these competitors are able to compete across geographic boundaries and provide customers increasing access to meaningful alternatives to banking services in nearly all significant products areas. Mergers between financial institutions have placed additional pressure on banks within the industry to streamline their operations, reduce expenses and increase revenues to remain competitive. Competition has also intensified due to the federal and state interstate banking laws, which permit banking organizations to expand geographically. The California market has been particularly attractive to out-of-state institutions. The Financial Modernization Act, which has made it possible for full affiliations to occur between banks and securities firms, insurance companies, and other financial companies, has also intensified competitive conditions.
Technological innovations have also resulted in increased competition in the financial services industry. Such innovations have, for example, made it possible for non-depository institutions to offer customers automated transfer payment services that were previously considered traditional banking products. In addition, many customers now expect a choice of several delivery systems and channels, including telephone, mail, home computer, ATMs, self-service branches and/or in-store branches. To some extent, such competition has had limited effect on us to date because many recent technological advancements do not yet have Korean language capabilities. However, as such technology becomes available, the competitive pressure to be at the forefront of such advancements will be significant.
The market for the origination of SBA loans, one of our primary revenue sources, is highly competitive. We compete with other small, mid-size and major banks which originate these loans in the geographic areas in which our full service branches are located, as well as in the areas where we maintain SBA LPOs . In addition, because these loans are largely broker-driven, we compete to a large extent with banks which originate SBA loans outside our immediate geographic area. Furthermore, because these loans may be written out of LPOs specifically set up to write SBA loans rather than out of full service branches, the barriers to entry in this area, after approval of a bank as an SBA lender, are relatively low. In order to succeed in this highly competitive market, we actively market our SBA loans to minority-owned businesses. We also plan to expand LPOs in other states where we can compete effectively. However, there can be no assurance that the resale market for SBA loans will grow or maintain its current status.
Business Concentration
No individual or single group of related accounts is considered material in relation to our total assets or deposits, or in relation to our overall business. However, approximately 79.9% of our loan portfolio at December 31, 2007 consisted of real estate-related loans, including construction loans, miniperm loans, residential mortgage loans and commercial loans secured by real estate. Moreover, our business activities are currently focused primarily in Southern California, with the majority of our business concentrated in Los Angeles and Orange Counties. Consequently, our results of operations and financial condition are dependent upon the general trends in the Southern California economies and, in particular, the commercial real estate markets. In addition, the concentration of our operations in Southern California exposes us to greater risk than other banking companies with a wider geographic base in the event of catastrophes, such as earthquakes, fires and floods in this region.
Employees
We had 368 full time equivalent employees (365 full-time employees and 4 part-time employees) in December 2007. None of our employees are currently represented by a union or covered by a collective bargaining agreement. Management believes its employee relations are satisfactory.
Regulation and Supervision
The following is a summary description of the relevant laws, rules and regulations governing banks and bank holding companies. The descriptions of, and references to, the statutes and regulations below are brief summaries and do not purport to be complete. The descriptions are qualified in their entirety by reference to the specific statutes and regulations discussed.
General
The supervision and regulation of bank holding companies and their subsidiaries are intended primarily for the protection of depositors, the deposit insurance funds of the FDIC and the banking system as a whole, and not for the protection of the bank holding company shareholders or creditors. The banking agencies have broad enforcement power over bank holding companies and banks, including the power to impose substantial fines and other penalties for violations of laws and regulations.
Various legislation is from time to time introduced in Congress and California’s legislature, including proposals to overhaul the bank regulatory system, expand the powers of depository institutions and limit the investments that depository institutions may make with insured funds. Such legislation may change applicable statutes and the operating environment in substantial and unpredictable ways. We cannot determine the ultimate effect that future legislation or implementing regulations would have upon the financial condition and results of operations of us or any of our subsidiaries.
Wilshire Bancorp
We are a bank holding company registered under the Bank Holding Company Act, and are subject to supervision, regulation and examination by the Board of Governors of the Federal Reserve System (the “Federal Reserve Board”). The Bank Holding Company Act and other federal laws subject bank holding companies to particular restrictions on the types of activities in which they may engage, and to a range of supervisory requirements and activities, including regulatory enforcement actions for violations of laws and regulations.
Regulatory Restrictions on Dividends; Source of Strength
We are regarded as a legal entity separate and distinct from our other subsidiaries. The principal source of our revenues will be dividends received from the Bank. Various federal and state statutory provisions limit the amount of dividends the Bank can pay to us without regulatory approval. It is the policy of the Federal Reserve Board that bank holding companies should pay cash dividends on common stock only out of income available over the past year and only if prospective earnings retention is consistent with the organization’s expected future needs and financial condition. The policy provides that bank holding companies should not maintain a level of cash dividends that undermines the bank holding company’s ability to serve as a source of strength to its banking subsidiaries.
Under Federal Reserve Board policy, a bank holding company is expected to act as a source of financial strength to each of its banking subsidiaries and commit resources to their support. Such support may be required at times when, absent this Federal Reserve Board policy, a holding company may not be inclined to provide it. As discussed below, a bank holding company, in certain circumstances, could be required to guarantee the capital plan of an undercapitalized banking subsidiary.
In the event of a bank holding company’s bankruptcy under Chapter 11 of the U.S. Bankruptcy Code, the trustee will be deemed to have assumed, and is required to cure immediately, any deficit under any commitment by the debtor holding company to any of the federal banking agencies to maintain the capital of an insured depository institution, and any claim for breach of such obligation will generally have priority over most other unsecured claims.
As a California corporation, Wilshire Bancorp is restricted under the California General Corporation Law (“CGCL”) from paying dividends under certain conditions. The shareholders of Wilshire Bancorp will be entitled to receive dividends when and as declared by its board of directors, out of funds legally available for the payment of dividends, as provided in the CGCL. The CGCL provides that a corporation may make a distribution to its shareholders if retained earnings immediately prior to the dividend payout at least equal the amount of proposed distribution. In the event that sufficient retained earnings are not available for the proposed distribution, a corporation may, nevertheless, make a distribution, if it meets both the “quantitative solvency” and the “liquidity” tests. In general, the quantitative solvency test requires that the sum of the assets of the corporation equal at least 1¼ times its liabilities. The liquidity test generally requires that a corporation have current assets at least equal to current liabilities, or, if the average of the earnings of the corporation before taxes on income and before interest expenses for the two preceding fiscal years was less than the average of the interest expense of the corporation for such fiscal years, then current assets must equal to at least 1¼ times current liabilities. In certain circumstances, Wilshire Bancorp may be required to obtain the prior approval of the Federal Reserve Board to make capital distributions to its shareholders.
Activities “Closely Related” to Banking
The Bank Holding Company Act prohibits a bank holding company, with certain limited exceptions, from acquiring direct or indirect ownership or control of any voting shares of any company which is not a bank or from engaging in any activities other than those of banking, managing or controlling banks and certain other subsidiaries, or furnishing services to or performing services for its subsidiaries. One principal exception to these prohibitions allows the acquisition of interests in companies whose activities are found by the Federal Reserve Board, by order or regulation, to be so closely related to banking or managing or controlling banks, as to be a proper incident thereto. Some of the activities that have been determined by regulation to be closely related to banking are making or servicing loans, performing certain data processing services, acting as an investment or financial advisor to certain investment trusts and investment companies and providing securities brokerage services. Other activities approved by the Federal Reserve Board include consumer financial counseling, tax planning and tax preparation, futures and options advisory services, check guaranty services, collection agency and credit bureau services and personal property appraisals. In approving acquisitions by bank holding companies of companies engaged in banking-related activities, the Federal Reserve Board considers a number of factors, and weighs the expected benefits to the public (such as greater convenience and increased competition or gains in efficiency) against the risks of possible adverse effects (such as undue concentration of resources, decreased or unfair competition, conflicts of interest or unsound banking practices). The Federal Reserve Board is also empowered to differentiate between activities commenced de novo and activities commenced through acquisition of a going concern.
Gramm-Leach-Bliley Act; Financial Holding Companies
The Gramm-Leach-Bliley Financial Modernization Act, or GLBA, signed into law on November 12, 1999, revised and expanded the provisions of the Bank Holding Company Act by including a new section that permits a bank holding company to elect to become a financial holding company to engage in a full range of activities that are “financial in nature.” The qualification requirements and the process for a bank holding company that elects to be treated as a financial holding company require that all of the subsidiary banks controlled by the bank holding company at the time of election to become a financial holding company must be and remain at all times “well-capitalized” and “well managed.” We have not yet made an election to become a financial holding company, but we may do so at some time in the future.
GLBA specifically provides that the following activities have been determined to be “financial in nature”:
| | | lending, trust and other banking activities; |
| | | financial or economic advisory services; |
| | | securitization of assets; |
| | | securities underwriting and dealing; |
| | | existing bank holding company domestic activities; |
| | | existing bank holding company foreign activities; and |
| | | merchant banking activities. |
In addition, GLBA specifically gives the Federal Reserve Board the authority, by regulation or order, to expand the list of “financial” or “incidental” activities, but requires consultation with the U.S. Treasury Department, and gives the Federal Reserve Board authority to allow a financial holding company to engage in any activity that is “complementary” to a financial activity and does not “pose a substantial risk to the safety and soundness of depository institutions or the financial system generally.”
Privacy Policies
Under GLBA, all financial institutions are required to adopt privacy policies, restrict the sharing of nonpublic customer data with nonaffiliated parties at the customer’s request, and establish procedures and practices to protect customer data from unauthorized access. We have established policies and procedures to assure our compliance with all privacy provisions of GLBA.
Safe and Sound Banking Practices
Bank holding companies are not permitted to engage in unsafe and unsound banking practices. The Federal Reserve Board’s Regulation Y, for example, generally requires a holding company to give the Federal Reserve Board prior notice of any redemption or repurchase of its own equity securities, if the consideration to be paid, together with the consideration paid for any repurchases or redemptions in the preceding year, is equal to 10% or more of the company’s consolidated net worth. The Federal Reserve Board may oppose the transaction if it believes that the transaction would constitute an unsafe or unsound practice or would violate any law or regulation. Depending upon the circumstances, the Federal Reserve Board could take the position that paying a dividend would constitute an unsafe or unsound banking practice.
The Federal Reserve Board has broad authority to prohibit activities of bank holding companies and their nonbanking subsidiaries which represent unsafe and unsound banking practices or which constitute violations of laws or regulations, and can assess civil money penalties for certain activities conducted on a knowing and reckless basis, if those activities caused a substantial loss to a depository institution. The penalties can be as high as $1 million for each day the activity continues.
Annual Reporting; Examinations
We are required to file annual reports with the Federal Reserve Board, and such additional information as the Federal Reserve Board may require pursuant to the Bank Holding Company Act. The Federal Reserve Board may examine a bank holding company or any of its subsidiaries, and charge the company for the cost of such examination.
Capital Adequacy Requirements
The Federal Reserve Board has adopted a system using risk-based capital guidelines to evaluate the capital adequacy of certain large bank holding companies. Prior to March 30, 2006, these capital guidelines were applicable to all bank holding companies having $150 million or more in assets on a consolidated basis. However, effective March 30, 2006, the Federal Reserve Board amended the asset size threshold to $500 million for purposes of determining whether a bank holding company is subject to the capital adequacy guidelines. We currently have consolidated assets in excess of $500 million, and are therefore subject to the Federal Reserve Board’s capital adequacy guidelines.
Under the guidelines, specific categories of assets are assigned different risk weights, based generally on the perceived credit risk of the asset. These risk weights are multiplied by corresponding asset balances to determine a “risk-weighted” asset base. The guidelines require a minimum total risk-based capital ratio of 8.0% (of which at least 4.0% is required to consist of Tier 1 capital elements). Total capital is the sum of Tier 1 and Tier 2 capital. To be considered “well-capitalized,” a bank holding company must maintain, on a consolidated basis, (i) a Tier 1 risk-based capital ratio of at least 6.0%, and (ii) a total risk-based capital ratio of 10.0% or greater. As of December 31, 2007, our Tier 1 risk-based capital ratio was 11.83% and our total risk-based capital ratio was 14.58%. Thus, we are considered “well-capitalized” for regulatory purposes.
In addition to the risk-based capital guidelines, the Federal Reserve Board uses a leverage ratio as an additional tool to evaluate the capital adequacy of bank holding companies. The leverage ratio is a company’s Tier 1 capital divided by its average total consolidated assets. Certain highly-rated bank holding companies may maintain a minimum leverage ratio of 3.0%, but other bank holding companies are required to maintain a leverage ratio of at least 4.0%. As of December 31, 2007, our leverage ratio was 10.36%.
The federal banking agencies’ risk-based and leverage ratios are minimum supervisory ratios generally applicable to banking organizations that meet certain specified criteria. The federal bank regulatory agencies may set capital requirements for a particular banking organization that are higher than the minimum ratios when circumstances warrant. Federal Reserve Board guidelines also provide that banking organizations experiencing internal growth or making acquisitions will be expected to maintain strong capital positions, substantially above the minimum supervisory levels, without significant reliance on intangible assets.
Imposition of Liability for Undercapitalized Subsidiaries
Bank regulators are required to take “prompt corrective action” to resolve problems associated with insured depository institutions whose capital declines below certain levels. In the event an institution becomes “undercapitalized,” it must submit a capital restoration plan. The capital restoration plan will not be accepted by the regulators unless each company having control of the undercapitalized institution guarantees the subsidiary’s compliance with the capital restoration plan up to a certain specified amount. Any such guarantee from a depository institution’s holding company is entitled to a priority of payment in bankruptcy.
The aggregate liability of the holding company of an undercapitalized bank is limited to the lesser of 5% of the institution’s assets at the time it became undercapitalized or the amount necessary to cause the institution to be “adequately capitalized.” The bank regulators have greater power in situations where an institution becomes “significantly” or “critically” undercapitalized or fails to submit a capital restoration plan. For example, a bank holding company controlling such an institution can be required to obtain prior Federal Reserve Board approval of proposed dividends, or might be required to consent to a consolidation or to divest itself of the troubled institution or other affiliates.
Acquisitions by Bank Holding Companies
The Bank Holding Company Act requires every bank holding company to obtain the prior approval of the Federal Reserve Board before it may acquire all or substantially all of the assets of any bank, or ownership or control of any voting shares of any bank, if after such acquisition it would own or control, directly or indirectly, more than 5% of the voting shares of such bank. In approving bank acquisitions by bank holding companies, the Federal Reserve Board is required to consider the financial and managerial resources and future prospects of the bank holding company and the banks concerned, the convenience and needs of the communities to be served, and various competitive factors.
Control Acquisitions
The Change in Bank Control Act prohibits a person or group of persons from acquiring “control” of a bank holding company unless the Federal Reserve Board has been notified and has not objected to the transaction. Under a rebuttable presumption established by the Federal Reserve Board, the acquisition of 10% or more of a class of voting stock of a bank holding company with a class of securities registered under Section 12 of the Exchange Act would, under the circumstances set forth in the presumption, constitute acquisition of control.
In addition, any company is required to obtain the approval of the Federal Reserve Board under the Bank Holding Company Act before acquiring 25% (5% in the case of an acquirer that is a bank holding company) or more of the outstanding common stock of the company, or otherwise obtaining control or a “controlling influence” over the company.
Cross-guarantees
Under the Federal Deposit Insurance Act, or FDIA, a depository institution (which definition includes both banks and savings associations), the deposits of which are insured by the FDIC, can be held liable for any loss incurred by, or reasonably expected to be incurred by, the FDIC in connection with (i) the default of a commonly controlled FDIC-insured depository institution, or (ii) any assistance provided by the FDIC to any commonly controlled FDIC-insured depository institution “in danger of default.” “Default” is defined generally as the appointment of a conservator or a receiver and “in danger of default” is defined generally as the existence of certain conditions indicating that default is likely to occur in the absence of regulatory assistance. In some circumstances (depending upon the amount of the loss or anticipated loss suffered by the FDIC), cross-guarantee liability may result in the ultimate failure or insolvency of one or more insured depository institutions in a holding company structure. Any obligation or liability owed by a subsidiary bank to its parent company is subordinated to the subsidiary bank’s cross-guarantee liability with respect to commonly controlled insured depository institutions. The Bank is currently our only FDIC-insured depository institution subsidiary.
Because we are a legal entity separate and distinct from the Bank, our right to participate in the distribution of assets of any subsidiary upon the subsidiary’s liquidation or reorganization will be subject to the prior claims of the subsidiary’s creditors. In the event of a liquidation or other dissolution of the Bank, the claims of depositors and other general or subordinated creditors of the Bank would be entitled to a priority of payment over the claims of holders of any obligation of the Bank to its shareholders, including any depository institution holding company (such as Wilshire Bancorp) or any shareholder or creditor of such holding company.
FIRREA
The Financial Institutions Reform, Recovery and Enforcement Act of 1989, or FIRREA, includes various provisions that affect or may affect the Bank. Among other matters, FIRREA generally permits bank holding companies to acquire healthy thrifts as well as failed or failing thrifts. FIRREA removed certain cross-marketing prohibitions previously applicable to thrift and bank subsidiaries of a common holding company. Furthermore, a multi-bank holding company may now be required to indemnify the federal deposit insurance fund against losses it incurs with respect to such company’s affiliated banks, which in effect makes a bank holding company’s equity investments in healthy bank subsidiaries available to the FDIC to assist such company’s failing or failed bank subsidiaries.
FIRREA also expanded and increased civil and criminal penalties available for use by the appropriate regulatory agency against certain “institution-affiliated parties” primarily including (i) management, employees and agents of a financial institution, as well as (ii) independent contractors, such as attorneys and accountants and others who participate in the conduct of the financial institution’s affairs and who caused or are likely to cause more than minimum financial loss to or a significant adverse affect on the institution, who knowingly or recklessly violate a law or regulation, breach a fiduciary duty or engage in unsafe or unsound practices. Such practices can include the failure of an institution to timely file required reports or the submission of inaccurate reports. Furthermore, FIRREA authorizes the appropriate banking agency to issue cease and desist orders that may, among other things, require affirmative action to correct any harm resulting from a violation or practice, including restitution, reimbursement, indemnifications or guarantees against loss. A financial institution may also be ordered to restrict its growth, dispose of certain assets or take other action as determined by the ordering agency to be appropriate.
USA Patriot Act
On October 26, 2001, comprehensive anti-terrorism legislation known as the USA Patriot Act was enacted. Title III of the USA Patriot Act requires financial institutions to help prevent, detect and prosecute international money laundering and the financing of terrorism. The effectiveness of a financial institution in combating money laundering activities is a factor to be considered in any application submitted by the financial institution under the Bank Merger Act, which applies to the Bank, or the Bank Holding Company Act, which applies to Wilshire Bancorp. We, and our subsidiaries, including the Bank, have adopted systems and procedures to comply with the USA Patriot Act and regulations adopted thereunder by the Secretary of the Treasury.
The Sarbanes-Oxley Act of 2002
On July 30, 2002, The Sarbanes-Oxley Act of 2002, or “Sarbanes-Oxley Act” was enacted. The Sarbanes-Oxley Act addresses accounting oversight and corporate governance matters relating to the operations of public companies. During 2003, the Commission issued a number of regulations under the directive of the Sarbanes-Oxley Act significantly increasing public company governance-related obligations and filing requirements, including:
| | | the establishment of an independent public oversight of public company accounting firms by a board that will set auditing, quality and ethical standards for and have investigative and disciplinary powers over such accounting firms, |
| | | the enhanced regulation of the independence, responsibilities and conduct of accounting firms which provide auditing services to public companies, |
| | | the increase of penalties for fraud related crimes, |
| | | the enhanced disclosure, certification, and monitoring of financial statements, internal financial controls and the audit process, and |
| | | the enhanced and accelerated reporting of corporate disclosures and internal governance. |
Furthermore, in November 2003, in response to the directives of the Sarbanes-Oxley Act, NASDAQ adopted substantially expanded corporate governance criteria for the issuers of securities quoted on the NASDAQ National Market (the market on which our common stock is listed for trading). The new NASDAQ rules govern, among other things, the enhancement and regulation of corporate disclosure and internal governance of listed companies and of the authority, role and responsibilities of their boards of directors and, in particular, of “independent” members of such boards of directors, in the areas of nominations, corporate governance, compensation and the monitoring of the audit and internal financial control processes.
The Sarbanes-Oxley Act, the Commission rules promulgated thereunder, and the new NASDAQ governance requirements have required us to review our current procedures and policies to determine whether they comply with the new legislation and its implementing regulations. As of the date of this filing, we believe that we are in compliance with the new laws and regulations and the NASDAQ governance requirements.
Wilshire State Bank
Wilshire State Bank is subject to extensive regulation and examination by the California Department of Financial Institutions, or the DFI, and the FDIC, which insures its deposits to the maximum extent permitted by law, and is subject to certain Federal Reserve Board regulations of transactions with its affiliates. The federal and state laws and regulations which are applicable to the Bank regulate, among other things, the scope of its business, its investments, its reserves against deposits, the timing of the availability of deposited funds and the nature and amount of and collateral for certain loans. In addition to the impact of such regulations, commercial banks are affected significantly by the actions of the Federal Reserve Board as it attempts to control the money supply and credit availability in order to influence the economy.
Transactions with Affiliates
There are various statutory and regulatory limitations, including those set forth in sections 23A and 23B of the Federal Reserve Act and the related Federal Reserve Regulation W, governing the extent to which the Bank will be able to purchase assets from or securities of or otherwise finance or transfer funds to us or our nonbanking affiliates. Among other restrictions, such transactions between the Bank and any one affiliate (including the Company) generally will be limited to 10% of the Bank’s capital and surplus, and transactions between the Bank and all affiliates will be limited to 20% of the Bank’s capital and surplus. Furthermore, loans and extensions of credit are required to be secured in specified amounts and are required to be on terms and conditions consistent with safe and sound banking practices.
In addition, any transaction by a bank with an affiliate and any sale of assets or provision of services to an affiliate generally must be on terms that are substantially the same, or at least as favorable, to the bank as those prevailing at the time for comparable transactions with nonaffiliated companies.
Loans to Insiders
Sections 22(g) and (h) of the Federal Reserve Act and its implementing regulation, Regulation O, place restrictions on loans by a bank to executive officers, directors, and principal shareholders. Under Section 22(h), loans to a director, an executive officer and to a greater than 10% shareholder of a bank and certain of their related interests, or insiders, and insiders of affiliates, may not exceed, together with all other outstanding loans to such person and related interests, the bank’s loans-to-one-borrower limit (generally equal to 15% of the institution’s unimpaired capital and surplus). Section 22(h) also requires that loans to insiders and to insiders of affiliates be made on terms substantially the same as offered in comparable transactions to other persons, unless the loans are made pursuant to a benefit or compensation program that (i) is widely available to employees of the bank, and (ii) does not give preference to insiders over other employees of the bank. Section 22(h) also requires prior Board of Directors approval for certain loans, and the aggregate amount of extensions of credit by a bank to all insiders cannot exceed the institution’s unimpaired capital and surplus. Furthermore, Section 22(g) places additional restrictions on loans to executive officers.
Dividends
The ability of the Bank to pay dividends on its common stock is restricted by the California Financial Code, the FDIA and FDIC regulations. In general terms, California law provides that the Bank may declare a cash dividend out of net profits up to the lesser of retained earnings or net income for the last three fiscal years (less any distributions made to shareholders during such period), or, with the prior written approval of the Commissioner of Department of Financial Institutions, in an amount not exceeding the greatest of:
| | | net income for the prior fiscal year, or |
| | | net income for the current fiscal year. |
The Bank’s ability to pay any cash dividends will depend not only upon its earnings during a specified period, but also on its meeting certain capital requirements. The FDIA and FDIC regulations restrict the payment of dividends when a bank is undercapitalized, when a bank has failed to pay insurance assessments, or when there are safety and soundness concerns regarding a bank.
The payment of dividends by the Bank may also be affected by other regulatory requirements and policies, such as maintenance of adequate capital. If, in the opinion of the regulatory authority, a depository institution under its jurisdiction is engaged in, or is about to engage in, an unsafe or unsound practice (that, depending on the financial condition of the depository institution, could include the payment of dividends), such authority may require, after notice and hearing, that such depository institution cease and desist from such practice. The Federal Reserve Board has issued a policy statement providing that insured banks and bank holding companies should generally pay dividends only out of operating earnings for the current and preceding two years. In addition, all insured depository institutions are subject to the capital-based limitations required by the Federal Deposit Insurance Corporation Improvement Act of 1991.
Capital Requirements
At December 31, 2007, the Company’s and the Bank’s capital ratios exceed the minimum percentage requirements for “well capitalized” institutions. See Note 16 and Item 7 “Management’s Discussion and Analysis of Financial Condition and Results of Operations -- Capital Resources and Capital Adequacy Requirements” for further information regarding the regulatory capital guidelines as well as the Company’s and the Bank’s actual capitalization as of December 31, 2007.
The federal banking agencies have adopted risk-based minimum capital guidelines for bank holding companies and banks which are intended to provide a measure of capital that reflects the degree of risk associated with a banking organization's operations for both transactions reported on the balance sheet as assets and transactions which are recorded as off-balance sheet items. The risk-based capital ratio is determined by classifying assets and certain off-balance sheet financial instruments into weighted categories, with higher levels of capital being required for those categories perceived as representing greater risk. Under the capital guidelines, a banking organization's total capital is divided into tiers. "Tier I capital" includes common equity and trust-preferred securities, subject to certain criteria and quantitative limits. "Tier II capital" includes hybrid capital instruments, other qualifying debt instruments, a limited amount of the allowance for loan and lease losses, and a limited amount of unrealized holding gains on equity securities. "Tier III capital" consists of qualifying unsecured debt. The sum of Tier II and Tier III capital may not exceed the amount of Tier I capital. The risk-based capital guidelines require a minimum ratio of qualifying total capital to risk-weighted assets of 8% and a minimum ratio of Tier I capital to risk-weighted assets of 4%.
An institution's risk-based capital, leverage capital and tangible capital ratios together determine the institution's capital classification. An institution is treated as well capitalized if its total capital to risk-weighted assets ratio is 10.00% or more; its core capital to risk-weighted assets ratio is 6.00% or more; and its core capital to adjusted average assets ratio is 5.00% or more. In addition to the risk-based guidelines, the federal bank regulatory agencies require banking organizations to maintain a minimum amount of Tier I capital to total assets, referred to as the leverage ratio. For a banking organization rated "well-capitalized," the minimum leverage ratio of Tier I capital to total assets must be 3%.
The current risk-based capital guidelines are based upon the 1988 capital accord of the International Basel Committee on Banking Supervision. A new international accord, referred to as Basel II, which emphasizes internal assessment of credit, market and operational risk; supervisory assessment and market discipline in determining minimum capital requirements, currently becomes mandatory for large international banks outside the U.S. in 2008, is optional for others, and must be complied with in a "parallel run" for two years along with the existing Basel I standards. A separate rule is expected to be released and issued in final form by the federal regulatory agencies in 2008 which will offer U.S. banks that will not adopt Basel II an alternative "standardized approach under Basel II" option and address concerns that the Basel II framework may offer significant competitive advantages for the largest U.S. and international banks. The U.S. banking agencies have indicated, however, that they will retain the minimum leverage requirement for all U.S. banks. Further revisions and proposals to the Basel II framework may also occur in response to recent adverse liquidity and securitization developments.
The Federal Deposit Insurance Act (FDIA) gives the federal banking agencies the additional broad authority to take "prompt corrective action" to resolve the problems of insured depository institutions that fall within any undercapitalized category, including requiring the submission of an acceptable capital restoration plan. The federal banking agencies have also adopted non-capital safety and soundness standards to assist examiners in identifying and addressing potential safety and soundness concerns before capital becomes impaired. The guidelines set forth operational and managerial standards relating to: (i) internal controls, information systems and internal audit systems, (ii) loan documentation, (iii) credit underwriting, (iv) asset quality and growth, (v) earnings, (vi) risk management, and (vii) compensation and benefits.
The FDIC Improvement Act
The Federal Deposit Insurance Corporation Improvement Act of 1991, or FDICIA, made a number of reforms addressing the safety and soundness of the deposit insurance system, supervision of domestic and foreign depository institutions, and improvement of accounting standards. This statute also limited deposit insurance coverage, implemented changes in consumer protection laws and provided for least-cost resolution and prompt regulatory action with regard to troubled institutions.
FDICIA requires every bank with total assets in excess of $500 million to have an annual independent audit made of the bank’s financial statements by a certified public accountant to verify that the financial statements of the bank are presented in accordance with generally accepted accounting principles and comply with such other disclosure requirements as prescribed by the FDIC.
FDICIA also places certain restrictions on activities of banks depending on their level of capital. FDICIA divides banks into five different categories, depending on their level of capital. Under regulations adopted by the FDIC, a bank is deemed to be “well-capitalized” if it has a total Risk-Based Capital Ratio of 10.00% or more, a Tier 1 Capital Ratio of 6.00% or more and a Leverage Ratio of 5.00% or more, and the bank is not subject to an order or capital directive to meet and maintain a certain capital level. Under such regulations, a bank is deemed to be “adequately capitalized” if it has a total Risk-Based Capital Ratio of 8.00% or more, a Tier 1 Capital Ratio of 4.00% or more and a Leverage Ratio of 4.00% or more (unless it receives the highest composite rating at its most recent examination and is not experiencing or anticipating significant growth, in which instance it must maintain a Leverage Ratio of 3.00% or more). Under such regulations, a bank is deemed to be “undercapitalized” if it has a total Risk-Based Capital Ratio of less than 8.00%, a Tier 1 Capital Ratio of less than 4.00% or a Leverage Ratio of less than 4.00%. Under such regulations, a bank is deemed to be “significantly undercapitalized” if it has a Risk-Based Capital Ratio of less than 6.00%, a Tier 1 Capital Ratio of less than 3.00% and a Leverage Ratio of less than 3.00%. Under such regulations, a bank is deemed to be “critically undercapitalized” if it has a Leverage Ratio of less than or equal to 2.00%. In addition, the FDIC has the ability to downgrade a bank’s classification (but not to “critically undercapitalized”) based on other considerations even if the bank meets the capital guidelines. According to these guidelines the Bank was classified as “well-capitalized” as of December 31, 2007.
In addition, if a bank is classified as undercapitalized, the bank is required to submit a capital restoration plan to the federal banking regulators. Pursuant to FDICIA, an undercapitalized bank is prohibited from increasing its assets, engaging in a new line of business, acquiring any interest in any company or insured depository institution, or opening or acquiring a new branch office, except under certain circumstances, including the acceptance by the federal banking regulators of a capital restoration plan for the bank.
Furthermore, if a bank is classified as undercapitalized, the federal banking regulators may take certain actions to correct the capital position of the bank; if a bank is classified as significantly undercapitalized or critically undercapitalized, the federal banking regulators would be required to take one or more prompt corrective actions. These actions would include, among other things, requiring: sales of new securities to bolster capital, improvements in management, limits on interest rates paid, prohibitions on transactions with affiliates, termination of certain risky activities and restrictions on compensation paid to executive officers. If a bank is classified as critically undercapitalized, FDICIA requires the bank to be placed into conservatorship or receivership within 90 days, unless the federal banking regulators determines that other action would better achieve the purposes of FDICIA regarding prompt corrective action with respect to undercapitalized banks.
The capital classification of a bank affects the frequency of examinations of the bank and impacts the ability of the bank to engage in certain activities and affects the deposit insurance premiums paid by such bank. Under FDICIA, the federal banking regulators are required to conduct a full-scope, on-site examination of every bank at least once every 12 months. An exception to this rule is made, however, that provides that banks (i) with assets of less than $100 million, (ii) are categorized as “well-capitalized,” (iii) were found to be well managed and its composite rating was outstanding, and (iv) have not been subject to a change in control during the last 12 months, need only be examined once every 18 months.
Brokered Deposits
Under FDICIA, banks may be restricted in their ability to accept brokered deposits, depending on their capital classification. “Well-capitalized” banks are permitted to accept brokered deposits, but all banks that are not well-capitalized are not permitted to accept such deposits. The FDIC may, on a case-by-case basis, permit banks that are adequately capitalized to accept brokered deposits if the FDIC determines that acceptance of such deposits would not constitute an unsafe or unsound banking practice with respect to the bank. The Bank is currently well-capitalized and therefore is not subject to any limitations with respect to its brokered deposits.
Federal Limitations on Activities and Investments
The equity investments and activities as a principal of FDIC-insured state-chartered banks, such as the Bank, are generally limited to those that are permissible for national banks. Under regulations dealing with equity investments, an insured state bank generally may not directly or indirectly acquire or retain any equity investment of a type, or in an amount, that is not permissible for a national bank.
FDIC Deposit Insurance Assessments
Banks must pay assessments to the FDIC for federal deposit insurance protection. The FDIC has adopted a risk-based assessment system as required by FDICIA. Under this system, FDIC-insured depository institutions pay insurance premiums at rates based on their risk classification. Institutions assigned to higher risk classifications (that is, institutions that pose a higher risk of loss to their respective deposit insurance funds) pay assessments at higher rates than institutions that pose a lower risk. An institution’s risk classification is assigned based on its capital levels and the level of supervisory concern the institution poses to the regulators. In addition, the FDIC can impose special assessments in certain instances. The FDIC may terminate its insurance of deposits if it finds that the institution has engaged in unsafe and unsound practices, is in an unsafe or unsound condition to continue operations, or has violated any applicable law, regulation, rule, order, or condition imposed by the FDIC. The Bank’s deposit insurance assessments may increase or decrease depending on the risk assessment classification to which it are assigned by the FDIC. Any increase in insurance assessments could have an adverse effect on the Bank’s earnings.
Check Clearing for the 21st Century Act
On October 28, 2003, the Check Clearing for the 21st Century Act, also known as Check 21, was enacted. Check 21, which became effective in October 2004, gives “substitute checks,” such as a digital image of a check and copies made from that image, the same legal standing as the original paper check. Some of the major provisions include:
| | | allowing check truncation without making it mandatory; |
| | | demanding that every financial institution communicate to account holders in writing a description of its substitute check processing program and their rights under the law; |
| | | legalizing substitutions for and replacements of paper checks without agreement from consumers; |
| | | retaining in place the previously mandated electronic collection and return of checks between financial institutions only when individual agreements are in place; |
| | | requiring that when account holders request verification, financial institutions produce the original check (or a copy that accurately represents the original) and demonstrate that the account debit was accurate and valid; and |
| | | requiring recrediting of funds to an individual’s account on the next business day after a consumer proves that the financial institution has erred. |
Community Reinvestment Act
Under the Community Reinvestment Act, or CRA, as implemented by the Congress in 1977, a financial institution has a continuing and affirmative obligation, consistent with its safe and sound operation, to help meet the credit needs of its entire community, including low and moderate income neighborhoods. CRA does not establish specific lending requirements or programs for financial institutions nor does it limit an institution’s discretion to develop the types of products and services that it believes are best suited to its particular community, consistent with CRA. CRA requires federal examiners, in connection with the examination of a financial institution, to assess the institution’s record of meeting the credit needs of its community and to take such record into account in its evaluation of certain applications by such institution. CRA also requires all institutions to make public disclosure of their CRA ratings. The Bank has a Compliance Committee, which oversees the planning of products, and services offered to the community, especially those aimed to serve low and moderate income communities. The FDIC rated the Bank as “satisfactory” in meeting community credit needs under CRA at its most recent examination for CRA performance.
Consumer Laws and Regulations
In addition to the laws and regulations discussed herein, the Bank is also subject to certain consumer laws and regulations that are designed to protect consumers in transactions with banks. While the list set forth herein is not exhaustive, these laws and regulations include the Truth in Lending Act, the Truth in Savings Act, the Electronic Funds Transfer Act, the Expedited Funds Availability Act, the Equal Credit Opportunity Act, the Fair Housing Act, the Real Estate Settlement and Procedures Act, the Fair Credit Reporting Act and the Federal Trade Commission Act, among others. These laws and regulations mandate certain disclosure requirements and regulate the manner in which financial institutions must deal with customers when taking deposits or making loans to such customers. The Bank must comply with the applicable provisions of these consumer protection laws and regulations as part of its ongoing customer relations.
Permissible Activities and subsidiaries
California law permits state chartered commercial banks to engage in any activity permissible for national banks. Therefore, the Bank may form subsidiaries to engage in the many so-called “closely related to banking” or “non-banking” activities commonly conducted by national banks in operating subsidiaries, and further, pursuant to GLBA, the Bank may conduct certain “financial activities in a subsidiary to the same extent as may a national bank, provided the Bank is and remains “well-capitalized,” “well-managed” and in satisfactory compliance with CRA. Presently, the Bank does not have any financial subsidiaries.
In September 2007, the U.S. Securities and Exchange Commission, or SEC, and the Federal Reserve Board finalized joint rules required by the Financial Services Regulatory Relief Act of 2006 to implement exceptions provided in the GLBA for securities activities that banks may conduct without registering with the SEC as a securities broker or moving such activities to a broker-dealer affiliate. The Federal Reserve Board’s final Regulation R provides exceptions for networking arrangements with third party broker-dealers and authorities, including sweep accounts to money market funds, and with related trust, fiduciary, custodial and safekeeping needs. The final rules, which will not be effective until 2009, are not expected to have a material effect on the Bank as it does not have any securities activities.
Interstate Branching
Under current law, California state banks are permitted to establish branch offices throughout California with prior regulatory approval. In addition, with prior regulatory approval, banks are permitted to acquire branches of existing banks located in California. Finally, California state banks generally may branch across state lines by merging with banks in other states if allowed by the applicable states’ laws. California law, with limited exceptions, currently permits branching across state lines through interstate mergers resulting in the acquisition of a whole California bank that has been in existence for at least five years. Under the Federal Deposit Insurance Act, states may “opt-in” and allow out-of-state banks to branch into their state by establishing a new start-up branch in the state. California law currently prohibits de novo branching into the state of California. The Bank currently has branches located in the States of California, Texas, New Jersey and New York.
Federal Home Loan Bank System
The Federal Home Loan Bank system, or the FHLB, of which the Bank is a member, consists of 12 regional FHLBs governed and regulated by the Federal Housing Finance Board, or the FHFB. The FHLBs serve as reserve or credit facilities for member institutions within their assigned regions. They are funded primarily from proceeds derived from the sale of consolidated obligations of the FHLB system. They make loans (i.e., advances) to members in accordance with policies and procedures established by the FHLB and the boards of directors of each regional FHLB.
As a system member, the Bank is entitled to borrow from the FHLB of San Francisco, or FHLB-SF, and is required to own capital stock in the FHLB-SF in an amount equal to the greater of 1% of the membership asset value, not exceeding $25 million, or 4.7% of outstanding FHLB-SF advance borrowings. The Bank is in compliance with the stock ownership rules described above with respect to such advances, commitments and letters of credit and home mortgage loans and similar obligations. All loans, advances and other extensions of credit made by the FHLB-SF to the Bank are secured by a portion of the Bank’s mortgage loan portfolio, certain other investments and the capital stock of the FHLB-SF held by the Bank.
Mortgage Banking Operations
The Bank is subject to the rules and regulations of FNMA with respect to originating, processing, selling and servicing mortgage loans and the issuance and sale of mortgage-backed securities. Those rules and regulations, among other things, prohibit discrimination and establish underwriting guidelines which include provisions for inspections and appraisals, require credit reports on prospective borrowers and fix maximum loan amounts. Mortgage origination activities are subject to, among others, the Equal Credit Opportunity Act, Federal Truth-in-Lending Act and the Real Estate Settlement Procedures Act and the regulations promulgated thereunder which, among other things, prohibit discrimination and require the disclosure of certain basic information to mortgagors concerning credit terms and settlement costs. The Bank is also subject to regulation by the California Department of Financial Institutions, with respect to, among other things, the establishment of maximum origination fees on certain types of mortgage loan products.
Future Legislation and Economic Policy
We cannot predict what other legislation or economic and monetary policies of the various regulatory authorities might be enacted or adopted or what other regulations might be adopted or the effects thereof. Future legislation and policies and the effects thereof might have a significant influence on overall growth and distribution of loans, investments and deposits and affect interest rates charged on loans or paid from time and savings deposits. Such legislation and policies have had a significant effect on the operating results of commercial banks in the past and are expected to continue.
Item 1A. Risk Factors
The risks described below could materially and adversely affect our business, financial conditions and results of operations. You should carefully consider the following risk factors and all other information contained in this Report. The risks and uncertainties described below are not the only ones we face. Additional risks and uncertainties are discussed elsewhere in this Report, and there may be additional risks not presently known to us or that we currently believe are immaterial to our business. In addition, the trading price of our common stock could decline due to any of the events described in these risks.
If a significant number of clients fail to perform under their loans, our business, profitability, and financial condition would be adversely affected.
As a lender, the largest risk we face is the possibility that a significant number of our client borrowers will fail to pay their loans when due. If borrower defaults cause losses in excess of our allowance for loan losses, it could have an adverse effect on our business, profitability, and financial condition. We have established an evaluation process designed to determine the adequacy of the allowance for loan losses. Although this evaluation process uses historical and other objective information, the classification of loans and the establishment of loan losses are dependent to a great extent on our experience and judgment. Although we believe that our allowance for loan losses is at a level adequate to absorb any inherent losses in our loan portfolio, we cannot assure you that we will not further increase the allowance for loan losses or that regulators will not require us to increase this allowance.
Increases in our allowance for loan losses could materially affect our earnings adversely.
Like all financial institutions, we maintain an allowance for loan losses to provide for loan defaults and non-performance. Our allowance for loan losses is based on prior experience, as well as an evaluation of the risks in the current portfolio. However, actual loan losses could increase significantly as the result of changes in economic, operating and other conditions, including changes in interest rates, which are generally beyond our control. Thus, such losses could exceed our current allowance estimates. Although we believe that our allowance for loan losses is at a level adequate to absorb any inherent losses in our loan portfolio, we cannot assure you that we will not further increase the allowance for loan losses or regulators will not require us to increase this allowance. Either of these occurrences could materially affect our earnings adversely.
In addition, the FDIC and the DFI, as an integral part of their respective supervisory functions, periodically review our allowance for loan losses. Such regulatory agencies may require us to increase our provision for loan losses or to recognize further loan charge-offs, based upon judgments different from those of management. Any increase in our allowance required by the FDIC or the DFI could adversely affect us.
Banking organizations are subject to interest rate risk and variations in interest rates may negatively affect our financial performance.
A major portion of our net income comes from our interest rate spread, which is the difference between the interest rates paid by us on interest-bearing liabilities, such as deposits and other borrowings, and the interest rates we receive on interest-earning assets, such as loans we extend to our clients and securities held in our investment portfolio. Net interest spreads are affected by the difference between the maturities and repricing characteristics of interest earning assets and interest bearing liabilities. In addition, loan volume and yields are affected by market interest rates on loans, and rising interest rates generally are associated with a lower volume of loan originations.
On September 18, 2007 and in the months following that date, the federal funds rate and other short-term market interest rates, which are used to guide deposit pricing in most banking organizations, were decreased. Specifically, as a measure to counter the credit crisis, the Federal Reserve Board reduced the federal funds rate in September 2007, October 2007 and December 2007, by 50, 25, and 25 basis points, respectively. The reductions in the federal funds rate effectively lowered the average interest rate for 2007, which resulted in similar average yield rates compared to 2006. The interest rate ranges for 2007 and 2006 were 4.25% - 5.25% and 4.5% - 5.25%, respectively.
On January 22, 2008 and on January 30, 2008, the Federal Reserve Board further reduced the federal funds rate by 75 and 50 basis points, respectively. More reductions are anticipated in the upcoming months. The recent downward trend of interest rates is the counter to the upward interest rate movement since June 30, 2004. While the federal funds rate and other short-term market interest rates decreased substantially, the intermediate and long-term market interest rates, which are used by many banking organizations to guide loan pricing, have not decreased proportionately. This has led to a “steepening” of the market yield curve with statement term rates considerably lower than long term notes. We cannot assure you that we will be able to minimize our interest rate risk. In addition, while a decrease in the general level of interest rates may improve the ability of certain borrowers with variable rate loans to pay the interest on and principal of their obligations, it reduces our interest income, and may lead to an increase in competition among banks for deposits. Accordingly, changes in levels of market interest rates could materially and adversely affect our net interest spread, net interest margin and our overall profitability.
The profitability of Wilshire Bancorp will be dependent on the profitability of the Bank.
Because Wilshire Bancorp’s principal activity is to act as the holding company of the Bank, the profitability of Wilshire Bancorp will be dependent on the profitability of the Bank. The Bank operates in an extremely competitive banking environment, competing with a number of banks and other financial institutions which possess greater financial resources than those available to the Bank, in addition to other independent banks. In addition, the banking business is affected by general economic and political conditions, both domestic and international, and by government monetary and fiscal policies. Conditions such as inflation, recession, unemployment, high interest rates, short money supply, scarce natural resources, international terrorism and other disorders as well as other factors beyond the control of the Bank may adversely affect its profitability. Banks are also subject to extensive governmental supervision, regulation and control, and future legislation and government policy could adversely affect the banking industry and the operations of the Bank.
Wilshire Bancorp relies heavily on the payment of dividends from the Bank.
The Bank is the only source of significant income for Wilshire Bancorp. Accordingly, the ability of Wilshire Bancorp to meet its debt service requirements and to pay dividends depends on the ability of the Bank to pay dividends to it. However, the Bank is subject to regulations limiting the amount of dividends that it may pay to Wilshire Bancorp. For example, any payment of dividends by the Bank is subject to the FDIC’s capital adequacy guidelines. All banks and bank holding companies are required to maintain a minimum ratio of qualifying total capital to total risk-weighted assets of 8.0%, at least one-half of which must be in the form of Tier 1 capital, and a ratio of Tier 1 capital to average adjusted assets of 4.0%. If (i) the FDIC increases any of these required ratios; (ii) the total of risk-weighted assets of the Bank increases significantly; and/or (iii) the Bank’s income decreases significantly, the Bank’s Board of Directors may decide or be required to retain a greater portion of the Bank’s earnings to achieve and maintain the required capital or asset ratios. This will reduce the amount of funds available for the payment of dividends by the Bank to Wilshire Bancorp. Further, in some cases, the FDIC could take the position that it has the power to prohibit the Bank from paying dividends if, in its view, such payments would constitute unsafe or unsound banking practices. In addition, whether dividends are paid and their frequency and amount will depend on the financial condition and performance, and the discretion of the Board of Directors of the Bank. The foregoing restrictions on dividends paid by the Bank may limit Wilshire Bancorp’s ability to obtain funds from such dividends for its cash needs, including funds for payment of its debt service requirements and operating expenses and for payment of cash dividends to Wilshire Bancorp’s shareholders. The amount of dividends the Bank could pay to Wilshire Bancorp as of December 31, 2007 without prior regulatory approval, which is limited by statute to the sum of undivided profits for the current year plus net profits for the preceding two years, was $88.5 million.
The holders of recently issued debentures have rights that are senior to those of our shareholders.
In December 2002, the Bank issued an aggregate of $10 million of Junior Subordinated Debentures, sometimes referred to in this Report as the 2002 Junior Subordinated Debentures or the 2002 debentures. In addition, in the past three years, Wilshire Bancorp, as a wholly-owned subsidiary of the Bank in 2003 and as a parent company of the Bank in 2005 and 2007, issued an aggregate of $77,321,000 of Junior Subordinated Debentures as part of the issuance of $75,000,000 in trust preferred securities by statutory trusts wholly-owned by Wilshire Bancorp. The purpose of these transactions was to raise additional capital. These Junior Subordinated Debentures are senior in liquidation rights to our outstanding shares of common stock. The terms of these Junior Subordinated Debentures also restrict our ability to pay dividends on our common stock at any time we are in default under, or with respect to the Junior Subordinated Debentures issued in 2003, 2005 or 2007, have exercised our right to defer interest payments under the indentures governing these Junior Subordinated Debentures. As a result, in the event of our bankruptcy, dissolution or liquidation, the holder of these Junior Subordinated Debentures must be paid in full before any liquidating distributions may be made to the holders of our common stock. And if we default under the terms of these Junior Subordinated Debentures or utilize our right to defer interest payments on the Junior Subordinated Debentures issued in 2003, 2005 or 2007 no dividends may be paid to holders of our common stock for so long as we remain in default or have deferred amounts remaining unpaid. Because we are substantially dependent on dividends from the Bank in order to make the periodic payments due under the terms of the Junior Subordinated Debentures issued in 2003, 2005 and 2007, in the event that the Bank is unable to pay dividends to Wilshire Bancorp for any significant period of time, then we may be unable to pay the amounts due to the holders of these Junior Subordinated Debentures.
Adverse changes in domestic or global economic conditions, especially in California, could have a material adverse effect on our business, growth, and profitability.
If conditions worsen in the domestic or global economy, especially in California, our business, growth and profitability are likely to be materially adversely affected. A substantial number of our clients are geographically concentrated in California, and adverse economic conditions in California, particularly in the Los Angeles area, could harm the businesses of a disproportionate number of our clients. To the extent that our clients’ underlying businesses are harmed, they are more likely to default on their loans. We can provide no assurance that conditions in the California economy and in the economies of other areas where we operate will not deteriorate in the future and that such deterioration will not adversely affect us.
Recently negative development in the financial industry and U.S. and global credit markets may affect our operations and results.
Negative developments in the latter half of 2007 in the subprime mortgage market and the securitization markets for such loans have resulted in uncertainty in the financial markets generally and the expectation of a general economic downtown beginning in 2008. Commercial as well as consumer loan portfolio performances have deteriorated at many institutions and the competition for deposits and quality loans has increased significantly. In addition, the values of real estate collateral supporting many commercial loans and home mortgages have declined and may continue. Bank and bank holding company stock prices have been negatively affected as has the ability of banks and bank holding companies to raise capital or borrow in the debt markets compared to recent years. As a result, there is a potential for new federal or state laws and regulations regarding lending and funding practices and liquidity standards, and bank regulatory agencies are expected to be very aggressive in responding to concerns and trends identified in examinations, including the expected issuance of many formal enforcement orders. Negative developments in the financial industry and the impact of new legislation in response to those developments could negatively affect our operations by restricting our business operations, including our ability to originate or sell loans, and adversely affect our financial performance.
Our operations may require us to raise additional capital in the future, but that capital may not be available or may not be on terms acceptable to us when it is needed.
We are required by federal regulatory authorities to maintain adequate levels of capital to support our operations. We believe that our existing capital resources will satisfy our capital requirements for the foreseeable future and will be sufficient capital resources will satisfy our capital requirements for the foreseeable future and will be sufficient to offset any problem assets. However, should our asset quality erode and require significant additional provision, resulting in consistent net operating losses at the Bank, our capital levels will decline and we will need to raise capital. Our ability to raise additional capital, if needed, will depend on conditions in the capital markets at that time, which are outside our control, and on our financial performance. Accordingly, we cannot be certain of our ability to raise additional capital if needed or on terms acceptable to us. If we cannot raise additional capital when needed, our ability to further expand our operations through internal growth and acquisitions could be materially impaired.
The short-term and long-term impact of the new Basel II capital standards and the forthcoming new capital rules to be proposed for non-Basel II U.S. banks is uncertain.
As a result of the recent deterioration in the global credit markets and the potential impact of increased liquidity risk and interest rate risk, it is unclear what the short-term impact of the implementation Basel II may be or what impact a pending alternative standardized approach to Basel II option for non-Basel II U.S. banks may have on the cost and availability of different types of credit and the potential compliance costs of implementing the new capital standards.
Maintaining or increasing our market share depends on market acceptance and regulatory approval of new products and services.
Our success depends, in part, upon our ability to adapt our products and services to evolving industry standards and consumer demand. There is increasing pressure on financial services companies to provide products and services at lower prices. In addition, the widespread adoption of new technologies, including Internet-based services, could require us to make substantial expenditures to modify or adapt our existing products or services. A failure to achieve market acceptance of any new products we introduce, or a failure to introduce products that the market may demand, could have an adverse effect on our business, profitability, or growth prospects.
Significant reliance on loans secured by real estate may increase our vulnerability to downturns in the California real estate market and other variables impacting the value of real estate.
At December 31, 2007, approximately 79.9% of our loans were secured by real estate, a substantial portion of which consist of loans secured by real estate in California. Conditions in the California real estate market historically have influenced the level of our non-performing assets. A real estate recession in Southern California could adversely affect our results of operations. In addition, California has experienced, on occasion, significant natural disasters, including earthquakes, brush fires and, during early 1998 and late 2007, flooding attributed to the weather phenomenon known as “El Nino.” In addition to these catastrophes, California has experienced a moderate decline in housing prices beginning in late 2006. The decline in housing prices subsequently developed into the current credit crisis, characterized by the further decline in the real estate market in many parts of the country, including California, during the second half of 2007. The availability of insurance to compensate for losses resulting from such crises is limited. The occurrence of one or more of such crises could impair the value of the collateral for our real estate secured loans and adversely affect us.
If we fail to retain our key employees, our growth and profitability could be adversely affected.
Our future success depends in large part upon the continuing contributions of our key management personnel. If we lose the services of one or more key employees within a short period of time, we could be adversely affected. Our future success is also dependent upon our continuing ability to attract and retain highly qualified personnel. Competition for such employees among financial institutions in California is intense. Our inability to attract and retain additional key personnel could adversely affect us. We can provide no assurance that we will be able to retain any of our key officers and employees or attract and retain qualified personnel in the future. In November 2007, Brian E. Cho, our former Executive Vice President and Chief Financial Officer, resigned. Following his resignation, Elaine S. Jeon, Senior Vice President and Controller, was promoted to Senior Vice President and Interim Chief Financial Officer as Mr. Cho’s replacement. In addition, effective January 1, 2008, our former President and Chief Executive Officer, Soo Bong Min, retired. However, in connection with his retirement, we have entered into a consulting agreement providing for Mr. Min’s continued service as an advisor for the Bank until May 2009. Following Mr. Min’s retirement, Joanne Kim, previously our Executive Vice President and Chief Lending Officer, was promoted to Interim President and Chief Executive Officer.
We may be unable to manage future growth.
We may encounter problems in managing our future growth. Our total assets at December 31, 2007, 2006, and 2005 were $2.20 billion, $2.01 billion, and $1.67 billion, respectively, representing an increase of $188 million, or 9.4% in 2007 and $342 million, or 20.5% in 2006. We currently intend to consider additional “de novo” branches and LPOs and to investigate opportunities to acquire or combine with other financial institutions that would complement our existing business, as such opportunities may arise and consistent with our deliberate expansion strategy. No assurance can be provided, however, that we will be able to identify a suitable acquisition target or consummate any such acquisition. Further, our ability to manage growth will depend primarily on our ability to attract and retain qualified personnel, monitor operations, maintain earnings and control costs. Any failure by us to accomplish these goals could result in interruptions in our business plans and could also adversely affect current operations.
We could be liable for breaches of security in our online banking services. Fear of security breaches could limit the growth of our online services.
We offer various Internet-based services to our clients, including online banking services. The secure transmission of confidential information over the Internet is essential to maintain our clients’ confidence in our online services. Advances in computer capabilities, new discoveries or other developments could result in a compromise or breach of the technology we use to protect client transaction data. Although we have developed systems and processes that are designed to prevent security breaches and periodically test our security, failure to mitigate breaches of security could adversely affect our ability to offer and grow our online services and could harm our business.
People generally are concerned with security and privacy on the Internet and any publicized security problems could inhibit the growth of the Internet as a means of conducting commercial transactions. Our ability to provide financial services over the Internet would be severely impeded if clients became unwilling to transmit confidential information online. As a result, our operations and financial condition could be adversely affected.
Our directors and executive officers beneficially own a significant portion of our outstanding common stock.
As of February 29, 2008, our directors and executive officers, together with their respective affiliates, beneficially owned approximately 40% of our outstanding voting common stock (not including vested option shares). As a result, such shareholders may have the ability to significantly influence the outcome of corporate actions requiring shareholder approval, including the election of directors and the approval of significant corporate transactions, such as a merger or sale of all or substantially all of our assets. We can provide no assurance that the investment objectives of such shareholders will be the same as our other shareholders.
The market for our common stock is limited, and potentially subject to volatile changes in price.
The market price of our common stock may be subject to significant fluctuation in response to numerous factors, including variations in our annual or quarterly financial results or those of our competitors, changes by financial research analysts in their evaluation of our financial results or those of our competitors, or our failure or that of our competitors to meet such estimates, conditions in the economy in general or the banking industry in particular, or unfavorable publicity affecting us or the banking industry. In addition, the equity markets have, on occasion, experienced significant price and volume fluctuations that have affected the market prices for many companies’ securities and have been unrelated to the operating performance of those companies. In addition, the sale by any of our large shareholders of a significant portion of that shareholder’s holdings could have a material adverse effect on the market price of our common stock. Further, the registration of any significant amount of additional shares of our common stock will have the immediate effect of increasing the public float of our common stock and any such increase may cause the market price of our common stock to decline or fluctuate significantly. Any such fluctuations may adversely affect the prevailing market price of the common stock.
We face substantial competition in our primary market area.
We conduct our banking operations primarily in Southern California. Increased competition in our market may result in reduced loans and deposits. Ultimately, we may not be able to compete successfully against current and future competitors. Many competitors offer the same banking services that we offer in our service area. These competitors include national banks, regional banks and other community banks. We also face competition from many other types of financial institutions, including without limitation, savings and loan institutions, finance companies, brokerage firms, insurance companies, credit unions, mortgage banks and other financial intermediaries. In particular, our competitors include several major financial companies whose greater resources may afford them a marketplace advantage by enabling them to maintain numerous banking locations and mount extensive promotional and advertising campaigns. Additionally, banks and other financial institutions with larger capitalization and financial intermediaries not subject to bank regulatory restrictions have larger lending limits and are thereby able to serve the credit needs of larger customers. Areas of competition include interest rates for loans and deposits, efforts to obtain deposits, and range and quality of products and services provided, including new technology-driven products and services. Technological innovation continues to contribute to greater competition in domestic and international financial services markets as technological advances enable more companies to provide financial services. We also face competition from out-of-state financial intermediaries that have opened low-end production offices or that solicit deposits in our market areas. If we are unable to attract and retain banking customers, we may be unable to continue our loan growth and level of deposits and our results of operations and financial condition may otherwise be adversely affected.
Anti-takeover provisions of our charter documents may have the effect of delaying or preventing changes in control or management.
Certain provisions in our Articles of Incorporation and Bylaws could discourage unsolicited takeover proposals not approved by the Board of Directors in which shareholders could receive a premium for their shares, thereby potentially limiting the opportunity for our shareholders to dispose of their shares at the higher price generally available in takeover attempts or that may be available under a merger proposal or may have the effect of permitting our current management, including the current Board of Directors, to retain its position, and place it in a better position to resist changes that shareholders may wish to make if they are dissatisfied with the conduct of our business. The anti-takeover measures included in our Articles of Incorporation and Bylaws, include, without limitation, the following:
| | | the elimination of cumulative voting, |
| | | the adoption of a classified board of directors, |
| | | super-majority shareholder voting requirements to modify certain provisions of the Articles of Incorporation and Bylaws, and |
| | | restrictions on certain “business combinations” with third parties who may acquire our securities outside of an action taken by us. |
We are subject to significant government regulation and legislation that increases the cost of doing business and inhibits our ability to compete.
We are subject to extensive state and federal regulation, supervision and legislation, all of which is subject to material change from time to time. These laws and regulations increase the cost of doing business and have an adverse impact on our ability to compete efficiently with other financial service providers that are not similarly regulated. Changes in regulatory policies or procedures could result in management’s determining that a higher provision for loan losses would be necessary and could cause higher loan charge-offs, thus adversely affecting our net earnings. There can be no assurance that future regulation or legislation will not impose additional requirements and restrictions on us in a manner that could adversely affect our results of operations, cash flows, financial condition and prospects.
We could be negatively impacted by downturns in the South Korean economy.
Many of our customers are locally based Korean-Americans who also conduct business in South Korea. Although we conduct most of our business with locally-based customers and rely on domestically located assets to collateralize our loans and credit arrangements, we have historically had some exposure to the economy of South Korea in connection with certain of our loans and credit transactions with Korean banks. Such exposure has consisted of:
| | | discounts of acceptances created by banks in South Korea, |
| | | advances made against clean documents presented under sight letters of credit issued by banks in South Korea, |
| | | advances made against clean documents held for later presentation under letters of credit issued by banks in South Korea, and |
| | | extensions of credit to borrowers in the U.S. secured by letters of credit issued by banks in South Korea. |
We generally enter into any such loan or credit arrangements, in excess of $200,000 and of longer than 120 days, only with the largest of the Korean banks and spread other lesser or shorter term loan or credit arrangements among a variety of medium-sized Korean banks.
Due to the economic crisis in South Korea in the mid-1990’s, management has continued to closely monitor our exposure to the Korean economy and the activities of Korean banks with which we conduct business. To date, we have not experienced any significant losses attributable to our exposure to South Korea. Nevertheless, there can be no assurance that our efforts to minimize exposure to downturns in the Korean economy will be successful in the future, and another significant downturn in the Korean economy could result in significant credit losses for us.
In addition, because our customer base is largely Korean-American, our deposit base could significantly decrease as a result of a deterioration of the Korean economy. For example, some of our customers’ businesses may rely on funds from South Korea. Further, our customers may temporarily withdraw deposits in order to transfer funds and benefit from gains on foreign exchange and interest rates, and/or to help their relatives in South Korea during downturns in the Korean economy. A significant decrease in our deposits could also have a material adverse effect on our financial condition and results of operations.
Additional shares of our common stock issued in the future could have a dilutive effect.
Shares of our common stock eligible for future issuance and sale could have a dilutive effect on the market for our stock. Our Articles of Incorporation authorize the issuance of 80,000,000 shares of common stock. As of February 29, 2008, there were approximately 29,257,311 shares of our common stock issued and outstanding, plus an additional 476,876 shares of common stock reserved for issuance to the holders of stock options previously granted and still outstanding under the Wilshire State Bank 1997 Stock Option Plan, or the 1997 Stock Option Plan. Thus, approximately 50,138,388 shares of our common stock remain authorized (not reserved for stock options or available for future issuance and sale) at the discretion of our Board of Directors.
Shares of our preferred stock issued in the future could have dilutive and other effects.
Shares of our preferred stock eligible for future issuance and sale could have a dilutive effect on the market for the shares of our common stock. In addition to 80,000,000 shares of common stock, our Articles of Incorporation of the Company authorize the issuance of 5,000,000 shares of preferred stock. Although our Board of Directors has no present intent to authorize the issuance of shares of preferred stock, such shares could be authorized in the future. If such shares of preferred stock are made convertible into shares of common stock, there could be a dilutive effect on the shares of common stock then outstanding. In addition, shares of preferred stock may be provided a preference over holders of common stock upon our liquidation or with respect to the payment of dividends, in respect of voting rights or in the redemption of our capital stock. The rights, preferences, privileges and restrictions applicable to any series of preferred stock may be determined by resolution of our Board of Directors without the need for shareholder approval.
Item 1B. Unresolved Staff Comments
None.
Our primary banking facilities (corporate headquarters and various lending offices) are located at 3200 Wilshire Boulevard, Los Angeles, California and consist of approximately 42,255 square feet at the primary banking facilities as of the date of this Report. Our lease at the primary banking facilities runs through March 31, 2015, with our option to extend for two consecutive five-year periods. The combined monthly rents are currently $47,579.
We have 20 full-service branch banking offices in Southern California, Texas, New Jersey and New York. We also lease 6 separate LPOs in Aurora, Colorado (the Denver area); Atlanta, Georgia; Palisades Park, New Jersey; Houston, Texas; Annandale, Virginia; and Seattle Washington. Information about the properties associated with each of our banking facilities is set forth in the table below:
Property | | Ownership Status | | Square Feet | | Purchase Price | | Monthly Rent | | Use | | Lease Expiration |
Wilshire Office 3200 Wilshire Blvd. Suite 103 Los Angeles, California | | leased | | 7,426 | | n/a | | $ 10,099 | | Branch office | | March 2015 [w/right to extend for two consecutive 5-year periods] |
| | | | | | | | | | | | | |
Rowland Heights Office 19765 E. Colima Road Rowland Heights, California | | leased | | 2,860 | | n/a | | $ 8,390 | | Branch office | | May 2011 [w/right to extend for two consecutive 5-year periods] |
| | | | | | | | | | | | | |
Western Office 841 South Western Avenue Los Angeles, California | | leased | | 4,950 | | n/a | | $ 22,915 | | Branch office | | June 2010 [w/right to extend for one 5-year period] |
| | | | | | | | | | | | | |
Valley Office 8401 Reseda Boulevard Northridge, California | | leased | | 7,350 | | n/a | | $ 11,760 | | Branch office | | October 2017 [w/right to extend for two consecutive 5-year periods] |
| | | | | | | | | | | | | |
Downtown Office 1122 South Maple Avenue Suites 203,204, 205 and 206 Los Angeles, California | | leased | | 3,800 | | n/a | | $ 10,337 | | Branch office | | April 2010 [w/right to extend for one 5-year period] |
| | | | | | | | | | | | | |
Cerritos Office 17500 Carmenita Road Cerritos, California | | leased | | 4,774 | | n/a | | $ 4,751 | | Branch office | | January 2010 [w/right to extend for one 5-year period] |
| | | | | | | | | | | | | |
Gardena Office 15435 South Western Ave. Suite 100 Gardena, California | | leased | | 4,150 | | n/a | | $ 11,210 | | Branch office | | November 2010 [w/right to extend for two consecutive 5-year periods] |
| | | | | | | | | | | | | |
Rancho Cucamonga Office 8045 Archibald Avenue Rancho Cucamonga,California | | leased | | 3,000 | | n/a | | $ 5,655 | | Branch office | | November 2010 [w/right to extend for two consecutive 5-year periods] |
| | | | | | | | | | | | | |
Rancho Hannam Market Office 6735 Carnelian Avenue Rancho Cucamonga, California | | leased | | 1,016 | | n/a | | $ 5,294 | | Branch office | | October 2009 [w/right to extend for four consecutive 5-year periods] |
| | | | | | | | | | | | | |
Irvine Office 14451 Red Hill Avenue Tustin, California | | leased | | 1,200 | | n/a | | $ 6,190 | | Branch office | | June 2008 [w/right to extend for one 5-year period] |
| | | | | | | | | | | | | |
Mid-Wilshire Office 3832 Wilshire Boulevard Los Angeles, California | | leased | | 3,382 | | n/a | | $ 10,304 | | Branch office | | December 2012 |
| | | | | | | | | | | | | |
Fashion Town Office 1300 S. San Pedro Street Los Angeles, California | | leased | | 3,208 | | n/a | | $ 7,413 | | Branch office | | December 2009 [w/right to extend for two consecutive 5-year periods] |
| | | | | | | | | | | | | |
Fullerton Office 5254 Beach Blvd. Buena Park, California | | leased | | 1,440 | | n/a | | $ 4,070 | | Branch office | | July 2009 [w/right to extend for two consecutive 5-year periods] |
| | | | | | | | | | | | | |
Huntington Park Office 6350 Pacific Boulevard Huntington Park, California | | purchased in 2000 | | 4,350 | | $ 710,000 | | n/a | | Branch office | | n/a |
| | | | | | | | | | | | | |
Torrance Office 2390 Crenshaw Blvd. #D Torrance, California | | leased | | 1,550 | | n/a | | $ 5,052 | | Branch office | | January 2010 [w/right to extend for two consecutive 5-year periods] |
| | | | | | | | | | | | | |
Garden Grove Office 9672 Garden Grove Blvd. Garden Grove, California | | purchased in 2005 | | 2,549 | | $ 1,535,500 | | n/a | | Branch office | | n/a |
| | | | | | | | | | | | |
Dallas Office 2237 Royal Lane Dallas, Texas | | purchased in 2003 | | 7,000 | | $ 1,325,000 | | n/a | | Branch office | | n/a |
| | | | | | | | | | | | | |
Manhattan Office 11 West 32nd St. New York, NY | | leased | | 10,400 | | n/a | | $ 31,039 | | Branch office | | October 2009 |
| | | | | | | | | | | | | |
Bayside Office 210-16 Northern Blvd. Bayside, NY | | leased | | 2,445 | | n/a | | $13,000 | | Branch office | | April 2012 [w/right to extend for three consecutive 5-year periods] |
| | | | | | | | | | | | | |
Fort Lee Office 215 Main Street Fort Lee, NJ | | leased | | 2,264 | | n/a | | $ 9,800 | | Branch office | | May 2017 [w/right to extend for one 5-year period] |
| | | | | | | | | | | | | |
Denver Office 2821 S. Parker Road #415 Aurora, CO | | leased | | 1,135 | | n/a | | $ 1,371 | | LPO office | | July 2008 [w/right to extend for one 3-year period] |
| | | | | | | | | | | | | |
Atlanta Office 3510 Shallowford Road Atlanta, GA | | leased | | 900 | | n/a | | $ 1,764 | | LPO office | | Month to Month |
| | | | | | | | | | | | | |
Palisades Park Office 12 E. Ruby Avenue #B Palisades Park, NJ | | leased | | 1,200 | | n/a | | $ 2,500 | | LPO office | | July 2008 |
| | | | | | | | | | | | | |
Houston Office 9801 Westheimer #801 Houston, TX | | leased | | 1,096 | | n/a | | $ 1,796 | | LPO office | | March 2008 [w/right to extend for one 3-year period] |
| | | | | | | | | | | | | |
Annandale Office 7535 Little River Turnpike #310A Annandale, VA | | leased | | 1,150 | | n/a | | $ 1,872 | | LPO office | | May 2008 [w/right to extend for one 2-year period] |
| | | | | | | | | | | | | |
Seattle Office 10700 Meridian Avenue N., Suite 502 Seattle, WA | | leased | | 1,013 | | n/a | | $ 2,135 | | LPO office | | September 2009 |
Management has determined that all of our premises are adequate for our present and anticipated level of business.
From time to time, we are a party to claims and legal proceedings arising in the ordinary course of business. Our management evaluates our exposure to these claims and proceedings individually and in the aggregate and provides for potential losses on such litigation if the amount of the loss is estimatable and the loss is probable.
We believe that there are no material litigation matters at the current time. Although the results of such litigation matters and claims cannot be predicted with certainty, we believe that the final outcome of such claims and proceedings will not have a material adverse impact on our financial position, liquidity, or results of operations.
Item 4. | Submission of Matters to a Vote of Security Holders |
No matters were submitted to our shareholders, through the solicitation of proxies or otherwise, during the fourth quarter of the year ended December 31, 2007.
PART II
Item 5. | Market for Registrant’s Common Equity, Related Stockholder Matters and Issuer Purchases of Equity Securities |
Trading History
Wilshire Bancorp succeeded to the business and operations of the Bank upon consummation of the reorganization of the Bank into a holding company structure, effective as of August 25, 2004. As a result of the reorganization, shareholders of the Bank are now shareholders of the Company and the Bank is a direct subsidiary of Wilshire Bancorp. Prior to the reorganization, the Bank was listed for trading on the NASDAQ National Market under the symbol “WSBK.” Wilshire Bancorp’s common stock is now listed for trading on the NASDAQ Global Select Market under the symbol “WIBC.”
The information in the following table sets forth, for the quarters indicated, the high and low closing sale price for the common stock as reported on the NASDAQ Global Select Market:
| | | Closing Sale Price | |
| | | High | | Low | |
Year Ended December 31, 2007 | | | | | |
| First Quarter | | $ | 19.34 | | $ | 16.00 | |
| Second Quarter | | $ | 16.75 | | $ | 11.50 | |
| Third Quarter | | $ | 12.36 | | $ | 9.85 | |
| Fourth Quarter | | $ | 11.54 | | $ | 7.65 | |
Year Ended December 31, 2006 | | | | | | | |
| First Quarter | | $ | 19.61 | | $ | 16.78 | |
| Second Quarter | | $ | 19.44 | | $ | 16.53 | |
| Third Quarter | | $ | 19.71 | | $ | 17.64 | |
| Fourth Quarter | | $ | 19.99 | | $ | 18.48 | |
On February 29, 2008, the closing sales price for the Common Stock was $7.08, as reported on the NASDAQ Global Select Market.
Holders
As of February 29, 2008, there were 154 shareholders of record of the common stock (not including the number of persons or entities holding stock in nominee or street name through various brokerage firms).
Dividends
As a California corporation, we are restricted under the California General Corporation Law, or CGCL, from paying dividends under certain conditions. Our shareholders are entitled to receive dividends when and as declared by our board of directors, out of funds legally available for the payment of dividends, as provided in the CGCL. The CGCL provides that a corporation may make a distribution to its shareholders if retained earnings immediately prior to the dividend payout at least equal the amount of proposed distribution. In the event that sufficient retained earnings are not available for the proposed distribution, a corporation may, nevertheless, make a distribution, if it meets both the “quantitative solvency” and the “liquidity” tests. In general, the quantitative solvency test requires that the sum of the assets of the corporation equal at least 1¼ times its liabilities. The liquidity test generally requires that a corporation have current assets at least equal to current liabilities, or, if the average of the earnings of the corporation before taxes on income and before interest expenses for the two preceding fiscal years was less than the average of the interest expense of the corporation for such fiscal years, then current assets must be equal to at least 1¼ times current liabilities. In certain circumstances, we may be required to obtain the prior approval of the Federal Reserve Board to make capital distributions to our shareholders.
It has been our general practice to retain earnings for the purpose of increasing capital to support growth, and no cash dividends were paid to shareholders prior to 2005. However, we began paying a cash dividend to our shareholders beginning with the first quarter of 2005. While we currently pay cash dividends, dividends are subject to the discretion of our Board of Directors and will depend on a number of factors, including future earnings, financial condition, cash needs and general business conditions. Any dividend must also comply with the restrictions in our outstanding Junior Subordinated Debentures described earlier in this Report as well as applicable bank regulations.
Our ability to pay cash dividends in the future will depend in large part on the ability of the Bank to pay dividends on its capital stock to us. The ability of the Bank to pay dividends on its common stock is restricted by the California Financial Code, the FDIA and FDIC regulations. In general terms, California law provides that the Bank may declare a cash dividend out of net profits up to the lesser of retained earnings or net income for the last three fiscal years (less any distributions made to shareholders during such period), or, with the prior written approval of the Commissioner of Department of Financial Institutions, in an amount not exceeding the greatest of:
| | | net income for the prior fiscal year, or |
| | | net income for the current fiscal year. |
The Bank’s ability to pay any cash dividends will depend not only upon our earnings during a specified period, but also on our meeting certain capital requirements. The FDIA and FDIC regulations restrict the payment of dividends when a bank is undercapitalized, when a bank has failed to pay insurance assessments, or when there are safety and soundness concerns regarding a bank. The payment of dividends by the Bank may also be affected by other regulatory requirements and policies, such as maintenance of adequate capital. If, in the opinion of the regulatory authority, a depository institution under its jurisdiction is engaged in, or is about to engage in, an unsafe or unsound practice (which, depending on the financial condition of the depository institution, could include the payment of dividends), such authority may require, after notice and hearing, that such depository institution cease and desist from such practice.
The following table shows cash dividends declared for the two years ended December 31, 2007:
Declaration Date | | Payable Date | | Record Date | | Type |
| | | | | | | |
| February 23, 2006 | | April 14, 2006 | | March 31, 2006 | | $0.05 per share |
| | | | | | | |
| June 1, 2006 | | July 14, 2006 | | June 30, 2006 | | $0.05 per share |
| | | | | | | |
| August 30, 2006 | | October 16, 2006 | | September 29, 2006 | | $0.05 per share |
| | | | | | | |
| December 14, 2006 | | January 12, 2007 | | December 29, 2006 | | $0.05 per share |
| | | | | | | |
| March 1, 2007 | | April 16, 2007 | | March 30, 2007 | | $0.05 per share |
| | | | | | | |
| May 31, 2007 | | July 16, 2007 | | June 29, 2007 | | $0.05 per share |
| | | | | | | |
| August 30, 2007 | | October 15, 2007 | | September 28, 2007 | | $0.05 per share |
| | | | | | | |
| November 29, 2007 | | January 15, 2008 | | December 31, 2007 | | $0.05 per share |
Securities Authorized for Issuance under Equity Compensation Plans
In April 1997, the Company established the 1997 Stock Option Plan, which provided for the issuance of up to 6,499,800 shares of the Company’s authorized but unissued common stock to managerial employees and directors. Due to the expiration of the plan in February 2007, there are no additional options to be granted as of December 31, 2007. Hence, there are no stocks remaining available for future issuance under the 1997 Stock Option Plan as of December 31, 2007. Nonetheless, there were 522,476 shares of common stock reserved for issuance to the holders of stock options previously granted and still outstanding under the 1997 Stock Option Plan. The following table summarizes information as of December 31, 2007 relating to the number of securities to be issued upon the exercise of the outstanding options and their weighted-average exercise price.
| | | Number of Securities to be Issued Upon Exercise of Outstanding Options, Warrants and Rights | | Weighted-Average Exercise Price of Outstanding Options, Warrants and Rights | | Number of Securities Remaining Available for Future Issuance Under Equity Compensation Plans | |
| Equity Compensation Plans Approved by Security Holders | | | 522,476 | | $ | 12.16 | | | - | |
| Equity Compensation Plans Not Approved by Security Holders | | | - | | | - | | | - | |
| Total Equity Compensation Plans | | | 522,476 | | $ | 12.16 | | | - | |
Performance Graph
The following graph compares the yearly percentage change in cumulative total shareholders’ return on the Company’s stock with the cumulative total return of (i) of the NASDAQ market index; (ii) all banks and bank holding companies listed on NASDAQ; and (iii) the SNL Western Bank Index, comprised of banks and bank holding companies located in California, Oregon, Washington, Montana, Hawaii, Nevada and Alaska. Both the $100 Billion - $5 Billion Asset-Size Bank Index and the SNL Western Bank Index were compiled by SNL Securities LP of Charlottesville, Virginia. The graph assumes an initial investment of $100 and reinvestment of dividends. The graph is not necessarily indicative of future price performance.
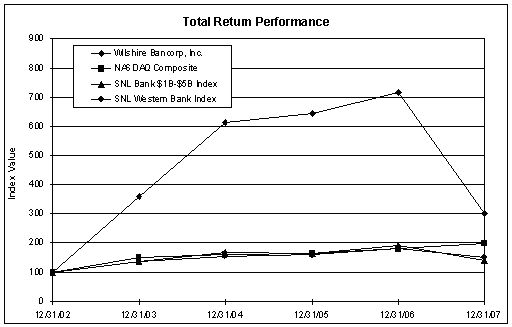
| | | Period Ending | |
Index | | 12/31/2002 | | 12/31/2003 | | 12/31/2004 | | 12/31/2005 | | 12/31/2006 | | 12/31/2007 | |
Wilshire Bancorp Inc. | | | 100.00 | | | 359.01 | | | 611.56 | | | 642.55 | | | 716.67 | | | 301.97 | |
NASDAQ Composite | | | 100.00 | | | 150.01 | | | 162.89 | | | 165.13 | | | 180.85 | | | 198.60 | |
SNL $1B - $5B Bank Index | | | 100.00 | | | 135.99 | | | 167.83 | | | 164.97 | | | 190.90 | | | 139.06 | |
SNL Western Bank Index | | | 100.00 | | | 135.46 | | | 153.94 | | | 160.27 | | | 180.84 | | | 151.05 | |
Issuer Purchase of Equity Securities
In July 2007, the Company’s board of directors authorized a stock repurchase program, under which up to $10 million outstanding common shares in the open market can be repurchased for a period of twelve months ending on July 31, 2008. Since its inception, the Company has repurchased a total of 127,425 shares at an average price of $9.91 through this program in 2007. At December 31, 2007, approximately $8.7 million was available for repurchase. Repurchases of the Company’s securities during the fourth quarter of 2007 were as follows:
Period | | Total Number of Shares Purchased | | Average Price Paid Per Share | | Total Number of Shares Purchased As Part of Publicly Announced Plans or Programs | | Max. Approximate Dollar Value of Shares that May Yet be Purchased under the Plans or Programs | |
| 10/01/2007 -10/31/2007 | | | | | | | | | | | $ | 9,589,605 | |
| 11/01/2007 -11/30/2007 | | | 87,800 | | $ | 9.70 | | | 87,800 | | $ | 8,738,311 | |
| 12/01/2007 -12/31/2007 | | | | | | | | | | | $ | 8,738,311 | |
Item 6. | Selected Financial Data |
The following table presents selected historical financial information as of and for each of the years in the five years ended December 31, 2007. The selected historical financial information is derived from our audited consolidated financial statements and should be read in conjunction with our financial statements and the notes thereto which appear elsewhere in this Annual Report and “Management’s Discussion and Analysis of Financial Condition and Results of Operation” in Item 7 below:
| | | As of and For the Years Ended December 31, | |
| | | 2007 | | 2006 | | 2005 | | 2004 | | 2003 | |
| | | (Dollars in Thousands) | |
Summary Statement of Operations Data: | | | | | | | | | | | |
| Interest income | | $ | 157,636 | | $ | 141,400 | | $ | 97,289 | | $ | 59,798 | | $ | 40,926 | |
| Interest expense | | | 76,286 | | | 64,823 | | | 34,341 | | | 17,463 | | | 11,944 | |
| Net interest income before provision for loan losses | | | 81,350 | | | 76,577 | | | 62,948 | | | 42,335 | | | 28,982 | |
| Provision for losses on loans and loan commitments | | | 14,980 | | | 6,000 | | | 3,350 | | | 3,567 | | | 2,783 | |
| Noninterest income | | | 22,584 | | | 26,400 | | | 20,478 | | | 20,997 | | | 17,099 | |
| Noninterest expenses | | | 44,839 | | | 41,232 | | | 33,563 | | | 27,283 | | | 21,986 | |
| Income before income taxes | | | 44,115 | | | 55,745 | | | 46,513 | | | 32,482 | | | 21,312 | |
| Income tax provision | | | 17,309 | | | 21,803 | | | 18,753 | | | 13,024 | | | 8,495 | |
| Net income | | | 26,806 | | | 33,942 | | | 27,760 | | | 19,458 | | | 12,817 | |
Per Share Data:1 | | | | | | | | | | | | | | | | |
| Net income | | | | | | | | | | | | | | | | |
| Basic | | $ | 0.91 | | $ | 1.17 | | $ | 0.97 | | $ | 0.70 | | $ | 0.50 | |
| Diluted | | $ | 0.91 | | $ | 1.16 | | $ | 0.96 | | $ | 0.68 | | $ | 0.44 | |
| Book value | | $ | 5.87 | | $ | 5.12 | | $ | 3.95 | | $ | 3.14 | | $ | 2.27 | |
| Weighted average common shares outstanding | | | | | | | | | | | | | | | | |
| Basic | | | 29,339,454 | | | 28,986,217 | | | 28,544,474 | | | 27,623,766 | | | 25,781,222 | |
| Diluted | | | 29,449,211 | | | 29,330,732 | | | 28,913,542 | | | 28,515,881 | | | 28,973,208 | |
| Year end shares outstanding | | | 29,253,311 | | | 29,197,420 | | | 28,630,600 | | | 28,142,470 | | | 25,902,728 | |
| 1 | As adjusted to reflect a 10% stock dividend issued in May 2003 and two two-for-one stock splits effected in the form of a 100 % stock dividend, issued in December 2003 and 2004, respectively. |
| | | As of and For the Years Ended December 31, | |
| | | 2007 | | 2006 | | 2005 | | 2004 | | 2003 | |
| | | (Dollars in Thousands) | |
Summary Statement of Financial Condition Data (Year End): | | | | | | | | | | | |
Total loans, net of unearned income 1 | | $ | 1,809,050 | | $ | 1,560,539 | | $ | 1,262,560 | | $ | 1,020,723 | | $ | 757,006 | |
| Allowance for loan losses | | | 21,579 | | | 18,654 | | | 13,999 | | | 11,111 | | | 9,011 | |
| Other real estate owned | | | 133 | | | 138 | | | 294 | | | - | | | 377 | |
| Total assets | | | 2,196,705 | | | 2,008,484 | | | 1,666,273 | | | 1,265,641 | | | 983,264 | |
| Total deposits | | | 1,763,071 | | | 1,751,973 | | | 1,409,465 | | | 1,098,705 | | | 856,239 | |
| Federal Home Loan Bank Advances | | | 150,000 | | | 20,000 | | | 61,000 | | | 41,000 | | | 29,000 | |
| Junior Subordinated Debentures | | | 87,321 | | | 61,547 | | | 61,547 | | | 25,464 | | | 25,464 | |
| Total shareholders’ equity | | | 171,786 | | | 149,635 | | | 113,104 | | | 88,307 | | | 58,741 | |
Performance ratios: | | | | | | | | | | | | | | | | |
Return on average equity 2 | | | 16.33 | % | | 25.51 | % | | 27.21 | % | | 25.42 | % | | 24.56 | % |
Return on average assets 3 | | | 1.31 | % | | 1.85 | % | | 1.92 | % | | 1.70 | % | | 1.58 | % |
Net interest margin 4 | | | 4.28 | % | | 4.51 | % | | 4.71 | % | | 4.05 | % | | 3.89 | % |
Efficiency ratio 5 | | | 43.14 | % | | 40.04 | % | | 40.23 | % | | 43.08 | % | | 47.71 | % |
| Net loans to total deposits at year end | | | 101.38 | % | | 88.01 | % | | 88.58 | % | | 92.90 | % | | 88.41 | % |
| Dividend payout ratio | | | 21.98 | % | | 17.09 | % | | 16.48 | % | | - | | | - | |
Capital ratios: | | | | | | | | | | | | | | | | |
| Average shareholders’ equity to average total assets | | | 8.01 | % | | 7.26 | % | | 7.05 | % | | 6.71 | % | | 6.43 | % |
| Tier 1 capital to adjusted total assets | | | 10.36 | % | | 9.79 | % | | 9.39 | % | | 8.35 | % | | 6.36 | % |
| Tier 1 capital to total risk-weighted assets | | | 11.83 | % | | 11.81 | % | | 11.60 | % | | 9.87 | % | | 7.29 | % |
| Total capital to total risk-weighted assets | | | 14.58 | % | | 13.63 | % | | 14.41 | % | | 11.95 | % | | 11.60 | % |
Asset quality ratios: | | | | | | | | | | | | | | | | |
Nonperforming loans to total loans 6 | | | 0.59 | % | | 0.44 | % | | 0.20 | % | | 0.26 | % | | 0.50 | % |
Nonperforming assets 7 | | | | | | | | | | | | | | | | |
| to total loans and other real estate owned | | | 0.60 | % | | 0.45 | % | | 0.22 | % | | 0.26 | % | | 0.54 | % |
| Net charge-offs (recoveries) to average total loans | | | 0.66 | % | | 0.06 | % | | 0.03 | % | | 0.10 | % | | 0.02 | % |
| Allowance for loan losses to total loans at year end | | | 1.19 | % | | 1.20 | % | | 1.11 | % | | 1.09 | % | | 1.19 | % |
| Allowance for loan losses to nonperforming loans | | | 203.55 | % | | 272.38 | % | | 567.15 | % | | 411.63 | % | | 240.45 | % |
| 1 | Total loans are the sum of loans receivable and loans held for sale and reported at their outstanding principal balances net of any unearned income which is unamortized deferred fees and costs and premiums and discounts. |
| 2 | Net income divided by average shareholders’ equity. |
| 3 | Net income divided by average total assets. |
| 4 | Represents net interest income as a percentage of average interest-earning assets. |
| 5 | Represents the ratio of noninterest expense to the sum of net interest income before provision for loan losses and total noninterest income. |
| 6 | Nonperforming loans consist of nonaccrual loans, loans past due 90 days or more and restructured loans. |
| 7 | Nonperforming assets consist of nonperforming loans (see footnote no. 1 above), other real estate owned and repossessed vehicles. |
Item 7. | Management’s Discussion and Analysis of Financial Condition and Results of Operations |
This discussion presents management’s analysis of our results of operations and financial condition as of and for each of the years in the three-year period ended December 31, 2007. The discussion should be read in conjunction with our financial statements and the notes related thereto which appear elsewhere in this Report.
Executive Overview
Introduction
Wilshire Bancorp, Inc. succeeded to the business and operations of Wilshire State Bank (the “Bank”) upon consummation of the reorganization of the Bank into a holding company structure, effective as of August 25, 2004. Prior to the completion of the reorganization, the Bank was subject to the information, reporting and proxy statement requirements of the Exchange Act, pursuant to the regulations of its primary regulator, the Federal Deposit Insurance Corporation, or FDIC. Accordingly, the Bank filed annual and quarterly reports, proxy statements and other information with the FDIC. Pursuant to Rule 12g-3 of the Exchange Act, the Company has succeeded to the reporting obligations of the Bank and the reporting obligations of the Bank to the FDIC have terminated. Filings by the Company under the Exchange Act, like this Form 10-K, are to be made with the SEC. Note that while we refer generally to the Company throughout this filing, all references to the Company prior to August 26, 2004, except where otherwise indicated, are to the Bank.
We operate community banks in the general commercial banking business, with our primary market encompassing the multi-ethnic population of the Los Angeles metropolitan area. Our full-service offices are located primarily in areas where a majority of the businesses are owned by Korean-speaking immigrants, with many of the remaining businesses owned by Hispanic and other minority groups.
At December 31, 2007, we had approximately $2.20 billion in assets, $1.81 billion in total loans and $1.76 billion in deposits. We also have expanded and diversified our business by focusing on the continued development of our commercial and consumer lending divisions.
In May 2006, we completed the acquisition of Liberty Bank of New York (“Liberty”) and its merger into the Bank. With this acquisition, we added $66 million in total assets and two branches in New York City. We paid $14.5 million for this transaction, which consisted of $8.6 million in cash and $5.9 million in our common stock (328,110 shares). We also incurred merger-related costs of $625,000 which we recognized as additional consideration in connection with this business combination.
In July 2007, we acquired a branch of Royal Bank America (“RBA”) in Fort Lee, New Jersey in exchange for our branch at Flushing, New York. In this branch exchange transaction, we purchased selected fixed assets and assumed selected liabilities, including a portion of RBA’s time deposits. As consideration, we transferred to RBA selected intangible and fixed assets, and selected liabilities, including a portion of time deposits, intangible liabilities, and lease obligations. The amounts involved in this transaction were insignificant except for the time deposits exchanged. In the branch exchange transaction, both parties transferred deposit liabilities in the amount of approximately $6 million. The branch exchange transaction was accounted for as an exchange of assets and liabilities. The Fort Lee, New Jersey loan portfolio has grown 438.8% in the six-months since its acquisition, from $5.9 million to $31.7 million at the end of 2007. Deposit growth at the Fort Lee branch has also exceeded our expectation, increasing from $0 at the time of the branch exchange to $0.8 million at the end of 2007.
Subsequent to the branch exchange in July 2007, we opened a new Bayside branch in New York to compensate for the loss of our Flushing branch. The above-described transactions resulted in an expansion of our banking service and market coverage to the State of New Jersey and the greater New York City metropolitan area. Similar to the New Jersey branch, the loan portfolio of our two New York branches has grown 300.9% since the acquisition, from $25.7 million to $102.9 million at the end of 2007. Deposit portfolio has also experienced significant growth, up 145.3% from $50.5 million at the time of the acquisition to $123.9 million at the end of 2007.
In addition to our expansion into the New York/New Jersey area, we further expanded our banking network within the state of California. In December 2007, we opened a new branch office, Rancho Hannam in Rancho Cucamonga, California.
Over the past several years, our network of branches and LPOs has been expanded geographically. We currently maintain twenty branch offices and six LPOs. Our market coverage complements our multi-ethnic small business focus. We intend to be cautious about our growth strategy in future years regarding opening of additional branches and LPOs. We expect to continue our growth via thorough planning and market analysis, and as our needs and resources permit.
In December 2002, the Bank issued $10 million of the 2002 Junior Subordinated Debentures. Subsequently, the Company, as a wholly-owned subsidiary in 2003 and as a parent company of the Bank in 2005 and 2007, issued a total of $77,321,000 of Junior Subordinated Debentures in connection with a $75,000,000 trust preferred securities issuance by statutory trusts wholly-owned by the Company. We believe that the supplemental capital raised in connection with the issuance of these debentures allowed us to achieve and maintain status as a well-capitalized institution and sustained our continued loan growth.
As evidenced by our past several years of operations, we have experienced significant balance sheet growth. We have implemented a strategy of building our core banking foundation by focusing on commercial loans and business transaction accounts. Our management believes that this strategy has created recurring revenue streams, diversified our product portfolio and enhanced shareholder value.
2007 Key Performance Indicators
We believe the following were key indicators of our performance for operations during 2007:
| | | our total assets grew to $2.20 billion at the end of 2007, or an increase of 9.37% from $2.01 billion at the end of 2006. |
| | | our total deposits slightly grew to $1.76 billion at the end of 2007 compared with $1.75 billion at the end of 2006. |
| | | our total loans grew to $1.81 billion at the end of 2007, or an increase of 15.92% from $1.56 billion at the end of 2006. |
| | | total noninterest income decreased to $22.6 million in 2007, or a decrease of 14.5% from $26.4 million in 2006 mainly due to the reduction of volume and premium rate on sale of SBA loans under the weak national economy, attributable primarily to the credit crisis. |
| | | total noninterest expense increased to $44.8 million in 2007, or 8.74% from $41.2 million in 2006. The increase is mainly due to the increase in the FDIC deposit insurance premium, and expense related to expanded personnel and premises associated with our business growth. Nonetheless, due to our continuous effort in minimizing operating expenses, noninterest expenses as a percentage of average assets were lowered to 2.19% in 2007 from 2.25% in 2006. |
Net income for 2007 decreased to $26.8 million, or $0.91 per diluted common share as compared with $33.9 million, or $1.16 per diluted common share in 2006. The decrease in net income is primarily attributed to the change of management strategy and shifting our efforts and focus of the management from promoting profit growth to improving loan portfolio quality. We will discuss these changes in further detail throughout “Management’s Discussion and Analysis of Financial Condition and Results of Operations.”
2008 Outlook
As we look ahead to 2008, the economies and real estate markets in our primary market areas will continue to be significant determinants of the quality of our assets in future periods and thus our results of operations, liquidity and financial condition. Due to the decrease in housing prices starting late 2006, and the emergence of the credit crisis in mid-2007, the real estate market and our overall economy are generally declining. Growth in the national economy slowed during 2007, and we anticipate a further decline in 2008. As measures to stimulate the economy, the Federal Reserve Board has aggressively cut interest rates, by 75 and 50 basis points on January 22, 2008 and January 30, 2008, respectively, to boost spending and ease the shorting pressure of the market. The deterioration of our economy will negatively affect our asset quality. Responding proactively to this anticipated business environment, we are shifting our focus from growth to improvement of our asset quality. Since 2007, we have strengthened loan underwriting standards and are carefully scrutinizing any exceptions to our loan policy. We anticipate these changes will result in loan growth that is slower than our historic levels, but we also anticipate a resulting improvement in the quality of our loan portfolio.
We plan to continue to focus on management of our net interest margin. We are slightly asset sensitive for the first three-month time frame, meaning that more interest earning assets will reprice than interest bearing liabilities for the first quarter of 2008. However, we should begin to see improvements by the second quarter of 2008 as we are more liability sensitive in the long term as interest bearing liabilities will re-price more quickly than interest earning assets. The interest repricing gap in our models indicate that our margin generally increases in a declining interest-rate environment, nonetheless, we do not anticipate a major increase in our net interest margin because it is our expectation that the strategic change toward more moderate and quality loan growth will reduce the volume of our higher yielding, higher risk loans. Although we did not have any subprime borrowers in our current loan portfolio, it is our belief that a more stringent lending strategy is to our benefit in managing loan losses under this credit crisis. As a result, our net interest margin should experience only moderate growth. To complement these strategic changes, explore new business opportunities and reduce costs, we plan to extend our market coverage into the East Coast of the United States. We also plan to continue our core deposit campaign that links monetary awards to core deposit growth. We expect that these measures will benefit our net interest margin going forward.
Notwithstanding the overall slower national economy, we believe that there will be continued economic growth in our primary market areas, which includes the Korean-American business sectors located in Southern California, Texas, New Jersey, and the greater New York City metropolitan area. We expect that this growth will be mainly attributable to an anticipated capital influx from the Republic of Korea. We therefore believe that we will continue to grow, provided that such growth will be at a more controlled pace than we have experienced in the past few years. The reduction in our growth rate is expected to result in a healthier balance sheet, as we expect to see less non-performing loans. Hence, our asset base is expected to be of better quality with more core-deposits.
We will continue to consider opportunities for growth in our existing markets, as well as opportunities to expand into new markets through de novo branching and regional LPOs. We are currently in the planning process of opening our second New Jersey branch in Palisades Park during the third quarter of 2008, and a new branch in Los Angeles, California during the second quarter of 2008. We believe the second New Jersey branch, together with the existing Fort Lee, New Jersey branch and the New York branches, will be a critical part of our planned expansion strategy, especially in the East Coast market of the United States due to its high level of small business activity and diverse population.
In addition, we will continue to focus on streamlining our operations so that our expenses do not outpace the overall growth of our business.
Critical Accounting Policies
The discussion and analysis of our financial condition and results of operations is based upon our financial statements, which have been prepared in accordance with accounting principles generally accepted in the United States of America. The preparation of these financial statements requires management to make estimates and judgments that affect the reported amounts of assets and liabilities, revenues and expenses, and related disclosures of contingent assets and liabilities at the date of our financial statements. Actual results may differ from these estimates under different assumptions or conditions.
Various elements of our accounting policies, by their nature, are inherently subject to estimation techniques, valuation assumptions and other subjective assessments. In particular, we have identified several accounting policies that, due to judgments, estimates and assumptions inherent in those policies are critical to an understanding of our consolidated financial statements. These policies relate to the classification and valuation of investment securities, the methodologies that determine our allowance for loan losses, the treatment of non-accrual loans, the valuation of properties acquired through foreclosure, the valuation of retained interests and mortgage servicing assets related to the sales of Small Business Administration loans, and the treatment and valuation of stock-based compensation and business combination. In each area, we have identified the variables most important in the estimation process. We have used the best information available to make the estimates necessary to value the related assets and liabilities. Actual performance that differs from our estimates and future changes in the key variables could change future valuation and impact net income.
Allowance for Loan Losses
Accounting for the allowance for loan losses involves significant judgment and assumptions by management and is based on historical data and management’s view of the current economic environment. At least on a quarterly basis, our management reviews the methodology and adequacy of the allowance for loan losses and reports its assessment to the Board of Directors for its review and approval.
We base our allowance for loan losses on an estimate of probable losses inherent in our loan portfolio. Our methodology for assessing loan loss allowances is intended to reduce the differences between estimated and actual losses and involves a detailed analysis of our loan portfolio in three phases:
| | | the specific review of individual loans in accordance with Statement of Financial Accounting Standards (SFAS) No.114, Accounting by Creditors for Impairment of a Loan, |
| | | the segmenting and reviewing of loan pools with similar characteristics in accordance with SFAS No. 5, Accounting for Contingencies, and |
| | | our judgmental estimate based on various qualitative factors. |
The first phase of our allowance analysis involves the specific review of individual loans to identify and measure impairment. At this phase, we evaluate each loan except for homogeneous loans, such as automobile loans and home mortgages. Specific risk-rated loans are deemed impaired with respect to all amounts, including principal and interest, which will likely not be collected in accordance with the contractual terms of the related loan agreement. Impairment for commercial and real estate loans is measured either based on the present value of the loan’s expected future cash flows or, if collection on the loan is collateral dependent, the estimated fair value of the collateral, less selling and holding costs.
The second phase involves segmenting the remainder of the risk-rated loan portfolio into groups or pools of loans, together with loans with similar characteristics for evaluation in accordance with SFAS No. 5. We perform loss migration analysis and calculate the loss migration ratio for each loan pool based on its historical net losses and benchmark it against the levels of other peer banks.
In the third phase, we consider relevant internal and external factors that may affect the collectability of a loan portfolio and each group of loan pools. As a general rule, the factors detailed below will be considered to have no impact to our loss migration analysis. However, if there exists information to warrant adjustment to the loss migration ratios, the changes will be made in accordance with the established parameters and supported by narrative and/or statistical analysis. We use a credit risk matrix to determine the impact to the loss migration analysis. This matrix enables management to adjust the general allocation based on the loss migration ratio. The factors currently considered include, but are not limited to, those described below. For all factors, the extent of the adjustment will be commensurate with the severity of the conditions that concern each factor.
| | | Concentration of Credits: This factor may be adjusted based on the identification of any concentration or significant changes to the level of identified concentrations of credit. A concentration of credit is defined as loans to any single borrower, affiliated group of borrowers, or borrowers engaged in or dependent upon one industry that exceeds 25% of Tier 1 Capital & Reserves. A concentration can also result from an acquisition of a volume of loans from a single source, regardless of the diversity of the individual borrowers. |
| | | Delinquency Trends: The trend of delinquency shall be assessed by the quarterly trend and by comparison with peer average. |
| | | Nature and Volume of Loan Trend: This factor will be adjusted for significant changes in the nature and volume of the loan portfolio. |
| | | Non-Accrual Loan Trend: The trend of non-accrual loans shall be assessed by the quarterly trend and by comparison with peer average. |
| | | Problem Loan Trend: This factor may be adjusted depending on the quarterly trend of criticized and classified loans in total loans. |
| | | Loss and Recovery Trend: This factor may be adjusted depending on the quarterly trend of net charge-offs and by comparison with peers. |
| | | Quality of Loan Review: This factor may be adjusted when there has been a noted and significant (as determined and documented from external or internal sources) deterioration or improvement in the loan review system and/or Bank Director’s oversight. An adjustment will generally occur when there had previously been a documented weakness and clear improvement was noted by external sources, or when a significant deterioration was noted by external sources, in the loan review system and/or the degree of oversight by the Bank Directors. In the absence of noted changes to the loan review system and/or the degree of oversight by the Bank Directors, no adjustment will be made. |
| | | Lending and Management Staff: This factor will be adjusted with changes to the experience, ability, and depth of lending management and staff that are significant enough to warrant adjustment to the loss migration ratio. If the staffing or the experience level of lending staff is considered to be adequate (as determined by an external source) then, in general, no adjustment will be made. |
| | | Lending Policies and Procedures: This factor may be adjusted depending on the documented results of external reviews of the policies and procedures, including underwriting standards and collection, charge-off, and recovery practices. The trend of policy or procedure exceptions will also have an impact on this factor. It is the objective of the Board of Directors and Management to maintain at all times adequate policies, procedures, underwriting standards, and practices. |
| | | Economic and Business Conditions: This factor may be adjusted depending on local, regional, and national economic trends and their perceived impact on particular market segments. In periods of stable economic environment, no adjustment will be made. |
| | | External Factors such as changes in legal and regulatory requirements, on the level of estimated credit losses in the current portfolio: This factor may be adjusted depending on the trend of external factors and their perceived impact on the overall credit risk. In periods of stable regulatory environment, no adjustment will be made. |
| | | Other adjustments: With a supporting rationale, this factor may be used for adjustments which cannot be addressed by the foregoing factors. |
The evaluation of the inherent loss with respect to these factors is subject to a higher degree of uncertainty because they are not identified with specific problem credits or portfolio components.
Central to our credit risk management and our assessment of appropriate loss allowance is our loan risk rating system. Under this system, the originating credit officer assigns borrowers an initial risk rating based on a thorough analysis of each borrower’s financial capacity in conjunction with industry and economic trends. Approvals are made based upon the amount of inherent credit risk specific to the transaction and are reviewed for appropriateness by senior line and credit administration personnel. Credits are monitored by line and credit administration personnel for deterioration in a borrower’s financial condition which may impact the ability of the borrower to perform under the contract. Although management has allocated a portion of the allowance to specific loans, specific loan pools, including off-balance sheet credit exposures which are reported separately as part of other liabilities, the adequacy of the allowance is considered in its entirety.
Small Business Administration Loans
Certain SBA loans that may be sold prior to maturity have been designated as held for sale at origination and are recorded at the lower of cost or market value, determined on an aggregate basis. A valuation allowance is established if the market value of such loans is lower than their cost, and operations are charged or credited for valuation adjustments. When we sell a loan, we usually sell the guaranteed portion of the loan and retain the non-guaranteed portion. We receive sales proceeds from: (i) the guaranteed principal of the loan, (ii) the deferred premium for the difference between the book value of the retained portion and the fair value allocated to the retained portion, and (iii) the loan excess servicing fee (“ESF”). At the time of sale, the deferred premium, which is amortized over the remaining life of the loan as an adjustment to yield, is recorded for the difference between the book value and the fair value allocated to the retained portion. The sales gain is recognized from the difference between the proceeds and the book value allocated to the sold portion.
We allocate the book value of the related loan among three portions on the basis of their relative fair value: (i) the sold portion, (ii) the retained portion, and (iii) the ESF. We estimate the fair value of each portion based on the following. The amount received for the sale represents the fair value of the sold portion. The fair value of the retained portion is computed by discounting its future cash flows over the estimated life of the loan. We calculate the fair value of the ESF for the loan from the cash in-flow of the net servicing fee over the estimated life of the loan, discounted at an above average discount rate and a range of constant prepayment rates of the related loans.
We capitalize the fair value allocated to ESF in two categories: (i) intangible servicing assets (the contracted servicing fee less normal servicing costs), and (ii) interest-only strip receivables (excess of ESF over the contracted servicing fee). The servicing asset is recorded based on the present value of the contractually specified servicing fee, net of servicing cost, over the estimated life of the loan, with an average discount rate and a range of constant prepayment rates of the related loans. Prior to December 31, 2006, the servicing asset is amortized in proportion to and over the period of estimated servicing income. For purposes of measuring impairment, the servicing assets are stratified by collateral types. Management periodically evaluates the fair value of servicing assets for impairment. A valuation allowance is recorded when the fair value is below the carrying amount and a recovery of the valuation allowance is recorded when its fair value exceeds the carrying amount. However, a reversal may not exceed the original valuation allowance recorded. On January 1, 2007, we adopted SFAS No. 156, Accounting for Servicing of Financial Assets, and selected a fair value measurement method to measure our servicing assets and liabilities and recognized the net increase in their fair value of $80,000, net of tax effects. Any subsequent increase or decrease in fair value of servicing assets and liabilities is to be included in our current earnings in the statement of operations. An interest-only strip is recorded based on the present value of the excess of future interest income, over the contractually specified servicing fee, calculated using the same assumptions as noted above. Interest-only strips are accounted for at their estimated fair value, with unrealized gains recorded as an adjustment in accumulated other comprehensive income in shareholders’ equity. If the estimated fair value is less than its carrying value, the loss is considered as other-than-temporary impairment and it is charged to the current earnings. I/O strips are amortized over the remaining life of the loan as an adjustment to yield and monitored for impairment.
Non-Accrual Loan Policy
Interest on loans is credited to income as earned and is accrued only if deemed collectible. Accrual of interest is discontinued when a loan is over 90 days delinquent unless management believes the loan is adequately collateralized and in the process of collection. Generally, payments received on nonaccrual loans are recorded as principal reductions. Interest income is recognized after all principal has been repaid or an improvement in the condition of the loan has occurred that would warrant resumption of interest accruals.
Goodwill
We recognized goodwill and intangible assets in connection with the acquisition of Liberty Bank of New York (see Note 13). In accordance with SFAS No. 142, Goodwill and Other Intangible Assets, goodwill will no longer be amortized, but rather be subject to impairment testing at least annually. In addition, recognized intangible assets are amortized to expense over the projected useful lives and are reviewed for impairment whenever events or changes in circumstances indicate that the carrying amount of the asset may not be recoverable. We tested goodwill and intangible assets for impairment as of December 31, 2007. There was no impairment in recorded goodwill and intangible assets as of December 31, 2007 (see Notes 1 and 14).
Affordable Housing Investments
The Company has invested in limited partnerships formed to develop and operate affordable housing units for lower income tenants throughout the states of California, Texas and New York. The costs of the investments are being amortized on a straight line method over the life of related tax credits. If the partnerships cease to qualify during the compliance period, the credits may be denied for any period in which the projects are not in compliance and a portion of the credits previously taken is subject to recapture with interest. Such investments are recorded in other assets in the accompanying consolidated statements of financial condition.
Repurchase of Common Stock
The Company’s board of directors authorized a stock repurchase program on July 26, 2007 for repurchases of up to $10 million outstanding common shares by July 31, 2008. Management was granted discretion on the purchase decisions under the general guidelines of the program. The Company used the cost method of accounting for treasury stock. The cost method requires it to record the reacquisition cost of treasury stock as a deduction from shareholders’ equity on the Consolidated Statements of Financial Condition.
Stock-Based Compensation
The Company issued stock-based compensation to certain employees, officers, and directors. Prior to December 31, 2005, the Company accounted for its fixed stock options using the intrinsic-value method, presented in Accounting Principles Board (APB) Opinion No.25, Accounting for Stock Issued to Employees, and its related interpretations, which generally does not result in compensation expense recognition. Under the intrinsic value method, compensation cost for stock options is measured at the date of grant as the excess, if any, of the quoted market price of our stock over the exercise price of the options. On January 1, 2006, the Company adopted SFAS 123R, Share-Based Payment, for stock based compensation. SFAS No. 123R allows for two alternative transition methods. The Company follows the modified prospective method, which requires application of the new Statement to new awards and to awards modified, repurchased or cancelled after the required effective date. Accordingly, prior period amounts have not been restated. Additionally, compensation cost for the portion of awards for which the requisite service has not been rendered that are outstanding as of January 1, 2006 are recognized as the requisite services are rendered on or after January 1, 2006. The compensation cost of that portion of awards is based on the grant-date fair value of those awards.
Other Real Estate Owned
Other real estate owned (“OREO”), which represents real estate acquired through foreclosure, or deed in lieu of foreclosure in satisfaction of commercial and real estate loans, is carried at the lower of cost or estimated fair value less the estimated selling costs of the real estate. The fair value of the property is based upon a current appraisal. The difference between the fair value of the real estate collateral and the loan balance at the time of transfer is recorded as a loan charge-off if fair value is lower than the loan balance. Subsequent to foreclosure, management periodically performs valuations and the OREO property is carried at the lower of carrying value or fair value, less cost to sell. The determination of a property’s estimated fair value incorporates (i) revenues projected to be realized from disposal of the property, (ii) construction and renovation costs, (iii) marketing and transaction costs, and (iv) holding costs (e.g., property taxes, insurance and homeowners’ association dues). Any subsequent declines in the fair value of the OREO property after the date of transfer are recorded through a write-down of the asset. Any subsequent operating expenses or income, reduction in estimated fair values, and gains or losses on disposition of such properties are charged or credited to current operations.
Investment Securities
Our investment policy seeks to provide and maintain liquidity, and to produce favorable returns on investments without incurring unnecessary interest rate or credit risk, while complementing our lending activities. Our investment securities portfolio is subject to interest rate risk. Fluctuations in interest rates may cause actual prepayments to vary from the estimated prepayments over the life of a security. This may result in adjustments to the amortization of premiums or accretion of discounts related to these instruments, consequently changing the net yield on such securities. Reinvestment risk is also associated with the cash flows from such securities. The unrealized gain/loss on such securities may also be adversely impacted by changes in interest rates.
Under SFAS No. 115, Accounting for Certain Investments in Debt and Equity Securities, investment securities that management has the positive intent and ability to hold to maturity are classified as “held-to-maturity” and recorded at amortized cost. Securities not classified as held-to-maturity or trading, with readily determinable fair values, are classified as “available-for-sale” and recorded at fair value. Purchase premiums and discounts are recognized in interest income using the interest method over the estimated lives of the securities.
Currently, all of our investment securities are classified as either available-for-sale or held-to-maturity. The unrealized gains and losses for available-for-sale securities are excluded from earnings and reported in other comprehensive income, as part of shareholders’ equity. In accordance with FASB Emerging Issues Task Force Issue No. (EITF) 03-1, The Meaning of Other-Than-Temporary Impairment and its Application to Certain Investments, we are obligated to assess, at each reporting date, whether there is “other than temporary” impairment to our investment securities. Declines in the fair value of held-to-maturity and available-for-sale securities below their cost that are deemed to be other than temporary are reflected in earnings as realized losses. Gains and losses on the sale of securities are recorded on the trade date.
As of December 31, 2007 and December 31, 2006, no investment securities were determined to have any other-than-temporary impairment. The unrealized losses on our government sponsored enterprises (“GSE”) bonds, collateralized mortgage obligations (“CMOs”), and mortgage-backed securities (“MBS”) are attributable to both changes in interest rates and a repricing risk in the market. All GSE bonds, GSE CMO, and GSE MBS securities are backed by U.S. Government Sponsored and Federal Agencies and therefore rated “AAA.” The Company has no exposure to the “Subprime Market” in the form of Asset Backed Securities (“ABS”) and Collateralized Debt Obligations (“CDOs”) that had previously been rated “AAA” but have since been downgraded to below investment grade. The Company has the intent and ability to hold the securities in an unrealized loss position at December 31, 2007 and 2006 until the market value recovers or the securities mature.
Municipal bonds and corporate bonds are evaluated by reviewing the credit-worthiness of the issuer and general market conditions. The unrealized losses on our investment in municipal and corporate securities were primarily attributable to both changes in interest rates and a repricing risk in the market. The Company has the intent and ability to hold the securities in an unrealized loss position at December 31, 2007 and 2006 until the market value recovers or the securities mature.
Results of Operations
Net Interest Income and Net Interest Margin
Our primary source of revenue is net interest income, which is the difference between interest and fees derived from earning assets and interest paid on liabilities obtained to fund those assets. Our net interest income is affected by changes in the level and mix of interest-earning assets and interest-bearing liabilities, referred to as volume changes. Our net interest income is also affected by changes in the yields earned on assets and rates paid on liabilities, referred to as rate changes. Interest rates charged on our loans are affected principally by the demand for such loans, the supply of money available for lending purposes and competitive factors. Those factors are, in turn, affected by general economic conditions and other factors beyond our control, such as federal economic policies, the general supply of money in the economy, legislative tax policies, the governmental budgetary matters, and the actions of the Federal Reserve Board.
Average net loans were $1.65 billion in 2007, as compared with $1.41 billion in 2006 and $1.12 billion in 2005, representing increases of 17.2% and 25.6% in 2007 and 2006, respectively, from each of the prior annual periods and average interest-earning assets were $1.90 billion in 2007, as compared with $1.70 billion in 2006 and $1.34 billion in 2005, representing increases of 11.9% and 27.1% in 2006 and 2005, respectively, from each of the prior annual periods. Our average interest-bearing deposits also increased by 12.3% to $1.42 billion in 2007, as compared with $1.27 billion in 2006, after increasing 34.5% in 2006 from $941 million in 2005. Together with other borrowings (see “Financial Condition-Deposits and Other Sources of Funds” below), average interest-bearing liabilities increased by 13.0% to $1.54 billion in 2007, as compared with $1.37 billion in 2006, after increasing by 31.0% in 2006 from $1.04 billion in 2005.
The Federal Reserve Board’s rate increases since June 2004 resulted in an increase in our average yield on interest-earning assets to 8.32% in 2006 from 7.28% in 2005. However, in response to the credit crisis, the Federal Reserve Board started its new series of interest rate reductions in September 2007. Accordingly, our yield slightly decreased to 8.29% in 2007. During the same time periods, the stiff competition for deposits in our local markets accelerated, causing our average cost on interest-bearing liabilities to increase to 4.94% in 2007 and to 4.74% in 2006 from 3.29% in 2005. As a result, interest income grew 11.5% to $157.6 million in 2007 compared to $141.4 million in 2006. The growth in interest income, however, was outpaced by a 17.7% increase in interest expense to $76.3 million in 2007 from $64.8 million in 2006. The increase of interest income in 2006 was 45.3% which was similarly outpaced by 88.8% increase in interest expense.
The net result of our growth and reduction in interest rate was a net increase our interest income. Net interest income increased by 6.2%, or $4.8 million, to $81.4 million in 2007, following an increase of 21.7%, or $13.6 million in 2006 to $76.6 million from $63.0 million in 2005. Impacted by the Federal Reserve Board’s rate cuts and the stiff deposit competition among financial institutions, our net interest spread and net interest margin deteriorated in 2007 to 3.35% and 4.28%, respectively, lowered from 3.58% and 4.51% in 2006, and 3.98% and 4.71% in 2005.
The following table sets forth, for the periods indicated, our average balances of assets, liabilities and shareholders’ equity, in addition to the major components of net interest income and net interest margin:
Distribution, Yield and Rate Analysis of Net Income
(Dollars in Thousands)
| | | | For the Years Ended December 31, | |
| | | | 2007 | | | | 2006 | | | | 2005 | |
| | | | Average Balance | | | Interest Income/ Expense | | | Average Rate/Yield | | | | Average Balance | | | Interest Income/ Expense | | | Average Rate/Yield | | | | Average Balance | | | Interest Income/ Expense | | | Average Rate/Yield | |
| | | | (Dollars in Thousands) | |
Assets: | | | | | | | | | | | | | | | | | | | | | | | | | | | | | | |
| Earning assets: | | | | | | | | | | | | | | | | | | | | | | | | | | | | | | |
Net loans1 | | $ | 1,649,130 | | $ | 144,740 | | | 8.78 | % | | $ | 1,407,250 | | $ | 127,840 | | | 9.08 | % | | $ | 1,120,371 | | $ | 89,628 | | | 8.00 | % |
| Securities of government sponsored enterprises | | | 173,581 | | | 8,765 | | | 5.05 | % | | | 173,985 | | | 7,687 | | | 4.42 | % | | | 122,698 | | | 4,374 | | | 3.56 | % |
| Other investment securities | | | 25,392 | | | 1,210 | | | 4.77 | % | | | 20,588 | | | 969 | | | 4.71 | % | | | 6,839 | | | 290 | | | 4.23 | % |
| Commercial paper | | | - | | | - | | | - | | | | - | | | - | | | - | | | | 2,358 | | | 82 | | | 3.47 | % |
| Federal funds sold | | | 54,026 | | | 2,921 | | | 5.41 | % | | | 97,198 | | | 4,886 | | | 5.03 | % | | | 80,859 | | | 2,796 | | | 3.46 | % |
| Money market preferred stocks | | | - | | | - | | | - | | | | - | | | - | | | - | | | | 4,019 | | | 116 | | | 2.90 | % |
| Interest-earning deposits | | | - | | | - | | | - | | | | 427 | | | 18 | | | 4.26 | % | | | 78 | | | 3 | | | 3.87 | % |
| Total interest-earning assets | | | 1,902,129 | | | 157,636 | | | 8.29 | % | | | 1,699,448 | | | 141,400 | | | 8.32 | % | | | 1,337,222 | | | 97,289 | | | 7.28 | % |
| Total noninterest-earning assets | | | 147,205 | | | | | | | | | | 133,920 | | | | | | | | | | 110,335 | | | | | | | |
| Total assets | | $ | 2,049,334 | | | | | | | | | $ | 1,833,368 | | | | | | | | | $ | 1,447,557 | | | | | | | |
Liabilities and Shareholders’ Equity: | | | | | | | | | | | | | | | | | | | | | | | | | | | | | | |
| Interest-bearing liabilities: | | | | | | | | | | | | | | | | | | | | | | | | | | | | | | |
| Money market deposits | | $ | 445,130 | | | 20,090 | | | 4.51 | % | | $ | 356,602 | | | 15,151 | | | 4.25 | % | | $ | 247,313 | | | 7,242 | | | 2.93 | % |
| Super NOW deposits | | | 22,511 | | | 297 | | | 1.32 | % | | | 20,853 | | | 245 | | | 1.18 | % | | | 21,447 | | | 187 | | | 0.87 | % |
| Savings deposits | | | 29,816 | | | 710 | | | 2.38 | % | | | 25,093 | | | 332 | | | 1.32 | % | | | 22,878 | | | 168 | | | 0.73 | % |
| Time certificates of deposit in denominations of $100,000 or more | | | 776,697 | | | 40,516 | | | 5.22 | % | | | 706,729 | | | 36,082 | | | 5.11 | % | | | 532,207 | | | 18,585 | | | 3.49 | % |
| Other time deposits | | | 146,837 | | | 7,153 | | | 4.87 | % | | | 155,741 | | | 7,133 | | | 4.58 | % | | | 116,698 | | | 3,732 | | | 3.20 | % |
| FHLB advances and other borrowings | | | 49,407 | | | 2,067 | | | 4.18 | % | | | 39,755 | | | 1,543 | | | 3.88 | % | | | 56,205 | | | 1,723 | | | 3.06 | % |
| Junior subordinated debenture | | | 73,904 | | | 5,453 | | | 7.38 | % | | | 61,547 | | | 4,337 | | | 7.05 | % | | | 46,421 | | | 2,704 | | | 5.83 | % |
| Total interest-bearing liabilities | | | 1,544,302 | | | 76,286 | | | 4.94 | % | | | 1,366,320 | | | 64,823 | | | 4.74 | % | | | 1,043,169 | | | 34,341 | | | 3.29 | % |
| Noninterest-bearing liabilities: | | | | | | | | | | | | | | | | | | | | | | | | | | | | | | |
| Noninterest-bearing deposits | | | 315,177 | | | | | | | | | | 310,031 | | | | | | | | | | 286,966 | | | | | | | |
| Other liabilities | | | 25,718 | | | | | | | | | | 23,974 | | | | | | | | | | 15,403 | | | | | | | |
| Total noninterest-bearing liabilities | | | 340,895 | | | | | | | | | | 334,005 | | | | | | | | | | 302,369 | | | | | | | |
| Shareholders’ equity | | | 164,137 | | | | | | | | | | 133,043 | | | | | | | | | | 102,018 | | | | | | | |
| Total liabilities and shareholders’ equity | | $ | 2,049,334 | | | | | | | | | $ | 1,833,368 | | | | | | | | | $ | 1,447,557 | | | | | | | |
| Net interest income | | | | | $ | 81,350 | | | | | | | | | $ | 76,577 | | | | | | | | | $ | 62,948 | | | | |
Net interest spread2 | | | | | | | | | 3.35 | % | | | | | | | | | 3.58 | % | | | | | | | | | 3.98 | % |
Net interest margin3 | | | | | | | | | 4.28 | % | | | | | | | | | 4.51 | % | | | | | | | | | 4.71 | % |
| 1 | Net loan fees have been included in the calculation of interest income. Net loan fees were approximately $6,692,000, $5,914,000, and $5,239,000 for the years ended December 31, 2007, 2006, and 2005, respectively. Loans are net of the allowance for loan losses, deferred fees, unearned income, and related direct costs, but include those placed on non-accrual status. |
| 2 | Represents the average rate earned on interest-earning assets less the average rate paid on interest-bearing liabilities. |
| 3 | Represents net interest income as a percentage of average interest-earning assets. |
The following table sets forth, for the periods indicated, the dollar amount of changes in interest earned and paid for interest-earning assets and interest-bearing liabilities and the amount of change attributable to changes in average daily balances (volume) or changes in average daily interest rates (rate). All yields were calculated without the consideration of tax effects, if any, and the variances attributable to both the volume and rate changes have been allocated to volume and rate changes in proportion to the relationship of the absolute dollar amount of the changes in each:
Rate/Volume Analysis of Net Interest Income
(Dollars in Thousands)
| | | For the Year Ended December 31, 2007 vs. 2006 Increases (Decreases) Due to Change In | | For the Year Ended December 31, 2006 vs. 2005 Increases (Decreases) Due to Change In | |
| | | Volume | | Rate | | Total | | Volume | | Rate | | Total | |
Interest income: | | | | | | | | | | | | | | | | | | | |
Net loans 1 | | $ | 21,352 | | $ | (4,452 | ) | $ | 16,900 | | $ | 24,984 | | $ | 13,228 | | $ | 38,212 | |
| Securities of government sponsored enterprises | | | (18 | ) | | 1,096 | | | 1,078 | | | 2,107 | | | 1,206 | | | 3,313 | |
| Other Investment securities | | | 229 | | | 12 | | | 241 | | | 643 | | | 36 | | | 679 | |
| Commercial paper | | | - | | | - | | | - | | | (82 | ) | | - | | | (82 | ) |
| Federal funds sold | | | (2,310 | ) | | 345 | | | (1,965 | ) | | 644 | | | 1,446 | | | 2,090 | |
| Money Market Preferred Stocks | | | - | | | - | | | - | | | (116 | ) | | - | | | (116 | ) |
| Interest-earning deposits | | | (18 | ) | | - | | | (18 | ) | | 15 | | | - | | | 15 | |
| | | | | | | | | | | | | | | | | | | | |
| Total interest income | | | 19,235 | | | (2,999 | ) | | 16,236 | | | 28,195 | | | 15,916 | | | 44,111 | |
| | | | | | | | | | | | | | | | | | | | |
Interest expense: | | | | | | | | | | | | | | | | | | | |
| Money market deposits | | | 3,949 | | | 990 | | | 4,939 | | | 3,915 | | | 3,994 | | | 7,909 | |
| Super NOW deposits | | | 21 | | | 31 | | | 52 | | | (5 | ) | | 63 | | | 58 | |
| Savings deposits | | | 72 | | | 306 | | | 378 | | | 18 | | | 146 | | | 164 | |
| Time certificates of deposit in denominations of $100,000 or more | | | 3,636 | | | 798 | | | 4,434 | | | 7,263 | | | 10,234 | | | 17,497 | |
| Other time deposits | | | (420 | ) | | 440 | | | 20 | | | 1,484 | | | 1,917 | | | 3,401 | |
| FHLB advances and other borrowings | | | 397 | | | 127 | | | 524 | | | (574 | ) | | 394 | | | (180 | ) |
| Junior subordinated debenture | | | 904 | | | 212 | | | 1,116 | | | 993 | | | 640 | | | 1,633 | |
| | | | | | | | | | | | | | | | | | | | |
| Total interest expense | | | 8,559 | | | 2,904 | | | 11,463 | | | 13,094 | | | 17,388 | | | 30,482 | |
| | | | | | | | | | | | | | | | | | | | |
| Change in net interest income | | $ | 10,676 | | $ | (5,903 | ) | $ | 4,773 | | $ | 15,101 | | $ | (1,472 | ) | $ | 13,629 | |
| 1 | Net loan fees have been included in the calculation of interest income. Net loan fees were approximately $6,692,000, $5,914,000 and $5,239,000 for the years ended December 31, 2007, 2006, and 2005, respectively. Loans are net of the allowance for loan losses, deferred fees, unearned income, and related direct costs, but include those placed on non-accrual status. |
Provision for Loan Losses
In anticipation of credit risk inherent in our lending business and the recent ongoing credit crisis, we set aside allowances through charges to earnings. Such charges were not made only for our outstanding loan portfolio, but also for off-balance sheet items, such as commitments to extend credits or letters of credit. The charges made for our outstanding loan portfolio were credited to allowance for loan losses, whereas charges for off-balance sheet items were credited to the reserve for off-balance sheet items, which are presented as a component of other liabilities.
Although we have enhanced our stringent loan underwriting standard and proactive credit follow-up procedures, we experienced a substantial increase of the provision for loan losses because of the weak economy, the decline in real estate market, and the unprecedented nationwide increase in subprime loan defaults and foreclosures. With our moderate loan growth, our provision for loan losses increased to $15.0 million in 2007 from $6.0 million and $3.4 million in 2006 and 2005, respectively, to keep pace with the continued growth of our loan portfolio and an increase of non-performing loans (see “Nonperforming Assets” below for further discussion). The said provision for loan losses included the amount we provided for the credit risk of off-balance sheet items ($1,107,000, $104,000 and $137,000 in 2007, 2006 and 2005, respectively). The procedures for monitoring the adequacy of the allowance for loan losses, as well as detailed information concerning the allowance itself, are described in the section entitled “Allowance for Loan Losses” below.
Noninterest Income
Total noninterest income decreased to $22.6 million in 2007 as compared with $26.4 million in 2006, but increased from $20.5 million in 2005. Noninterest income was 1.1% of average assets in 2007, lowered from 1.4% in 2006 and 2005. We currently earn non-interest income from various sources, including an income stream provided by bank owned life insurance, or BOLI, in the form of an increase in cash surrender value.
The following table sets forth the various components of our noninterest income for the periods indicated:
Noninterest Income
(Dollars in Thousands)
| | 2007 | | 2006 | | 2005 | |
For the Years Ended December 31, | | (Amount) | | (%) | | (Amount) | | (%) | | (Amount) | | (%) | |
| Service charges on deposit accounts | | $ | 9,781 | | | 43.3 | % | $ | 9,554 | | | 36.2 | % | $ | 7,547 | | | 36.9 | % |
| Gain on sale of loans | | | 7,502 | | | 33.2 | % | | 11,642 | | | 44.1 | % | | 8,310 | | | 40.6 | % |
| Loan-related servicing income | | | 1,612 | | | 7.1 | % | | 2,099 | | | 8.0 | % | | 1,997 | | | 9.7 | % |
| Income from other earning assets | | | 1,148 | | | 5.1 | % | | 1,045 | | | 3.9 | % | | 874 | | | 4.3 | % |
| Other income | | | 2,541 | | | 11.3 | % | | 2,060 | | | 7.8 | % | | 1,749 | | | 8.5 | % |
| Total | | $ | 22,584 | | | 100.0 | % | $ | 26,400 | | | 100.0 | % | $ | 20,477 | | | 100.0 | % |
| Average assets | | $ | 2,049,334 | | | | | $ | 1,833,368 | | | | | $ | 1,447,557 | | | | |
| Noninterest income as a % of average assets | | | | | | 1.1 | % | | | | | 1.4 | % | | | | | 1.4 | % |
Our largest source of noninterest income in 2007 was service charge income on deposit accounts, representing over 43% of total noninterest income. This revenue source generally increases in accordance with an increase in the number of transactional accounts and increased by 2.4% in 2007 to $9.8 million from $9.6 million in 2006. Since 2005, more rigid monitoring procedures were imposed on the money service business, or MSB, accounts. Hence, the volume of transactions and service fee income from the MSB accounts were reduced, which limited the increase in such revenue source. However, we have been seeing an increase in transactional accounts in the past couple of years, which resulted in the revenue increase in this category. Nonetheless, the service revenue increase was 2.4% in 2007, as compared to 26.6% increase in 2006 from $7.5 million in 2005. We constantly review service charge rates to maximize service charge income while maintaining a competitive position.
Our second largest source of noninterest income was the gain on sale of loans, representing approximately 33% of total noninterest income in 2007. It decreased to $7.5 million in 2007 from $11.6 million and $8.3 million in 2006 and 2005, respectively. This noninterest income is derived primarily from the sale of the guaranteed portion of SBA loans. We sell the guaranteed portion of SBA loans in government securities secondary markets and retain servicing rights. SBA loan production levels decreased to $139.5 million in 2007 as compared with $151.1 million and $142.1 million in 2006, and 2005, respectively, and accordingly the gain on sale of the guaranteed portions of SBA loans decreased to $5.9 million in 2007 as compared with $8.4 million in 2006 and $7.5 million in 2005. The $2.5 million decrease in gain of guaranteed portion of SBA loan sales in 2007 was primarily attributed to the sales decrease in premium rates from 8.0% in 2006 to 6.7% in 2007. We also sell the unguaranteed portion of SBA loans, but the resulting gains are not considered a stable source of income since the unguaranteed portion is sold primarily for credit risk management purposes. The gain on sale of the unguaranteed portions of SBA loans was $1.5 million, $3.1 million, and $0.5 million in 2007, 2006, and 2005, respectively. Similar to the guaranteed portion loan sales, the $1.8 million decreases in gain of unguaranteed portion of SBA loan sales in 2007 were primarily attributed to the decrease in sales premium rates from 3.78% in 2006 to 3.44% in 2007. This source of noninterest income also includes sales gains on residential mortgage loans. Since the inception of our Home Loan Center in the fourth quarter of 2003, the sale of residential mortgage loans have become a stable noninterest income source, but gain on such sales decreased to $121,000 in 2007, as compared with $225,000 and $313,000, in 2006 and 2005, respectively, due to the decline of the residential mortgage market.
The loan-related servicing income consists of trade-financing fees and servicing fees on SBA loans sold. Significant reversals of servicing assets on sold loans, which were paid off before their maturities, lowered this income source to $1.6 million in 2007 from $2.1 million and $2.0 million in 2006 and 2005, respectively. The servicing fees on sold SBA loans are credited when we collect the monthly payments on the sold loans we are servicing, and charged by the monthly amortization of servicing assets that we previously capitalized as intangible servicing assets and interest-only strip receivables upon sale of the related loans. Such servicing assets are also reversed and charged against the fee income account when the sold loans are paid off before the related servicing assets are fully amortized. In 2007, $1.8 million of servicing assets was charged back to this income account and reduced the balance by early pay-offs as compared with $1.4 million and $1.3 million in 2006 and 2005, respectively. In light of our increasing emphasis on trade financing activities and the continuing growth of our servicing loan portfolio ($338.2 million, $336.7 million, and $273.9 million at year-end 2007, 2006, and 2005, respectively), management believes that this income source should continue to improve despite the weak economy and the ongoing credit crisis. However, there can be no assurance that this will be the case.
Income on other earning assets represents income from earning assets other than interest-earning assets, such as dividend income from FHLB stock ownership and the increase in cash surrender value of BOLI. Such income was $1.2 million, $1.1 million and $0.9 million in 2007, 2006 and 2005, respectively. The $0.1 million change in 2007 was primarily due to $39,000 increase in BOLI interest income, and $64,000 increase in FHLB dividend income. Similarly in 2006, the $0.2 million increase in income was also primarily attributable to an additional BOLI interest and FHLB stock dividend.
Other income represented income from miscellaneous sources, such as loan referral fee, SBA loan packaging fee, gain on sale of investment securities and excess of insurance proceeds over carrying value of an insured loss and generally increases as our business grows. Other income increased to $2.5 million in 2007 from $2.1 million and $1.7 million in 2006 and 2005, respectively. The increase in 2007 was mainly attributed to $0.4 million increase in fair market value of the SBA servicing asset. The increase in other income in 2006 was also roughly $0.4 million, which has been consistent and reasonable.
Noninterest Expense
Total noninterest expense increased to $44.8 million in 2007 from $41.2 million in 2006 which previously increased from $33.6 million in 2005. These increases can be attributed to the expanded personnel and premises associated with our business growth, including the recent opening of new offices. However, due to continuing efforts to minimize operating expenses, noninterest expenses as a percentage of average assets was stable at 2.2% in 2007 and 2006, respectively, lowered from 2.3% in 2005. Management believes that its efforts in cost-cutting and revenue diversification have effectively maintained our operational efficiency at comparatively low levels in 2007 (the ratio of noninterest expense to the sum of net interest income before provision for loan losses and total noninterest income). Despite the weak economic condition, our efficiency ratio has only slightly increased to 43.1% in 2007 from 40.0% in 2006 and $40.2% in 2005.
The following table sets forth a summary of noninterest expenses for the periods indicated:
Noninterest Expense
(Dollars in Thousands)
| | 2007 | | 2006 | | 2005 | |
For the Years Ended December 31, | | (Amount) | | (%) | | (Amount) | | (%) | | (Amount) | | (%) | |
| Salaries and employee benefits | | $ | 24,437 | | | 54.5 | % | $ | 23,823 | | | 57.8 | % | $ | 19,226 | | | 57.3 | % |
| Occupancy and equipment | | | 5,302 | | | 11.8 | % | | 4,554 | | | 11.0 | % | | 3,465 | | | 10.3 | % |
| Data processing | | | 3,089 | | | 6.9 | % | | 2,450 | | | 5.9 | % | | 1,917 | | | 5.7 | % |
| Loan referral fee | | | 1,370 | | | 3.1 | % | | 1,523 | | | 3.7 | % | | 1,284 | | | 3.8 | % |
| Professional fees | | | 1,392 | | | 3.1 | % | | 1,143 | | | 2.8 | % | | 858 | | | 2.5 | % |
| Directors’ fees | | | 554 | | | 1.2 | % | | 535 | | | 1.3 | % | | 493 | | | 1.5 | % |
| Office supplies | | | 702 | | | 1.6 | % | | 709 | | | 1.7 | % | | 654 | | | 1.9 | % |
| Investor relation expenses | | | 294 | | | 0.7 | % | | 262 | | | 0.6 | % | | 379 | | | 1.1 | % |
| Advertising and promotional | | | 1,230 | | | 2.7 | % | | 1,256 | | | 3.0 | % | | 966 | | | 2.9 | % |
| Communications | | | 483 | | | 1.1 | % | | 462 | | | 1.1 | % | | 428 | | | 1.3 | % |
| Deposit insurance premium | | | 923 | | | 2.1 | % | | 187 | | | 0.5 | % | | 155 | | | 0.5 | % |
| Outsourced service for customers | | | 1,783 | | | 4.0 | % | | 1,349 | | | 3.3 | % | | 1,435 | | | 4.3 | % |
| Amortization of intangibles | | | 298 | | | 0.7 | % | | 185 | | | 0.4 | % | | - | | | - | |
| Other | | | 2,982 | | | 6.5 | % | | 2,794 | | | 6.9 | % | | 2,303 | | | 6.9 | % |
| Total | | $ | 44,839 | | | 100.0 | % | $ | 41,232 | | | 100.0 | % | $ | 33,563 | | | 100.0 | % |
| Average assets | | $ | 2,049,334 | | | | | $ | 1,833,368 | | | | | $ | 1,447,557 | | | | |
| Noninterest expense as a % of average assets | | | | | | 2.2 | % | | | | | 2.2 | % | | | | | 2.3 | % |
Salaries and employee benefits historically represent more than half of total noninterest expense and generally increase as our branch network and business volume expand. The new branch and loan production office openings increased these expenses to $24.4 million in 2007 as compared with $23.8 million in 2006 and $19.2 million in 2005, representing increases of 2.6% and 23.9% in 2007 and 2006, respectively, over each of the prior year periods. Despite our efforts to promote efficient operations by limiting personnel growth, the number of full-time equivalent employees increased to 368 in December 2007, as compared with 330 and 278 in 2006 and 2005, respectively. The $0.6 million increase in 2007 over 2006 was mainly caused by our further East Coast expansion via opening of the Bayside branch in New York. We have attempted to control the expense in this category, such that the percentage increase in 2007 was minimized. Our significant asset growth helped us maintain assets per employee at stable values, with $6.0 million, $6.1 million and $6.0 million at the end of 2007, 2006 and 2005, respectively.
Occupancy and equipment expenses represent approximately 10% to 12% of total noninterest expenses and totaled $5.3 million in 2007, compared to $4.6 million in 2006 and $3.5 million in 2005, representing increases of 16.4% and 31.4% in 2007 and 2006, respectively, over each of the prior year periods. These increases were attributable primarily to the expansion of our office network and the additional office space and lease expenses for new departments. The increases in 2007 was less significant as we had only one office opening in the New York-New Jersey area , compared to the two branch additions in 2006.
Data processing expenses increased 26.1% to $3.1 million in 2007 from $2.5 million in 2006, which previously increased 27.8% from $1.9 million in 2005. The increase in data processing corresponds to the growth of our business.
Loan referral fees are paid to brokers who refer loans to us, mostly SBA loans. Although we also pay referral fees for some qualified commercial loans, referral fee expenses generally correspond to our SBA loan production level. SBA loan production decreased to $139.5 million in 2007, from $151.1 million in 2006, which previously increased from $142.1 million in 2005. Accordingly, the referral fees decreased to $1.4 million in 2007, from $1.5 million in 2006, which previously increased from $1.3 million in 2005.
Professional fees generally increase as we grow and we expect these expenditures will continue to be significant, as we address the enhanced SEC and NASDAQ corporate governance requirements and the local regulation of the states into which we expand our business operations. Professional fees were $1.4 million, $1.1 million, and $0.9 million, or 3.1%, 2.8%, and 2.5% of total noninterest expense, in 2007, 2006 and 2005, respectively. The increase in professional fees is mainly attributable to the legal and accounting fees incurred for various legal consultation and to comply with the enhanced financial reporting requirements of the Sarbanes-Oxley Act, or SOX.
Advertising and promotional expenses decreased to $1.2 million in 2007 from $1.3 million in 2006 which previously increased from $1.0 million in 2005, representing 2.7%, 3.0%, and 2.9% of total noninterest expenses in 2007, 2006 and 2005, respectively. These expenses represent marketing activities, such as media advertisements and promotional gifts for customers of newly opened offices, especially in the new areas such as Texas, New Jersey and New York. The expenses in the past two years are higher than in 2005, which was primarily attributable to our expansion into the east coast. However, the 2007 expenses slightly decreased as compared to 2006, which was due to our effort to limit expenses.
Outsourced service costs for customers are payments made to third parties who provide services that were traditionally provided by banks to their customers, such as armored car services or bookkeeping services, and are recouped from the earnings credits earned by the respective depositors on their balances maintained with us. Due to the growth and expansion of our banking network, these expenses have increased to $1.8 million in 2007 from $1.3 million in 2006, due to increase in depositors demanding such services, such as escrow accounts and brokerage accounts. In 2006, these expenses slightly decreased from $1.4 million in 2005 due to a minor reduction of such services.
Deposit insurance premium expenses represent The Financing Corporation (FICO) and FDIC insurance premium assessments. In 2007, the expenses sharply increased to $0.9 million from $0.2 million in 2006, which was primarily attributable to the $0.7 million increase in FDIC risk insurance premium assessment (see related discussion in Item 1, Business). Prior to 2007, only FICO premium was assessed, the Bank paid no FDIC deposit insurance assessment. Hence, the expenses in this category stayed consistent between 2006 and 2005 at $0.2 million.
Investor relations expenses represent costs for providing services to our existing or prospective shareholders, such as NASDAQ listing fees, fees for an outside investor relations company and various promotional material costs. These expenses increased slightly to $294,000, as compared with $262,000 in 2006, primarily due to the expanded activities. In 2006, these expenses sharply decreased from $379,000 in 2005 because the NASDAQ listing fees were paid in 2005 for additional shares issued in connection with the December 2004 stock split.
Noninterest expense, other than the categories specifically addressed above, increased by $0.7 million, or 7.1%, to $5.0 million in 2007 from $4.7 million in 2006. In 2006, noninterest expenses increased by $0.8 million, or 20.8%, from $3.9 million in 2005. Such increases represent the normal growth in association with the growth of our business activities and appear in line with our expectation.
Generally, noninterest expense increased less rapidly at 8.7% in 2007 compared to 20.5% in 2006. This was primarily due to the slowing of our economy, and that our successful expansion into the New York/New Jersey market in 2006 has paved the groundwork for our further expansion into the east coast in 2007 and beyond. Hence, we did not see the same level of increase in expenses in 2006. Nonetheless, Management anticipates that noninterest expense will continue to increase as we continue to grow. However, management remains committed to cost-control and operational efficiency, and we expect to keep these increases to a minimum relative to our rate of growth.
Provision for Income Taxes
For the year ended December 31, 2007, we made a provision for income taxes of $17.3 million on pretax net income of $44.1 million, representing an effective tax rate of 39.2%, as compared with a provision for income taxes of $21.8 million on pretax net income of $55.7 million, representing an effective tax rate of 39.1% for 2006, and a provision of $18.8 million on pretax net income of $46.5 million, representing an effective tax rate of 40.3% for 2005.
The effective tax rate in 2007 stayed at about the same level as 2006. However, the effective tax rate in 2006 was slightly higher than 2005 by 1.2%, due mainly to the effect of a change in the 2005 estimated tax provision. We filed our 2006 income tax returns in the third quarter of 2006 and the actual income tax liability on the 2005 return was approximately $400,000 less than the provision we estimated in 2005, resulting in a reversal of tax payable in 2006. Our effective tax rates are usually one to two percentage points lower than statutory rates due to state tax benefits derived from doing business in an Enterprise Zone and the tax preferential treatment for the bank owned life insurance and low-income housing tax credit funds (see “Other Earning Assets” for further discussion). Generally, income tax expense is the sum of two components: current tax expense and deferred tax expense (benefit). Current tax expense is calculated by applying the current tax rate to taxable income. Deferred tax expense accounts for the change in deferred tax assets (liabilities) from year to year. Deferred income tax assets and liabilities represent the tax effects, based on current tax law, of future deductible or taxable amounts attributable to events that have been recognized in the financial statements. Because we traditionally recognize substantially more expenses in our financial statements than we have been allowed to deduct for taxes, we generally have a net deferred tax asset. At December 31, 2007, 2006 and 2005, we had net deferred tax assets of $9.2 million, $9.7 million and $8.1 million, respectively.
On January 1, 2007, we adopted the provisions of FASB Financial Interpretation No. (“FIN”) 48, Accounting for Uncertainty in Income Taxes. As a result of applying the provisions of FIN 48, we recognized an increase in the liability for unrecognized tax benefit and related interest of $162,000. As of December 31, 2007, the total unrecognized tax benefit was $207,000. The adjustment was solely related to the state exposure from California Enterprise Zone net interest deductions. We do not expect the unrecognized tax benefits to change significantly over the next 12 months.
As of the December 31, 2007, the total accrued interest related to uncertain tax positions, net of United States federal tax benefit, was $19,000. We accounted for interest related to uncertain tax positions as part of our provision for federal and state income taxes. Accrued interest was included as part of our net deferred tax asset in the consolidated financial statements.
We file United States federal and state income tax returns in jurisdictions with varying statue of limitations. The 2004 through 2007 tax years generally remain subject to examination by federal and most state tax authorities. We believe that we have adequately provided or paid for income tax issues not yet resolved with federal, state and foreign tax authorities. Based upon consideration of all relevant facts and circumstances, we do not believe the ultimate resolution of tax issues for all open tax periods will have a materially adverse effect upon our results of operations or financial condition (see Note 12).
Financial Condition
Loan Portfolio
Total loans are the sum of loans receivable and loans held for sale and reported at their outstanding principal balances net of any unearned income which is unamortized deferred fees and costs and premiums and discounts. Total loans net of unearned income increased by $248.5 million, or 15.92%, to $1.81 billion at December 31, 2007 from $1.56 billion at December 31, 2006. Total loans net of unearned income were $1.26 billion, $1.02 billion and $0.76 billion at December 31, 2005, 2004 and 2003, respectively. Total loans net of unearned income as a percentage of total assets were 82.4%, 77.7%, 75.8%, 80.6%, and 77.0% for 2007, 2006, 2005, 2004, and 2003 respectively.
In the ordinary course of our business, we originate and service our own loans. For salable loans that we choose to sell in the secondary market, we sell them with representations and warranties generally consistent with industry practices, but without recourse. The exception is SBA loans, which is our practice to resell these loans in the secondary market for the guaranteed portion with 90-day recourse. Hence, we do not retain much of the credit risk exposure on the loans sold. And, for all loans we originate and carry, we have not had any subprime loans.
Real estate secured loans consist primarily of commercial real estate loans and are extended to finance the purchase and/or improvement of commercial real estate and/or businesses thereon. The properties may be either user owned or for investment purposes. Our loan policy adheres to the real estate loan guidelines set forth by the FDIC. The policy provides guidelines including, among other things, fair review of appraisal value, limitation on loan-to-value ratio, and minimum cash flow requirements to service debt. Loans secured by real estate equaled $1.39 billion, $1.18 billion, $1.01 billion, $0.86 billion, and $0.61 billion, as of December 31, 2007, 2006, 2005, 2004 and 2003, respectively. Real estate secured loans as a percentage of total loans were 76.6%, 75.8%, 80.1%, 84.2%, and 80.3% at December 31, 2007, 2006, 2005, 2004 and 2003, respectively. Due to the decline of the real estate market nation wide and our target marketing efforts for unsecured business and commercial loans, the composition of real estate secured loans have decreased in 2007 and 2006 compared to the prior years, and we believe there will be further decreases going forward. We offer a wide selection of residential mortgage programs, including non-traditional mortgages such as interest only and payment option adjustable rate mortgages. However, we are extremely cautious at offering such unconventional loans to our customers, and currently we carried no subprime loans in our portfolio. Most of our salable loans are transferred to the secondary market while we retain a portion on our books as portfolio loans. This secondary market has become less active compared to the prior years, as the real estate market generally declines and a few key players in the market experience financial difficulties due to the credit crisis. Our total home mortgage loan portfolio outstanding at the end of 2007 and 2006 were $38.0 million and $40.6 million, respectively, and they represented only a small fraction of our total loan portfolio at 2.1% in 2007 and 2.6% in 2006. We have deemed its effect on our credit risk profile to be immaterial. The residential mortgage loans with unconventional terms such as interest only mortgage and option adjustable rate mortgage at December 31, 2007 were $2.9 million and $1.2 million, respectively, inclusive of loans held temporarily for sale or refinancing. They were $4.6 million and $1.1 million, respectively, at December 31, 2006.
Commercial and industrial loans include revolving lines of credit, as well as term business loans. Commercial and industrial loans were $330.1 million, $278.2 million, $190.8 million, $136.0 million, and $126.6 million at the end of 2007, 2006, 2005, 2004 and 2003, respectively. Commercial and industrial loans were 18.2%, 17.8%, 15.1%, 13.3%, and 16.7% as a percentage of total loans at the end of 2007, 2006, 2005, 2004 and 2003, respectively. Such increases in recent years were mainly caused by our marketing strategy targeted for the relationship-based accounts, such as unsecured business and commercial loans. Under the current economic condition, we exercise more due diligence in acquiring new loans. Hence, we expect to see our loan portfolio to continue growing, but at a more controlled pace.
Consumer loans have historically represented less than 5% of our total loan portfolio. The majority of consumer loans are concentrated in automobile loans, which we provide as a service only to existing customers. The balance of consumer loans have increased in the recent three years compared to prior years, they are $33.6 million, $53.1 million, $42.9 million, $18.8 million, and $15.0 million, at December 31, 2007, 2006, 2005, 2004 and 2003, respectively. However, as consumer loans present a higher risk potential compared to our loan products, especially during the current economic condition, we have reduced our effort in consumer lending in 2007. Hence, as of December 31, 2007, our consumer loan total was down $19.5 million from the prior year level. Nonetheless, consumer loans as a percentage of total loans have always been minimal. We do not see these loans, especially automobile loans, as our area of strength. Unlike other loan productions, management does not anticipate consumer loans to increase significantly going forward.
Construction loans are generally extended as a temporary financing vehicle only. In the third quarter of 2004, we formed a construction loan department by appointing a construction loan specialist as its manager. Since then, construction loans increased to $59.4 million, $46.3 million and $17.4 million, respectively at the end of 2007, 2006 and 2005, as compared with $7.0 million, and $7.8 million, respectively, at the end of 2004 and 2003. Construction loans as a percentage of total loans also increased to 3.3% at the end of 2007 from 3.0% and 1.4% in prior years. We expect to expand our construction lending activities with this specialized capacity under the guidance of the Commercial Loan Center.
Our loan terms vary according to loan type. Commercial term loans have typical maturities of three to five years and are extended to finance the purchase of business entities, business equipment, and leasehold improvements, or to provide permanent working capital. SBA-guaranteed loans usually have longer maturities (8 to 25 years). We generally limit real estate loan maturities to five to eight years. Lines of credit, in general, are extended on an annual basis to businesses that need temporary working capital and/or import/export financing. We generally seek diversification in our loan portfolio, and our borrowers are diverse as to industry, location, and their current and target markets.
The following table sets forth the amount of total loans net of unearned income and the percentage distributions in each category, as of the dates indicated:
Distribution of Loans and Percentage Composition of Loan Portfolio
| | | Amount Outstanding as of December 31, | |
| | | (Dollars in Thousands) | |
| | | 2007 | | 2006 | | 2005 | | 2004 | | 2003 | |
| Construction | | $ | 59,443 | | $ | 46,285 | | $ | 17,366 | | $ | 6,972 | | $ | 7,845 | |
| Real estate secured | | | 1,385,986 | | | 1,183,030 | | | 1,011,513 | | | 858,998 | | | 607,561 | |
| Commercial and industrial | | | 330,052 | | | 278,165 | | | 190,796 | | | 135,943 | | | 126,631 | |
| Consumer | | | 33,569 | | | 53,059 | | | 42,885 | | | 18,810 | | | 14,969 | |
| Total loans net of unearned income | | $ | 1,809,050 | | $ | 1,560,539 | | $ | 1,262,560 | | $ | 1,020,723 | | $ | 757,006 | |
| Participation loans sold and serviced by the Company | | $ | 338,166 | | $ | 336,652 | | $ | 273,876 | | $ | 235,534 | | $ | 180,558 | |
| Construction | | | 3.3 | % | | 3.0 | % | | 1.4 | % | | 0.7 | % | | 1.0 | % |
| Real estate secured | | | 76.6 | % | | 75.8 | % | | 80.1 | % | | 84.2 | % | | 80.3 | % |
| Commercial and industrial | | | 18.2 | % | | 17.8 | % | | 15.1 | % | | 13.3 | % | | 16.7 | % |
| Consumer | | | 1.9 | % | | 3.4 | % | | 3.4 | % | | 1.8 | % | | 2.0 | % |
| Total loans net of unearned income | | | 100.0 | % | | 100.0 | % | | 100.0 | % | | 100.0 | % | | 100.0 | % |
| | | | | | | | | | | | | | | | | |
The following table shows the contractual maturity distribution and repricing intervals of the outstanding loans in our portfolio as of December 31, 2007. In addition, the table shows the distribution of such loans between those with variable or floating interest rates and those with fixed or predetermined interest rates. The amounts on the table below are the gross loan balances at December 31, 2007 before netting unearned income totaling $5.9 million and the gross amount of non accrual loans of $14.7 million is not included:
Loan Maturities and Repricing Schedule
| | | At December 31, 2007, | |
| | | Within One Year | | After One But Within Five Years | | After Five Years | | Total | |
| | | (Dollars in Thousands) | |
| Construction | | $ | 59,443 | | $ | - | | $ | - | | $ | 59,443 | |
| Real estate secured | | | 836,643 | | | 471,665 | | | 68,076 | | | 1,376,384 | |
| Commercial and industrial | | | 313,750 | | | 13,626 | | | 3,630 | | | 331,006 | |
| Consumer | | | 20,781 | | | 12,634 | | | - | | | 33,415 | |
| Total loans | | $ | 1,230,617 | | $ | 497,925 | | $ | 71,706 | | $ | 1,800,248 | |
| | | | | | | | | | | | | | |
| Loans with variable (floating) interest rates | | $ | 1,154,489 | | $ | 21,439 | | $ | - | | $ | 1,175,928 | |
| Loans with predetermined (fixed) interest rates | | $ | 76,128 | | $ | 476,486 | | $ | 71,706 | | $ | 624,320 | |
| | | | | | | | | | | | | | |
The majority of the properties taken as collateral are located in Southern California. The loans generated by our loan production offices, which are located outside of our main geographical market, are generally collateralized by property in close proximity to those offices. We employ strict guidelines regarding the use of collateral located in less familiar market areas. Since a major real estate recession during the first part of the previous decade, property values in Southern California and around the country have generally increased in the last 10-year span from 1996 to 2006. Since late 2006, we have started to see below-trend growth in GDP and a slowdown of the real estate market in Southern California and many other areas in the country. Following the emergence of the credit crisis around July 2007, the real estate market has generally declined throughout the country. Nonetheless, as of year end 2007, 76.5% of our loans are secured by first mortgages on various types of real estate with weighted average loan to value ratio of 60.4%. We expect to see this decline in real estate values to continue into 2008, so with the current economic conditions, no assurance can be given that property values will not significantly decrease further in 2008.
Nonperforming Assets
Nonperforming assets consist of loans on non-accrual status, loans 90 days or more past due and still accruing interest, loans restructured, where the terms of repayment have been renegotiated resulting in a reduction or deferral of interest or principal, and other nonperforming assets.
Loans are generally placed on non-accrual status when they become 90 days past due, unless management believes the loan is adequately collateralized and in the process of collection. The past due loans may or may not be adequately collateralized, but collection efforts are continuously pursued. Loans may be restructured by management when a borrower has experienced some changes in financial status, causing an inability to meet the original repayment terms, and where we believe the borrower will eventually overcome those circumstances and repay the loan in full. Other nonperforming assets, mainly other real estate owned, or OREO, and repossessed vehicles, consist of properties acquired by foreclosure or similar means that management intends to offer for sale.
Despite the significant growth of our loan portfolio, our continued emphasis on asset quality control enabled us to maintain a relatively low level of nonperforming loans prior to 2007. However, the general economic condition of the United States as well as the local economies in which we do business has shown a slowdown as the housing sector declined in 2007 and the transition to below-trend GDP growth has started. This transition of the economy affected our borrowers’ strength and our nonperforming loans, net of SBA guaranteed portion, increased to $10.6 million at the end of 2007, as compared with $6.8 million, $2.5 million, $2.7 million, and $3.7 million at the end of 2006, 2005, 2004, and 2003, respectively. At December 31, 2007, the nonperforming loans as a percentage of total loans was 0.59%, increased from 0.44%, 0.20%, 0.26% and 0.50% in 2006, 2005, 2004 and 2003, respectively.
At December 31, 2007, we had $183,000 as other nonperforming assets, the majority of which were represented by one OREO ($133,000) foreclosed in October 2007. We have listed the property for sale as of December 31, 2007. At the end of 2006, we had a different OREO, which was subsequently sold in January 2007 at a small loss. At the end of 2005, we had three OREO as other nonperforming assets in an amount of $294,000, which were subsequently sold without significant losses. We had no other nonperforming assets at the end of 2004. And, at the end of 2003, our only nonperforming asset was a single-family residence in an amount of $377,000, which was subsequently sold without a significant loss. Together with OREO and repossessed vehicles, we managed the ratio of nonperforming assets as a percentage of total loans and other nonperforming assets at a relatively low level for the past five years, equaling 0.60%, 0.45%, 0.22%, 0.26%, and 0.54% as of December 31, 2007, 2006, 2005, 2004 and 2003, respectively.
Management believes that the reserve provided for nonperforming loans, together with the tangible collateral, were adequate as of December 31, 2007. See “Allowance for Loan Losses” below for further discussion. Except as disclosed above, as of December 31, 2007, management was not aware of any material credit problems of borrowers that would cause it to have serious doubts about the ability of a borrower to comply with the present loan payment terms. However, no assurance can be given that credit problems do not exist that may not have been brought to the attention of management.
The following tables provide information with respect to the components of our nonperforming assets as of the dates indicated (the figures in the table are gross and net of the portion guaranteed by the U.S. Government, respectively):
Non-performing Assets (Gross)
| | | At December 31, | |
| | | 2007 | | 2006 | | 2005 | | 2004 | | 2003 | |
| | | (Dollars in Thousands) | |
Nonaccrual loans:1 | | | | | | | | | | | |
| Real estate secured | | $ | 10,250 | | $ | 5,190 | | $ | 2,992 | | $ | 4,483 | | $ | 4,617 | |
| Commercial and industrial | | | 4,314 | | | 3,323 | | | 1,714 | | | 2,067 | | | 2,316 | |
| Consumer | | | 154 | | | 930 | | | 292 | | | - | | | - | |
| Total | | | 14,718 | | | 9,443 | | | 4,998 | | | 6,550 | | | 6,933 | |
Loans 90 days or more past due and still accruing (as to principal or interest): | | | | | | | | | | | | | | | | |
| Real estate secured | | | 117 | | | 833 | | | 553 | | | - | | | - | |
| Commercial and industrial | | | 4 | | | 833 | | | 435 | | | - | | | 29 | |
| Consumer | | | 187 | | | 6 | | | - | | | 42 | | | 67 | |
| Total | | | 308 | | | 1,672 | | | 988 | | | 42 | | | 96 | |
Restructured loans:2, 3 | | | | | | | | | | | | | | | | |
| Commercial and industrial | | | - | | | - | | | - | | | 14 | | | 23 | |
| Total | | | - | | | - | | | - | | | 14 | | | 23 | |
| Total nonperforming loans | | | 15,026 | | | 11,115 | | | 5,986 | | | 6,606 | | | 7,052 | |
| Repossessed vehicles | | | 50 | | | 95 | | | - | | | - | | | - | |
| Other real estate owned | | | 133 | | | 138 | | | 294 | | | - | | | 377 | |
| Total nonperforming assets | | $ | 15,209 | | $ | 11,348 | | $ | 6,280 | | $ | 6,606 | | $ | 7,429 | |
| | | | | | | | | | | | | | | | | |
| Nonperforming loans as a percentage of total loans | | | 0.83 | % | | 0.71 | % | | 0.47 | % | | 0.65 | % | | 0.93 | % |
| Nonperforming assets as a percentage of total loans and other nonperforming assets | | | 0.84 | % | | 0.73 | % | | 0.50 | % | | 0.65 | % | | 0.98 | % |
| Allowance for loan losses as a percentage of nonperforming loans | | | 143.62 | % | | 167.83 | % | | 233.87 | % | | 168.19 | % | | 127.78 | % |
| 1 | During the fiscal year ended December 31, 2007, no interest income related to these loans was included in net income. Additional interest income of approximately $1.67 million would have been recorded during the year ended December 31, 2007, if these loans had been paid in accordance with their original terms and had been outstanding throughout the fiscal year ended December 31, 2007 or, if not outstanding throughout the fiscal year ended December 31, 2007, since origination. |
| 2 | A “restructured loan” is one the terms of which were renegotiated to provide a reduction or deferral of interest or principal because of deterioration in the financial position of the borrower. |
| 3 | During the fiscal year ended December 31, 2007, no interest income related to this loan was included in net income. Additional interest income would be negligible during the year ended December 31, 2007, if this loan had been paid in accordance with its original term and had been outstanding throughout the fiscal year ended December 31, 2007. |
Non-performing Assets (Net of SBA Guaranteed)
| | | At December 31, | |
| | | 2007 | | 2006 | | 2005 | | 2004 | | 2003 | |
| | | (Dollars in Thousands) | |
Nonaccrual loans:1 | | | | | | | | | | | |
| Real estate secured | | $ | 8,154 | | $ | 2,530 | | $ | 1,171 | | $ | 2,242 | | $ | 3,086 | |
| Commercial and industrial | | | 1,986 | | | 2,342 | | | 341 | | | 401 | | | 543 | |
| Consumer | | | 154 | | | 930 | | | 292 | | | - | | | - | |
| Total | | | 10,294 | | | 5,802 | | | 1,804 | | | 2,643 | | | 3,629 | |
Loans 90 days or more past due and still accruing (as to principal or interest): | | | | | | | | | | | | | | | | |
| Construction | | | - | | | - | | | - | | | - | | | - | |
| Real estate secured | | | 117 | | | 209 | | | 553 | | | - | | | - | |
| Commercial and industrial | | | 4 | | | 838 | | | 111 | | | - | | | 29 | |
| Consumer | | | 187 | | | - | | | - | | | 42 | | | 67 | |
| Total | | | 308 | | | 1,047 | | | 664 | | | 42 | | | 96 | |
Restructured loans:2, 3 | | | | | | | | | | | | | | | | |
| Real estate secured | | | - | | | - | | | - | | | - | | | - | |
| Commercial and industrial | | | - | | | - | | | - | | | 14 | | | 23 | |
| Consumer | | | - | | | - | | | - | | | - | | | - | |
| Total | | | - | | | - | | | - | | | 14 | | | 23 | |
| Total nonperforming loans | | | 10,602 | | | 6,849 | | | 2,468 | | | 2,699 | | | 3,748 | |
| Repossessed vehicles | | | 50 | | | 95 | | | - | | | - | | | - | |
| Other real estate owned | | | 133 | | | 138 | | | 294 | | | - | | | 377 | |
| Total nonperforming assets | | $ | 10,785 | | $ | 7,082 | | $ | 2,763 | | $ | 2,699 | | $ | 4,125 | |
| | | | | | | | | | | | | | | | | |
| Nonperforming loans as a percentage of total loans | | | 0.59 | % | | 0.44 | % | | 0.20 | % | | 0.26 | % | | 0.50 | % |
| Nonperforming assets as a percentage of total loans and other nonperforming assets | | | 0.60 | % | | 0.45 | % | | 0.22 | % | | 0.26 | % | | 0.54 | % |
| Allowance for loan losses as a percentage of nonperforming loans | | | 203.55 | % | | 272.38 | % | | 567.15 | % | | 411.63 | % | | 240.45 | % |
| | | | | | | | | | | | | | | | | |
Allowance for Loan Losses
In anticipation of credit risk inherent in our lending business, we set aside allowances through charges to earnings. Such charges were not only made for the outstanding loan portfolio, but also for off-balance sheet items, such as commitments to extend credit or letters of credit. The charges made for the outstanding loan portfolio were credited to the allowance for loan losses, whereas charges for off-balance sheet items were credited to the reserve for off-balance sheet items, which is presented as a component of other liabilities. The provision for loan losses is discussed in the section entitled “Provision for Loan Losses” above.
With the economic transition addressed in “Nonperforming Assets” above, the net charge-offs in 2007 increased to $11.0 million when the weak business climate adversely impacted the financial condition of a certain number of our clients, as compared with $1.8 million, $0.3 million, $0.9 million, and $0.1 million, respectively in 2006, 2005, 2004 and 2003. The net charge-offs in 2007 were mainly comprised of $8.8 million commercial and industrial loan charge-offs, and $1.7 million consumer loan charge-offs. The majority of the $1.7 million consumer loan charge-offs were the charge-offs of automobile loans, including automobile inventory financing, extended in connection with two used car dealers who closed down their businesses in the mid 2006. This $11.0 million net charge-offs represents 0.66% of average total loans in 2007, higher than 0.13%, 0.03%, 0.10%, and 0.02%, respectively, in 2006, 2005, 2004, and 2003.
| 1 | During the fiscal year ended December 31, 2007, no interest income related to these loans was included in net income. Additional interest income of approximately $1.67 million would have been recorded during the year ended December 31, 2007, if these loans had been paid in accordance with their original terms and had been outstanding throughout the fiscal year ended December 31, 2007 or, if not outstanding throughout the fiscal year ended December 31, 2007, since origination. |
| 2 | A “restructured loan” is one the terms of which were renegotiated to provide a reduction or deferral of interest or principal because of deterioration in the financial position of the borrower. |
| 3 | During the fiscal year ended December 31, 2007, no interest income related to this loan was included in net income. Additional interest income would be negligible during the year ended December 31, 2007, if this loan had been paid in accordance with its original term and had been outstanding throughout the fiscal year ended December 31, 2007. |
In order to keep pace with the increase of nonperforming loans and our loan portfolio, we increased our allowance for loan losses by 15.7%, or $2.9 million, to $21.6 million at December 31, 2007, as compared with $18.7 million at December 31, 2006. Such allowances were $14.0 million, $11.1 million, and $9.0 million at December 31, 2005, 2004, and 2003, respectively. With the continued increase of the allowance for loan losses in recent years, we were able to maintain the adequate ratio of allowance for loan losses to total loans at 1.19%, 1.20%, 1.11%, 1.09%, and 1.19% at the end of 2007, 2006, 2005, 2004, and 2003, respectively. Management believes that the current ratio of 1.19% is in line with our peer group average and adequate for our loan portfolio because the level of total non-performing loans as of December 31, 2007 was relatively low at 0.59% of total loans.
Although management believes the allowance at December 31, 2007 was adequate to absorb losses from any known and inherent risks in the portfolio, no assurance can be given that economic conditions which adversely affect our service areas or other variables will not result in increased losses in the loan portfolio in the future.
The table below summarizes, for the years indicated, loan balances at the end of each period, the daily averages during the period, changes in the allowance for loan losses arising from loans charged off, recoveries on loans previously charged off, additions to the allowance and certain ratios related to the allowance for loan losses:
Allowance for Loan Losses
| | | 2007 | | 2006 | | 2005 | | 2004 | | 2003 | |
| | | (Dollars in Thousands) | |
Balances: | | | | | | | | | | | |
| Average total loans outstanding during year | | $ | 1,668,341 | | $ | 1,423,513 | | $ | 1,132,829 | | $ | 905,556 | | $ | 629,466 | |
| Total loans outstanding at end of year | | | 1,809,050 | | | 1,560,539 | | | 1,262,560 | | | 1,020,723 | | | 757,005 | |
Allowance for loan losses: | | | | | | | | | | | | | | | | |
| Balances at beginning of year | | | 18,654 | | | 13,999 | | | 11,111 | | | 9,011 | | | 6,343 | |
Actual charge-offs: | | | | | | | | | | | | | | | | |
| Real estate secured | | | 785 | | | 138 | | | 127 | | | - | | | 306 | |
| Commercial and industrial | | | 8,752 | | | 883 | | | 866 | | | 1,230 | | | 623 | |
| Consumer | | | 1,734 | | | 1,141 | | | 107 | | | 139 | | | 23 | |
| Total charge-offs | | | 11,271 | | | 2,162 | | | 1,100 | | | 1,369 | | | 952 | |
Recoveries on loans previously charged off | | | | | | | | | | | | | | | | |
| Real estate secured | | | - | | | 146 | | | 30 | | | - | | | - | |
| Commercial and industrial | | | 119 | | | 148 | | | 708 | | | 419 | | | 848 | |
| Consumer | | | 204 | | | 26 | | | 37 | | | 42 | | | 2 | |
| Total recoveries | | | 323 | | | 320 | | | 775 | | | 461 | | | 850 | |
| Net loan charge-offs | | | 10,948 | | | 1,842 | | | 324 | | | 908 | | | 102 | |
| Allowance for loan losses acquired in LBNY acquisition | | | - | | | 601 | | | - | | | - | | | - | |
| Provision for loan losses | | | 14,980 | | | 6,000 | | | 3,350 | | | 3,567 | | | 2,783 | |
| Less: provision for losses on off balance sheet item | | | 1,107 | | | 104 | | | 137 | | | 559 | | | 13 | |
| Balances at end of year | | $ | 21,579 | | $ | 18,654 | | $ | 13,999 | | $ | 11,111 | | $ | 9,011 | |
Ratios: | | | | | | | | | | | | | | | | |
| Net loan charge-offs to average total loans | | | 0.66 | % | | 0.13 | % | | 0.03 | % | | 0.10 | % | | 0.02 | % |
| Allowance for loan losses to total loans at end of year | | | 1.19 | % | | 1.20 | % | | 1.11 | % | | 1.09 | % | | 1.19 | % |
| Net loan charge-offs to allowance for loan losses at end of year | | | 50.73 | % | | 9.88 | % | | 2.32 | % | | 8.17 | % | | 1.13 | % |
| Net loan charge-offs to provision for loan losses | | | 73.08 | % | | 30.70 | % | | 9.68 | % | | 25.46 | % | | 3.68 | % |
The table below summarizes, for the periods indicated, the balance of the allowance for loan losses and the percentage of such balance for each type of loan as of the dates indicated:
Distribution and Percentage Composition of Allowance for Loan Losses
| | | Amount Outstanding as of December 31, | |
| | | (Dollars in Thousands) | |
Applicable to: | | 2007 | | 2006 | | 2005 | | 2004 | | 2003 | |
| Construction | | $ | 557 | | $ | 352 | | $ | 152 | | $ | 66 | | $ | 80 | |
| Real estate secured | | | 13,445 | | | 9,933 | | | 9,751 | | | 8,081 | | | 6,991 | |
| Commercial and industrial | | | 7,023 | | | 7,164 | | | 3,742 | | | 2,796 | | | 1,852 | |
| Consumer | | | 554 | | | 1,205 | | | 354 | | | 168 | | | 88 | |
Total Allowance | | $ | 21,579 | | $ | 18,654 | | $ | 13,999 | | $ | 11,111 | | $ | 9,011 | |
| Construction | | | 2.58 | % | | 1.89 | % | | 1.09 | % | | 0.59 | % | | 0.89 | % |
| Real estate secured | | | 62.30 | % | | 53.24 | % | | 69.65 | % | | 72.73 | % | | 77.58 | % |
| Commercial and industrial | | | 32.55 | % | | 38.41 | % | | 26.73 | % | | 25.17 | % | | 20.55 | % |
| Consumer | | | 2.57 | % | | 6.46 | % | | 2.53 | % | | 1.51 | % | | 0.98 | % |
Total Allowance | | | 100.00 | % | | 100.00 | % | | 100.00 | % | | 100.00 | % | | 100.00 | % |
Contractual Obligations
The following table represents our aggregate contractual obligations (principal and interest) to make future payments as of December 31, 2007:
(Dollars in Thousands) | | One Year or Less | | Over One Year To Three Years | | Over Three Years To Five Years | | Over Five Years | | Total | |
| FHLB borrowings | | $ | 101,910 | | $ | 53,998 | | $ | - | | $ | - | | $ | 155,908 | |
| Junior subordinated debenture | | | 5,240 | | | 6,450 | | | 2,765 | | | 87,321 | | | 101,776 | |
| Operating leases | | | 3,138 | | | 5,372 | | | 3,409 | | | 4,916 | | | 16,835 | |
| Time deposits | | | 946,568 | | | 12,973 | | | - | | | 10 | | | 959,551 | |
| Total | | $ | 1,056,85 | | $ | 78,793 | | $ | 6,174 | | $ | 92,247 | | $ | 1,234,070 | |
Off-Balance Sheet Arrangements
During the ordinary course of business, we provide various forms of credit lines to meet the financing needs of our customers. These commitments, which represent a credit risk to us, are not represented in any form on our balance sheets.
As of December 31, 2007, 2006 and 2005, we had commitments to extend credit of $284.9 million, $141.2 million, and $104.3 million, respectively. Obligations under standby letters of credit were $10.0 million, $9.5 million, and $2.5 million, for 2007, 2006 and 2005, respectively, and the obligations under commercial letters of credit were $10.8 million, $14.8 million, and $11.4 million for the same periods.
The effect on our revenues, expenses, cash flows and liquidity from the unused portion of the commitments to provide credit cannot be reasonably predicted because there is no guarantee that the lines of credit will be used.
In the normal course of business, we are involved in various legal claims. We have reviewed all legal claims against us with counsel and have taken into consideration the views of counsel as to the outcome of the claims. In our opinion, the final disposition of all such claims will not have a material adverse effect on our financial position and results of operations.
Investment Activities
Investments are one of our major sources of interest income and are acquired in accordance with a written comprehensive investment policy addressing strategies, types and levels of allowable investments. This investment policy is reviewed at least annually by the Board of Directors. Management of our investment portfolio is set in accordance with strategies developed and overseen by our Asset/Liability Committee. Investment balances, including cash equivalents and interest-bearing deposits in other financial institutions, are subject to change over time based on our asset/liability funding needs and interest rate risk management objectives. Our liquidity levels take into consideration anticipated future cash flows and all available sources of credits and are maintained at levels management believes are appropriate to assure future flexibility in meeting anticipated funding needs.
Cash Equivalents and Interest-bearing Deposits in other Financial Institutions
We sell federal funds, purchase securities under agreements to resell and high-quality money market instruments, and deposit interest-bearing accounts in other financial institutions to help meet liquidity requirements and provide temporary holdings until the funds can be otherwise deployed or invested. As of December 31, 2007, 2006, and 2005, we had $10 million, $130 million and $126 million, respectively, in federal funds sold and repurchase agreements. We did not have any interest bearing deposit in other financial institutions as of December 31, 2007 and 2006, as compared to $0.5 million as of December 31, 2005. The $120 million decrease in federal funds sold was primarily attributable to the $49.2 million increase in investment securities, $7.3 million increase in cash and due from other banks, with the rest of increase attributed to the increase in our loan balance. Hence, cash and cash equivalents balance was $92.5 million as of December 31, 2007.
Investment Securities
Management of our investment securities portfolio focuses on providing an adequate level of liquidity and establishing an interest rate-sensitive position, while earning an adequate level of investment income without taking undue risk. As of December 31, 2007, our investment portfolio is primarily comprised of United States government agency securities, nearly 90% of the entire investment portfolio. Our U.S. government agency securities holdings are all “prime/conforming” mortgage backed securities, or MBS’s, and collateralized mortgage obligations, or CMO’s, guaranteed by FNMA, FHLMC, or GNMA. GNMAs are considered equivalent to U.S. Treasury securities, as they are backed by the full faith and credit of the U.S. government. Our investment portfolio currently contains 0% subprime mortgages. Besides the U.S. government agency securities, we also have 7% investment in corporate debt and 3% municipal debt securities. Most of our corporate and municipal debt securities are “Triple A” rated, with only $5.5 million rated one class below the “Triple A” rating, but are also considered investment grade. We did not early adopt SFAS No. 157 in 2007, and in 2007, we classified our investment securities as “held-to-maturity” or “available-for-sale.” Investment securities that we intend to hold until maturity are classified as held-to-maturity securities, and all other investment securities are classified as available-for-sale. The carrying values of available-for-sale investment securities are adjusted for unrealized gains or losses as a valuation allowance and any gain or loss is reported on an after-tax basis as a component of other comprehensive income. We are in the process of evaluating the impact of SFAS No. 157 adoption on the consolidated financial statements. The fair market values of our held-to-maturity and available-for-sale securities were respectively $7.4 million and $224.3 million as of December 31, 2007.
The following table summarizes the book value and market value and distribution of our investment securities as of the dates indicated:
Investment Securities Portfolio
(Dollars in Thousands)
| | | As of December 31, 2007 | | As of December 31, 2006 | | As of December 31, 2005 | |
| | | Amortized Cost | | Market Value | | Amortized Cost | | Market Value | | Amortized Cost | | Market Value | |
Held to Maturity: | | | | | | | | | | | | | | | | | | | |
| Securities of government sponsored enterprises | | $ | 7,000 | | $ | 7,001 | | $ | 14,000 | | $ | 13,845 | | $ | 19,993 | | $ | 19,684 | |
| Collateralized mortgage obligations | | | 164 | | | 151 | | | 196 | | | 181 | | | 248 | | | 229 | |
| Municipal securities | | | 220 | | | 220 | | | 425 | | | 419 | | | 2,619 | | | 2,598 | |
| | | | | | | | | | | | | | | | | | | | |
Available for Sale: | | | | | | | | | | | | | | | | | | | |
| Securities of government sponsored enterprises | | | 64,932 | | | 65,175 | | | 87,809 | | | 87,511 | | | 77,882 | | | 76,981 | |
| Mortgage backed securities | | | 60,470 | | | 60,557 | | | 21,033 | | | 20,917 | | | 23,451 | | | 23,158 | |
| Collateralized mortgage obligations | | | 73,416 | | | 73,286 | | | 38,650 | | | 38,260 | | | 26,302 | | | 25,870 | |
| Corporate securities | | | 17,390 | | | 17,484 | | | 13,445 | | | 13,387 | | | 8,132 | | | 8,047 | |
| Municipal securities | | | 7,725 | | | 7,754 | | | 7,725 | | | 7,763 | | | 4,661 | | | 4,594 | |
| | | | | | | | | | | | | | | | | | | | |
| Total investment securities | | $ | 231,317 | | $ | 231,628 | | $ | 183,283 | | $ | 182,283 | | $ | 163,288 | | $ | 161,161 | |
| | | | | | | | | | | | | | | | | | | | |
The following table summarizes the maturity and repricing schedule of our investment securities at their carrying values and their weighted average yields at December 31, 2007:
Investment Maturities and Repricing Schedule
(Dollars in Thousands)
| | | Within One Year | | After One But Within Five Years | | After Five But Within Ten Years | | After Ten years | | Total | |
| | Amount | | Yield | | Amount | | Yield | | Amount | | Yield | | Amount | | Yield | | Amount | | Yield | |
Held to Maturity: | | | | | | | | | | | | | | | | | | | | | |
| Securities of government sponsored enterprises | | $ | - | | | - | | $ | 5,000 | | | 4.58 | % | $ | 2,000 | | | 4.46 | % | $ | - | | | - | | $ | 7,000 | | | 4.55 | % |
| Collateralized mortgage obligations | | | - | | | - | | | 164 | | | 3.98 | % | | - | | | - | | | - | | | - | | | 164 | | | 3.98 | % |
| Municipal securities | | | 220 | | | 4.12 | % | | - | | | - | | | - | | | - | | | - | | | - | | | 220 | | | 4.12 | % |
| | | | | | | | | | | | | | | | | | | | | | | | | | | | | | | | |
Available-for-sale: | | | | | | | | | | | | | | | | | | | | | | | | | | | | | | | |
| Securities of government sponsored enterprises | | | 16,012 | | | 4.70 | % | | 37,126 | | | 4.98 | % | | 12,037 | | | 5.16 | % | | - | | | - | | | 65,175 | | | 4.95 | % |
| Mortgage backed securities | | | 11,135 | | | 5.02 | % | | 2,114 | | | 5.00 | % | | 209 | | | 5.62 | % | | 47,099 | | | 5.70 | % | | 60,557 | | | 5.55 | % |
| Collateralized mortgage obligations | | | - | | | - | | | 73,286 | | | 5.13 | % | | - | | | - | | | - | | | - | | | 73,286 | | | 5.13 | % |
| Corporate securities | | | 5,338 | | | 3.59 | % | | 12,146 | | | 5.31 | % | | - | | | - | | | - | | | - | | | 17,484 | | | 4.79 | % |
| Municipal securities | | | 400 | | | 5.02 | % | | - | | | - | | | 4,642 | | | 3.75 | % | | 2,712 | | | 4.31 | % | | 7,754 | | | 4.01 | % |
| | | | | | | | | | | | | | | | | | | | | | | | | | | | | | | | |
| Total investment securities | | $ | 33,105 | | | 4.63 | % | $ | 129,836 | | | 5.08 | % | $ | 18,888 | | | 4.74 | % | $ | 49,811 | | | 5.63 | % | $ | 231,640 | | | 5.11 | % |
| | | | | | | | | | | | | | | | | | | | | | | | | | | | | | | | |
Our investment securities holdings increased by $49.2 million, or 27.0%, to $231.6 million at December 31, 2007, compared to holdings of $182.5 million at December 31, 2006. Holdings at December 31, 2005 were $161.5 million. Total investment securities as a percentage of total assets were 10.5% and 9.1% at December 31, 2007 and 2006, respectively, compared to 9.8% at December 31, 2005. As of December 31, 2007, investment securities having a carrying value of $208.7 million were pledged to secure certain deposits.
As of December 31, 2007, held-to-maturity securities, which are carried at their amortized costs, decreased to $7.4 million from $14.6 million and $22.9 million at December 31, 2006 and 2005, respectively. Available-for-sale securities, which are stated at their fair market values, increased to $224.3 million at December 31, 2007 from $167.8 million and $138.7 million at December 31, 2006 and 2005, respectively. These increases reflect a strategy of improving our liquidity level using available-for-sale securities, in addition to immediately available funds which are maintained mainly in the form of overnight investments.
The following tables show our investments’ gross unrealized losses and fair value, aggregated by investment category and length of time that individual securities have been in a continuous unrealized loss position, at December 31, 2007 and 2006, respectively (dollars in thousands):
As of December 31, 2007 | | | | | | | | | | | |
| | | Less than 12 months | | 12 months or longer | | Total | |
| | | | | Gross | | | | Gross | | | | Gross | |
| | | | | Unrealized | | | | Unrealized | | | | Unrealized | |
Description of Securities | | Fair Value | | Losses | | Fair Value | | Losses | | Fair Value | | Losses | |
| | | | | | | | | | | | | | |
| Securities of government sponsored enterprises | | $ | - | | $ | - | | $ | 4,993 | | $ | (7 | ) | $ | 4,993 | | $ | (7 | ) |
| Collateralized mortgage obligations | | | 1,749 | | | (11 | ) | | 9,266 | | | (436 | ) | | 11,015 | | | (447 | ) |
| Mortgage-backed securities | | | 37,967 | | | (36 | ) | | 2,545 | | | (27 | ) | | 40,512 | | | (63 | ) |
| Corporate securities | | | 4,972 | | | (1 | ) | | 1,983 | | | (16 | ) | | 6,955 | | | (17 | ) |
| Municipal securities | | | 1,392 | | | (13 | ) | | 2,347 | | | (2 | ) | | 3,739 | | | (15 | ) |
| | | $ | 46,080 | | $ | (61 | ) | $ | 21,134 | | $ | (488 | ) | $ | 67,214 | | $ | (549 | ) |
As of December 31, 2006 | | | | | | | | | | | |
| | | Less than 12 months | | 12 months or longer | | Total | |
| | | | | Gross | | | | Gross | | | | Gross | |
| | | | | Unrealized | | | | Unrealized | | | | Unrealized | |
Description of Securities | | Fair Value | | Losses | | Fair Value | | Losses | | Fair Value | | Losses | |
| | | | | | | | | | | | | | |
| Securities of government sponsored enterprises | | $ | 17,972 | | $ | (24 | ) | $ | 64,484 | | $ | (497 | ) | $ | 82,456 | | $ | (521 | ) |
| Collateralized mortgage obligations | | | 12,066 | | | (31 | ) | | 17,455 | | | (383 | ) | | 29,521 | | | (414 | ) |
| Mortgage backed securities | | | 1,740 | | | (5 | ) | | 10,834 | | | (204 | ) | | 12,574 | | | (209 | ) |
| Corporate securities | | | - | | | - | | | 2,929 | | | (68 | ) | | 2,929 | | | (68 | ) |
| Municipal securities | | | - | | | - | | | 3,802 | | | (34 | ) | | 3,802 | | | (34 | ) |
| | | $ | 31,778 | | $ | (60 | ) | $ | 99,504 | | $ | (1,186 | ) | $ | 131,282 | | $ | (1,246 | ) |
As of December 31, 2007, the total unrealized losses less than 12 months old were $61,000, and total unrealized losses more than 12 months old were $488,000. The aggregate related fair value of investments with unrealized losses less than 12 months old was $46.1 million at December 31, 2007, and those with unrealized losses more than 12 months old were $21.1 million. As of December 31, 2006, the total unrealized losses less than 12 months old were $60,000 and total unrealized losses more than 12 months old were $1.2 million. The aggregate related fair value of investments with unrealized losses less than 12 months old was $31.8 million at December 31, 2006, and those with unrealized losses more than 12 months old were $99.5 million.
Declines in the fair value of held-to-maturity and available-for-sale securities below their cost that are deemed to be other than temporary are reflected in earnings as realized losses. In estimating other-than-temporary impairment losses, we consider, among other things, (i) the length of time and the extent to which the fair value has been less than cost, (ii) the financial condition and near-term prospects of the issuer, and (iii) our intent and ability to retain our investment in the issuer for a period of time sufficient to allow for any anticipated recovery in fair value.
We have the ability and intent to hold the securities classified as held-to-maturity until they mature, at which time we expect to receive full value for the securities. As of December 31, 2007 and 2006, we also had the ability and intent to hold the securities classified as available-for-sale for a period of time sufficient for a recovery of cost. The unrealized losses were largely due to increases in market interest rates over the yields available at the time the underlying securities were purchased. The fair value is expected to recover as the bonds approach their maturity date or repricing date or if market yields for such investments decline. We do not believe any of the securities are impaired due to reasons of credit quality. Accordingly, as of December 31, 2007 and 2006, we believe the impairments detailed in the table above were temporary, and no impairment loss has been realized in our consolidated statements of operations.
Other Earning Assets
For various business purposes, we make investments in earning assets other than the interest-earning assets discussed above. Before 2003, the only other earning assets held by us were insignificant amounts of Federal Home Loan Bank stock and the cash surrender value of the BOLI.
In an effort to provide additional benefits aimed at retaining key employees, while generating a tax-exempt noninterest income stream, we purchased $10.5 million in 2003 in BOLI from insurance carriers rated AA or above. In 2005, we purchased $3 million more in BOLI from the same insurance carriers. We are the owner and the primary beneficiary of the life insurance policies and recognize the increase of the cash surrender value of the policies as tax-exempt other income.
In 2003, we also invested in two low-income housing tax credit funds (“LIHTCF”) to promote our participation in CRA activities. We committed to invest, over two to three years, a total of $3 million to two different LIHTCF - $1 million in Apollo California Tax Credit Fund XXII, LP, and $2 million in Hudson Housing Los Angeles Revitalization Fund, LP. In 2006, in order to promote our CRA activities in each of the assessment areas in Dallas, New York, and Los Angeles, we also committed to invest additional $1 million, $2 million, and $3 million in WNC Institutional Tax Credit Fund XXI, WNC Institutional Tax Credit Fund X New York Series 7, and WNC Institutional Tax Credit Fund X California Series 6, respectively. In 2007, we made $4 million additional commitment to invest in Hudson Housing Los Angeles Revitalization Fund IV LP. We receive the returns on these investments, over the fifteen years following the said two to three-year investment periods in the form of tax credits and tax deductions.
As a collateral for the FHLB borrowings, we are required by FHLB to invest in FHLB stocks. In 2007, our total additional investment in FHLB stocks was $732,000, and our total dividends received from our FHLB stock holdings were $421,400. Therefore, the total asset value of the FHLB stock increased $1,153,400 to $8,695,100 as of year end 2007 from $7,541,700 million in the prior year.
The balances of other earning assets as of December 31, 2007 and December 31, 2006 were as follows (dollars in thousands):
Type | | Balance as of December 31, 2007 | | Balance as of December 31, 2006 | |
| BOLI | | $ | 16,228 | | $ | 15,636 | |
| LIHTCF | | | 6,222 | | | 4,206 | |
| Federal Home Loan Bank Stock | | | 8,695 | | | 7,542 | |
| | | | | | | | |
Deposits and Other Sources of Funds
Deposits
Deposits are our primary source of funds. Total deposits at December 31, 2007, 2006 and 2005 were $1.76 billion, $1.75 billion and $1.41 billion, respectively, representing a slight increase of $11.1 million, or 0.6%, in 2007 and $342.5 million, or 24.3%, in 2006. The average deposits for the years ended December 31, 2007, 2006 and 2005 were $1.74 billion, $1.58 billion, and $1.23 billion, respectively, representing an increase of $161.1 million, or 10.2%, in 2007, and of $347.5 million, or 28.3%, in 2006. The slow down in deposit growth was primarily due to the stiff competition among other banks in the community. We expect our expansion into the New York/New Jersey area and more branch coverage within our primary market of Southern California to offset the loss of deposit from competition. In 2008, we expect to see a moderate but higher deposit growth rate than 2007.
After 2004, our niche market depositor’s preference in time deposits bearing relatively high interest rates decreased the level of deposits in transactional accounts and we increased our reliance on time deposits to fund our loan growth. Pursuant to our efforts in controlling the growth of expensive time deposits, the percentage of the average time deposits over the average total deposits slightly decreased to 53.2% in 2007 from 54.8% in 2006. Such percentage in 2005 was 52.9%. Since late 2006, we have continued to promote our core-deposit campaign in order to achieve the assigned core deposit goals and reduce our level of time deposit reliance going forward.
The average rate paid on time deposits in denominations of $100,000 or more increased to 5.22% in 2007 as compared with 5.11% in 2006, which previously increased from 3.49% in 2005. See “Net Interest Income and Net Interest Margin” for further discussion.
The following tables summarize the distribution of average daily deposits and the average daily rates paid for the years indicated:
Average Deposits
| | | For the Years Ended December 31, | |
| | 2007 | | 2006 | | 2005 | |
| | Average Balance | | Average Rate | | Average Balance | | Average Rate | | Average Balance | | Average Rate | |
| | | (Dollars in Thousands) | |
| | | | | | | | | | | | | | |
| Demand, noninterest-bearing | | $ | 315,176 | | | | | $ | 310,031 | | | | | $ | 286,966 | | | | |
| Money market | | | 445,130 | | | 4.51 | % | | 356,602 | | | 4.25 | % | | 247,313 | | | 2.93 | % |
| Super NOW | | | 22,511 | | | 1.32 | % | | 20,853 | | | 1.18 | % | | 21,446 | | | 0.87 | % |
| Savings | | | 29,816 | | | 2.38 | % | | 25,093 | | | 1.32 | % | | 22,878 | | | 0.73 | % |
| Time certificates of deposit in denominations of $100,000 or more | | | 776,697 | | | 5.22 | % | | 706,729 | | | 5.11 | % | | 532,207 | | | 3.49 | % |
| Other time deposits | | | 146,837 | | | 4.87 | % | | 155,741 | | | 4.58 | % | | 116,698 | | | 3.20 | % |
| Total deposits | | $ | 1,736,167 | | | 3.96 | % | $ | 1,575,049 | | | 3.74 | % | $ | 1,227,508 | | | 2.44 | % |
| | | | | | | | | | | | | | | | | | | | |
The scheduled maturities of our time deposits in denominations of $100,000 or greater at December 31, 2007 are, as follows:
Maturities of Time Deposits of $100,000 or More, at December 31, 2007
(Dollars in Thousands)
| Three months or less | | $ | 419,566 | |
| Over three months through six months | | | 176,436 | |
| Over six months through twelve months | | | 181,721 | |
| Over twelve months | | | 11,160 | |
| Total | | $ | 788,883 | |
| | | | | |
Because our client base is comprised primarily of commercial and industrial accounts, individual account balances are generally higher than those of consumer-oriented banks. A number of clients’ carry deposit balances that were more than 1% of our total deposits, but at both December 31, 2007, 2006 and 2005, the California State Treasury was the only depositor whose deposit balance was more than 3% of our total deposits.
In addition to our regular customer base, we also accept brokered deposits on a selective basis at reasonable interest rates to augment deposit growth. We have increased these deposits to $62.6 million at December 31, 2007 from $5.2 million and $23.0 million, at December 31, 2006 and 2005, respectively, in order to improve our net interest margin. Most of the brokered deposits will mature within one year. Since brokered deposits are a non-core funding source, we will closely monitor their growth.
FHLB Borrowings
Although deposits are the primary source of funds for our lending and investment activities and for general business purposes, we may obtain advances from the FHLB as an alternative to retail deposit funds. Since 2002, we have increased borrowings from FHLB in order to take advantage of the flexibility of the program and its reasonable cost. See “Liquidity Management” below for the details on the FHLB borrowings program.
The following table is a summary of FHLB borrowings for fiscal years 2007 and 2006:
| (Dollars in Thousands) | | 2007 | | 2006 | |
| Balance at year-end | | $ | 150,000 | | $ | 20,000 | |
| Average balance during the year | | $ | 46,890 | | $ | 39,108 | |
| Maximum amount outstanding at any month-end | | $ | 155,000 | | $ | 56,000 | |
| Average interest rate during the year | | | 4.24 | % | | 3.83 | % |
| Average interest rate at year-end | | | 4.22 | % | | 3.68 | % |
Junior Subordinated Debentures; Trust Preferred Securities
In December 2002, the Bank issued $10 million of the 2002 Junior Subordinated Debentures. Subsequently, the Company, as a wholly-owned subsidiary in 2003 and as a parent company of the Bank in 2005 and 2007, issued a total of $77,321,000 of Junior Subordinated Debentures in connection with a $75,000,000 trust preferred securities issuance by statutory trusts wholly-owned by the Company.
December 2002 Bank Level Junior Subordinated Debenture. In December 2002, the Bank issued a $10 million Junior Subordinated Debenture (the “2002 debenture”). The interest rate payable on the 2002 debenture was 7.96% at December 31, 2007, which rate adjusts quarterly to the three-month LIBOR plus 3.10%. The 2002 debenture will mature on December 26, 2012. Interest on the 2002 debenture is payable quarterly and no scheduled payments of principal are due prior to maturity. The entire $10 million debenture, in whole or in part, was callable upon the Bank’s option on any March 26, June 26, September 26 or December 26 on or after December 26, 2007 (the “Redemption Date”) pursuant to Section 10.1 of the Debenture agreement. Depending on the level of interest rate difference and our level of fund sources, we may decide to exercise and call the debenture in 2008.
The 2002 debenture is treated as Tier 2 capital for Bank regulatory capital purposes. Likewise, on a consolidated basis, the 2002 debenture also is treated as Tier 2 capital for holding company level capital purposes under current Federal Reserve Board capital guidelines.
December 2003 Junior Subordinated Debenture; Trust Preferred Securities Issuance. In December 2003, Wilshire Bancorp was formed as a wholly-owned subsidiary of the Bank, in order to raise additional capital funds through the issuance of trust preferred securities. Prior to the completion of the August 2004 bank holding company reorganization, Wilshire Bancorp organized its wholly owned subsidiary, Wilshire Statutory Trust I, which issued $15 million in trust preferred securities. Wilshire Bancorp then purchased all of the common interest in the Wilshire Statutory Trust I ($464,000) and issued the 2003 Junior Subordinated Debenture (the “2003 debenture”) in the amount of approximately $15.5 million to the Wilshire Statutory Trust I with terms substantially similar to the 2003 trust preferred securities in exchange for the proceeds from the issuance of the Wilshire Statutory Trust I’s 2003 trust preferred securities and common securities. Wilshire Bancorp subsequently deposited the proceeds from the 2003 debenture in a depository account at the Bank and infused $14.5 million as additional equity capital to the Bank immediately following the holding company reorganization. The rate of interest on the 2003 debenture and related trust preferred securities was 7.84% at December 31, 2007, which adjusts quarterly to the three-month LIBOR plus 2.85%. The 2003 debenture and related trust preferred securities will mature on December 17, 2033. The interest on both the 2003 debenture and related trust preferred securities is payable quarterly and no scheduled payments of principal are due prior to maturity. Wilshire Bancorp may redeem the 2003 debenture (and in turn the trust preferred securities) in whole or in part at par prior to maturity on or after December 17, 2008.
March 2005 Junior Subordinated Debenture; Trust Preferred Securities Issuance. In March 2005, Wilshire Bancorp organized its wholly owned subsidiary, Wilshire Statutory Trust II, which issued $20 million in trust preferred securities. Wilshire Bancorp then purchased all of the common interest in the Wilshire Statutory Trust II ($619,000) and issued the 2005 Junior Subordinated Debenture (the “March 2005 debenture”) in the amount of $20.6 million to the Wilshire Statutory Trust II with terms substantially similar to the March 2005 trust preferred securities in exchange for the proceeds from the issuance of the Wilshire Statutory Trust II’s March 2005 trust preferred securities and common securities. Wilshire Bancorp subsequently deposited the proceeds from the March 2005 debenture in a depository account at the Bank and infused $14 million as additional equity capital to the Bank. The rate of interest on the March 2005 debenture and related trust preferred securities was 6.78% at December 31, 2007, which adjusts quarterly to the three-month LIBOR plus 1.79%. The March 2005 debenture and related trust preferred securities will mature on March 17, 2035. The interest on both the March 2005 debenture and related trust preferred securities are payable quarterly and no scheduled payments of principal are due prior to maturity. Wilshire Bancorp may redeem the March 2005 debenture (and in turn the trust preferred securities) in whole or in part at par prior to maturity on or after March 17, 2010.
September 2005 Junior Subordinated Debenture; Trust Preferred Securities Issuance. In September 2005, Wilshire Bancorp organized its wholly owned subsidiary, Wilshire Statutory Trust III, which issued $15 million in trust preferred securities. Wilshire Bancorp then purchased all of the common interest in the Wilshire Statutory Trust III and issued its Junior Subordinated Debt Securities (the “September 2005 debenture”) in the amount of $15.5 million to the Wilshire Statutory Trust III with terms substantially similar to the September 2005 trust preferred securities and common securities. Wilshire Bancorp subsequently deposited the proceeds from the September 2005 debenture in a depository account at the Bank. Until September 15, 2010, the securities will be fixed at a 6.07% annual interest rate, thereafter converting to a floating rate of three-month LIBOR plus 1.40%, resetting quarterly. The September 2005 debenture and related trust preferred securities will mature on September 15, 2035. The interest on both the September 2005 debenture and related trust preferred securities are payable quarterly and no scheduled payments of principal are due prior to maturity. Wilshire Bancorp may redeem the September 2005 debenture (and in turn the trust preferred securities) in whole or in part at par prior to maturity on or after September 15, 2010.
July 2007 Junior Subordinated Debenture; Trust Preferred Securities Issuance. In July 2007, Wilshire Bancorp organized its wholly owned subsidiary, Wilshire Statutory Trust IV, which issued $25 million in trust preferred securities. Wilshire Bancorp then purchased all of the common interest in the Wilshire Statutory Trust IV ($774,000) and issued the 2007 Junior Subordinated Debenture (the “July 2007 debenture”) in the amount of $25.8 million to the Wilshire Statutory Trust IV with terms substantially similar to the July 2007 trust preferred securities in exchange for the proceeds from the issuance of the Wilshire Statutory Trust IV’s July 2007 trust preferred securities and common securities. Wilshire Bancorp subsequently deposited the proceeds from the July 2007 debenture in a depository account at the Bank. The rate of interest on the July 2007 debenture and related trust preferred securities was 6.37% at December 31, 2007, which adjusts quarterly to the three-month LIBOR plus 1.38%. The July 2007 debenture and related trust preferred securities will mature on September 15, 2037. The interest on both the July 2007 debenture and related trust preferred securities are payable quarterly and no scheduled payments of principal are due prior to maturity. Wilshire Bancorp may redeem the July 2007 debenture (and in turn the trust preferred securities) in whole or in part at par prior to maturity on or after September 15, 2012.
Payments of distributions on the trust preferred securities and payments on redemption of the trust preferred securities are guaranteed by Wilshire Bancorp. The junior subordinated debentures are senior to our shares of common stock. As a result, in the event of our bankruptcy, dissolution or liquidation, the holder of the junior subordinated debentures must be satisfied before any distributions can be made to the holders of our common stock. We have the right to defer distributions on the junior subordinated debentures and related trust preferred securities for up to five years, during which time no dividends may be paid to holders of our common stock.
On March 1, 2005, the Federal Reserve Board adopted a final rule that allows continued inclusion of trust preferred securities in the Tier 1 capital of bank holding companies, subject to stricter quantitative limits. Under the final rule, bank holding companies may include trust preferred securities in Tier 1 capital in an amount (together with other restricted core capital elements) equal to 25% of the sum of core capital elements (including restricted core capital elements) net of goodwill less any associated deferred tax liability. Amounts in excess of these limits will generally be included in Tier 2 capital. For purposes of this rule, restricted core capital elements are generally to be comprised of qualifying cumulative perpetual preferred stock and related surplus, minority interest related to qualifying cumulative perpetual preferred stock directly issued by a consolidated U.S. depository institution or foreign bank subsidiary, minority interest related to qualifying common stock or qualifying cumulative perpetual preferred stock directly issued by a consolidated subsidiary that is neither a U.S. depository institution or a foreign bank and qualifying trust preferred securities.
The final rule provides a transition period for bank holding companies to come into compliance with these new capital restrictions. Accordingly, while the final rule became effective on April 11, 2005, for practical purposes, bank holding companies will have until September 30, 2009 (an extension of the September 30, 2007 transition period under the proposed rule) to come into compliance with the final rule’s capital restrictions due to the transition period. In extending the transition period to 2009, the Federal Reserve noted that the extended period will provide bank holding companies with existing trust preferred securities with call features after the first five years an opportunity to restructure their capital elements in order to conform to the limitations of the final rule.
Under the final rule, as of December 31, 2007, Wilshire Bancorp counted $57.1 million of the trust preferred securities as Tier 1 capital, and $17.9 million as Tier 2 capital.
Asset/Liability Management
Management seeks to ascertain optimum and stable utilization of available assets and liabilities as a vehicle to attain our overall business plans and objectives. In this regard, management focuses on measurement and control of liquidity risk, interest rate risk and market risk, capital adequacy, operation risk and credit risk. See “Risk Factors” for further discussion on these risks. Information concerning interest rate risk management is set forth under “Item 7A - Quantitative and Qualitative Disclosures about Market Risk.”
Liquidity Management
Maintenance of adequate liquidity requires that sufficient resources be available at all time to meet our cash flow requirements. Liquidity in a banking institution is required primarily to provide for deposit withdrawals and the credit needs of its customers and to take advantage of investment opportunities as they arise. Liquidity management involves our ability to convert assets into cash or cash equivalents without incurring significant loss, and to raise cash or maintain funds without incurring excessive additional cost. For this purpose, we maintain a portion of our funds in cash and cash equivalents, deposits in other financial institutions and loans and securities available for sale. Our liquid assets at December 31, 2007, 2006 and 2005 totaled approximately $324.7 million, $378.6 million and 355.2 million, respectively. Our liquidity level measured as the percentage of liquid assets to total assets was 14.8%, 18.8% and 21.3% at December 31, 2007, 2006 and 2005, respectively.
As a secondary source of liquidity, we rely on advances from the FHLB to supplement our supply of lendable funds and to meet deposit withdrawal requirements. Advances from the FHLB are typically secured by our mortgage loans and stock issued by the FHLB. Advances are made pursuant to several different programs. Each credit program has its own interest rate and range of maturities. Depending on the program, limitations on the amount of advances are based either on a fixed percentage of an institution’s net worth or on the FHLB’s assessment of the institution’s creditworthiness. While this fund provides flexibility and reasonable cost, we limit our use to 50% of our borrowing capacity, as such borrowing does not qualify as core funds. As of December 31, 2007, our borrowing capacity from the FHLB was about $461 million and the outstanding balance was $150 million, or approximately 32.6% of our borrowing capacity. As of December 31, 2007, we also maintained a guideline to purchase up to $30 million and $10 million in federal funds with Bank of the West and Union Bank of California, respectively.
Capital Resources and Capital Adequacy Requirements
Historically, our primary source of capital has been internally generated operating income through retained earnings. In order to ensure adequate levels of capital, we conduct ongoing assessments of projected sources and uses of capital in conjunction with projected increases in assets and level of risks. We have considered, and we will continue to consider, additional sources of capital as the need arises, whether through the issuance of additional equity, debt or hybrid securities.
We are subject to various regulatory capital requirements administered by federal banking agencies. Under capital adequacy guidelines and the regulatory framework for prompt corrective action, we must meet specific capital guidelines that rely on quantitative measures of our assets, liabilities and certain off-balance-sheet items as calculated under regulatory accounting practices. Failure to meet minimum capital requirements can trigger regulatory actions under the prompt corrective action rules that could have a material adverse effect on our financial condition and operations. Prompt corrective action may include regulatory enforcement actions that restrict dividend payments, require the adoption of remedial measures to increase capital, terminate FDIC deposit insurance, and mandate the appointment of a conservator or receiver in severe cases. In addition, failure to maintain a well-capitalized status may adversely affect the evaluation of regulatory applications for specific transactions and activities, including acquisitions, continuation and expansion of existing activities, and commencement of new activities, and could adversely affect our business relationships with our existing and prospective clients. The aforementioned regulatory consequences for failing to maintain adequate ratios of Tier 1 and Tier 2 capital could have a material adverse effect on our financial condition and results of operations. Our capital amounts and classification are also subject to qualitative judgments by regulators about components, risk weightings, and other factors. See Part I, Item 1 “Description of Business -- Regulation and Supervision -- Capital Adequacy Requirements” in this Annual Report on Form 10-K for additional information regarding regulatory capital requirements.
As of December 31, 2007, we were qualified as a “well capitalized institution” under the regulatory framework for prompt corrective action. The following table presents the regulatory standards for well-capitalized institutions, compared to our capital ratios as of the dates specified for Wilshire Bancorp, Inc and Wilshire State Bank:
| | | | | | | | | Actual ratios for the Company as of: | |
Wilshire Bancorp, Inc. | | | Capitalized Standards | | | Capitalized Standards | | | December 31, 2007 | | | December 31, 2006 | | | December 31, 2005 | |
| Total capital to risk-weighted assets | | | 8 | % | | 10 | % | | 14.58 | % | | 13.63 | % | | 14.41 | % |
| Tier I capital to risk-weighted assets | | | 4 | % | | 6 | % | | 11.83 | % | | 11.81 | % | | 11.60 | % |
| Tier I capital to adjusted average assets | | | 4 | % | | 5 | % | | 10.36 | % | | 9.79 | % | | 9.39 | % |
| | | | | | | | | Actual ratios for the Bank as of: | |
Wilshire State Bank | | | Capitalized Standards | | | Capitalized Standards | | | December 31, 2007 | | | December 31, 2006 | | | December 31, 2005 | |
| Total capital to risk-weighted assets | | | 8 | % | | 10 | % | | 13.59 | % | | 13.51 | % | | 13.05 | % |
| Tier I capital to risk-weighted assets | | | 4 | % | | 6 | % | | 11.80 | % | | 11.68 | % | | 11.15 | % |
| Tier I capital to adjusted average assets | | | 4 | % | | 5 | % | | 10.33 | % | | 9.69 | % | | 9.04 | % |
At December 31, 2007, total shareholders’ equity increased by $22.2 million, after declaring cash dividends of $5.9 million, to $171.8 million from $149.6 million at December 31, 2006. Such additional capital was primarily derived from internally generated operating income. In 2006, total shareholders’ equity also grew by $36.5 million from $113.1 million at December 31, 2005, after declaring cash dividends of $5.8 million, primarily from internally generated operating income of $33.9 million. Our equity also increased by the share-based compensation and other comprehensive income.
As of December 31, 2007, for the regulatory capital ratio computation purpose, we considered the Junior Subordinated Debentures of $87.3 million, which consists of $10.0 million issued by the Bank and $77.3 million issued by the Company in connection with the issuance of $75.0 million trust preferred securities. At December 31, 2006, Wilshire Bancorp accounted for $50.0 million of such securities as Tier 1 capital and $10.0 million as Tier 2 capital. As of December 31, 2007, with the issuance of July 2007 debentures, the portion qualified for Tier 1 capital increased to $57.1 million, reducing the portion for Tier 2 capital to $27.9 million. For the Bank level, only the $10.0 million debenture issued by the Bank in 2002 is treated as Tier 2 capital. See “Deposits and Other Sources of Funds” for further discussion regarding the capital treatment of subordinated debentures and the trust preferred securities.
Repurchase of Common Stock
To take advantage of the recent low market price of our common stock, the Company’s board of directors authorized a repurchase program in July 2007 to allow discretion of management decisions in purchasing our outstanding common stock from the open market.
Pursuant to the stock repurchase program authorized by the Company’s board of directors in July 2007, management repurchased the Company’s outstanding common stock on various dates in August 2007 and November 2007 on cost basis as listed below:
Period | | Shares Purchased | | Total Amount | |
| 08/01/2007 -08/31/2007 | | | 39,625 | | $ | 410,395 | |
| 11/01/2007 -11/30/2007 | | | 87,800 | | | 851,294 | |
Total | | | 127,425 | | $ | 1,261,689 | |
Recent Accounting Pronouncements
In September 2006, the FASB issued EITF 06-4, Accounting for Deferred Compensation and Postretirement Benefit Aspects of Endorsement Split-Dollar Life Insurance Arrangements, which requires an employer to recognize obligations associated with endorsement split-dollar life insurance arrangements that extend into the participant’s post-employment benefit cost for the continuing life insurance or based on the future death benefit depending on the contractual terms of the underlying agreement. EITF 06-4 is effective as of the beginning of the entity’s first fiscal year after December 15, 2007. We adopted EITF 06-4 on January 1, 2008 using the later option, based on the future death benefit. We are in the process of evaluating the impact of this adoption on the consolidated financial statements.
In September 2006, the FASB issued SFAS No. 157, Fair Value Measurements, which provides a definition of fair value, establishes a framework for measuring fair value, and requires expanded disclosures about fair value measurements. The standard applies when the accounting principles generally accepted in the United States of America (“GAAP”) requires or allows assets or liabilities to be measured at fair value, and therefore, does not expand the use of fair value in any new circumstance. SFAS No. 157 defines fair value as the price that would be received to sell an asset or paid to transfer a liability in an arm’s length transaction between market participants in the markets where we conduct business. SFAS No. 157 clarifies that fair value should be based on the assumptions market participants would use when pricing an asset or liability and establishes a fair value hierarchy that prioritizes the information used to develop those assumptions. The fair value hierarchy gives the highest priority to quoted prices available in active markets and the lowest priority to data lacking transparency. The level of the reliability of inputs utilized for fair value calculations drives the extent of disclosure requirements of the valuation methodologies used under the standard. SFAS No. 157 is effective for financial statements issued for fiscal years beginning after November 15, 2007, and interim periods within those years. The provisions of SFAS No. 157 should be applied prospectively, except for certain financial instruments for which the standard should be applied retrospectively. We are in the process of evaluating the impact of this adoption on the consolidated financial statements.
In February 2006, the FASB issued SFAS No. 159, The Fair Value Option for Financial Assets and Financial Liabilities, which permits all entities to choose to measure eligible items at fair value at specified election dates. A business entity shall report unrealized gains and losses on items for which the fair value option has been elected in earnings at each subsequent reporting date. SFAS No. 159 is effective as of the beginning of an entity’s first fiscal year after November 15, 2007. We are in the process of evaluating the impact of this adoption on the consolidated financial statements.
At the June 14, 2007 EITF meeting, the SEC staff announced revisions to EITF D-98 related to the release of SFAS No. 159. The SEC staff announced that it will no longer accept liability classification for financial instruments that meet the conditions for temporary equity classification under ASR 268, Presentation in Financial Statements of “Redeemable Preferred Stocks” and EITF D-98. As a consequence, the fair value option under SFAS No.159 may not be applied to any financial instrument (or host contract) that qualifies as temporary equity. Registrants that do not choose retrospective application should apply the announcement prospectively to all affected instruments that are entered into, modified, or otherwise subject to remeasurement event in the registrant’s first fiscal quarter beginning after September 15, 2007. We do not expect the adoption of EITF D-98 to have a material impact on the consolidated financial statements or results of operations of the Company.
In November 2007, EITF Issued EITF 07-6, Accounting for Sale of Real Estate Subject to the Requirements of FASB Statement No. 66, Accounting for Sale of Real Estate, When the Agreement Includes a Buy-Sell Clause. The Task Force reached a consensus that a buy-sell clause in a sale of real estate that otherwise qualifies for partial sale accounting does not by itself constitute a form of continuing involvement that would preclude partial sale accounting under SFAS No. 66, Accounting for Sale of Real Estate. However, continuing involvement could be present if the buy-sell clause, in conjunction with other implicit and explicit terms of the arrangement, indicate that the seller has an obligation to repurchase the property, the terms of the transaction allow the buyer to compel the seller to repurchase the property, or the seller can compel the buyer to sell its interest in the property back to the seller. The consensus is effective for fiscal years beginning after December 15, 2007. The consensus applies to new assessments made under SFAS No.66 after the consensus’ effective date. We do not expect the adoption of EITF No. 07-6 to have any material impact on the consolidated financial statements or results of operations of the Company.
In November 2007, the SEC issued Staff Accounting Bulletin (SAB) No. 109, Written Loan Commitments Recorded at Fair Value through Earnings, which superseded SAB No. 105, Application of Accounting Principles to Loan Commitments. SAB No. 109 indicates that the expected net future cash flows related to the associated servicing of the loan should be included in measuring fair value for all written loan fair value for all written loan commitments that are accounted for at fair value through earnings. The bulletin retains the view of SAB No. 105 about recording the internally developed intangible assets as part of the fair value of a derivative loan commitment. SAB No. 109 is effective for derivative loan commitments issued or modified in fiscal years beginning after December 15, 2007. We do not expect the adoption of SAB No. 109 to have a material impact on the consolidated financial statements or results of operations of the Company.
In December 2007, the FASB issued SFAS No. 141R, Business Combinations. This new statement revises SFAS No. 141, which was issued June 2001. SFAS No. 141R changes multiple aspects of the accounting for business combinations. Under the guidance in SFAS No. 141R, the acquisition method must be used, which requires the acquirer to recognize most identifiable assets acquired, liabilities assumed and non-controlling interests in the acquiree at their full fair value on the acquisition date. Goodwill is to be recognized as the excess of the consideration transferred plus the fair value of the non-controlling interest over the fair values of the identifiable net assets acquired. Subsequent changes in the fair value of contingent consideration classified as a liability are to be recognized in earnings, while contingent consideration classified as equity is not to be remeasured. Costs such as transaction costs are to be excluded from acquisition accounting, generally leading to recognizing expense and additionally, restructuring costs that do not meet certain criteria at the acquisition date are to be subsequently recognized as post-acquisition costs. SFAS No. 141R is effective for business combinations for which the acquisition date is on or after the beginning of the first annual reporting period beginning on or after December 15, 2008. We are currently assessing the impact that the adoption of SFAS No. 141R will have on our consolidated financial statements.
In December 2007, the FASB issued SFAS No. 160, Noncontrolling Interests in Consolidated Financial Statements, which amends Accounting Research Bulletin (“ARB”) No. 51, Consolidated Financial Statements. SFAS No. 160 requires a non-controlling interest or minority interest to be reported by all entities in the same way, which is as equity in the consolidated financial statements. It also requires income attributable to the non-controlling interest to be disclosed on the face of the consolidated statement of income. Furthermore, SFAS No. 160 eliminates the diversity that currently exists in accounting for transactions between an entity and non-controlling interests by requiring they be treated as equity transactions. SFAS No. 160 is effective for financial statements issued for fiscal years beginning on or after December 15, 2008, and interim periods within those years. Early adoption is prohibited. The provisions of SFAS No. 160 should be applied prospectively, except for presentation and disclosure requirements. The presentation and disclosure requirements should be applied retrospectively for all periods presented. We are currently assessing the impact that the adoption of SFAS No. 160 will have on our consolidated financial statements.
Impact of Inflation; Seasonality
Inflation primarily impacts us by its effect on interest rates. Our primary source of income is net interest income, which is affected by changes in interest rates. We attempt to limit the impact of inflation on our net interest margin through management of rate-sensitive assets and liabilities and the analysis of interest rate sensitivity. The effect of inflation on premises and equipment as well as noninterest expenses has not been significant for the periods covered in this report. Our business is generally not seasonal.
| Item 7A. | Quantitative and Qualitative Disclosures about Market Risk |
Market risk is the risk of loss from adverse changes in market prices and rates. Our market risk arises primarily from interest rate risk inherent in lending, investing and deposit taking activities. We evaluate market risk pursuant to policies reviewed and approved annually by our Board of Directors. The Board delegates responsibility for market risk management to the Asset & Liability Management (“ALM”) Committee, which reports monthly to the Board on activities related to market risk management. As part of the management of our market risk, our ALM committee may direct changes in the mix of assets and liabilities. To that end, we actively monitor and manage interest rate risk exposures.
Interest rate risk management involves development, analysis, implementation and monitoring of earnings to provide stable earnings and capital levels during periods of changing interest rates. In the management of interest rate risk, we utilize monthly gap analysis and quarterly simulation modeling to determine the sensitivity of net interest income and economic value of equity. These techniques are complementary and are used together to provide a more accurate measurement of interest rate risk.
Gap analysis measures the repricing mismatches between assets and liabilities. The interest rate sensitivity gap is determined by subtracting the amount of liabilities from the amount of assets that reprice in a particular time interval. If repricing assets exceed repricing liabilities in any given time period, we would be deemed to be “asset-sensitive” for that period. Conversely, if repricing liabilities exceed repricing assets, we would be deemed to be “liability-sensitive” for that period.
We are currently in a liability-sensitive position for the one year time frame, but we are slightly asset-sensitive for the first three months of 2008. In general, based upon our current mix of deposits, loans and investments, decreases in interest rates would be expected to increase our net interest margin. Increases in interest rates would be expected to have the opposite effect. However, we usually seek to maintain a balanced position over the period of one year to ensure net interest margin stability in times of volatile interest rates. This is accomplished by maintaining a similar level of interest-earning assets and interest-paying liabilities available to be repriced within one year. At December 31, 2007, our position appeared liability-sensitive for a one-year timeframe with a liability sensitive cumulative gap of minus 16.70% of average interest-earning assets. We do not anticipate a major change in our net interest margin as we expect such repricing gap, if it occurred, to be eliminated within a year.
The change in net interest income may not always follow the general expectations of an “asset-sensitive” or a “liability-sensitive” balance sheet during periods of changing interest rates. This possibility results from interest rates changing by differing increments and at different time intervals for each type of interest-sensitive asset and liability. The interest rate sensitivity gaps reported in the tables arise when assets are funded with liabilities having different repricing intervals. Since these gaps are actively managed and change daily as adjustments are made in interest rate views and market outlook, positions at the end of any period may not reflect our interest rate sensitivity in subsequent periods. We attempt to balance longer-term economic views against prospects for short-term interest rate changes.
Although the interest rate sensitivity gap is a useful measurement and contributes to effective asset and liability management, it is difficult to predict the effect of changing interest rates based solely on that measure. As a result, the ALM committee also regularly uses simulation modeling as a tool to measure the sensitivity of earnings and net portfolio value (“NPV”) to interest rate changes. The NPV is defined as the net present value of an institution’s existing assets, liabilities and off-balance sheet instruments. The simulation model captures all assets, liabilities and off-balance sheet financial instruments and accounts for significant variables that are believed to be affected by interest rates. These include prepayment speeds on loans, cash flows of loans and deposits, principal amortization, call options on securities, balance sheet growth assumptions and changes in rate relationships as various rate indices react differently to market rates.
Although the simulation measures the volatility of net interest income and net portfolio value under immediate increase or decrease of market interest rate scenarios in 100 basis point increments, our main concern is the negative effect of a reasonably-possible worst scenario. The ALM policy prescribes that for the worst possible rate decreasing scenario the possible reduction of net interest income and NPV should not exceed 20% of the base net interest income and 25% of the base NPV, respectively.
As our simulation measures indicate below, the net interest income increases (decreases) as market interest rates rise (fall), since we were in an overall asset-sensitive position with a 4.6% positive gap for the three-month timeframe. The NPV increases (decreases) as interest income increases (decreases) since the change in cash flows has a greater impact on the change in the NPV than does the change in the discount rate. However the extent of such changes was within the tolerance level prescribed by our ALM policy due partly to the near-balanced cumulative gap for the one-year timeframe.
Management believes that the assumptions used to evaluate the vulnerability of our operations to changes in interest rates approximate actual experience and considers them reasonable; however, the interest rate sensitivity of our assets and liabilities and the estimated effects of changes in interest rates on our net interest income and NPV could vary substantially if different assumptions were used or actual experience differs from the historical experience on which they are based.
The following table sets forth the interest rate sensitivity of our interest-earning assets and interest-bearing liabilities as of December 31, 2007 using the interest rate sensitivity gap ratio. For purposes of the following table, an asset or liability is considered rate-sensitive within a specified period when it can be repriced or matures within its contractual terms. Actual payment patterns may differ from contractual payment patterns.
Interest Rate Sensitivity Analysis
| | | | At December 31, 2007 | |
| | | | Amounts Subject to Repricing Within | |
| | | | 0-3 months | | | 3-12 months | | | 1-5 years | | | After 5 years | | | Total | |
| | | | (Dollars in Thousands) | |
| Interest-earning assets: | | | | |
Gross loans1 | | $ | 1,167,312 | | $ | 63,305 | | $ | 497,925 | | $ | 71,706 | | $ | 1,800,248 | |
| Investment securities | | | 13,653 | | | 19,452 | | | 129,836 | | | 68,699 | | | 231,640 | |
| Federal funds sold and cash equivalents | | | 10,004 | | | - | | | - | | | - | | | 10,004 | |
| Interest-earning deposits | | | - | | | - | | | - | | | - | | | - | |
| Total | | $ | 1,190,969 | | $ | 82,757 | | $ | 627,761 | | $ | 140,405 | | $ | 2,041,892 | |
| | | | | | | | | | | | | | | | | |
| Interest-bearing liabilities: | | | | | | | | | | | | | | | | |
| Savings deposits | | $ | 31,812 | | $ | - | | $ | - | | $ | - | | $ | 31,812 | |
| Time deposits of $100,000 or more | | | 419,566 | | | 358,157 | | | 11,160 | | | - | | | 788,883 | |
| Other time deposits | | | 40,688 | | | 100,768 | | | 1,254 | | | 5 | | | 142,715 | |
| Other interest-bearing deposits | | | 485,547 | | | - | | | - | | | - | | | 485,547 | |
| Other borrowings | | | 121,857 | | | 50,000 | | | 65,464 | | | - | | | 237,321 | |
| Total | | $ | 1,099,470 | | $ | 508,925 | | $ | 77,878 | | $ | 5 | | $ | 1,686,278 | |
| | | | | | | | | | | | | | | | | |
| Interest rate sensitivity gap | | $ | 91,499 | | | ($426,168 | ) | $ | 549,883 | | $ | 140,400 | | $ | 355,614 | |
| Cumulative interest rate sensitivity gap | | $ | 91,499 | | | ($334,669 | ) | $ | 215,214 | | $ | 355,614 | | | | |
| Cumulative interest rate sensitivity gap ratio (based on total assets) | | | 4.57 | % | | -16.70 | % | | 10.74 | % | | 17.75 | % | | | |
1Excludes the gross amount of non-accrual loans of approximately $14.7 million at December 31, 2007.
The following table sets forth our estimated net interest income over a twelve months period and NPV based on the indicated changes in market interest rates as of December 31, 2007.
| | Net Interest Income (Next Twelve Months) | | % Change | | NPV | | % Change | |
| +200 | | $ | 96,278 | | | 5.74% | | $ | 283,487 | | | 4.60% | |
| +100 | | | 93,969 | | | 3.20% | | | 279,861 | | | 3.26% | |
| 0 | | | 91,052 | | | - | | | 271,025 | | | - | |
| -100 | | | 86,346 | | | -5.17% | | | 249,916 | | | -7.79% | |
| -200 | | | 80,559 | | | -11.52% | | | 221,745 | | | -18.18% | |
Our strategies in protecting both net interest income and economic value of equity from significant movements in interest rates involve restructuring our investment portfolio and using FHLB advances. We also permit the purchase of rate caps and floors and interest rate swaps, although we only engaged once in the interest rate swap agreement in September 2003 on the notional amount of $3 million which was subsequently terminated without any gain or loss by mutual agreement between us and a brokerage company in January 2004.
Item 8. | Financial Statements and Supplementary Data |
The information required by this item is included in Part IV, Item 15(a)(1) and are presented beginning on Page F-1.
Item 9. | Changes in and Disagreements with Accountants on Accounting and Financial Disclosure |
Not applicable.
| Item 9A. | Controls and Procedures |
Controls and Procedures
As of December 31, 2007, we carried out an evaluation, under the supervision and with the participation of our management, including our chief executive officer and chief financial officer, of the effectiveness of the design and operation of our “disclosure controls and procedures,” as such term is defined under Exchange Act Rules 13a-15(e) and 15d-15(e).
Based on this evaluation, our interim chief executive officer and interim chief financial officer concluded that, as of December 31, 2007, such disclosure controls and procedures were effective to ensure that information required to be disclosed by us in the reports we file or submit under the Exchange Act is recorded, processed, summarized and reported within the time periods specified in the rules and forms of the SEC, and accumulated and communicated to our management, including our chief executive officer and chief financial officer, as appropriate to allow timely decisions regarding required disclosure.
In designing and evaluating the disclosure controls and procedures, our management recognized that any controls and procedures, no matter how well designed and operated, can provide only reasonable assurance of achieving the desired control objectives and in reaching a reasonable level of assurance our management necessarily was required to apply its judgment in evaluating the cost-benefit relationship of possible controls and procedures.
Management’s Report on Internal Control over Financial Reporting
There were no changes in our internal controls over financial reporting during the quarter ended December 31, 2007 that materially affected, or are reasonably likely to materially affect, our internal controls over financial reporting.
Our management is responsible for establishing and maintaining an adequate system of internal control over financial reporting. Our system of internal control over financial reporting is designed to provide reasonable assurance regarding the reliability of financial reporting and the preparation of financial statements for external purposes in accordance with accounting principles generally accepted in the United States of America.
Our internal control over financial reporting includes those policies and procedures that:
| | | pertain to the maintenance of records that, in reasonable detail, accurately and fairly reflect our transactions and dispositions of our assets; |
| | | provide reasonable assurance that our transactions are recorded as necessary to permit preparation of our financial statements in accordance with accounting principles generally accepted in the United States of America, and that our receipts and expenditures are being made only in accordance with authorizations of our management and our directors; and |
| | | provide reasonable assurance regarding prevention or timely detection of unauthorized acquisition, use, or disposition of our assets that could have a material effect on the financial statements. |
Because of its inherent limitations, a system of internal control over financial reporting can provide only reasonable assurance and may not prevent or detect misstatements. Further, because of changes in conditions, effectiveness of internal controls over financial reporting may vary over time. Our system contains self monitoring mechanisms, and actions are taken to correct deficiencies as they are identified.
Our management conducted an evaluation of the effectiveness of the system of internal control over financial reporting based on the framework in Internal Control—Integrated Framework issued by the Committee of Sponsoring Organizations of the Treadway Commission. Based on this evaluation, our management concluded that our system of internal control over financial reporting was effective as of December 31, 2007. The Company’s internal control over financial reporting has been audited by Deloitte & Touche LLP, an independent registered public accounting firm, as stated in their report which is included herein.
REPORT OF INDEPENDENT REGISTERED PUBLIC ACCOUNTING FIRM
To the Board of Directors and Shareholders of
Wilshire Bancorp, Inc.
Los Angeles, California
We have audited the internal control over financial reporting of Wilshire Bancorp, Inc. and subsidiaries (the "Company") as of December 31, 2007, based on criteria established in Internal Control - Integrated Framework issued by the Committee of Sponsoring Organizations of the Treadway Commission. The Company's management is responsible for maintaining effective internal control over financial reporting and for its assessment of the effectiveness of internal control over financial reporting, included in the accompanying Management’s Report on Internal Control over Financial Reporting. Our responsibility is to express an opinion on the Company's internal control over financial reporting based on our audit.
We conducted our audit in accordance with the standards of the Public Company Accounting Oversight Board (United States). Those standards require that we plan and perform the audit to obtain reasonable assurance about whether effective internal control over financial reporting was maintained in all material respects. Our audit included obtaining an understanding of internal control over financial reporting, assessing the risk that a material weakness exists, testing and evaluating the design and operating effectiveness of internal control based on the assessed risk, and performing such other procedures as we considered necessary in the circumstances. We believe that our audit provides a reasonable basis for our opinion.
A company's internal control over financial reporting is a process designed by, or under the supervision of, the company's principal executive and principal financial officers, or persons performing similar functions, and effected by the company's board of directors, management, and other personnel to provide reasonable assurance regarding the reliability of financial reporting and the preparation of financial statements for external purposes in accordance with generally accepted accounting principles. A company's internal control over financial reporting includes those policies and procedures that (1) pertain to the maintenance of records that, in reasonable detail, accurately and fairly reflect the transactions and dispositions of the assets of the company; (2) provide reasonable assurance that transactions are recorded as necessary to permit preparation of financial statements in accordance with generally accepted accounting principles, and that receipts and expenditures of the company are being made only in accordance with authorizations of management and directors of the company; and (3) provide reasonable assurance regarding prevention or timely detection of unauthorized acquisition, use, or disposition of the company's assets that could have a material effect on the financial statements.
Because of the inherent limitations of internal control over financial reporting, including the possibility of collusion or improper management override of controls, material misstatements due to error or fraud may not be prevented or detected on a timely basis. Also, projections of any evaluation of the effectiveness of the internal control over financial reporting to future periods are subject to the risk that the controls may become inadequate because of changes in conditions, or that the degree of compliance with the policies or procedures may deteriorate.
In our opinion, the Company maintained, in all material respects, effective internal control over financial reporting as of December 31, 2007, based on the criteria established in Internal Control - Integrated Framework issued by the Committee of Sponsoring Organizations of the Treadway Commission.
We have also audited, in accordance with the standards of the Public Company Accounting Oversight Board (United States), the consolidated financial statements as of and for the year ended December 31, 2007 of the Company and our report dated March 13, 2008 expressed an unqualified opinion on those financial statements.
/s/ Deloitte & Touche LLP
Los Angeles, California
March 13, 2008
Item 9B. Other Information
Not applicable.
PART III
Item 10. Directors and Executive Officers of the Registrant
Information required by this item is incorporated herein by reference to the Company’s proxy statement (schedule 14A) for its 2008 Annual Meeting of Shareholders, which will be filed with the SEC not later than 120 days after December 31, 2007.
Item 11. Executive Compensation
Information required by this item is incorporated herein by reference to the Company’s proxy statement (schedule 14A) for its 2008 Annual Meeting of Shareholders, which will be filed with the SEC not later than 120 days after December 31, 2007.
Item 12. | Security Ownership of Certain Beneficial Owners, Management and Related Shareholder Matters |
Information required by this item is incorporated herein by reference to the Company’s proxy statement (schedule 14A) for its 2008 Annual Meeting of Shareholders, which will be filed with the SEC not later than 120 days after December 31, 2007.
Item 13. | Certain Relationships and Related Transactions |
Information required by this item is incorporated herein by reference to the Company’s proxy statement (schedule 14A) for its 2008 Annual Meeting of Shareholders, which will be filed with the SEC not later than 120 days after December 31, 2007.
Item 14. | Principal Accounting Fees and Services |
Information required by this item is incorporated herein by reference to the Company’s proxy statement (schedule 14A) for its 2008 Annual Meeting of Shareholders, which will be filed with the SEC not later than 120 days after December 31, 2007.
PART IV
Item 15. | Exhibits, Financial Statement Schedules |
(a) List of documents filed as part of this report
(1) Financial Statements
The following financial statements of Wilshire Bancorp, Inc. are filed as a part of this Form 10-K on the pages indicated:
| | | Page | |
Report of Independent Registered Public Accounting Firm | | | F-1 | |
| Consolidated Financial Statements: | | | | |
| Consolidated Statements of Financial Condition | | | F-2 | |
| Consolidated Statement of Operations | | | F-3 | |
| Consolidated Statements of Changes in Shareholders’ Equity | | | F-4 | |
| Consolidated Statements of Cash Flows | | | F-6 | |
| Notes to Consolidated Financial Statements | | | F-8 | |
(2) Financial Statement Schedules
Schedules to the financial statements are omitted because the required information is not applicable or the information is presented in the Company’s financial statements or related notes.
(3) Exhibits
| Exhibit Table |
| Reference Number | | Item |
| | | |
| 3.1 | | Articles of Incorporation, as amended and restated 1 |
| | | |
| 3.2 | | Bylaws, as amended and restated 1 |
| | | |
| 4.1 | | Specimen of Common Stock Certificate 2 |
| | | |
| 4.2 | | Indenture of Subordinated Debentures 2 |
| | | |
| 4.3 | | Indenture by and between Wilshire Bancorp, Inc. and U.S. Bank National Association dated as of December 17, 2003 2 |
| | | |
| 4.4 | | Amended and Restated Declaration of Trust by and among Wilshire Bancorp, Inc., U.S. Bank National Association, Soo Bong Min and Brian E. Cho dated as of December 17, 2003 3 |
| | | |
| 4.5 | | Guaranty Agreement by and between Wilshire Bancorp, Inc. and U.S. Bank National Association dated as of December 17, 2003 3 |
| | | |
| 4.6 | | Indenture by and between Wilshire Bancorp, Inc. and Wilmington Trust Company dated as of March 17, 2005 3 |
| | | |
| 4.7 | | Amended and Restated Declaration of Trust by and among Wilshire Bancorp, Inc., Wilmington Trust Company, Soo Bong Min, Brian E. Cho and Elaine Jeon dated as of March 17, 2005 3 |
| | | |
| 4.8 | | Guaranty Agreement by and between Wilshire Bancorp, Inc. and Wilmington Trust Company dated as of March 17, 2005 3 |
| 4.9 | | Indenture by and between Wilshire Bancorp, Inc. and Wilmington Trust Company dated as of September 15, 2005 3 |
| | | |
| 4.10 | | Amended and Restated Declaration of Trust by and among Wilshire Bancorp, Inc., Wilmington Trust Company, Brian E. Cho and Elaine Jeon dated as of September 15, 2005 3 |
| | | |
| 4.11 | | Guaranty Agreement by and between Wilshire Bancorp, Inc. and Wilmington Trust Company dated as of September 15, 2005 3 |
| | | |
| 4.12 | | Indenture by and between Wilshire Bancorp, Inc. and LaSalle Bank National Association dated as of July 10, 2007. 4 |
| | | |
| 4.13 | | Amended and Restated Declaration of Trust by and among LaSalle National Trust Delaware, LaSalle Bank National Association, Wilshire Bancorp, Inc., Soo Bong Min and Brian E. Cho dated as of July 10, 2007. 4 |
| | | |
| 4.14 | | Guarantee Agreement by and between Wilshire Bancorp, Inc. and LaSalle Bank National Association dated as of July 10, 2007. 4 |
| | | |
| 10.1 | | Lease dated September 1, 1996 between the Company and Wilmont, Inc. (Main Office - 1st floor) 5 |
| | | |
| 10.2 | | Lease dated May 1, 1990 between the Company and Western Properties Co., Ltd. (Western Branch) 5 |
| | | |
| 10.3 | | Lease dated February 3, 1997 between the Company and Benlin Properties (Downtown Branch) 5 |
| | | |
| 10.4 | | Sublease dated June 20, 1997 between the Company and Property Development Assoc. (Cerritos Branch) 5 |
| | | |
| 10.5 | | 1997 Stock Option Plan of Wilshire Bancorp, Inc. 5 , 14 |
| | | |
| 10.6 | | Addendum to Downtown Branch Lease, dated February 3, 1997 between the Company and Benlin Properties (Downtown Branch) 8 |
| | | |
| 10.7 | | Lease dated October 26, 1998 between the Company and Union Square Limited Partnership. (Seattle Business Lending Office) 8 |
| | | |
| 10.8 | | Lease dated March 18, 1999 between the Company and BGK Texas Property Management, Inc. (Dallas Business Lending Office) 9 |
| | | |
| 10.9 | | Lease dated February 4, 2000 between the Company and Wilmont, Inc. (Commercial Loan Center and Corporate headquarter - 14th floor) 10 |
| | | |
| 10.10 | | Lease dated September 1, 2000 between the Company and Joseph Hanasab (Gardena Office) 12 |
| | | |
| 10.11 | | Lease dated January 8, 2001 between the Company and UNT Atia Co. II, a California general partnership (Rowland Heights Office) 10 |
| | | |
| 10.12 | | Sublease dated March 13, 2002 between the Company and Assi Food International, Inc (Garden Grove Office) 11 |
| | | |
| 10.13 | | Lease dated October 3, 2002 between the Company and Terok Management, Inc. (Mid-Wilshire Office) 11 |
| | | |
| 10.14 | | Survivor income plan and exhibit thereto (Split dollar agreement) 14,15 |
| | | |
| 10.15 | | Stock Purchase Agreement by and between Wilshire Bancorp, Inc. and Texas Bank dated January 29, 2004 7 |
| | | |
| 10.16 | | Consulting Agreement with Soo Bong Min dated December 19, 2007 14,15 |
| | | |
| 11 | | Statement Regarding Computation of Net Earnings per Share 13 |
| | | |
| 21 | | Subsidiaries of the Registrant |
| | | |
| 23.1 | | Consent of Independent Registered Public Accounting Firm |
| | | |
| 31.1 | | Certification of Chief Executive Officer pursuant to Section 302 of the Sarbanes-Oxley Act of 2002 |
| | | |
| 31.2 | | Certification of Chief Financial Officer pursuant to Section 302 of the Sarbanes-Oxley Act of 2002 |
| 32 | | Certifications of Chief Executive Officer and Chief Financial Officer Pursuant to 18 U.S.C. Section 1350, as Adopted Pursuant to Section 906 of the Sarbanes-Oxley Act of 2002 |
1 | Incorporated by reference to the Exhibits in the Registration Statement on Form S-4 filed with the SEC on June 15, 2004. |
2 | Incorporated by reference to the Exhibits in the Registration Statement on Form S-4 filed with the SEC on April 1, 2004. |
3 | Incorporated by reference to the Exhibits to the Company’s Form 10-K, as filed with the SEC on March 16, 2007. |
| 4 | Incorporated by reference to the Exhibits to the Company’s Form 10-Q, as filed with the SEC on November 9, 2007. |
| 5 | Incorporated by reference to the Exhibits to the Company’s Form 10-SB Registration Statement, as filed with the FDIC on August 7, 1998. |
| 6 | Incorporated by reference to the Exhibits to the Company’s Form 10-Q, as filed with the FDIC on May 16, 2003. |
| 7 | Incorporated by reference to the Exhibits to the Company’s Form 10-K, as filed with the FDIC on March 29, 2004. |
| 8 | Incorporated by reference to the Exhibits to the Company’s Form 10-KSB, as filed with the FDIC on March 30, 1999. |
| 9 | Incorporated by reference to the Exhibits to the Company’s Form 10-KSB, as filed with the FDIC on April 5, 2000. |
| 10 | Incorporated by reference to the Exhibits to the Company’s Form 10-KSB, as filed with the FDIC on March 29, 2001. |
| 11 | Incorporated by reference to the Exhibits to the Company’s Form 10-K, as filed with the FDIC on March 31, 2004. |
| 12 | Incorporated by reference to the Exhibits to the Company’s Form 10-Q, as filed with the FDIC on August 20, 2003. |
| 13 | The information required by this Exhibit is incorporated by reference from Note 18 of the Company’s Financial Statements included herein. |
14 | Indicates compensation or compensatory plan, contract or arrangement. |
15 | Incorporated by reference to the Exhibits to the Company's Form 8-K, as filed with the SEC on December 20, 2007. |
SIGNATURES
Pursuant to the requirements of Section 13 or 15(d) of the Securities Act of 1934, the registrant has duly caused this Amendment to be signed on its behalf by the undersigned, thereunto duly authorized.
| | | |
| | WILSHIRE BANCORP, INC. |
| a California corporation |
| Date: March 17, 2008 | By: | /s/ Elaine S. Jeon |
| |
Elaine S. Jeon Interim Chief Financial Officer |
Pursuant to the requirements of the Securities Exchange Act of 1934, this Report has been signed below by the following persons on behalf of the Registrant and in the capacities and on the dates indicated.
Signature | | Title | | Date |
| | | | | |
/s/ STEVEN KOH | | Chairman and Director | | March 17, 2008 |
| | | | |
| | | | | |
| /s/ JOANNE KIM | | Interim President and Chief Executive Officer (Principal Executive Officer) | | |
| | | | |
| | | | | |
| /s/ ELAINE S. JEON | | Interim Chief Financial Officer | | |
| ELAINE S. JEON | | (Principal Financial Officer and Principal Accounting Officer) | | |
| /s/ LAWRENCE JEON | | Director | | |
| | | | |
| | | | | |
| /s/ KYU-HYUN KIM | | Director | | |
| | | | |
| | | | | |
| /s/ MEL ELLIOT | | Director | | |
| | | | |
| | | | | |
| /s/ RICHARD Y. LIM | | Director | | |
| | | | |
| | | | | |
| /s/ FRED F. MAUTNER | | Director | | |
| | | | |
| | | | | |
| /s/ YOUNG H. PAK | | Director | | |
| | | | |
| | | | | |
| /s/ HARRY SIAFARIS | | Director | | |
| | | | |
| | | | | |
| /s/ GAPSU KIM | | Director | | |
| | | | |
| | | | | |
(This page intentionally left blank)
Wilshire Bancorp, Inc.
Financial Statements as of December 31, 2007
and 2006 and for Each of the Three Years in the
Period Ended December 31, 2007 and
Report of Independent Registered Public
Accounting Firm
(This page intentionally left blank)
REPORT OF INDEPENDENT REGISTERED PUBLIC ACCOUNTING FIRM
To the Board of Directors and Shareholders of
Wilshire Bancorp, Inc.
Los Angeles, California
We have audited the accompanying consolidated statements of financial condition of Wilshire Bancorp, Inc. and subsidiaries (the "Company") as of December 31, 2007 and 2006, and the related consolidated statements of operations, shareholders' equity, and cash flows for each of the three years in the period ended December 31, 2007. These financial statements are the responsibility of the Company's management. Our responsibility is to express an opinion on these financial statements based on our audits.
We conducted our audits in accordance with the standards of the Public Company Accounting Oversight Board (United States). Those standards require that we plan and perform the audit to obtain reasonable assurance about whether the financial statements are free of material misstatement. An audit includes examining, on a test basis, evidence supporting the amounts and disclosures in the financial statements. An audit also includes assessing the accounting principles used and significant estimates made by management, as well as evaluating the overall financial statement presentation. We believe that our audits provide a reasonable basis for our opinion.
In our opinion, such consolidated financial statements present fairly, in all material respects, the financial position of Wilshire Bancorp, Inc. and subsidiaries as of December 31, 2007 and 2006, and the results of their operations and their cash flows for each of the three years in the period ended December 31, 2007, in conformity with accounting principles generally accepted in the United States of America.
We have also audited, in accordance with the standards of the Public Company Accounting Oversight Board (United States), the Company's internal control over financial reporting as of December 31, 2007, based on the criteria established in Internal Control — Integrated Framework issued by the Committee of Sponsoring Organizations of the Treadway Commission and our report dated March 13, 2008 expressed an unqualified opinion on the Company's internal control over financial reporting.
/s/ Deloitte & Touche LLP
Los Angeles, California
March 13, 2008
WILSHIRE BANCORP, INC. | |
| | |
CONSOLIDATED STATEMENTS OF FINANCIAL CONDITION | |
DECEMBER 31, 2007 and 2006 | |
| | 2007 | | 2006 | |
ASSETS | | | | | | | |
| Cash and due from banks | | $ | 82,505,862 | | $ | 75,243,346 | |
| Federal funds sold and other cash equivalents | | | 10,003,552 | | | 130,003,268 | |
| Cash and cash equivalents | | | 92,509,414 | | | 205,246,614 | |
| Securities available for sale, at fair value (amortized cost of $223,933,323 and $168,662,357 at December 31, 2007 and 2006, respectively) | | | 224,255,643 | | | 167,837,734 | |
| Securities held to maturity, at amortized cost (fair value of $7,371,635 and $14,445,714 at December 31, 2007 and 2006, respectively) | | | 7,383,862 | | | 14,620,870 | |
| Interest-only strips, at fair value (amortized cost of $429,597 and $1,008,064 at December 31, 2007 and 2006, respectively) | | | 753,343 | | | 1,130,006 | |
| Loans held for sale—at the lower of cost or market | | | 7,912,284 | | | 5,496,421 | |
| Loans receivable, net of allowance for loan losses of $21,579,403 and $18,654,082 at December 31, 2007 and 2006, respectively | | | 1,779,558,242 | | | 1,536,388,815 | |
| Bank premises and equipment—net | | | 10,960,092 | | | 10,464,600 | |
| Federal Home Loan Bank stock, at cost—net | | | 8,695,100 | | | 7,541,700 | |
| Accrued interest receivable | | | 10,062,050 | | | 10,049,265 | |
| Other real estate owned—net | | | 133,400 | | | 138,000 | |
| Deferred income taxes—net | | | 9,151,170 | | | 9,722,008 | |
| Servicing assets | | | 4,949,572 | | | 5,080,466 | |
| Due from customers on acceptances | | | 3,377,223 | | | 2,385,134 | |
| Cash surrender value of life insurance | | | 16,228,282 | | | 15,635,773 | |
| Goodwill | | | 6,674,772 | | | 6,674,772 | |
| Core deposit intangible | | | 1,358,821 | | | 1,532,485 | |
| Favorable lease intangible | | | 228,015 | | | 352,231 | |
| Other assets | | | 12,514,140 | | | 8,186,927 | |
| TOTAL | | $ | 2,196,705,425 | | $ | 2,008,483,821 | |
| | | | | | | | |
LIABILITIES AND SHAREHOLDERS’ EQUITY | | | | | | | |
| LIABILITIES: | | | | | | | |
| Deposits: | | | | | | | |
| Noninterest bearing | | $ | 314,114,461 | | $ | 319,310,552 | |
| Interest bearing: | | | | | | | |
| Savings | | | 31,812,238 | | | 29,019,943 | |
| Time deposits of $100,000 or more | | | 788,882,544 | | | 812,105,950 | |
| Other time deposits | | | 142,715,172 | | | 160,933,032 | |
| Money market accounts and other | | | 485,546,712 | | | 430,603,175 | |
| Total deposits | | | 1,763,071,127 | | | 1,751,972,652 | |
| Federal Home Loan Bank borrowings | | | 150,000,000 | | | 20,000,000 | |
| Junior subordinated debentures | | | 87,321,000 | | | 61,547,000 | |
| Accrued interest payable | | | 10,440,374 | | | 12,006,124 | |
| Acceptances outstanding | | | 3,377,223 | | | 2,385,134 | |
| Other liabilities | | | 10,709,652 | | | 10,937,886 | |
| Total liabilities | | | 2,024,919,376 | | | 1,858,848,796 | |
| COMMITMENTS AND CONTINGENCIES (Note 8) | | | | | | | |
| SHAREHOLDERS’ EQUITY: | | | | | | | |
| Preferred stock, no par value—authorized, 5,000,000 shares; issued and outstanding, none | | | | | | | |
| Common stock, no par value—authorized, 80,000,000 shares; issued and outstanding, 29,253,311 shares and 29,197,420 shares at December 31, 2007 and 2006, respectively | | | 50,895,121 | | | 49,122,536 | |
| Accumulated other comprehensive income (loss), net of tax expense (benefit) of $566,571 and $448,037 at December 31, 2007 and 2006, respectively | | | 374,563 | | | (407,612 | ) |
| Retained earnings | | | 121,778,054 | | | 100,920,101 | |
| | | | 173,047,738 | | | 149,635,025 | |
| Less Treasury stock, at cost, 127,425 shares and no shares at December 31, 2007 and and December 31, 2006, respectively | | | (1,261,689 | ) | | - | |
| Total shareholders’ equity | | | 171,786,049 | | | 149,635,025 | |
| TOTAL | | $ | 2,196,705,425 | | $ | 2,008,483,821 | |
| See accompanying notes to consolidated financial statements. | |
WILSHIRE BANCORP, INC. | |
| | |
CONSOLIDATED STATEMENTS OF OPERATIONS | |
FOR EACH OF THE THREE YEARS IN THE PERIOD ENDED DECEMBER 31, 2007 | |
| | | 2007 | | 2006 | | 2005 | |
| INTEREST INCOME: | | | | | | | |
| Interest and fees on loans | | $ | 144,739,704 | | $ | 127,840,571 | | $ | 89,627,755 | |
| Interest on investment securities and deposits in | | | | | | | | | | |
| other financial institutions | | | 9,975,191 | | | 8,673,540 | | | 4,864,602 | |
| Interest on federal funds sold and other cash equivalents | | | 2,920,820 | | | 4,885,559 | | | 2,796,128 | |
| Total interest income | | | 157,635,715 | | | 141,399,670 | | | 97,288,485 | |
| | | | | | | | | | | |
| INTEREST EXPENSE: | | | | | | | | | | |
| Deposits | | | 68,765,653 | | | 58,943,556 | | | 29,914,136 | |
| Interest on other borrowings | | | 7,519,924 | | | 5,879,725 | | | 4,426,541 | |
| Total interest expense | | | 76,285,577 | | | 64,823,281 | | | 34,340,677 | |
| | | | | | | | | | | |
| NET INTEREST INCOME BEFORE PROVISION FOR | | | | | | | | | | |
| LOAN LOSSES AND LOAN COMMITMENTS | | | 81,350,138 | | | 76,576,389 | | | 62,947,808 | |
| | | | | | | | | | | |
| PROVISION FOR LOSSES ON LOANS AND | | | | | | | | | | |
| LOAN COMMITMENTS | | | 14,980,000 | | | 6,000,000 | | | 3,350,000 | |
| | | | | | | | | | | |
| NET INTEREST INCOME AFTER PROVISION FOR | | | | | | | | | | |
| LOAN LOSSES AND LOAN COMMITMENTS | | | 66,370,138 | | | 70,576,389 | | | 59,597,808 | |
| | | | | | | | | | | |
| NONINTEREST INCOME: | | | | | | | | | | |
| Service charges on deposit accounts | | | 9,780,713 | | | 9,554,319 | | | 7,546,982 | |
| Gain on sale of loans | | | 7,501,772 | | | 11,641,936 | | | 8,310,229 | |
| Loan-related servicing fees | | | 1,611,770 | | | 2,098,987 | | | 1,996,916 | |
| Income from other earning assets | | | 1,147,621 | | | 1,045,457 | | | 874,240 | |
| Other income | | | 2,541,693 | | | 2,059,309 | | | 1,749,093 | |
| Total noninterest income | | | 22,583,569 | | | 26,400,008 | | | 20,477,460 | |
| | | | | | | | | | | |
| NONINTEREST EXPENSES: | | | | | | | | | | |
| Salaries and employee benefits | | | 24,437,210 | | | 23,823,348 | | | 19,226,244 | |
| Occupancy and equipment | | | 5,302,130 | | | 4,554,096 | | | 3,465,388 | |
| Data processing | | | 3,089,211 | | | 2,449,883 | | | 1,916,911 | |
| Loan referral fees | | | 1,370,012 | | | 1,522,812 | | | 1,283,981 | |
| Outsourced service for customers | | | 1,783,087 | | | 1,348,752 | | | 1,434,853 | |
| Advertising and promotional | | | 1,229,816 | | | 1,256,260 | | | 965,939 | |
| Professional fees | | | 1,391,609 | | | 1,143,062 | | | 857,959 | |
| Office supplies | | | 701,959 | | | 708,936 | | | 654,456 | |
| Directors’ fees | | | 553,984 | | | 535,068 | | | 492,630 | |
| Communications | | | 483,041 | | | 461,573 | | | 428,232 | |
| Investor relations | | | 293,854 | | | 262,465 | | | 378,465 | |
| Deposit insurance premiums | | | 923,431 | | | 186,502 | | | 154,768 | |
| Amortization of core deposit intangible | | | 173,664 | | | 107,575 | | | - | |
| Amortization of favorable lease intangible | | | 124,217 | | | 77,253 | | | - | |
| Other operating | | | 2,981,712 | | | 2,794,421 | | | 2,303,017 | |
| Total noninterest expenses | | | 44,838,937 | | | 41,232,006 | | | 33,562,843 | |
| | | | | | | | | | | |
| INCOME BEFORE INCOME TAX PROVISION | | | 44,114,770 | | | 55,744,391 | | | 46,512,425 | |
| | | | | | | | | | | |
| INCOME TAX PROVISION | | | 17,308,552 | | | 21,802,732 | | | 18,752,776 | |
| | | | | | | | | | | |
| NET INCOME | | $ | 26,806,218 | | $ | 33,941,659 | | $ | 27,759,649 | |
| EARNINGS PER SHARE: | | | | | | | | | | |
| Basic | | $ | 0.91 | | $ | 1.17 | | $ | 0.97 | |
| Diluted | | $ | 0.91 | | $ | 1.16 | | $ | 0.96 | |
| | | | | | | | | | | |
| Average shares outstanding for basic earning per share | | | 29,339,454 | | | 28,986,217 | | | 28,544,474 | |
| Average shares outstanding for diluted earning per share | | | 29,449,211 | | | 29,330,732 | | | 28,913,542 | |
| See accompanying notes to consolidated financial statements. | |
WILSHIRE BANCORP, INC. | |
| | |
CONSOLIDATED STATEMENTS OF CHANGES IN SHAREHOLDERS’ EQUITY | |
FOR EACH OF THE THREE YEARS IN THE PERIOD ENDED DECEMBER 31, 2007 | |
| | | Common Stock | | Accumulated | | | | | | | |
| | | Gross | | | | | | | | Other | | | | Treasury | | Total | |
| | | Shares | | Treasury | | Shares | | | | Comprehensive | | Retained | | Stock, | | Shareholders’ | |
| | | Issued | | Shares | | Outstanding | | Amount | | Income (Loss) | | Earnings | | at Cost | | Equity | |
| | | | | | | | | | | | | | | | | | |
| BALANCE—January 1, 2005 | | | 28,142,470 | | | | | | 28,142,470 | | $ | 38,926,430 | | $ | (223,703 | ) | $ | 49,604,891 | | $ | - | | $ | 88,307,618 | |
| Stock options exercised | | | 488,130 | | | | | | 488,130 | | | 480,300 | | | | | | | | | | | | 480,300 | |
| Cash dividend declared | | | | | | | | | | | | | | | | | | (4,574,918 | ) | | | | | (4,574,918 | ) |
| Tax benefit from stock options exercised | | | | | | | | | | | | 1,933,718 | | | | | | | | | | | | 1,933,718 | |
| Comprehensive income: | | | | | | | | | | | | | | | | | | | | | | | | | |
| Net income | | | | | | | | | | | | | | | | | | 27,759,649 | | | | | | 27,759,649 | |
| Other comprehensive income: | | | | | | | | | | | | | | | | | | | | | | | | | |
| Change in unrealized loss on | | | | | | | | | | | | | | | | | | | | | | | | | |
| interest-only strips | | | | | | | | | | | | | | | (8,498 | ) | | | | | | | | (8,498 | ) |
| Change in unrealized loss on | | | | | | | | | | | | | | | | | | | | | | | | | |
| securities available for sale | | | | | | | | | | | | | | | (794,001 | ) | | | | | | | | (794,001 | ) |
| Comprehensive income | | | | | | | | | | | | | | | | | | | | | | | $ | 26,957,150 | |
| BALANCE—December 31, 2005 | | | 28,630,600 | | | - | | | 28,630,600 | | $ | 41,340,448 | | $ | (1,026,202 | ) | $ | 72,789,622 | | $ | - | | $ | 113,103,868 | |
| Stock options exercised | | | 238,710 | | | | | | 238,710 | | | 474,028 | | | | | | | | | | | | 474,028 | |
| Cash dividend declared | | | | | | | | | | | | | | | | | | (5,811,180 | ) | | | | | (5,811,180 | ) |
| Stock compensation expense | | | | | | | | | | | | 472,219 | | | | | | | | | | | | 472,219 | |
| Tax benefit from stock options exercised | | | | | | | | | | | | 899,248 | | | | | | | | | | | | 899,248 | |
| Shares issued for acquisition of | | | | | | | | | | | | | | | | | | | | | | | | | |
| Liberty Bank of New York | | | 328,110 | | | | | | 328,110 | | | 5,936,593 | | | | | | | | | | | | 5,936,593 | |
| Comprehensive income: | | | | | | | | | | | | | | | | | | | | | | | | | |
| Net income | | | | | | | | | | | | | | | | | | 33,941,659 | | | | | | 33,941,659 | |
| Other comprehensive income: | | | | | | | | | | | | | | | | | | | | | | | | | |
| Change in unrealized loss on | | | | | | | | | | | | | | | | | | | | | | | | | |
| interest-only strips | | | | | | | | | | | | | | | 65,728 | | | | | | | | | 65,728 | |
| Change in unrealized loss on | | | | | | | | | | | | | | | | | | | | | | | | | |
| securities available for sale | | | | | | | | | | | | | | | 552,862 | | | | | | | | | 552,862 | |
| Comprehensive income | | | | | | | | | | | | | | | | | | | | | | | $ | 34,560,249 | |
| BALANCE—December 31, 2006 | | | 29,197,420 | | | - | | | 29,197,420 | | $ | 49,122,536 | | $ | (407,612 | ) | $ | 100,920,101 | | $ | - | | $ | 149,635,025 | |
| Stock options exercised | | | 183,316 | | | | | | 183,316 | | | 138,402 | | | | | | | | | | | | 138,402 | |
| Cash dividend declared | | | | | | | | | | | | | | | | | | (5,866,299 | ) | | | | | (5,866,299 | ) |
| Stock compensation expense | | | | | | | | | | | | 347,736 | | | | | | | | | | | | 347,736 | |
| Tax benefit from stock options exercised | | | | | | | | | | | | 1,286,447 | | | | | | | | | | | | 1,286,447 | |
| Stock repurchase | | | | | | (127,425 | ) | | (127,425 | ) | | | | | | | | | | | (1,261,689 | ) | | (1,261,689 | ) |
| Cumulative impact of change in accounting | | | | | | | | | | | | | | | | | | | | | | | | | |
| for uncertainties in income taxes | | | | | | | | | | | | | | | | | | | | | | | | | |
| (FIN 48 - see Note 1) | | | | | | | | | | | | | | | | | | (161,583 | ) | | | | | (161,583 | ) |
| Cumulative impact of change in accounting | | | | | | | | | | | | | | | | | | | | | | | | | |
| for fair valuation method adoption | | | | | | | | | | | | | | | | | | | | | | | | | |
| related to loan servicing assets | | | | | | | | | | | | | | | | | | | | | | | | | |
| (FAS 156 - see Note 1) | | | | | | | | | | | | | | | | | | 79,617 | | | | | | 79,617 | |
| Comprehensive income: | | | | | | | | | | | | | | | | | | | | | | | | | |
| Net income | | | | | | | | | | | | | | | | | | 26,806,218 | | | | | | 26,806,218 | |
| Other comprehensive income: | | | | | | | | | | | | | | | | | | | | | | | | | |
| Change in unrealized gain on | | | | | | | | | | | | | | | | | | | | | | | | | |
| interest-only strips | | | | | | | | | | | | | | | 116,953 | | | | | | | | | 116,953 | |
| Change in unrealized gain on | | | | | | | | | | | | | | | | | | | | | | | | | |
| securities available for sale | | | | | | | | | | | | | | | 665,222 | | | | | | | | | 665,222 | |
| Comprehensive income | | | | | | | | | | | | | | | | | | | | | | | $ | 27,588,393 | |
| BALANCE—December 31, 2007 | | | 29,380,736 | | | (127,425 | ) | | 29,253,311 | | $ | 50,895,121 | | $ | 374,563 | | $ | 121,778,054 | | $ | (1,261,689 | ) | $ | 171,786,049 | |
| See accompanying notes to consolidated financial statements. | | | (Continued | ) |
WILSHIRE BANCORP, INC. | |
| | |
CONSOLIDATED STATEMENTS OF CHANGES IN SHAREHOLDERS’ EQUITY | |
FOR EACH OF THE THREE YEARS IN THE PERIOD ENDED DECEMBER 31, 2007 | |
| | | 2007 | | 2006 | | 2005 | |
| | | | | | | | |
| DISCLOSURE OF RECLASSIFICATION AMOUNTS WITHIN ACCUMULATED OTHER COMPREHENSIVE INCOME (LOSS) FOR DECEMBER 31: | | | | | | | |
| Net unrealized gains (losses) on securities available | | | | | | | |
| for sale arising during year | | $ | 1,146,943 | | $ | 953,207 | | $ | (1,368,966 | ) |
| Less income tax expense (benefit) | | | 481,721 | | | 400,345 | | | (574,965 | ) |
| Net unrealized gains (losses) on securities available for sale | | $ | 665,222 | | $ | 552,862 | | $ | (794,001 | ) |
| | | | | | | | | | | |
| Net unrealized gains (losses) on interest-only strips | | | | | | | | | | |
| arising during period | | $ | 201,803 | | $ | 25,400 | | $ | (111,957 | ) |
| Less reclassification adjustment for impairment | | | - | | | (88,020 | ) | | (97,305 | ) |
| Less income tax expense (benefit) | | | 84,850 | | | 47,692 | | | (6,154 | ) |
| Net unrealized gains (losses) on interest-only strips | | $ | 116,953 | | $ | 65,728 | | $ | (8,498 | ) |
| See accompanying notes to consolidated financial statements. | | | (Concluded | ) |
| |
| | |
CONSOLIDATED STATEMENTS OF CASH FLOWS | |
FOR EACH OF THE THREE YEARS IN THE PERIOD ENDED DECEMBER 31, 2007 | |
| | | 2007 | | 2006 | | 2005 | |
| CASH FLOWS FROM OPERATING ACTIVITIES: | | | | | | | |
| Net income | | $ | 26,806,218 | | $ | 33,941,659 | | $ | 27,759,649 | |
| Adjustments to reconcile net income to net cash provided by operating activities: | | | | | | | | | | |
| Amortization and accretion of investment securities | | | (125,464 | ) | | (86,922 | ) | | (18,386 | ) |
| Depreciation of premises & equipment | | | 1,628,396 | | | 1,350,879 | | | 1,002,188 | |
| Amortization of core deposit intangible | | | 173,664 | | | 107,575 | | | - | |
| Amortization of favorable lease intangible | | | 124,217 | | | 77,253 | | | - | |
| Provision for losses on loans and loan commitments | | | 14,980,000 | | | 6,000,000 | | | 3,350,000 | |
| Deferred tax benefit | | | (53,496 | ) | | (1,515,798 | ) | | (2,693,877 | ) |
| Loss on disposition of bank premises and equipment | | | 11,545 | | | 162,592 | | | 20,091 | |
| Net gain on sale of loans | | | (7,501,772 | ) | | (11,641,936 | ) | | (8,310,229 | ) |
| Origination of loans held for sale | | | (131,244,529 | ) | | (170,440,894 | ) | | (149,332,947 | ) |
| Proceeds from sale of loans held for sale | | | 134,817,811 | | | 195,318,824 | | | 156,465,745 | |
| (Gain) or loss on sale or call of available for sale securities | | | (42,453 | ) | | 2,023 | | | - | |
| Recovery of valuation allowance for servicing assets | | | | | | (172,461 | ) | | - | |
| Increase in fair value of serving assets | | | (568,253 | ) | | | | | | |
| Increase in fair value of serving liabilities | | | 46,834 | | | - | | | - | |
| Valuation allowance for impairment on servicing assets | | | - | | | - | | | 172,461 | |
| Impairment on interest-only strips | | | - | | | 88,020 | | | 97,305 | |
| (Gain) or loss on sale of other real estate owned | | | (138,345 | ) | | 1,023 | | | 8,607 | |
| Loss on sale of repossessed vehicles | | | 27,045 | | | - | | | - | |
| Stock-based compensation cost | | | 347,736 | | | 472,219 | | | - | |
| Change in cash surrender value of life insurance | | | (592,508 | ) | | (537,002 | ) | | (562,294 | ) |
| Servicing assets capitalized | | | (1,637,326 | ) | | (2,092,104 | ) | | (2,037,465 | ) |
| Servicing assets amortization | | | 2,473,853 | | | 1,866,947 | | | 1,556,130 | |
| Decrease (increase) in interest-only strips | | | 578,464 | | | 397,260 | | | (119,646 | ) |
| Increase in accrued interest receivable | | | (12,786 | ) | | (2,875,826 | ) | | (3,024,665 | ) |
| Increase in other assets | | | (4,582,952 | ) | | (2,148,713 | ) | | (2,497,687 | ) |
| Dividends of Federal Home Loan Bank stock | | | (421,100 | ) | | (344,700 | ) | | (217,900 | ) |
| Tax benefit from exercise of stock options | | | (1,286,447 | ) | | (899,249 | ) | | 1,933,718 | |
| (Decrease) Increase in accrued interest payable | | | (1,565,750 | ) | | 5,051,954 | | | 4,006,489 | |
| (Decrease) increase in other liabilities | | | (259,909 | ) | | (271,646 | ) | | 2,524,077 | |
| Net cash provided by operating activities | | | 31,982,693 | | | 51,810,977 | | | 30,081,364 | |
| | | | | | | | | | | |
| CASH FLOWS FROM INVESTING ACTIVITIES: | | | | | | | | | | |
| Net decrease (increase) in interest-bearing | | | | | | | | | | |
| deposits in other financial institutions | | | - | | | 500,000 | | | (500,000 | ) |
| Purchase of securities held to maturity | | | - | | | - | | | (1,999,000 | ) |
| Proceeds from principal repayment, matured or | | | | | | | | | | |
| called securities held to maturity | | | 7,236,940 | | | 8,247,111 | | | 8,420,767 | |
| Purchase of securities available for sale | | | (188,388,310 | ) | | (72,200,130 | ) | | (120,603,490 | ) |
| Proceeds from matured securities available for sale | | | 133,285,329 | | | 59,152,691 | | | 66,295,345 | |
| Net increase in loans receivable | | | (271,245,835 | ) | | (308,030,809 | ) | | (245,553,716 | ) |
| Proceeds from sale of loans | | | 14,324,748 | | | 21,230,737 | | | 3,967,642 | |
| Proceeds from sale of other real estate owned | | | 1,530,508 | | | 186,143 | | | 299,592 | |
| Proceeds from sale of repossessed vehicles | | | 112,132 | | | - | | | - | |
| Purchases of Bank premises and equipment | | | (2,181,483 | ) | | (1,640,480 | ) | | (4,407,353 | ) |
| Purchases of Federal Home Loan Bank stock | | | (732,300 | ) | | (1,015,300 | ) | | (1,646,700 | ) |
| Proceeds from redemption of Federal Home | | | | | | | | | | |
| Loan Bank stock | | | - | | | - | | | 54,400 | |
| Purchase of bank owned life insurance | | | - | | | - | | | (3,000,000 | ) |
| Proceeds from disposition of Bank equipment | | | 166,248 | | | 4,080 | | | - | |
| Acquisition of Liberty Bank, net of cash and cash equivalents acquired | | | - | | | 5,906,248 | | | - | |
| Net cash used in investing activities | | | (305,892,023 | ) | | (287,659,709 | ) | | (298,672,513 | ) |
| See accompanying notes to consolidated financial statements. | | | (Continued | ) |
| |
| | |
CONSOLIDATED STATEMENTS OF CASH FLOWS | |
FOR EACH OF THE THREE YEARS IN THE PERIOD ENDED DECEMBER 31, 2007 | |
| CASH FLOWS FROM FINANCING ACTIVITIES: | | | | | | | |
| Proceeds from exercise of stock options | | $ | 138,402 | | $ | 474,028 | | $ | 480,300 | |
| Payment of cash dividend | | | (5,863,504 | ) | | (5,496,533 | ) | | (3,429,694 | ) |
| Cash paid to acquire treasury stock | | | (1,261,689 | ) | | - | | | - | |
| Increase (decrease) in Federal Home Loan Bank borrowings | | | 130,000,000 | | | (41,000,000 | ) | | 20,000,000 | |
| Increase in junior subordinated debentures | | | 25,774,000 | | | - | | | 36,083,000 | |
| Tax benefit from exercise of stock options | | | 1,286,447 | | | 899,249 | | | - | |
| Net increase in deposits | | | 11,098,474 | | | 292,010,546 | | | 310,759,863 | |
| Net cash provided by financing activities | | | 161,172,130 | | | 246,887,290 | | | 363,893,469 | |
| | | | | | | | | | | |
| NET INCREASE (DECREASE) IN CASH AND CASH EQUIVALENTS | | | (112,737,200 | ) | | 11,038,558 | | | 95,302,320 | |
| | | | | | | | | | | |
| CASH AND CASH EQUIVALENTS—Beginning of year | | | 205,246,614 | | | 194,208,056 | | | 98,905,736 | |
| CASH AND CASH EQUIVALENTS—End of year | | $ | 92,509,414 | | $ | 205,246,614 | | $ | 194,208,056 | |
| | | | | | | | | | | |
| SUPPLEMENTAL DISCLOSURES OF CASH FLOW INFORMATION: | | | | | | | | | | |
| Interest paid | | $ | 77,851,327 | | $ | 59,715,354 | | $ | 30,334,188 | |
| Income taxes paid | | $ | 16,794,837 | | $ | 23,387,321 | | $ | 19,290,905 | |
| | | | | | | | | | | |
| SUPPLEMENTAL SCHEDULE OF NONCASH INVESTING ACTIVITIES: | | | | | | | | | | |
| Other assets transferred to Bank premises | | | | | | | | | | |
| and equipment | | $ | 120,198 | | $ | 755,227 | | $ | 91,022 | |
| Loans transferred to real estate owned | | $ | 1,391,200 | | $ | - | | $ | 602,600 | |
| Issuance of common stock pursuant to | | | | | | | | | | |
| acquisition of Liberty Bank (Note 13) | | $ | - | | $ | 5,936,593 | | $ | - | |
| Change in net unrealized gain (loss) on securities | | | | | | | | | | |
| available for sale, net of income tax expense (benefit) | | $ | 665,222 | | $ | 552,862 | | $ | (794,001 | ) |
| | | | | | | | | | | |
| SUPPLEMENTAL SCHEDULE OF NONCASH FINANCING ACTIVITIES: | | | | | | | | | | |
| Cash dividend declared, but not paid | | $ | 1,462,666 | | $ | 1,459,871 | | $ | 1,145,224 | |
| | | | | | | | | | | |
| See accompanying notes to consolidated financial statements. | | | | | | | | | (Concluded | ) |
WILSHIRE BANCORP, INC.
NOTES TO CONSOLIDATED FINANCIAL STATEMENTS
FOR EACH OF THE THREE YEARS IN THE PERIOD ENDED DECEMBER 31, 2007
1. | SUMMARY OF SIGNIFICANT ACCOUNTING POLICIES |
Wilshire Bancorp, Inc. (the “Company” or “We”) succeeded to the business and operations of Wilshire State Bank, a California state-chartered commercial bank (the “Bank”), upon consummation of the reorganization of the Bank into a holding company structure, effective as of August 25, 2004. Wilshire State Bank was incorporated under the laws of the State of California on May 20, 1980 and commenced operations on December 30, 1980. The Company was incorporated in December 2003 as a wholly owned subsidiary of the Bank for the purpose of facilitating the issuance of trust preferred securities for the Bank and eventually serving as the holding company of the Bank. The Bank’s shareholders approved reorganization into a holding company structure at a meeting held on August 25, 2004. As a result of the reorganization, shareholders of the Bank are now shareholders of the Company and the Bank is a direct subsidiary of the Company. The Bank’s primary source of revenue is from providing financing for business working capital, commercial real estate, and trade activities, and its investment portfolio. The accounting and reporting policies of the Bank are in accordance with accounting principles generally accepted in the United States of America and conform to general practices in the banking industry.
The Company organized its wholly owned subsidiaries, Wilshire Statutory Trust I, Wilshire Statutory Trust II, Wilshire Statutory Trust III, and Wilshire Statutory Trust IV (collectively “Wilshire Statutory Trusts”), which issued $75 million in trust preferred securities in the past four years. The Company then purchased all of the common interest in the Wilshire Statutory Trusts and issued junior subordinated debentures to the Wilshire Statutory Trusts having terms substantially similar to the trust preferred securities in exchange for the proceeds from the Wilshire Statutory Trust’s trust preferred securities (the “2003 Junior Subordinated Debentures”, “2005 Junior Subordinated Debentures”, “2006 Junior Subordinated Debentures”, and “2007 Junior Subordinated Debentures”). In accordance with Financial Accounting Standards Board (“FASB”) Interpretation 46R (“FIN 46R”), the Wilshire Statutory Trusts are not being reported on a consolidated basis; instead the junior subordinated debentures to the Wilshire Statutory Trusts of $77,321,000 are recorded separately as liabilities, and the investment in the Wilshire Statutory Trusts common stock of $2,321,000 is reported in other assets in the accompanying consolidated statements of financial condition. (See Note 9)
Principles of Consolidation - The consolidated financial statements include the accounts of the Company and its subsidiary, Wilshire State Bank. Inter-company transactions and accounts have been eliminated in consolidation. As noted above in accordance with FIN 46R, the Company does not include Wilshire Statutory Trusts on a consolidated basis.
Cash and Cash Equivalents - Cash and cash equivalents include cash and due from banks, term and overnight federal funds sold and securities purchased under agreements to resell, all of which have original maturities of less than 90 days.
Investment Securities - Investments are classified into three categories and accounted for as follows:
| (i) | Securities that the Company has the positive intent and ability to hold to maturity are classified as “held to maturity” and reported at amortized cost; |
| (ii) | Securities that are bought and held principally for the purpose of selling them in the near future are classified as “trading securities” and reported at fair value. Unrealized gains and losses are recognized in earnings; and |
| (iii) | Securities not classified as held to maturity or trading securities are classified as “available for sale” and reported at fair value. Unrealized gains and losses are reported, net of taxes, as a separate component of accumulated other comprehensive income (loss) in shareholders’ equity. |
Accreted discounts and amortized premiums on investment securities are included in interest income by the interest method, and unrealized and realized gains or losses related to holding or selling securities are calculated using the specific-identification method. Declines in the fair value of held-to-maturity and available-for-sale securities below their cost that are deemed to be other than temporary are reflected in earnings as realized losses in the consolidated statements of operations. The Company did not record any other-than-temporary impairment on investment securities in 2007, 2006 and 2005.
In 2007, 2006 and 2005, the Company recognized an other-than-temporary charge of $0, $88,020 and $97,305, respectively on its interest-only (“I/O”) strip related to Small Business Administration (“SBA”) loans sold, which were included as a component of non-interest expense. The I/O strips are accounted for like available-for-sale securities; impairment charges reduce the cost basis of the I/O strips and reduce earnings.
Loans - Loans that management has the intent and ability to hold for the foreseeable future or until maturity or pay-off generally are reported at their outstanding unpaid principal balances adjusted for charge-offs, the allowance for loan losses and any deferred fees or costs on originated loans.
Interest on loans is credited to income as earned and is accrued only if deemed collectible. Accrual of interest is discontinued when a loan is over 90 days delinquent unless management believes the loan is adequately collateralized and in the process of collection. Generally, payments received on nonaccrual loans are recorded as principal reductions. Interest income is recognized after all principal has been repaid or an improvement in the condition of the loan has occurred that would warrant resumption of interest accruals.
Nonrefundable fees, net of incremental costs, associated with the origination or acquisition of loans are deferred and recognized as an adjustment of the loan yield over the lives of the loans using the interest method. Other loan fees and charges, representing service costs for the prepayment of loans, for delinquent payments, or for miscellaneous loan services, are recorded as income when collected.
Certain SBA loans that may be sold prior to maturity have been designated as held for sale at origination and are recorded at the lower of cost or market value, determined on an aggregate basis. A valuation allowance is established if the market value of such loans is lower than their cost, and operations are charged or credited for valuation adjustments. The premium on the pro-rata principal of SBA loans sold is recognized as gain on sale of loan at the time of the sale. The remaining portion of the premium related to the unsold principal of the SBA loans, is presented as unearned income in Note 3, is deferred and amortized over the remaining life of the loan as an adjustment to yield. Upon sales of such loans, the Company receives a fee for servicing the loans. A servicing asset is recorded based on the present value of the contractually specified servicing fee, net of servicing cost, over the estimated life of the loan, with an average discount rate and a range of constant prepayment rates of the related loans. The servicing asset is amortized in proportion to and over the period of estimated servicing income. For purposes of measuring impairment, the servicing assets are stratified by collateral types. Prior to December 31, 2006, the Company periodically evaluates the fair value of servicing assets for impairment. A valuation allowance was recorded when the fair value was below the carrying amount and a recovery of the valuation allowance was recorded when its fair value exceeded the carrying amount. However, a reversal could not exceed the original valuation allowance recorded. On January 1, 2007, we adopted Statement of Financial Accounting Standards (SFAS) No. 156, Accounting for Servicing of Financial Assets, and selected a fair value measurement method to measure our servicing assets and liabilities and recognized the net increase in their fair value of $80,000, net of tax effects as a credit to retained earnings. Any subsequent increase or decrease in fair value of servicing assets and liabilities is to be included in our current earnings in the statement of operations (see Note 4).
An interest-only strip or I/O strip is recorded based on the present value of the excess of future interest income, generally amounts in excess of 1.00%, over the contractually specified servicing fee, calculated using the same assumptions as noted above. I/O strips are accounted for at their estimated fair value, with unrealized gains recorded as an adjustment in accumulated other comprehensive income in shareholders’ equity. If the estimated fair value is less than its carrying value, the loss is considered as other-than-temporary impairment and it is charged to the current earnings. I/O strips are amortized over the remaining life of the loan as an adjustment to yield and monitored for impairment.
Allowance for Loan Losses - Accounting for the allowance for loan losses involves significant judgment and assumptions by management and is based on historical data and management’s view of the current economic environment. At least on a quarterly basis, management reviews the methodology and adequacy of the allowance for loan losses and reports its assessment to the Board of Directors for its review and approval.
We base our allowance for loan losses on an estimation of probable losses inherent in our loan portfolio. Our methodology for assessing loan loss allowances is intended to reduce the differences between estimated and actual losses and involves a detailed analysis of our loan portfolio in three phases:
| · | the specific review of individual loans in accordance with SFAS No. 114, Accounting by Creditors for Impairment of a Loan, |
| · | the segmenting and reviewing of loan pools with similar characteristics in accordance with SFAS No. 5, Accounting for Contingencies, and |
| · | a judgmental estimate based on various qualitative factors. |
The first phase of our allowance analysis involves the specific review of individual loans to identify and measure impairment. At this phase, we evaluate each loan except for homogeneous loans, such as automobile loans and home mortgages. Specific risk-rated loans are deemed impaired with respect to all amounts, including principal and interest, which will likely not be collected in accordance with the contractual terms of the related loan agreement. Impairment for commercial and real estate loans is measured either based on the present value of the loan’s expected future cash flows or, if collection on the loan is collateral dependent, the estimated fair value of the collateral, less selling and holding costs.
The second phase involves segmenting the remainder of the risk-rated loan portfolio into groups or pools of loans, together with loans with similar characteristics for evaluation in accordance with SFAS No. 5. We perform loss migration analysis and calculate the loss migration ratio for each loan pool based on its historical net losses and benchmark it against the levels of other peer banks.
In the third phase, we consider relevant internal and external factors that may affect the collectability of a loan portfolio and each group of loan pools. As a general rule, the factors detailed below will be considered to have no impact to our loss migration analysis. However, if there exists information to warrant adjustment to the loss migration ratios, the changes will be made in accordance with the established parameters and supported by narrative and/or statistical analysis. We use a credit risk matrix to determine the impact to the loss migration analysis. This matrix enables management to adjust the general allocation based on the loss migration ratio. The factors currently considered are, but are not limited to, described below. For all factors, the extent of the adjustment will be commensurate with the severity of the conditions that concern each factor.
Concentration of Credit: This factor may be adjusted based on the identification of any concentration or significant changes to the level of identified concentrations of credit. A concentration of credit is defined as loans to any single borrower, affiliated group of borrowers, or borrowers engaged in or dependent upon one industry that exceeds 25% of Tier 1 Capital & Reserves. A concentration can also result from an acquisition of a volume of loans from a single source, regardless of the diversity of the individual borrowers.
Delinquency Trend: The trend of delinquency shall be assessed by the quarterly trend and the comparison with peer average.
Nature and Volume of Loan Trend: This factor will be adjusted for significant changes in the nature and volume of the loan portfolio.
Non-Accrual Loan Trend: The trend of non-accrual loans shall be assessed by the quarterly trend and the comparison with peer average.
Problem Loan Trend: This factor may be adjusted depending on the quarterly trend of criticized and classified loans in the total loans.
Loss and Recovery Trend: This factor may be adjusted depending on the quarterly trend of the net charge-offs and the comparison with peers.
Quality of Loan Review: This factor may be adjusted when there has been a noted and significant (as determined and documented from external or internal sources) deterioration or improvement in the loan review system and/or Director’s oversight. An adjustment will generally occur when there had previously been a documented weakness and clear improvement was noted by external sources, or when a significant deterioration was noted by external sources, in the loan review system and/or the degree of oversight by the Directors. In the absence of noted changes to the loan review system and/or the degree of oversight by the Directors, no adjustment will be made.
Lending and Management Staff: This factor will be adjusted with changes to the experience, ability, and depth of lending management and staff that are significant enough to warrant adjustment to the loss migration ratio. If the staffing or the experience level of lending staff is considered to be adequate (as determined by an external source) then, in general, no adjustment will be made.
Lending Policies and Procedures: This factor may be adjusted depending on the documented results of external reviews of the policies and procedures, including underwriting standards and collection, charge-off, and recovery practices. The trend of policy or procedure exceptions will also have an impact on this factor. It is the objective of the Directors and Management to maintain at all times adequate policies, procedures, underwriting standards, and practices.
Economic and Business Conditions: This factor may be adjusted depending on local, regional, and national economic trends and their perceived impact on particular market segments. In the periods of stable economic environment, no adjustment will be made.
External Factors such as changes in legal and regulatory requirements, on the level of estimated credit losses in the current portfolio: This factor may be adjusted depending on the trend of external factors and their perceived impact on the overall credit risk. In the periods of stable regulatory environment, no adjustment will be made.
Other adjustments: With a supporting rationale, this factor may be used for adjustments which cannot be addressed by the foregoing factors.
Bank Premises and Equipment - Bank premises and equipment are stated at cost less accumulated depreciation and amortization. Depreciation on building, furniture, fixtures and equipment is computed on the straight-line method over the estimated useful lives of the related assets, which range from 3 to 30 years. Leasehold improvements are capitalized and amortized on the straight-line method over the term of the lease or the estimated useful lives of the improvements, whichever is shorter.
Affordable Housing Investments - The Company has invested in limited partnerships formed to develop and operate affordable housing units for lower income tenants throughout the states of California, Texas, and New York. The investments are accounted for using the equity method of accounting, as the Company has significant influence or has a limited partnership interest that exceeds 5%. The costs of the investments are being amortized on a straight line method over the life of related tax credits. If the partnerships cease to qualify during the compliance period, the credits may be denied for any period in which the projects are not in compliance and a portion of the credits previously taken is subject to recapture with interest. Such investments are recorded in other assets in the accompanying consolidated statements of financial condition.
Goodwill and Other Intangible Assets - The Company recognized goodwill and intangible assets in connection with the acquisition of Liberty Bank of New York (see Note 13). In accordance with SFAS No. 142, Goodwill and Other Intangible Assets, goodwill will no longer be amortized, but rather be subject to impairment testing at least annually. In addition, recognized intangible assets are amortized to expense over the projected useful lives and are reviewed for impairment whenever events or changes in circumstances indicate that the carrying amount of the asset may not be recoverable. The Company tested goodwill and intangible assets for impairment as of December 31, 2007. There was no impairment in recorded goodwill and intangible assets as of December 31, 2007 (see Note 14).
Other Real Estate Owned - Other real estate owned, which represents real estate acquired through foreclosure in satisfaction of commercial and real estate loans, is stated at fair value less estimated selling costs of the real estate. Loan balances in excess of the fair value of the real estate acquired at the date of acquisition are charged to the allowance for loan losses.
Any subsequent operating expenses or income, reduction in estimated fair values, and gains or losses on disposition of such properties are charged or credited to current operations.
Impairment of Long-Lived Assets - The Company reviews its long-lived assets for impairment annually or when events or circumstances indicate that the carrying amount of these assets may not be recoverable. An asset is considered impaired when the expected undiscounted cash flows over the remaining useful life are less than the net book value. When impairment is indicated for an asset, the amount of impairment loss is the excess of the net book value over its fair value.
Income Taxes - We account for income taxes under the asset and liability method, which requires the recognition of deferred tax assets and liabilities for the expected future tax consequences of events that have been included in the financial statements. Under this method, deferred tax assets and liabilities are determined based on the differences between the financial statements and tax basis of assets and liabilities using enacted tax rates in effect for the year in which the differences are expected to reverse. The effect of a change in tax rates on deferred tax rates on deferred tax assets and liabilities is recognized in income in the period that includes the enacted date.
We recorded net tax assets to the extent we believe these assets will more likely than not be realized. In making such determination, we consider all available positive and negative evidence, including scheduled reversals of deferred tax liabilities, projected future taxable income, tax planning strategies and recent financial operations. In the event we were to determine that we would be able to realize our deferred income tax assets in the future in excess of their net recorded amount, we would make an adjustment to the valuation allowance which would reduce the provision for income taxes.
In July 2006, the FASB issued Financial Interpretation No. (“FIN”) 48, Accounting for Uncertainty in Income Taxes, which clarifies the accounting for uncertainty in income taxes recognized in the financial statements in accordance with SFAS No. 109, Accounting for Income Taxes. FIN 48 provides that a tax benefit from an uncertain tax position may be recognized when it is more likely than not that the position will be sustained upon examination, including resolutions of any related appeals or litigation processes, based on the technical merits. Income tax positions must meet a more-likely-than-not recognition threshold at the effective date to be recognized upon the adoption of FIN 48 and in subsequent periods. This interpretation also provides guidance on measurement, derecognition, classification, interest and penalties, accounting in interim periods, disclosure and transition. FIN 48 is effective for fiscal years beginning after December 15, 2006.
The Company adopted the provision of FIN 48 on January 1, 2007. As a result of the implementation of the Interpretation, the Company recognized approximately a $162,000 increase in the liability for unrecognized tax benefits and related interest, which was accounted for as a reduction to the January 1, 2007, balance of retained earning (see Note 12).
Earnings per Share - Basic earnings per share (“EPS”) exclude dilution and are computed by dividing earnings available to common shareholders by the weighted-average number of common shares outstanding for the period. Diluted EPS reflects the potential dilution that could occur if securities or other contracts to issue common stock were exercised or converted into common stock or resulted in the issuance of common stock that would then share in the earnings of the Company.
Repurchase of Common Stock - The Company’s board of directors authorized a stock repurchase program on July 26, 2007 for repurchases of up to $10 million outstanding common shares by July 31, 2008. Management was granted discretion on the purchase decisions under the general guidelines of the program. The Company used the cost method of accounting for treasury stock. The cost method requires it to record the reacquisition cost of treasury stock as a deduction from shareholders’ equity on the Consolidated Statements of Financial Condition (see Note 11).
Stock-Based Compensation - The Company issued stock-based compensation to certain employees, officers, and directors. Prior to December 31, 2005, the Company accounted for its fixed stock options using the intrinsic-value method, presented in APB Opinion No. 25, Accounting for Stock Issued to Employees, and its related interpretations, which generally does not result in compensation expense recognition. Under the intrinsic value method, compensation cost for stock options is measured at the date of grant as the excess, if any, of the quoted market price of our stock over the exercise price of the options. On January 1, 2006, the Company adopted SFAS 123R, Share-Based Payment, for stock based compensation. SFAS No. 123R allows for two alternative transition methods. The Company follows the modified prospective method, which requires application of the new Statement to new awards and to awards modified, repurchased or cancelled after the required effective date. Accordingly, prior period amounts have not been restated. Additionally, compensation cost for the portion of awards for which the requisite service has not been rendered that are outstanding as of January 1, 2006 are recognized as the requisite services are rendered on or after January 1, 2006. The compensation cost of that portion of awards is based on the grant-date fair value of those awards as calculated for pro forma disclosures under the original SFAS No. 123 (see Note 10).
Use of Estimates in the Preparation of Financial Statements - The preparation of financial statements in conformity with accounting principles generally accepted in the United States of America requires management to make estimates and assumptions that affect the reported amounts of assets and liabilities and disclosure of contingent assets and liabilities at the date of the financial statements and the reported amounts of revenues and expenses during the reporting period. Actual results could differ from those estimates.
Recent Accounting Pronouncements - In September 2006, the FASB Emerging Issues Task Force (EITF) issued EIFT 06-4, Accounting for Deferred Compensation and Postretirement Benefit Aspects of Endorsement Split-Dollar Life Insurance Arrangements, which requires that an employer to recognize obligations associated with endorsement split-dollar life insurance arrangements that extend into the participant’s postretirement period. The required accrued liability will be based on either the post-employment benefit cost for the continuing life insurance or based on the future death benefit depending on the contractual terms of the underlying agreement. EIFT 06-4 is effective as of the beginning of an entity’s first fiscal year after December 15, 2007. The Company adopted EITF 06-4 on January 1, 2008 using the later option, i.e., based on the future death benefit. The Company is in the process of evaluating the impact of this adoption on the consolidated financial statements.
In September 2006, the FASB issued SFAS No. 157, Fair Value Measurements, which provides a definition of fair value, establishes a framework for measuring fair value, and requires expanded disclosures about fair value measurements. The standard applies when the accounting principles generally accepted in the United States of America (“GAAP”) requires or allows assets or liabilities to be measured at fair value, and therefore, does not expand the use of fair value in any new circumstance. SFAS No. 157 defines fair value as the price that would be received to sell an asset or paid to transfer a liability in an arm’s length transaction between market participants in the markets where we conduct business. SFAS No. 157 clarifies that fair value should be based on the assumptions market participants would use when pricing an asset or liability and establishes a fair value hierarchy that prioritizes the information used to develop those assumptions. The fair value hierarchy gives the highest priority to quoted prices available in active markets and the lowest priority to data lacking transparency. The level of the reliability of inputs utilized for fair value calculations drives the extent of disclosure requirements of the valuation methodologies used under the standard. SFAS No. 157 is effective for financial statements issued for fiscal years beginning after November 15, 2007, and interim periods within those years. The provisions of SFAS No. 157 should be applied prospectively, except for certain financial instruments for which the standard should be applied retrospectively. The Company is in the process of evaluating the impact of this adoption on the consolidated financial statements.
In February 2007, the FASB issued SFAS No. 159, The Fair Value Option for Financial Assets and Financial Liabilities, which permits all entities to choose to measure eligible items at fair value at specified election dates. A business entity shall report unrealized gains and losses on items for which the fair value option has been elected in earnings at each subsequent reporting date. SFAS No. 159 is effective as of the beginning of an entity’s first fiscal year after November 15, 2007. The Company is in the process of evaluating the impact of this adoption on the consolidated financial statements.
At the June 14, 2007 EITF meeting, the SEC staff announced revisions to EITF D-98 related to the release of SFAS No. 159. The SEC staff announced that it will no longer accept liability classification for financial instruments that meet the conditions for temporary equity classification under ASR 268, Presentation in Financial Statements of “Redeemable Preferred Stocks” and EITF D-98. As a consequence, the fair value option under SFAS No.159 may not be applied to any financial instrument (or host contract) that qualifies as temporary equity. Registrants that do not choose retrospective application should apply the announcement prospectively to all affected instruments that are entered into, modified, or otherwise subject to remeasurement event in the registrant’s first fiscal quarter beginning after September 15, 2007. The Company does not expect this adoption would have a material impact on the consolidated financial statements or results of operations of the Company.
In November 2007, EITF Issued EITF 07-6, Accounting for Sale of Real Estate Subject to the Requirements of FASB Statement No. 66, Accounting for Sale of Real Estate, When the Agreement Includes a Buy-Sell Clause. The Task Force reached a consensus that a buy-sell clause in a sale of real estate that otherwise qualifies for partial sale accounting does not by itself constitute a form of continuing involvement that would preclude partial sale accounting under SFAS No. 66, Accounting for Sale of Real Estate. However, continuing involvement could be present if the buy-sell clause is in conjunction with other implicit and explicit terms of the arrangement indicate that the seller has an obligation to repurchase the property, the terms of the transaction allow the buyer to compel the seller to repurchase the property, or the seller can compel the buyer to sell its interest in the property back to the seller. The consensus is effective for fiscal years beginning after December 15, 2007. The consensus applies to new assessments made under SFAS No. 66 after the consensus’ effective date. The Company does not expect the adoption of EITF No. 07-6 to have any material impact on the consolidated financial statements or results of operations of the Company.
In November 2007, the SEC issued Staff Accounting Bulletin (SAB) No. 109, Written Loan Commitments Recorded at Fair Value through Earnings, which superseded SAB No. 105, Application of Accounting Principles to Loan Commitments. SAB No. 109 indicates that the expected net future cash flows related to the associated servicing of the loan should be included in measuring fair value for all written loan fair value for all written loan commitments that are accounted for at fair value through earnings. The bulletin retains the view of SAB No. 105 about recording the internally developed intangible assets as part of the fair value of a derivative loan commitment. SAB No. 109 is effective for derivative loan commitments issued or modified in fiscal years beginning after December 15, 2007. The Company does not expect the adoption of SAB No. 109 to have a material impact on the consolidated financial statements or results of operations of the Company.
In December 2007, the FASB issued SFAS No. 141R, Business Combinations. This new statement revises SFAS No. 141, which was issued June 2001. SFAS No. 141R changes multiple aspects of the accounting for business combinations. Under the guidance in SFAS No. 141R, the acquisition method must be used, which requires the acquirer to recognize most identifiable assets acquired, liabilities assumed and non-controlling interests in the acquiree at their full fair value on the acquisition date. Goodwill is to be recognized as the excess of the consideration transferred plus the fair value of the non-controlling interest over the fair values of the identifiable net assets acquired. Subsequent changes in the fair value of contingent consideration classified as a liability are to be recognized in earnings, while contingent consideration classified as equity is not to be remeasured. Costs such as transaction costs are to be excluded from acquisition accounting, generally leading to recognizing expense and additionally, restructuring costs that do not meet certain criteria at the acquisition date are to be subsequently recognized as post-acquisition costs. SFAS No. 141R is effective for business combinations for which the acquisition date is on or after the beginning of the first annual reporting period beginning on or after December 15, 2008. The Company is currently assessing the impact that the adoption of SFAS No. 141R will have on its consolidated financial statements.
In December 2007, the FASB issued SFAS No. 160, Noncontrolling Interests in Consolidated Financial Statements, which amends Accounting Research Bulletin (“ARB”) No. 51, Consolidated Financial Statements. SFAS No. 160 requires a non-controlling interest or minority interest to be reported by all entities in the same way, which is as equity in the consolidated financial statements. It also requires income attributable to the non-controlling interest to be disclosed on the face of the consolidated statement of income. Furthermore, SFAS No. 160 eliminates the diversity that currently exists in accounting for transactions between an entity and non-controlling interests by requiring they be treated as equity transactions. SFAS No. 160 is effective for financial statements issued for fiscal years beginning on or after December 15, 2008, and interim periods within those years. Early adoption is prohibited. The provisions of SFAS No. 160 should be applied prospectively, except for presentation and disclosure requirements. The presentation and disclosure requirements should be applied retrospectively for all periods presented. The Company is currently assessing the impact that the adoption of SFAS No. 160 will have on its consolidated financial statements.
The following is a summary of the investment securities at December 31:
| | | | | Gross | | Gross | | Estimated | |
| | Amortized | | Unrealized | | Unrealized | | Fair | |
2007 | | Cost | | Gain | | Loss | | Value | |
| | | | | | | | | | |
| Available for sale: | | | | | | | | | |
| Securities of government | | | | | | | | | |
| sponsored enterprises | | $ | 64,931,905 | | $ | 250,005 | | $ | 7,000 | | $ | 65,174,910 | |
| Corporate securities | | | 17,390,014 | | | 110,719 | | | 17,482 | | | 17,483,251 | |
| Collateralized mortgage obligations | | | 73,415,996 | | | 304,845 | | | 434,620 | | | 73,286,221 | |
| Mortgage-backed securities | | | 60,470,137 | | | 149,507 | | | 62,468 | | | 60,557,176 | |
| Municipal bonds | | | 7,725,271 | | | 43,287 | | | 14,473 | | | 7,754,085 | |
| | | | | | | | | | | | | | |
| Total | | $ | 223,933,323 | | $ | 858,363 | | $ | 536,043 | | $ | 224,255,643 | |
| | | | | | | | | | | | | | |
| Held to maturity: | | | | | | | | | | | | | |
| Securities of government | | | | | | | | | | | | | |
| sponsored enterprises | | $ | 7,000,000 | | $ | 820 | | $ | - | | $ | 7,000,820 | |
| Collateralized mortgage obligations | | | 163,862 | | | - | | | 12,713 | | | 151,149 | |
| Municipal bonds | | | 220,000 | | | - | | | 334 | | | 219,666 | |
| | | | | | | | | | | | | | |
| Total | | $ | 7,383,862 | | $ | 820 | | $ | 13,047 | | $ | 7,371,635 | |
| | | Amortized | | Unrealized | | Unrealized | | Fair | |
2006 | | Cost | | Gain | | Loss | | Value | |
| | | | | | | | | | |
| Available for sale: | | | | | | | | | |
| Securities of government | | | | | | | | | |
| sponsored enterprises | | $ | 87,808,911 | | $ | 68,017 | | $ | 366,377 | | $ | 87,510,551 | |
| Corporate securities | | | 13,444,985 | | | 10,491 | | | 68,106 | | | 13,387,370 | |
| Collateralized mortgage obligations | | | 38,650,218 | | | 9,412 | | | 399,880 | | | 38,259,750 | |
| Mortgage-backed securities | | | 21,032,910 | | | 92,312 | | | 208,640 | | | 20,916,582 | |
| Municipal bonds | | | 7,725,333 | | | 66,006 | | | 27,858 | | | 7,763,481 | |
| | | | | | | | | | | | | | |
| Total | | $ | 168,662,357 | | $ | 246,238 | | $ | 1,070,861 | | $ | 167,837,734 | |
| | | | | | | | | | | | | | |
| Held to maturity: | | | | | | | | | | | | | |
| Securities of government | | | | | | | | | | | | | |
| sponsored enterprises | | $ | 14,000,000 | | $ | - | | $ | 154,880 | | $ | 13,845,120 | |
| Collateralized mortgage obligations | | | 195,870 | | | - | | | 14,553 | | | 181,317 | |
| Municipal bonds | | | 425,000 | | | - | | | 5,723 | | | 419,277 | |
| | | | | | | | | | | | | | |
| Total | | $ | 14,620,870 | | $ | - | | $ | 175,156 | | $ | 14,445,714 | |
Accrued interest and dividends receivable on investment securities totaled $1,492,221 and $1,357,118 at December 31, 2007 and 2006, respectively.
The following tables show investments’ gross unrealized losses and fair value, aggregated by investment category and length of time that individual securities have been in a continuous unrealized loss position, at December 31 (dollars in thousands):
| 2007 | | Less than 12 months | | 12 months or longer | | Total | |
| | | | | Gross | | | | Gross | | | | Gross | |
| | | | | Unrealized | | | | Unrealized | | | | Unrealized | |
| DESCRIPTION OF SECURITIES | | Fair Value | | Losses | | Fair Value | | Losses | | Fair Value | | Losses | |
| | | | | | | | | | | | | | |
| Securities of government sponsored enterprises | | $ | - | | $ | - | | $ | 4,993 | | $ | (7 | ) | $ | 4,993 | | $ | (7 | ) |
| Collateralized mortgage obligations | | | 1,749 | | | (11 | ) | | 9,266 | | | (436 | ) | | 11,015 | | | (447 | ) |
| Mortgage-backed securities | | | 37,967 | | | (36 | ) | | 2,545 | | | (27 | ) | | 40,512 | | | (63 | ) |
| Municipal securities | | | 1,392 | | | (13 | ) | | 2,347 | | | (2 | ) | | 3,739 | | | (15 | ) |
| Corporate securities | | | 4,972 | | | (1 | ) | | 1,983 | | | (16 | ) | | 6,955 | | | (17 | ) |
| | | $ | 46,080 | | $ | (61 | ) | $ | 21,134 | | $ | (488 | ) | $ | 67,214 | | $ | (549 | ) |
| 2006 | | Less than 12 months | | 12 months or longer | | Total | |
| | | | | Gross | | | | Gross | | | | Gross | |
| | | | | Unrealized | | | | Unrealized | | | | Unrealized | |
| DESCRIPTION OF SECURITIES | | Fair Value | | Losses | | Fair Value | | Losses | | Fair Value | | Losses | |
| | | | | | | | | | | | | | |
| Securities of government sponsored enterprises | | $ | 17,972 | | $ | (24 | ) | $ | 64,484 | | $ | (497 | ) | $ | 82,456 | | $ | (521 | ) |
| Collateralized mortgage obligations | | | 12,066 | | | (31 | ) | | 17,455 | | | (383 | ) | | 29,521 | | | (414 | ) |
| Mortgage-backed securities | | | 1,740 | | | (5 | ) | | 10,834 | | | (204 | ) | | 12,574 | | | (209 | ) |
| Municipal securities | | | - | | | - | | | 3,802 | | | (34 | ) | | 3,802 | | | (34 | ) |
| Corporate securities | | | - | | | - | | | 2,929 | | | (68 | ) | | 2,929 | | | (68 | ) |
| | | $ | 31,778 | | $ | (60 | ) | $ | 99,504 | | $ | (1,186 | ) | $ | 131,282 | | $ | (1,246 | ) |
The Company does not believe that any individual unrealized loss as of December 31, 2007 and 2006 represents an other-than-temporary impairment. The unrealized losses on our government sponsored enterprises (“GSE”) bonds, collateralized mortgage obligations (“CMOs”), and mortgage-backed securities (“MBS”) are attributable to both changes in interest rates and a repricing risk in the market. All GSE bonds, GSE CMO, and GSE MBS securities are backed by U.S. Government Sponsored and Federal Agencies and therefore rated “AAA.” The Company has no exposure to the “Subprime Market” in the form of Asset Backed Securities (“ABS”) and Collateralized Debt Obligations (“CDOs”) that had previously been rated “AAA” but has since been downgraded to below investment grade. The Company has the intent and ability to hold the securities in an unrealized loss position at December 31, 2007 and 2006 until the market value recovers or the securities mature.
Municipal bonds and corporate bonds are evaluated by reviewing the credit-worthiness of the issuer and general market conditions. The unrealized losses on our investment in municipal and corporate securities were primarily attributable to both changes in interest rates and a repricing risk in the market. The Company has the intent and ability to hold the securities in an unrealized loss position at December 31, 2007 and 2006 until the market value recovers or the securities mature.
The amortized cost and estimated fair value of investment securities at December 31, 2007, by contractual maturity, are shown below.
| | | Amortized | | Estimated | |
| | | Cost | | Fair Value | |
| Available for sale: | | | | | |
| Due in one year or less | | $ | 22,006,330 | | $ | 22,027,278 | |
| Due after one year through five years | | | 50,327,391 | | | 50,624,015 | |
| Due after five years through ten years | | | 28,814,100 | | | 28,894,504 | |
| Due after ten years | | | 122,785,502 | | | 122,709,846 | |
| Total | | $ | 223,933,323 | | $ | 224,255,643 | |
| | | | | | | | |
| Held to maturity: | | | | | | | |
| Due in one year or less | | $ | 220,000 | | $ | 219,666 | |
| Due after one year through five years | | | 1,000,000 | | | 1,000,000 | |
| Due after five years through ten years | | | 4,000,000 | | | 4,000,820 | |
| Due after ten years | | | 2,163,862 | | | 2,151,149 | |
| Total | | $ | 7,383,862 | | $ | 7,371,635 | |
Securities with amortized cost of approximately $208,533,594 and $159,458,786 were pledged to secure public deposits and for other purposes as required or permitted by law at December 31, 2007 and 2006, respectively. There were no sale transactions of securities available for sale in 2007 and 2006. There were four transactions of called securities available for sale in 2007, while one transaction in 2006. The Company recognized realized gains of $42,453 and realized losses of $2,023 from such transactions in 2007 and 2006, respectively. There were no sale or call transactions of securities available for sale in 2005.
3. | LOANS RECEIVABLE, LOANS HELD FOR SALE, AND ALLOWANCE FOR LOAN LOSSES |
The following is a summary of loans as of December 31:
| | | 2007 | | 2006 | |
| | | Loans held for sale | | Loans receivable | | Loans held for sale | | Loans receivable | |
| Commercial loans | | $ | 2,996,993 | | $ | 332,335,536 | | $ | 2,184,070 | | $ | 283,782,964 | |
| Real estate loans | | | 4,915,291 | | | 1,441,149,220 | | | 3,312,351 | | | 1,227,250,895 | |
| Installment loans | | | - | | | 33,569,318 | | | - | | | 53,059,374 | |
| | | | 7,912,284 | | | 1,807,054,074 | | | 5,496,421 | | | 1,564,093,233 | |
| Allowance for loan losses | | | - | | | (21,579,403 | ) | | - | | | (18,654,082 | ) |
| Deferred loan fees | | | - | | | (787,723 | ) | | - | | | (1,541,670 | ) |
| Unearned income | | | - | | | (5,128,706 | ) | | - | | | (7,508,666 | ) |
| Net loans | | $ | 7,912,284 | | $ | 1,779,558,242 | | $ | 5,496,421 | | $ | 1,536,388,815 | |
At December 31, 2007, 2006 and 2005, the Company serviced loans sold to unaffiliated parties in the amounts of $338,166,280, $340,573,281, and $273,875,923, respectively.
The maturity or repricing distribution of the loan portfolio as of December 31, 2007 is as follows:
| | | Loans Held for Sale | | Loans Receivable | | Total Loans | |
| Less than one year | | $ | 7,552,284 | | $ | 1,223,064,948 | | $ | 1,230,617,232 | |
| One to five years | | | - | | | 497,925,336 | | | 497,925,336 | |
| After five years | | | 360,000 | | | 71,345,690 | | | 71,705,690 | |
| Total gross loans | | $ | 7,912,284 | | $ | 1,792,335,974 | | $ | 1,800,248,258 | |
The rate composition of the loan portfolio as of December 31, 2007 is as follows:
| | | Loans Held for Sale | | Loans Receivable | | Total Loans | |
| Fixed rate loans | | $ | 360,000 | | $ | 623,959,883 | | $ | 624,319,883 | |
| Variable rate loans | | | 7,552,284 | | | 1,168,376,091 | | | 1,175,928,375 | |
| Total gross loans | | $ | 7,912,284 | | $ | 1,792,335,974 | | $ | 1,800,248,258 | |
The amounts on the tables above are the gross loan balance at December 31, 2007 before netting unearned income totaling $5.9 million, and the gross amount of non-accrual loans approximately of $14.7 million is not included.
As of December 31, 2007 and 2006, the government guaranteed portion of total gross loans was $33.1 million and $30.7 million, respectively.
Management believes that as of December 31, 2007 and 2006, the allowance for loan losses is adequate to provide for losses inherent in the loan portfolio; however, the allowance is an estimate that is inherently uncertain and depends on the outcome of future events. Management’s estimates are based on previous loan loss experience; volume, growth and composition of the loan portfolio; the value of collateral; and current economic conditions.
In 2006, the Company enhanced the methodology for estimating the allowance for loan losses. The Company shortened its lookback period to a 5 year moving average, which better approximates the average life of the loans in its portfolio, and modified some of the qualitative adjustment factors after evaluating the current economic conditions. As of December 31, 2007, such enhanced credit policy was strictly enforced and followed.
The Company evaluates credit risks associated with the commitments to extend credit and letters of credit at the same time it evaluates credit risk associated with the loan portfolio. However, the allowances necessary for the commitments are reported separately in other liabilities in the accompanying statements of financial condition and are not part of the allowance for loan losses as presented above.
The activity in the allowance for loan losses was as follows for the years ended December 31:
| | | 2007 | | 2006 | | 2005 | |
| Balance—beginning of year | | $ | 18,654,082 | | $ | 13,999,302 | | $ | 11,111,092 | |
| Provision for loan losses | | | 13,873,088 | | | 5,896,142 | | | 3,212,631 | |
| Loans charged off | | | (11,270,923 | ) | | (2,161,818 | ) | | (1,099,785 | ) |
| Recoveries of charge-offs | | | 323,156 | | | 319,615 | | | 775,364 | |
Allowance for loan losses acquired from Liberty Bank of New York acquisition | | | - | | | 600,841 | | | - | |
| Balance—end of year | | $ | 21,579,403 | | $ | 18,654,082 | | $ | 13,999,302 | |
The activity in the liability for losses on loan commitments was as follows for the years ended December 31:
| | | 2007 | | 2006 | | 2005 | |
| Balance—beginning of year | | $ | 890,854 | | $ | 778,996 | | $ | 641,627 | |
| Provision for losses on loan commitments | | | 1,106,912 | | | 103,858 | | | 137,369 | |
Allowance for loan commitment acquired from Liberty Bank of New York acquisition | | | - | | | 8,000 | | | - | |
| Balance—end of year | | $ | 1,997,766 | | $ | 890,854 | | $ | 778,996 | |
The following is a summary of impaired loans with and without specific reserve as of December 31, 2007 and 2006:
| | | 2007 | | 2006 | |
| | | Loan Amount | | Specific Reserve | | Loan Amount | | Specific Reserve | |
| Impaired loans without | | | | | | | | | |
| specific reserve | | $ | 10,243,148 | | $ | - | | $ | 10,919,204 | | $ | - | |
| Impaired loans with | | | | | | | | | | | | | |
| specific reserve | | | 5,302,287 | | | 1,909,765 | | | 3,721,671 | | | 1,867,289 | |
| Total Impaired loans | | $ | 15,545,435 | | $ | 1,909,765 | | $ | 14,640,875 | | $ | 1,867,289 | |
The average recorded investment in impaired loans during the years ended December 31, 2007 and 2006 was $19,386,784 and $6,311,883, respectively. There was not any interest income recognized in 2007 and 2006. In 2005, $7,771 interest income was recognized on a cash basis on impaired loans.
At December 31, 2007, the Company had loans on non-accrual status of $10,294,017, net of SBA guaranteed, compared to $5,802,012 at December 31, 2006.
At December 31, 2007, the Company’s secured loans-to-one-borrower limit was $69.6 million based upon the 25% of shareholder’s equity plus the allowance for loan losses and capital notes and debentures. At December 31, 2007, the Company’s largest relationship was a total of $31.8 million credit extension to multiple corporate entities that are guaranteed by the same individuals. All of the loans are secured by commercial real estate and were performing in accordance with their terms.
Many of our customers are locally-based Korean-Americans who also conduct business in South Korea. Although we conduct most of our business with locally-based customers and rely on domestically located assets to collateralize our loans and credit arrangements, we have historically had some exposure to the economy of South Korea in connection with certain of our loans and credit transactions with Korean banks.
Substantially all of the Company’s business is located in California, with a particular concentration in Southern California. Approximately 75% of the Company’s loan portfolio was concentrated in Southern California at December 31, 2007.
Since 2003 we are actively involved in the residential mortgage lending and we offer a wide selection of residential mortgage programs, including non-traditional mortgages such as interest only and payment option adjustable rate mortgages. Most of our salable loans are transferred to the secondary market while we retain a certain portion on our books as portfolio loans. Our total home mortgage loan portfolio outstanding at the end of 2007 and 2006 was $38.0 million and $40.6 million, respectively and we have deemed its effect on our credit risk profile to be immaterial. The residential mortgage loans with unconventional terms such as interest only mortgage and option adjustable rate mortgage at December 31, 2007 were $2.8 million and $1.2 million, respectively, inclusive of loans held temporarily for sale or refinancing. They were $4.6 million and $1.1 million, respectively, at December 31, 2006.
The following is an analysis of all loans to officers and directors of the Company and its affiliates as of December 31. All such loans were made under terms that are consistent with the Company’s normal lending policies.
| | | 2007 | | 2006 | |
| Outstanding balance—beginning of year | | $ | 35,556,650 | | $ | 39,475,210 | |
| Credit granted, including renewals | | | 804,314 | | | 9,133,210 | |
| Repayments | | | (24,581,621 | ) | | (13,051,770 | ) |
| Outstanding balance—end of year | | $ | 11,779,343 | | $ | 35,556,650 | |
Income from these loans totaled approximately $1,779,812, $2,944,082 and $1,799,474 for the years ended December 31, 2007, 2006 and 2005, respectively, and is reflected in the accompanying consolidated statements of operations.
SBA loans serviced for others are not reported as assets. The principal balances of these loans at 2007 year end are $330.5 million.
The following is a summary of activity for servicing assets and the related valuation allowance in the consolidated statements of financial condition at December 31, 2007 and 2006, respectively:
| | 2007 | | 2006 | |
| Beginning of year | | $ | 5,080,466 | | $ | 4,682,848 | |
| Additions | | | 1,637,326 | | | 2,092,104 | |
| Disposals | | | (1,389,967 | ) | | (1,144,059 | ) |
| Amortized to expense | | | (1,083,886 | ) | | (722,888 | ) |
Cumulative effect due to adoption of FAS 156 1 (Note 1) | | | 137,380 | | | - | |
| Changes in fair value | | | 568,253 | | | - | |
| Change in valuation allowance | | | - | | | 172,461 | |
| End of year | | $ | 4,949,572 | | $ | 5,080,466 | |
Fair valuation of servicing assets in accordance with the adoption of SFAS No. 156 was determined based on the present value of the contractually specified servicing fee, net of servicing cost, over the estimated life of the loan, with an average discount rate and a range of constant prepayment rates.
The following table is a summary of average discount rates and constant prepayment rates of our servicing loan portfolio as of December 31, 2007 and 2006, respectively:
| | | 2007 | | 2006 | |
| Avg. Discount Rate | | | 9.79 | % | | 10.38 | % |
| Constant Prepayment Rate | | | 18.40 | % | | 17.00 | % |
5. | INVESTMENTS IN AFFORDABLE HOUSING PARTNERSHIPS |
The Company has invested in certain limited partnerships that were formed to develop and operate apartment complexes designed as high-quality affordable housing for lower income tenants throughout the United States. The Company’s ownership in each limited partnership varies from 1.46% to 26.66%. As of December 31, 2007, we have six such investments, with a net carrying value of $6.2 million at December 31, 2007. Each of the partnerships must meet the regulatory requirements for affordable housing for a minimum 15-year compliance period to fully utilize the tax credits. If the partnerships ceased to qualify during the compliance period, the credits may be denied for any period in which the projects are not in compliance and a portion of the credits previously taken may be subject to recapture with interest.
1 Upon adoption of SFAS No. 156 effective January 1, 2007, the $137,380 adjustment represented the total of $79,617 fair value adjustment, net of tax, to the beginning equity, and $42,871 and $14,892 federal and state deferred liabilities (see Note 1).
The remaining federal tax credits to be utilized over a maximum of 15 years are $10.3 million as of December 31, 2007. The Company’s usage of federal tax credits approximated $542,000, $391,000 and $198,000 during 2007, 2006, and 2005, respectively. Investment amortization amounted to $532,000, $329,000 and $206,000 for the years ended December 31, 2007, 2006, and 2005, respectively.
6. | BANK PREMISES AND EQUIPMENT |
The following is a summary of the major components of Bank premises and equipment as of December 31:
| | | 2007 | | 2006 | |
| Land | | $ | 2,067,791 | | $ | 2,067,791 | |
| Building | | | 2,508,149 | | | 2,508,149 | |
| Furniture and equipment | | | 5,634,066 | | | 5,183,473 | |
| Leasehold improvements | | | 8,114,549 | | | 6,702,725 | |
| | | | 18,324,555 | | | 16,462,138 | |
| Accumulated depreciation and amortization | | | (7,364,463 | ) | | (5,997,538 | ) |
| | | $ | 10,960,092 | | $ | 10,464,600 | |
Depreciation expense was $1,628,396, $1,350,879, and $1,002,188 for the years ended December 31, 2007, 2006 and 2005, respectively.
Time deposits by maturity dates are as follows at December 31:
| | | 2007 | | 2006 | |
| Less than three months | | $ | 460,253,460 | | $ | 461,935,125 | |
| After three to six months | | | 225,303,814 | | | 221,078,901 | |
| After six months to twelve months | | | 233,621,355 | | | 284,566,964 | |
| After twelve months | | | 12,419,087 | | | 5,457,992 | |
| Total | | $ | 931,597,716 | | $ | 973,038,982 | |
The scheduled maturities of time deposits as of December 31, 2007 are as follows:
| 2008 | | $ | 919,178,629 | |
| 2009 | | | 12,401,776 | |
| 2010 | | | 12,311 | |
| 2011 | | | - | |
| 2012 and thereafter | | | 5,000 | |
| Total | | $ | 931,597,716 | |
A summary of interest expense on deposits is as follows for the years ended December 31:
| | | 2007 | | 2006 | | 2005 | |
| Savings | | $ | 710,013 | | $ | 331,982 | | $ | 167,989 | |
| Time deposits of $100,000 or more | | | 40,515,934 | | | 36,082,490 | | | 18,584,362 | |
| Other time deposits | | | 7,153,343 | | | 7,132,890 | | | 3,732,279 | |
| Other | | | 20,386,363 | | | 15,396,194 | | | 7,429,506 | |
| Total | | $ | 68,765,653 | | $ | 58,943,556 | | $ | 29,914,136 | |
Other interest-bearing deposits consist of money market deposits and super NOW deposits.
In addition to credit risks, because the Company’s customer base is largely Korean-American, the Company’s deposit base could significantly decrease as a result of deterioration in the Korean economy. During downturns in the Korean economy, some of the Company’s customers may need funds for their local businesses, or may temporarily withdraw deposits in order to transfer funds and benefit from gains on foreign exchange and interest rates and/or to help their relatives in South Korea during downturns in the Korean economy. A significant decrease in the Company’s deposits could also have a material adverse effect on the financial condition and results of operations of the Company.
8. | COMMITMENTS AND CONTINGENCIES |
The Company leases premises and equipment under noncancelable operating leases. Future minimum rental commitments under these leases are as follows at December 31, 2007:
Year | | Amount | |
| 2008 | | $ | 3,138,083 | |
| 2009 | | | 3,130,965 | |
| 2010 | | | 2,240,898 | |
| 2011 | | | 1,828,224 | |
| 2012 | | | 1,580,352 | |
| Thereafter | | | 4,915,824 | |
| | | $ | 16,834,346 | |
Rental expense recorded under such leases amounted to approximately $2,646,000, $2,271,000, and $1,752,000 for the years ended December 31, 2007, 2006 and 2005, respectively.
In the normal course of business, the Company is involved in various legal claims. Management has reviewed all legal claims against the Company with outside legal counsel and has taken into consideration the views of such counsel as to the outcome of the claims. In management’s opinion, the final disposition of all such claims will not have a material adverse effect on the financial position and results of operations of the Company.
The Company is a party to financial instruments with off-balance-sheet risk in the normal course of business to meet the financing needs of its customers. These financial instruments include commitments to extend credit and standby letters of credit. These instruments involve, to varying degrees, elements of credit and interest rate risk in excess of the amount recognized in the consolidated statements of financial condition. The Company’s exposure to credit loss in the event of nonperformance by the other party to commitments to extend credit and standby letters of credit is represented by the contractual notional amount of those instruments. The Company uses the same credit policies in making commitments and conditional obligations as it does for extending loan facilities to customers. The Company evaluates each customer’s creditworthiness on a case-by-case basis. The amount of collateral obtained, if deemed necessary by the Company upon extension of credit, is based on management’s credit evaluation of the counterparty.
Collateral held varies but may include accounts receivable, inventory, property, plant and equipment and income-producing properties. The Company had commitments to extend credit of approximately $284,896,000 and $141,245,000 and obligations under standby letters of credit and commercial letters of credit of approximately $20,762,000 and $24,303,000 at December 31, 2007 and 2006, respectively.
9. | FHLB BORROWINGS AND JUNIOR SUBORDINATED DEBENTURES |
At December 31, 2007, the Company had approved financing with the Federal Home Loan Bank (“FHLB”) for a maximum advance of up to 25% of total assets ($524,208,000 as of December 31, 2007) based on qualifying collateral. The Company’s actual borrowing capacity under the FHLB standard credit program per our pledged collateral was approximately $461 million, with $150 million borrowing outstanding and $311 million capacity remaining as of December 31, 2007.
The following table indicates our outstanding advances from FHLB at December 31, 2007.
Amount (Dollars in Thousands) | | Issue Date | | Maturity Date | | Rate | |
| $ 30,000 | | | | 11/08/2007 | | | 01/08/2008 | | | 4.56% | |
| 20,000 | | | | 01/12/2005 | | | 01/14/2008 | | | 3.68% | |
| 50,000 | | | | 11/01/2007 | | | 11/03/2008 | | | 4.39% | |
| 50,000 | | | | 12/17/2007 | | | 12/17/2009 | | | 4.07% | |
| $150,000 | | | | | | | | | | 4.22% | |
The following table summarizes information relating to the Company’s FHLB advances for the periods or dates indicated:
| | | Year Ended December 31, | |
| | | 2007 | | 2006 | | 2005 | |
| | | (Dollars in Thousands) | |
| | | | | | | | |
| Average balance during the year | | $ | 46,890 | | $ | 39,108 | | $ | 56,151 | |
| Average interest rate during the year | | | 4.24 | % | | 3.83 | % | | 3.13 | % |
| Maximum month-end balance during the year | | $ | 155,000 | | $ | 20,000 | | $ | 61,000 | |
| Loan collateralizing the agreements at year-end | | $ | 946,764 | | $ | 832,255 | | $ | 966,064 | |
We had five issuances of junior subordinated debentures, $10,000,000, $15,464,000, $20,619,000, $15,464,000, and $25,774,000, respectively, at December 31, 2007. The first one was issued by the Bank and the others were issued by the Company to trusts in which the Company is the sole stockholder in connection with the issuance of trust preferred securities.
The following table summarizes our outstanding Subordinated Debentures at December 31, 2007.
Name | | Issued Date | | Amount of Debenture Issued (in Thousands) | | Common Securities (in Thousands) | | Interest Rate | | Current Rate | | Callable Date | | Maturity Date | |
Wilshire State Bank Junior Subordinated Debentures | | | 12/19/2002 | | $ | 10,000 | | | N/A | | 3-Month LIBOR + 3.10 % | | | 7.96 | % | | 03/26/2008 | 1 | | 12/26/2012 | |
Wilshire Statutory Trust I | | | 12/17/2003 | | | 15,464 | | | 464 | | 3-Month LIBOR + 2.85 % | | | 7.84 | % | | 12/17/2008 | | | 12/17/2033 | |
Wilshire Statutory Trust II | | | 03/17/2005 | | | 20,619 | | | 619 | | 3 Month LIBOR + 1.79 % | | | 6.78 | % | | 03/17/2010 | | | 03/17/2035 | |
Wilshire Statutory Trust III | | | 09/15/2005 | | | 15,464 | | | 464 | | 6.07% Fixed until 09-15-2010 thereafter 3-Month LIBOR + 1.40 % | | | 6.07 | % | | 09/15/2010 | | | 09/15/2035 | |
Wilshire Statutory Trust IV | | | 07/10/2007 | | | 25,774 | | | 774 | | 3 Month LIBOR + 1.38 % | | | 6.37 | % | | 09/15/2012 | | | 09/15/2037 | |
| | | | | | $ | 87,321 | | $ | 2,321 | | | | | | | | | | | | | |
During 1997, the Company established a stock option plan that provides for the issuance of up to 6,499,800 shares of the Company’s authorized but unissued common stock to managerial employees and directors. Due to the expiration of the 1997 stock-based compensation plan in 2007, there are no stocks remaining available for future issuance under the plan as of December 31, 2007. The Company may grant a new stock-based compensation plan in the future, depending on the Company’s performance. Exercise prices may not be less than the fair market value at the date of grant. As of December 31, 2007, 522,476 shares were previously granted and outstanding under this option plan. Options granted under the stock option plan expire not more than 10 years after the date of grant.
1 Per Article X, Section 10.1, Optional Redemption, the Bank has the right to redeem the $10 million debentures, in whole or in part, on any March 26, June 26, September26 or December 26 on or after December 26, 2007. The next callable date as of this report is March 26, 2008.
On January 1, 2006, the Company adopted SFAS 123R, Share-Based Payment, using the modified prospective method. Accordingly, prior-period amounts have not been restated. Had the Company determined compensation cost based on the fair value at the grant date for stock options exercisable under SFAS No. 123R prior to January 1, 2006, the Company’s results of operations and earnings per share would have been adjusted to the pro forma amounts for the year 2005 indicated below:
| | | 2005 | |
| Net income—as reported | | $ | 27,759,649 | |
| Add: Stock-based employee compensation | | | | |
| expense included in reported net income—net |
| of related tax effect | | | - | |
| Deduct: Total stock-based employee | | | | |
| expense determined under fair value based | | | | |
| compensation method for all awards—net of | | | | |
| related tax effect | | | (162,786 | ) |
| | | | | |
| Pro forma net income | | $ | 27,596,863 | |
| | | | | |
| Earnings per share: | | | | |
| Basic—as reported | | $ | 0.97 | |
| Basic—pro forma | | $ | 0.97 | |
| | | | | |
| Diluted—as reported | | $ | 0.96 | |
| Diluted—pro forma | | $ | 0.95 | |
Pursuant to the adoption of SFAS No. 123R, our stock-based compensation expense was $347,736 and $472,219 for 2007 and 2006, respectively, which decreased the year’s income before income taxes by such amount and its effect on basic or diluted earnings per share was negligible. Cash provided by operating activities decreased by $1,286,447 and $899,249 for 2007 and 2006, respectively. Cash provided by financing activities increased by identical amounts for both 2007 and 2006, related to excess tax benefits from stock-based payment arrangements.
The Company has issued stock options to employees under stock-based compensation plans. Stock options are issued at the current market price on the date of grant. The vesting period and contractual term are determined at the time of grant, but the contractual term may not exceed 10 years from the date of grant. The grant date fair value of each option award is estimated on the date of grant using the Black-Scholes option valuation model that uses the assumptions noted below. The expected life (estimated period of time outstanding) of options was estimated using the simple method in accordance with SFAS No. 123R. The expected volatility was based on historical volatility for a period equal to the stock option’s expected life. The risk-free rate is based on the U.S. Treasury yield curve in effect at the time of grant.
For 2007, there were no stock options granted, while for 2006, and 2005, 187,000, and 258,600 stock options were granted, respectively. The weighted average fair value of options granted during 2006 and 2005 was $5.26 and $1.97 per share, respectively. They were estimated on the date of grant using the Black-Scholes option-pricing model with the following assumptions indicated below:
| | | 2007 | | 2006 | | 2005 | |
| Expected life | | | - | | | 3.4-3.8 years | | | 2 years | |
| Expected volatility | | | - | | | 32.89% | | | 24.56% | |
| Expected dividend yield | | | - | | | 1.06% | | | 1.16% | |
| Risk-free interest rate | | | - | | | 4.70% | | | 2.82% | |
| | | | | | | | | | | |
The expected life (estimated period of time outstanding) of stock options granted was estimated using the historical exercise behavior of employees. The expected volatility was based on historical volatility for a period equal to the stock option’s expected life. The risk-free rate is based on the U.S. Treasury yield curve in effect at the time of grant.
Activity in the stock option plan, which has been retroactively adjusted for all stock splits, is as follows for the years ended December 31:
2007 | | Shares | | Weighted Average Exercise Price | | Weighted Average Remaining Contractual Term (in years) | | Aggregate Intrinsic Value | |
| Outstanding at January 1, 2007 | | | 737,892 | | $ | 9.48 | | | | | | | |
| Granted | | | - | | | - | | | | | | | |
| Excercised | | | (183,316 | ) | | 0.76 | | | | | | | |
| Forfeited | | | (32,100 | ) | | 15.70 | | | | | | | |
| Outstanding at December 31, 2007 | | | 522,476 | | $ | 12.16 | | | 5.02 years | | $ | 868,828 | |
| Option exercisable at December 31, 2007 | | | 357,936 | | $ | 9.79 | | | 5.09 years | | $ | 868,828 | |
The following table summarizes information about stock options outstanding as of December 31, 2007:
| | | Options Outstanding | | Options Exercisable | |
| | | | | | | Weighted- | | | | | |
| | | | | Weighted- | | Average | | | | Weighted- | |
| | | | | Average | | Remaining | | | | Average | |
| | | Number | | Exercise | | Contractual | | Number | | Exercise | |
Range of Exercise Prices | | Outstanding | | Price | | Life | | Exercisable | | Price | |
| $1.00-$1.99 | | | 40,000 | | $ | 1.39 | | | 2.97 | | | 40,000 | | $ | 1.39 | |
| $2.00-$2.99 | | | 82,926 | | | 2.57 | | | 4.39 | | | 82,926 | | | 2.57 | |
| $3.00-$4.99 | | | 52,000 | | | 4.53 | | | 5.58 | | | 52,000 | | | 4.53 | |
| $13.00-$14.99 | | | 50,000 | | | 13.74 | | | 7.27 | | | 30,400 | | | 13.74 | |
| $15.00-$16.99 | | | 119,850 | | | 15.21 | | | 7.21 | | | 79,610 | | | 15.22 | |
| $17.00-$19.99 | | | 177,700 | | | 18.78 | | | 3.50 | | | 73,000 | | | 18.79 | |
| Outstanding at end of year | | | 522,476 | | $ | 12.16 | | | 5.02 | | | 357,936 | | $ | 9.79 | |
Activities related to stock options are presented as follows:
| | | 2007 | | 2006 | | 2005 | |
| | | | | | | | |
| Total intrinsic value of options exercised | | $ | 3,161,273 | | $ | 3,768,494 | | $ | 6,838,633 | |
| Total fair value of options vested | | $ | 329,903 | | $ | 300,496 | | $ | 203,868 | |
| Weighted average fair value of options | | | | | | | | | | |
| granted during the year | | $ | - | | $ | 5.26 | | $ | 2.18 | |
As of December 31, 2007, total unrecognized compensation cost related to stock options that have been granted prior to the end of 2007 decreased to $251,000 from $599,000 at the end of 2006 due to $348,000 compensation cost recognized and no new stock options granted during 2007. This cost is expected to be recognized over a weighted average period of 1.08 years.
A summary of the status and changes of the Company’s non-vested shares related to the Company’s stock plans as of and during 2007 is presented below:
| | | Shares | | Weighted Average Grant date Fair value | |
| Nonvested at January 1, 2007 | | | 274,360 | | $ | 3.98 | |
| Granted | | | - | | | - | |
| Vested | | | (85,020 | ) | | 3.88 | |
| Forfeited on unvested shares | | | (24,800 | ) | | 3.24 | |
| Nonvested at December, 2007 | | | 164,540 | | $ | 4.15 | |
11. | REPURCHASE OF COMMON STOCK |
Pursuant to the stock repurchase program authorized by the Company’s board of directors on July 26, 2007, management repurchased the Company’s outstanding common stock on various dates in August 2007 and November 2007 on cost basis as listed below:
Period | | Shares Purchased | | Total Amount | |
| 08/01/2007 -08/31/2007 | | | 39,625 | | $ | 410,395 | |
| 11/01/2007 -11/30/2007 | | | 87,800 | | | 851,294 | |
Total | | | 127,425 | | $ | 1,261,689 | |
| | | | | | | | |
A summary of income tax expense (benefit) for 2007, 2006 and 2005 follows:
| | | Current | | Deferred | | Total | |
| 2007: | | | | | | | |
| Federal | | $ | 13,468,683 | | $ | 63,338 | | $ | 13,532,021 | |
| State | | | 3,893,365 | | | (116,834 | ) | | 3,776,531 | |
| | | $ | 17,362,048 | | $ | (53,496 | ) | $ | 17,308,552 | |
| | | | | | | | | | | |
| 2006: | | | | | | | | | | |
| Federal | | $ | 18,390,036 | | $ | (1,207,961 | ) | $ | 17,182,075 | |
| State | | | 4,928,494 | | | (307,837 | ) | | 4,620,657 | |
| | | $ | 23,318,530 | | $ | (1,515,798 | ) | $ | 21,802,732 | |
| | | | | | | | | | | |
| 2005: | | | | | | | | | | |
| Federal | | $ | 16,644,603 | | $ | (2,365,863 | ) | $ | 14,278,740 | |
| State | | | 4,802,050 | | | (328,014 | ) | | 4,474,036 | |
| | | $ | 21,446,653 | | $ | (2,693,877 | ) | $ | 18,752,776 | |
The following is a summary of the income taxes receivable included in other assets in the consolidated statements of financial condition at December 31, 2007 and 2006, respectively:
| | | 2007 | | 2006 | |
| Current income taxes: | | | | | |
| Federal | | $ | (597,051 | ) | $ | (84,612 | ) |
| State | | | (266,859 | ) | | (135,299 | ) |
| Total income taxes receivable | | $ | (863,910 | ) | $ | (219,911 | ) |
The cumulative temporary differences, as tax effected, are as follows as of December 31, 2007 and 2006:
| | | | | | | | |
| | Federal | | State | | Total | |
| Deferred tax assets: | | | | | | | |
| Statutory bad debt deduction less than | | | | | | | | | | |
| financial statement provision | | $ | 8,227,512 | | $ | 2,548,178 | | $ | 10,775,690 | |
| Tax depreciation less than financial | | | | | | | | | | |
| statement depreciation | | | 630,811 | | | 282,516 | | | 913,327 | |
| Amortization of start-up cost | | | 20,571 | | | 6,371 | | | 26,942 | |
| Deferred rent | | | 68,140 | | | 21,104 | | | 89,244 | |
| Net operating loss | | | 111,715 | | | - | | | 111,715 | |
| SFAS 123R non-qualified stock options | | | 54,090 | | | 16,752 | | | 70,842 | |
| Mark-to-market loans held-for-sale | | | 164,303 | | | 50,887 | | | 215,190 | |
| Unrealized gain on securities available-for-sale | | | - | | | 9,004 | | | 9,004 | |
| State tax deferred and other | | | 189,819 | | | - | | | 189,819 | |
| Total deferred tax assets | | | 9,466,961 | | | 2,934,812 | | | 12,401,773 | |
| Deferred tax liabilities: | | | | | | | | | | |
| Prepaid expenses | | | 333,244 | | | 103,210 | | | 436,454 | |
| Deferred loan origination costs | | | 1,395,109 | | | 432,085 | | | 1,827,194 | |
| Unrealized gain on securities available-for-sale | | | 23,665 | | | - | | | 23,665 | |
| Intangible related to business combination | | | 421,960 | | | 130,687 | | | 552,647 | |
| FASB 156 adjustment | | | 230,580 | | | 71,414 | | | 301,994 | |
| State tax deferred and other | | | - | | | 108,649 | | | 108,649 | |
| Total deferred tax liabilities | | | 2,404,558 | | | 846,045 | | | 3,250,603 | |
| | | | | | | | | | | |
| Net deferred tax assets | | $ | 7,062,403 | | $ | 2,088,767 | | $ | 9,151,170 | |
| | Federal | | State | | Total | |
| Deferred tax assets: | | | | | | | |
| Statutory bad debt deduction less than | | | | | | | | | | |
| financial statement provision | | $ | 6,762,053 | | $ | 2,101,339 | | $ | 8,863,392 | |
| Tax depreciation less than financial | | | | | | | | | | |
| statement depreciation | | | 493,714 | | | 273,702 | | | 767,416 | |
| Amortization of start-up cost | | | 34,285 | | | 10,619 | | | 44,904 | |
| Deferred rent | | | 90,854 | | | 28,139 | | | 118,993 | |
| Net operating loss | | | 331,881 | | | 82,338 | | | 414,219 | |
| SFAS 123R non-qualified stock options | | | 33,236 | | | 10,293 | | | 43,529 | |
| Unrealized gain on securities available-for-sale | | | 440,745 | | | 111,166 | | | 551,911 | |
| State tax deferred and other | | | 963,536 | | | | | | 963,536 | |
| Mark-to-market loans held-for-sale | | | 81,952 | | | 25,382 | | | 107,334 | |
| Total deferred tax assets | | | 9,232,256 | | | 2,642,978 | | | 11,875,234 | |
| Deferred tax liabilities: | | | | | | | | | | |
| Prepaid expenses | | | 186,278 | | | 57,693 | | | 243,971 | |
| Deferred loan origination costs | | | 876,725 | | | 271,534 | | | 1,148,259 | |
| Intangible related to business combination | | | 536,233 | | | 166,079 | | | 702,312 | |
| State tax deferred and other | | | | | | 58,684 | | | 58,684 | |
| Total deferred tax liabilities | | | 1,599,236 | | | 553,990 | | | 2,153,226 | |
| Net deferred tax assets | | $ | 7,633,020 | | $ | 2,088,988 | | $ | 9,722,008 | |
In assessing the realizability of deferred tax assets, management considers whether it is more likely than not that some portion or all of the deferred tax assets will not be realized. The ultimate realization of deferred tax assets is dependent upon the generation of future taxable income during the periods in which those temporary differences become deductible. Management considers the scheduled reversal of deferred tax liabilities, the projected future taxable income, and tax-planning strategies in making this assessment. A valuation allowance against deferred tax assets at the balance-sheet date is not considered necessary, because it is more likely than not the deferred tax asset will be fully realized.
A reconciliation of the difference between the federal statutory income tax rate and the effective tax rate is shown in the following table for the three years ended December 31:
| | | 2007 | | 2006 | | 2005 | |
| Statutory tax rate | | | 35 | % | | 35 | % | | 35 | % |
| State taxes - net of Los Angeles Revitalization | | | 5 | | | 5 | | | 6 | |
| and federal tax benefits | | | (1 | ) | | (1 | ) | | (1 | ) |
| Other - net | | | 39 | % | | 39 | % | | 40 | % |
On January 1, 2007, the Company adopted the provisions of FIN 48. As a result of applying the provisions of FIN 48, it recognized an increase in the liability for unrecognized tax benefit of $153,000 and related interest of $9,000, which was accounted for as a decrease to the beginning balance of retained earnings. The following table summarizes the activity related to the changes of unrecognized tax benefit in 2007:
Unrecognized tax benefit: | | Total | |
| Balance at January 1, 2007 | | $ | 152,988 | |
| Increases related to current year tax positions | | | 54,462 | |
| Balance at December 31, 2007 | | $ | 207,450 | |
| | | | | |
FIN 48 Interest Accrual: | | | | |
| Balance at January 1, 2007 | | $ | 8,595 | |
| Increases during current year | | | 10,779 | |
| Balance at December 31, 2007 | | $ | 19,374 | |
| | | | | |
As of December 31, 2007, the total unrecognized tax benefit was $207,000, which was solely related to the state exposure from California Enterprise Zone net interest deductions. The Company does not expect the unrecognized tax benefits to change significantly over the next 12 months.
As of the December 31, 2007, the total accrued interest related to uncertain tax positions, net of United States federal tax benefit, was $19,000. The Company accounted for interest related to uncertain tax positions as part of our provision for federal and state income taxes. Accrued interest was included as part of our net deferred tax asset in the consolidated financial statements.
The Company files United States federal and state income tax returns in jurisdictions with varying statue of limitations. The 2004 through 2007 tax years generally remain subject to examination by federal and most state tax authorities.
On May 19, 2006, the Company completed its acquisition of Liberty Bank of New York (“Liberty”), a commercial bank with about $66 million in assets and two branches in New York City, which was then immediately merged into Wilshire State Bank. The Company paid $8,592,407 in cash and issued an aggregate of 328,110 shares of its common stock to the former shareholders of Liberty in connection with the Company’s acquisition of all the outstanding capital stock of Liberty. The Company’s common stock was valued pursuant to the Stock Purchase Agreement at $18.0933 per share, the average of the daily closing prices of the Company’s common stock as reported on the NASDAQ National Market for the 20 consecutive trading days ending on the last business day prior to the closing. The aggregate purchase price of this business combination was $15,154,000, which included $625,000 of capitalized direct costs associated with this business combination in addition to the payment to the former Liberty shareholders of $14,529,000. The purchase price, as well as the fair values of assets and liabilities recorded, may change as certain estimates are finalized.
Certain restructuring costs, mainly consulting fees paid to third parties and severance payments to certain Liberty employees specified in the stock purchase agreement, were recognized as liabilities assumed in the business combination. Accordingly, they have been considered part of the purchase price of Liberty and recorded as an increase in the balance of goodwill. Such payments totaled $625,000 and consisted of $332,000 of legal and accounting consulting fees, $253,000 for severance payments, and $40,000 for miscellaneous items.
As of May 19, 2006, the fair value of the Liberty’s net assets acquired and the related intangible and goodwill were as follows:
Assets: | | (Dollars in Thousands) | |
| Cash and due from banks | | $ | 2,423 | |
| Federal funds sold and other cash equivalents | | | 12,700 | |
| Cash and cash equivalents | | | 15,123 | |
| Securities available for sale | | | 15,110 | |
| Loans receivable | | | 25,657 | |
| Bank premises and equipment, net | | | 631 | |
| Accrued interest receivable | | | 282 | |
| Deferred income taxes | | | 538 | |
| Other assets | | | 274 | |
| Favorable lease intangible 1 | | | 429 | |
| Core deposit intangible 2 | | | 1,640 | |
| Goodwill 3 | | | 6,675 | |
| Total assets | | $ | 66,359 | |
Liabilities: | | | | |
| Deposits: | | | | |
| Noninterest-bearing | | $ | 22,217 | |
| Interest-bearing | | | | |
| Savings | | | 2,445 | |
| Time deposits of $100,000 or more | | | 12,116 | |
| Other time deposits | | | 5,191 | |
| Interest bearing demand deposit | | | 8,528 | |
| Total deposits | | | 50,497 | |
| Accrued interest payable | | | 56 | |
| Other liabilities | | | 420 | |
| Unfavorable lease intangible | | | 232 | |
| Total liabilities | | | 51,205 | |
| Total consideration paid | | $ | 15,154 | |
The company recorded goodwill of $6.7 million from the acquisition of Liberty Bank of New York in May 2006. The company also recorded $1.6 million core deposit intangibles and $0.4 million favorable lease intangible from the acquisition of Liberty Bank of New York in May 2006 (see Note 14).
14. | GOODWILL AND OTHER INTANGIBLE ASSETS |
The Company recorded goodwill of $6.7 million from the acquisition of Liberty Bank of New York in May 2006. The gross carrying amount of goodwill amounted to $6.7 million at both December 31, 2007 and 2006 since no impairment losses were recoded per goodwill impairment testing performed during those years.
| 1 | The favorable lease intangible is being amortized for the remaining lease term of 41 months. |
| 2 | The core-deposit intangibles are the sum of intangibles on different types of core deposits. The intangible for each type of core deposit is being amortized over its respective estimated useful life, which ranges from 94 to 126 months. |
| 3 | None of the goodwill balance is expected to be deductible for income tax purposes. |
The Company also has core deposit intangibles and favorable lease intangible from the acquisition of Liberty Bank of New York in May 2006. The gross carrying amount of core deposit intangibles totaled $1.6 million, and the related accumulated amortization totaled $281,000 and $107,000 at December 31, 2007 and 2006, respectively.
Total amortization expense on core deposit intangible was $174,000 and $107,000 during the year ended December 31, 2007 and 2006, respectively. The gross carrying amount of favorable lease intangible is $429,000, and the related accumulated amortization totaled $201,000 and $77,000 as of December 31, 2007 and 2006, respectively. Total amortization expense on favorable lease intangible was $124,000 and $77,000 during the year ended December 31, 2007 and 2006, respectively. The following table provides the estimated future amortization expense of acquired intangibles for the succeeding five years:
Estimate For The Year Ending December 31, | | Amount | |
| 2008 | | $ | 298,000 | |
| 2009 | | | 277,000 | |
| 2010 | | | 174,000 | |
| 2011 | | | 174,000 | |
| 2012 | | | 174,000 | |
In 1996, the Company established a 401(k) savings plan, which is open to all eligible employees who are 21 years old or over and have completed six months of service. The plan provides for the Company’s matching contribution up to 6% of participants’ compensation during the plan year. Vesting in employer contributions is 25% after two years of service and 25% per year thereafter. Total employer contributions to the plan amounted to approximately $545,000, $413,000, and $225,000 for the years ended December 31, 2007, 2006 and 2005, respectively.
The Company is subject to various regulatory capital requirements administered by the federal banking agencies. Failure to meet minimum capital requirements can initiate certain mandatory—and possibly additional discretionary—actions by regulators that, if undertaken, could have a direct material effect on the Company’s financial statements. Under capital adequacy guidelines and the regulatory framework for prompt corrective action, the Company must meet specific capital guidelines that involve quantitative measures of the Company’s assets, liabilities and certain off-balance-sheet items as calculated under regulatory accounting practices. The Company’s capital amounts and classification are also subject to qualitative judgments by the regulators about components, risk weightings and other factors.
Quantitative measures established by regulation to ensure capital adequacy require the Company to maintain minimum ratios (set forth in the table below) of total and Tier I capital (as defined in the regulations) to risk-weighted assets (as defined) and Tier I capital (as defined) to average assets (as defined). Management believes that, as of December 31, 2007 and 2006, the Company meets all capital adequacy requirements to which it is subject.
Federal Reserve Board rules provide that a bank holding company may count proceeds from a trust preferred securities issuance as Tier 1 capital in an amount up to 25% of its total Tier 1 capital. Under the current Federal Reserve Board capital guidelines, as of December 31, 2007, the Company is able to include all of the proceeds from the issuance of the trust preferred securities as Tier 1 capital.
The Bank is periodically examined by the Federal Deposit Insurance Corporation (“FDIC”) and the Department of Financial Institutions of the State of California. As of the most recent notification from the FDIC, the Company is categorized as well capitalized under the regulatory framework for prompt corrective action. To be categorized as well capitalized, the Company must maintain minimum total risk-based, Tier I risk-based and Tier I leverage ratios as set forth in the table.
The Company’s and Bank’s actual capital amounts and ratios are presented in the table:
| | | Actual | | For Capital Adequacy Purposes | | To Be Categorized As Well Capitalized under Prompt Corrective Action Provisions | |
| | | Amount (in Thousands) | | Ratio | | Amount (in Thousands) | | | | Ratio | | Amount (in Thousands) | | | | Ratio | |
| | | | | | | | | | | | | | | | | | |
As of December 31, 2007: | | | | | | | | | | | | | | | | | |
| Total Capital (to risk-weighted assets): | | | | | | | | | | | | | | | | | |
| | | | | | | | | | | | | | | | | | |
| Wilshire Bancorp, Inc. | | $ | 270,877 | | | 14.58 | % | $ | 148,592 | | | ≥ | | | 8.00 | % | $ | 185,740 | | | ≥ | | | 10.00 | % |
| Wilshire State Bank | | $ | 252,231 | | | 13.59 | % | $ | 148,516 | | | ≥ | | | 8.00 | % | $ | 185,646 | | | ≥ | | | 10.00 | % |
| | | | | | | | | | | | | | | | | | | | | | | | | | |
| Tier 1 Capital (to risk-weighted assets): | | | | | | | | | | | | | | | | | | | | | | | | | |
| | | | | | | | | | | | | | | | | | | | | | | | | | |
| Wilshire Bancorp, Inc. | | $ | 219,792 | | | 11.83 | % | $ | 74,296 | | | ≥ | | | 4.00 | % | $ | 111,444 | | | ≥ | | | 6.00 | % |
| Wilshire State Bank | | $ | 219,021 | | | 11.80 | % | $ | 74,258 | | | ≥ | | | 4.00 | % | $ | 111,387 | | | ≥ | | | 6.00 | % |
| | | | | | | | | | | | | | | | | | | | | | | | | | |
| Tier 1 Capital (to average assets): | | | | | | | | | | | | | | | | | | | | | | | | | |
| | | | | | | | | | | | | | | | | | | | | | | | | | |
| Wilshire Bancorp, Inc. | | $ | 219,792 | | | 10.36 | % | $ | 84,870 | | | ≥ | | | 4.00 | % | $ | 106,087 | | | ≥ | | | 5.00 | % |
| Wilshire State Bank | | $ | 219,021 | | | 10.33 | % | $ | 84,776 | | | ≥ | | | 4.00 | % | $ | 105,970 | | | ≥ | | | 5.00 | % |
| | | | | | | | | | | | | | | | | | | | | | | | | | |
| | | | | | | | | | | | | | | | | | | | | | | | | | |
As of December 31, 2006: | | | | | | | | | | | | | | | | | | | | | | | | | |
| Total Capital (to risk-weighted assets): | | | | | | | | | | | | | | | | | | | | | | | | | |
| | | | | | | | | | | | | | | | | | | | | | | | | | |
| Wilshire Bancorp, Inc. | | $ | 220,748 | | | 13.63 | % | $ | 129,554 | | | ≥ | | | 8.00 | % | $ | 161,942 | | | ≥ | | | 10.00 | % |
| Wilshire State Bank | | $ | 218,659 | | | 13.51 | % | $ | 129,521 | | | ≥ | | | 8.00 | % | $ | 161,901 | | | ≥ | | | 10.00 | % |
| | | | | | | | | | | | | | | | | | | | | | | | | | |
| Tier 1 Capital (to risk-weighted assets): | | | | | | | | | | | | | | | | | | | | | | | | | |
| | | | | | | | | | | | | | | | | | | | | | | | | | |
| Wilshire Bancorp, Inc. | | $ | 191,203 | | | 11.81 | % | $ | 64,777 | | | ≥ | | | 4.00 | % | $ | 97,165 | | | ≥ | | | 6.00 | % |
| Wilshire State Bank | | $ | 189,114 | | | 11.68 | % | $ | 64,761 | | | ≥ | | | 4.00 | % | $ | 97,141 | | | ≥ | | | 6.00 | % |
| | | | | | | | | | | | | | | | | | | | | | | | | | |
| Tier 1 Capital (to average assets): | | | | | | | | | | | | | | | | | | | | | | | | | |
| | | | | | | | | | | | | | | | | | | | | | | | | | |
| Wilshire Bancorp, Inc. | | $ | 191,203 | | | 9.79 | % | $ | 78,116 | | | ≥ | | | 4.00 | % | $ | 97,645 | | | ≥ | | | 5.00 | % |
| Wilshire State Bank | | $ | 189,114 | | | 9.69 | % | $ | 78,053 | | | ≥ | | | 4.00 | % | $ | 97,566 | | | ≥ | | | 5.00 | % |
As a holding company whose only significant asset is the common stock of the Bank, the Company's ability to pay dividends on its common stock and to conduct business activities directly or in non-banking subsidiaries depends significantly on the receipt of dividends or other distributions from the Bank. The Bank’s ability to pay any cash dividends will depend not only upon its earnings during a specified period, but also on its meeting certain capital requirements. The Federal Deposit Insurance Act and FDIC regulations restrict the payment of dividends when a bank is undercapitalized, when a bank has failed to pay insurance assessments, or when there are safety and soundness concerns regarding a bank.
The payment of dividends by the Bank may also be affected by other regulatory requirements and policies, such as maintenance of adequate capital. If, in the opinion of the regulatory authority, a depository institution under its jurisdiction is engaged in, or is about to engage in, an unsafe or unsound practice (that, depending on the financial condition of the depository institution, could include the payment of dividends), such authority may require, after notice and hearing, that such depository institution cease and desist from such practice. The Federal Reserve Board has issued a policy statement that provides that insured banks and bank holding companies should generally pay dividends only out of operating earnings for the current and preceding two years. In addition, all insured depository institutions are subject to the capital-based limitations required by the Federal Deposit Insurance Corporation Improvement Act of 1991. In addition to the regulation of dividends and other capital distributions, there are various statutory and regulatory limitations on the extent to which the Bank can finance or otherwise transfer funds to the Company or any of its non-banking subsidiaries, whether in the form of loans, extensions of credit, investments or asset purchases. The Federal Reserve Act and Regulation may further restrict these transactions in the interest of safety and soundness. The foregoing restrictions on dividends paid by the Bank may limit Wilshire Bancorp’s ability to obtain funds from such dividends for its cash needs, including funds for payment of its debt service requirements and operating expenses and for payment of cash dividends to Wilshire Bancorp’s shareholders. The amount of dividends the Bank could pay to Wilshire Bancorp as of December 31, 2007 without prior regulatory approval, which is limited by statute to the sum of undivided profits for the current year plus net profits for the preceding two years, was $88.5 million.
17. | FAIR VALUE OF FINANCIAL INSTRUMENTS |
The estimated fair value of financial instruments has been determined by the Company using available market information and appropriate valuation methodologies. However, considerable judgment is required to interpret market data in order to develop estimates of fair value. Accordingly, the estimates presented herein are not necessarily indicative of the amounts the Company could realize in a current market exchange. The use of different market assumptions and/or estimation methodologies may have a material effect on the estimated fair value amounts at December 31:
| | | 2007 | | 2006 | |
| | | Carrying | | Estimated | | Carrying | | Estimated | |
| | | Amount | | Fair Value | | Amount | | Fair Value | |
| Assets: | | | | | | | | | |
| Cash and cash equivalents | | $ | 92,509,414 | | $ | 92,509,414 | | $ | 205,246,614 | | $ | 205,246,614 | |
| Investment securities available for sale | | | 224,255,643 | | | 224,255,643 | | | 167,837,734 | | | 167,837,734 | |
| Investment securities held to maturity | | | 7,383,862 | | | 7,371,635 | | | 14,620,870 | | | 14,445,714 | |
| Interest-only strips | | | 753,343 | | | 753,343 | | | 1,130,006 | | | 1,130,006 | |
| Loans receivable—net | | | 1,779,558,242 | | | 1,781,089,667 | | | 1,536,388,815 | | | 1,541,497,091 | |
| Loans held for sale | | | 7,912,284 | | | 8,381,639 | | | 5,496,421 | | | 5,730,569 | |
| Cash surrender value of life insurance | | | 16,228,282 | | | 16,228,282 | | | 15,635,773 | | | 15,635,773 | |
| Federal Home Loan Bank stock | | | 8,695,100 | | | 8,695,100 | | | 7,541,700 | | | 7,541,700 | |
| Accrued interest receivable | | | 10,062,050 | | | 10,062,050 | | | 10,049,265 | | | 10,049,265 | |
| Servicing assets | | | 4,949,572 | | | 4,949,572 | | | 5,080,466 | | | 5,333,279 | |
| Due from customer on acceptances | | | 3,377,223 | | | 3,377,223 | | | 2,385,134 | | | 2,385,134 | |
| | | | | | | | | | | | | | |
| Liabilities: | | | | | | | | | | | | | |
| Noninterest-bearing deposits | | $ | 314,114,461 | | $ | 314,114,461 | | $ | 319,310,552 | | $ | 319,310,552 | |
| Interest-bearing deposits | | | 1,448,956,666 | | | 1,453,371,257 | | | 1,432,662,100 | | | 1,432,528,511 | |
| Junior subordinated Debentures | | | 87,321,000 | | | 87,321,332 | | | 61,547,000 | | | 61,221,054 | |
| Federal Home Loan Bank borrowings | | | 150,000,000 | | | 150,104,908 | | | 20,000,000 | | | 19,642,655 | |
| Accrued interest payable | | | 10,440,374 | | | 10,440,374 | | | 12,006,124 | | | 12,006,124 | |
| Acceptances outstanding | | | 3,377,223 | | | 3,377,223 | | | 2,385,134 | | | 2,385,134 | |
The methods and assumptions used to estimate the fair value of each class of financial statements for which it is practicable to estimate that value are explained below:
Cash and Cash Equivalents - The carrying amounts approximate fair value due to the short-term nature of these investments.
Investment Securities - The fair value of investment securities is generally obtained from market bids from similar or identical securities, or obtained from independent securities brokers or dealers.
Interest-Only Strips - The fair value of the I/O strip is calculated by the Company’s management based on the present value of the excess of total servicing fees over the contractually specified servicing fee for the estimated life of loans that were sold, discounted at a market interest rate.
Loans Receivable-Net - Fair values are estimated for portfolios of loans with similar financial characteristics, primarily fixed and adjustable rate interest terms. The fair values of fixed rate mortgage loans are based on discounted cash flows utilizing applicable risk-adjusted spreads relative to the market pricing of similar fixed rate loans, as well as anticipated repayment schedules as of December 31, 2007 and 2006 respectively. The fair values of adjustable rate commercial loans are based on the estimated discounted cash flows as of the year ends of 2007 and 2006 utilizing the discount rates that approximate the pricing of loans collateralized by similar commercial properties. The estimated fair values are net of allowance for loan losses.
The fair values of nonperforming loans at December 31, 2007 and 2006 were not estimated because it is not practicable to reasonably assess the fair value in the marketplace for such loans.
Loans Held for Sale - Similar fair valuation as to Loans Receivable-Net. Fair values are estimated for portfolios of loans with similar financial characteristics, primarily fixed and adjustable rate interest terms. The fair values of fixed rate mortgage loans are based on discounted cash flows utilizing applicable risk-adjusted spreads relative to the current pricing of similar fixed rate loans, as well as anticipated repayment schedules. The fair value of adjustable rate commercial loans is based on the estimated discounted cash flows utilizing the discount rates that approximate the pricing of loans collateralized by similar commercial properties.
Cash Surrender Value of Life Insurance - The carrying amounts approximate fair value since the carrying amount represents the cash surrender value.
Federal Home Loan Bank Stock - The carrying amounts approximate fair value, as the stock may be sold back to the FHLB at the carrying value.
Accrued Interest Receivable - The carrying amount of accrued interest receivable approximates its fair value due to the short-term nature of this asset.
Servicing Asset - The fair value of the servicing asset is based on the present value of the contractually specified servicing fee, net of servicing cost, for the estimated life of the loans sold, based upon approximate prepayment speed, discounted by the effective interest rate.
Deposits - The fair values of nonmaturity deposits are equal to the carrying values of such deposits. Nonmaturity deposits include noninterest-bearing demand deposits, savings accounts, super NOW accounts, and money market demand accounts. Discounted cash flows have been used to value term deposits, such as CDs. The discount rate used is based on interest rates currently being offered by the Company on comparable deposits as to amount and term. The carrying amount of accrued interest payable approximates its fair value.
Junior Subordinated Debentures and Federal Home Loan Bank Borrowings - The fair value of debt is based on discounted cash flows. The discount rate used is based on the current market rate.
Accrued Interest Payable - The carrying amount of accrued interest payable approximates its fair value due the short-term nature of this liability.
Loan Commitments and Standby Letters of Credit - The fair value of loan commitments and standby letters of credit is based upon the difference between the current value of similar loans and the price at which the Company has committed to make the loans. The fair value of loan commitments and standby letters of credit is not material at December 31, 2007 and 2006.
Due from Customer on Acceptances and Acceptances Outstanding - The carrying amount approximates fair value due to the short-term maturities of these instruments.
The fair value estimates presented herein are based on pertinent information available to management at December 31, 2007 and 2006. Although management is not aware of any factors that would significantly affect the estimated fair value amounts, such amounts have not been comprehensively revalued for purposes of these financial statements since that date, and therefore, current estimates of fair value may differ significantly from the amounts presented herein.
The following is a reconciliation of the numerators and denominators of the basic and diluted per share computations at December 31, 2007, 2006 and 2005:
| | | 2007 | | 2006 | | 2005 | |
Numerator: Net income - numerator for basic earnings per share and diluted earnings per share- income available to common stockholders | | $ | 26,806,218 | | $ | 33,941,659 | | $ | 27,759,649 | |
Denominator: Denominator for basic earnings per share: Weighted-average shares | | | 29,339,454 | | | 28,986,217 | | | 28,544,474 | |
Effect of dilutive securities: Stock option dilution1 | | | 109,757 | | | 344,515 | | | 369,068 | |
Denominator for diluted earnings per share: Adjusted weighted-average shares And assumed conversions | | | 29,449,211 | | | 29,330,732 | | | 28,913,542 | |
| Basic earnings per share | | $ | 0.91 | | $ | 1.17 | | $ | 0.97 | |
| Diluted earnings per share | | $ | 0.91 | | $ | 1.16 | | $ | 0.96 | |
19. QUARTERLY FINANCIAL DATA (UNAUDITED)
Summarized quarterly financial data follows:
| | | Three Months Ended | |
| | | Mar 31 | | Jun 30 | | Sep 30 | | Dec 31 | | Total | |
2007 | | (Dollars in Thousands, except Per Share Amounts) | |
| | | | | | | | | | | | |
| Net interest income | | | $18,973 | | | $20,916 | | | $20,938 | | | $20,523 | | | $81,350 | |
| Provision for loan losses | | | 1,630 | | | 4,500 | | | 4,100 | | | 4,750 | | | 14,980 | |
| Net income | | | 7,317 | | | 7,346 | | | 6,644 | | | 5,499 | | | 26,806 | |
| Basic earnings per common share | | | 0.25 | | | 0.25 | | | 0.23 | | | 0.18 | | | 0.91 | |
| Diluted earnings per common share | | | 0.25 | | | 0.25 | | | 0.23 | | | 0.18 | | | 0.91 | |
| | | | | | | | | | | | | | | | | |
2006 | | | | | | | | | | | | | | | | |
| | | | | | | | | | | | | | | | | |
| Net interest income | | | $17,279 | | | $19,438 | | | $20,103 | | | $19,757 | | | $76,577 | |
| Provision for loan losses | | | 1,060 | | | 1,200 | | | 2,800 | | | 940 | | | 6,000 | |
| Net income | | | 7,823 | | | 8,415 | | | 8,818 | | | 8,886 | | | 33,942 | |
| Basic earnings per common share | | | 0.27 | | | 0.29 | | | 0.30 | | | 0.31 | | | 1.17 | |
| Diluted earnings per common share | | | 0.27 | | | 0.29 | | | 0.30 | | | 0.30 | | | 1.16 | |
| | | | | | | | | | | | | | | | | |
6 Excludes 348,000, 162,000 and 4,000 options outstanding at December 31, 2007, 2006 and 2005, respectively, for which the exercise price exceeded the average market price of the Company’s common stock.
20. | BUSINESS SEGMENT INFORMATION |
The following disclosure about segments of the Company is made in accordance with the requirements of SFAS No. 131, Disclosures about Segments of an Enterprise and Related Information. The Company segregates its operations into three primary segments: Banking Operations, Trade Finance Services (“TFS”), and Small Business Administration Lending Services. The Company determines the operating results of each segment based on an internal management system that allocates certain expenses to each segment.
Banking Operations - The Company provides lending products, including commercial, installment and real estate loans, to its customers.
Trade Finance Services - The Trade Finance department allows the Company’s import/export customers to handle their international transactions. Trade finance products include, among others, the issuance and collection of letters of credit, international collection and import/export financing.
Small Business Administration (“SBA”) Lending Services - The SBA department mainly provides customers of the Company access to the U.S. SBA-guaranteed lending program.
The following are the results of operations of the Company’s segments for the year-ended December 31:
2007 | | Business Segment | | | |
| (Dollars in Thousands) | | Banking | | | | | | | |
| | | Operations | | TFS | | SBA | | Company | |
| | | | | | | | | | |
| Net interest income | | $ | 61,285 | | $ | 3,212 | | $ | 16,853 | | $ | 81,350 | |
| Less provision for loan losses | | 9,133 | | | 3,440 | | | 2,407 | | | 14,980 | |
| Other operating income | | | 13,122 | | | 1,268 | | | 8,194 | | | 22,584 | |
| Net revenue | | | 65,274 | | | 1,040 | | | 22,640 | | | 88,954 | |
| Other operating expenses | | | 39,009 | | | 1,055 | | | 4,775 | | | 44,839 | |
| Income before taxes | | $ | 26,265 | | $ | (15 | ) | $ | 17,865 | | $ | 44,115 | |
| Total assets | | $ | 1,994,323 | | $ | 48,727 | | $ | 153,655 | | $ | 2,196,705 | |
2006 | | Business Segment | | | |
| (Dollars in Thousands) | | Banking | | | | | | | |
| | | Operations | | TFS | | SBA | | Company | |
| | | | | | | | | | |
| Net interest income | | $ | 55,769 | | $ | 4,176 | | $ | 16,632 | | $ | 76,577 | |
| Less provision for loan losses | | 4,404 | | | 1,254 | | | 342 | | | 6,000 | |
| Other operating income | | | 12,064 | | | 1,618 | | | 12,718 | | | 26,400 | |
| Net revenue | | | 63,429 | | | 4,540 | | | 29,008 | | | 96,977 | |
| Other operating expenses | | | 35,045 | | | 1,016 | | | 5,171 | | | 41,232 | |
| Income before taxes | | $ | 28,384 | | $ | 3,524 | | $ | 23,837 | | $ | 55,745 | |
| Total assets | | $ | 1,818,580 | | $ | 56,117 | | $ | 133,787 | | $ | 2,008,484 | |
2005 | | Business Segment | | | |
| (Dollars in Thousands) | | Banking | | | | | | | |
| | | Operations | | TFS | | SBA | | Company | |
| | | | | | | | | | |
| Net interest income | | $ | 45,181 | | $ | 3,203 | | $ | 14,564 | | $ | 62,948 | |
| Less provision for loan losses | | 3,365 | | | (264 | ) | | 249 | | | 3,350 | |
| Other operating income | | | 9,570 | | | 1,816 | | | 9,092 | | | 20,478 | |
| Net revenue | | | 51,386 | | | 5,283 | | | 23,407 | | | 80,076 | |
| Other operating expenses | | | 27,916 | | | 926 | | | 4,721 | | | 33,563 | |
| Income before taxes | | $ | 23,470 | | $ | 4,357 | | $ | 18,686 | | $ | 46,513 | |
| Total assets | | $ | 1,450,342 | | $ | 56,419 | | $ | 159,512 | | $ | 1,666,273 | |
21. RELATED PARTIES TRANSACTION
The Company, in the normal course of business has paid, and to the extent permitted by applicable regulations and other regulatory restrictions and expects to continue to pay the loan referral fees to affiliates of one of the Company’s officers. Such fees were approximately $657,000 and $1.3 million for the fiscal years 2007 and 2006, respectively, and have been paid from loan fees collected from the borrowers. All such transactions are and will continue to be on terms no less favorable to the Company than those which could be obtained with non-affiliated parties. Management believes that such loans were made in the ordinary course of business, on substantially the same terms, including interest rates and collateral, as those prevailing at the time for comparable transactions with other parties and do not involve more than the normal risk of collectibility or present other unfavorable features.
22. CONDENSED FINANCIAL STATEMENTS OF PARENT COMPANY
The following presents the unconsolidated financial statements of only the parent company, Wilshire Bancorp, Inc., as of December 31:
STATEMENTS OF FINANCIAL CONDITION | | 2007 | | 2006 | |
| | (in Thousands) | |
| Assets: | | | | | |
| Cash and cash equivalents | | $ | 18,013 | | $ | 2,049 | |
| Investment in subsidiary | | | 230,473 | | | 199,094 | |
| Prepaid income taxes | | | 2,224 | | | 1,601 | |
| Other assets | | | 71 | | | 40 | |
| Total assets | | $ | 250,781 | | $ | 202,784 | |
| | | | | | | | |
| Liabilities: | | | | | | | |
| Other borrowings | | $ | 77,321 | | $ | 51,547 | |
| Accounts payable and other liabilities | | | 212 | | | 142 | |
| Cash dividend payable | | | 1,462 | | | 1,460 | |
| Total liabilities | | | 78,995 | | | 53,149 | |
| Shareholders' Equity | | | 171,786 | | | 149,635 | |
| Total | | $ | 250,781 | | $ | 202,784 | |
| | | 2007 | | 2006 | | 2005 | |
STATEMENTS OF OPERATIONS | | (in Thousands) | |
| Interest expense | | $ | 4,603 | | $ | 3,506 | | $ | 2,054 | |
| Other operating expense | | | 883 | | | 885 | | | 270 | |
| Total expense | | | 5,486 | | | 4,391 | | | 2,324 | |
| Other income | | | 138 | | | - | | | - | |
| Undistributed earnings of subsidiary | | | 29,905 | | | 36,487 | | | 29,107 | |
| Earnings before income tax provision | | | 24,557 | | | 32,096 | | | 26,783 | |
| Income tax benefit | | | 2,249 | | | 1,846 | | | 977 | |
| Net Income | | $ | 26,806 | | $ | 33,942 | | $ | 27,760 | |
| | | | | | | | | | | |
| | | | | | | | | | | |
| STATEMENTS OF CASH FLOWS | | | 2007 | | | 2006 | | | 2005 | |
| | | (in Thousands) | |
| Cash flows from operating activities: | | | | | | | | | | |
| Net income | | $ | 26,806 | | $ | 33,942 | | $ | 27,760 | |
| Adjustments to reconcile net earnings to net cash | | | | | | | | | | |
| used in operating activities: | | | | | | | | | | |
| Increase (decrease) in accounts payable and | | | | | | | | | | |
| other liabilities | | | 70 | | | 14 | | | 97 | |
| Stock compensation expense | | | 348 | | | 472 | | | - | |
| Decrease (increase) in prepaid income taxes | | | (623 | ) | | 1,309 | | | (2,910 | ) |
| Tax benefit from exercise of stock options | | | (1,286 | ) | | (899 | ) | | 1,933 | |
| Increase in other assets | | | (31 | ) | | (40 | ) | | - | |
| Undistributed earnings of subsidiary | | | (28,619 | ) | | (35,588 | ) | | (29,107 | ) |
| Net cash used in operating activities | | | (3,335 | ) | | (790 | ) | | (2,227 | ) |
| | | | | | | | | | | |
| Cash flows from investing activities: | | | | | | | | | | |
| Payments for investments in and advances to subsidiary | | | (774 | ) | | - | | | (15,083 | ) |
| Cash payment for acquisition of Liberty Bank of New York | | | - | | | (9,217 | ) | | - | |
| Net cash used in investing activities | | | (774 | ) | | (9,217 | ) | | (15,083 | ) |
| | | | | | | | | | | |
| Cash flows from financing activities: | | | | | | | | | | |
| Proceeds from the issuance of trust preferred securities | | | 25,774 | | | - | | | 36,083 | |
| Proceeds from exercise of stock options | | | 138 | | | 474 | | | 480 | |
| Tax benefit from exercise of stock options | | | 1,286 | | | 899 | | | - | |
| Cash paid to acquire treasury stock | | | (1,262 | ) | | - | | | - | |
| Payments of cash dividend | | | (5,863 | ) | | (5,497 | ) | | (3,429 | ) |
| Net cash provided by (used in) financing activities | | | 20,073 | | | (4,124 | ) | | 33,134 | |
| Net (decrease) increase in cash and cash equivalents | | | 15,964 | | | (14,131 | ) | | 15,824 | |
| Cash and cash equivalents, beginning of year | | | 2,049 | | | 16,180 | | | 356 | |
| Cash and cash equivalents, end of year | | $ | 18,013 | | $ | 2,049 | | $ | 16,180 | |
***********************