 U.S. Crop Nutrient Demand Outlook Recovery and Moderate Growth Prospects Dr. Michael R. Rahm Vice President Market and Strategic Analysis IFA Fertilizer Demand Meeting Paris, France May 31, 2010 |
 1 May 31, 2010 IFA Fertilizer Demand Meeting Safe Harbor Statement This presentation contains forward-looking statements within the meaning of the Private Securities Litigation Reform Act of 1995. Such statements include, but are not limited to, statements about future financial and operating results. Such statements are based upon the current beliefs and expectations of The Mosaic Company’s management and are subject to significant risks and uncertainties. These risks and uncertainties include but are not limited to the predictability and volatility of, and customer expectations about, agriculture, fertilizer, raw material, energy and transportation markets that are subject to competitive and other pressures and the effects of the current economic and financial turmoil; the level of inventories in the distribution channels for crop nutrients; changes in foreign currency and exchange rates; international trade risks; changes in government policy; changes in environmental and other governmental regulation, including greenhouse gas regulation; difficulties or delays in receiving, or increased costs of, necessary governmental permits or approvals; the effectiveness of our processes for managing our strategic priorities; adverse weather conditions affecting operations in Central Florida or the Gulf Coast of the United States, including potential hurricanes or excess rainfall; actual costs of asset retirement, environmental remediation, reclamation or other environmental regulation differing from management’s current estimates; accidents and other disruptions involving Mosaic’s operations, including brine inflows at its Esterhazy, Saskatchewan potash mine and other potential mine fires, floods, explosions, seismic events or releases of hazardous or volatile chemicals, as well as other risks and uncertainties reported from time to time in The Mosaic Company’s reports filed with the Securities and Exchange Commission. Actual results may differ from those set forth in the forward-looking statements. |
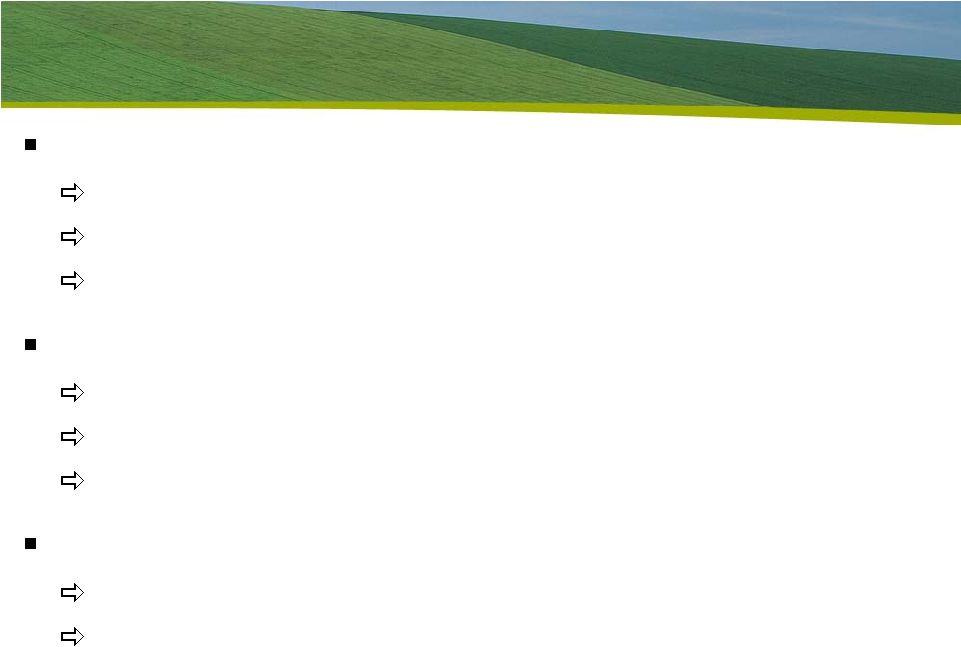
 2 May 31, 2010 IFA Fertilizer Demand Meeting Topics The Collapse of 2008/09: A Post Mortem The Recovery of 2009/10: A First Read Medium Term Outlook: Moderate Growth Prospects Positive agricultural outlook and farm economics Further increases in corn based ethanol production Crop-nutrient-using technical change |
 3 May 31, 2010 IFA Fertilizer Demand Meeting The Collapse of 2008/09: A Post Mortem No official statistics yet Large estimated declines especially in P&K use N: -5% to -7% P: -15% to -20% K: -35% to -40% Estimates based on: Unprecedented drop in domestic shipments 2008/09 statistics released by a few states Survey data Large drawdown of stocks in pipeline and farm field |
 4 May 31, 2010 IFA Fertilizer Demand Meeting 2008/09 Demand Collapse in Pictures 16 17 18 19 20 21 22 23 24 90 91 92 93 94 95 96 97 98 99 00 01 02 03 04 05 06 07 08 09E Fertilizer Year Ending June 30 U.S. Nutrient Use Source: AAPFCO and Mosaic 9.0 9.5 10.0 10.5 11.0 11.5 12.0 12.5 13.0 13.5 90 91 92 93 94 95 96 97 98 99 00 01 02 03 04 05 06 07 08 09E Fertilizer Year Ending June 30 U.S. Nitrogen Use Source: AAPFCO and Mosaic 2.25 2.75 3.25 3.75 4.25 4.75 5.25 5.75 90 91 92 93 94 95 96 97 98 99 00 01 02 03 04 05 06 07 08 09E Fertilizer Year Ending June 30 U.S. Potash Use Source: AAPFCO and Mosaic 3.00 3.25 3.50 3.75 4.00 4.25 4.50 4.75 5.00 90 91 92 93 94 95 96 97 98 99 00 01 02 03 04 05 06 07 08 09E Fertilizer Year Ending June 30 U.S. Phosphate Use Source: AAPFCO and Mosaic |
 5 IFA Fertilizer Demand Meeting May 31, 2010 IFA Fertilizer Demand Meeting Collapse in NA Phosphate Shipments and Use U.S. DAP/MAP shipments were less than the minimum of the five-year range in 8 months of 12 months during the 2008/09 fertilizer year. Shipments were especially slow during traditionally strong shipment months such as Oct, Nov, Mar, Apr and May. We estimate that U.S. phosphate use declined 17% in 2008/09 due to a sharp drop in application rates. Inventory, production and trade statistics indicate that implied domestic shipments of DAP/MAP declined 37% or 2.9 million tons in 2008/09. 4.4 4.5 4.6 4.6 4.2 4.3 4.3 4.6 4.3 4.8 4.6 4.5 4.6 4.2 3.5 6.9 6.6 7.3 7.5 6.4 7.1 6.9 6.8 7.5 7.6 7.2 6.7 7.2 7.8 4.9 4.5 5.0 5.5 6.0 6.5 7.0 7.5 8.0 1.5 2.0 2.5 3.0 3.5 4.0 4.5 5.0 95 96 97 98 99 00 01 02 03 04 05 06 07 08 09E Mil Tons DAP/MAP Mil Tons P O U.S. Phosphate Use and DAP/MAP Shipments Source: AAPFCO, TFI and Mosaic Fertilizer Year Ending June 30 0.0 0.2 0.4 0.6 0.8 1.0 1.2 Jul Aug Sep Oct Nov Dec Jan Feb Mar Apr May Jun Mil Tons U.S. DAP and MAP Domestic Shipments MIN MAX Range (2003/04-2007/08) 2008/09 3-Yr Average Source: TFI 2 5 Phosphate Use (L) Estimated DAP/MAP Use (R) DAP/MAP Shipments (R) |
 6 May 31, 2010 IFA Fertilizer Demand Meeting Collapse in NA Potash Shipments and Use NA MOP monthly shipments trended downward throughout the 2008/09 fertilizer year. Implied May shipments of about 195,000 tons KCL were approximately 1.0 million tons less than the three- year average for this peak shipping month. We estimate that N.A. potash use declined 38% in 2008/09 due to a sharp drop in application rates. Inventory, production and trade statistics indicate that implied domestic shipments of MOP plunged 51% or more than 5.4 million tons in 2008/09. 5.5 5.6 5.8 5.7 5.4 5.3 5.3 5.3 5.3 5.9 5.5 5.1 5.6 5.0 3.1 10.6 10.5 11.2 12.1 10.3 10.4 10.4 10.3 10.6 11.8 11.2 8.8 11.3 10.7 5.3 5 6 7 8 9 10 11 12 13 0 1 2 3 4 5 6 7 8 95 96 97 98 99 00 01 02 03 04 05 06 07 08 09E Mil Tons KCL Mil Tons K O North America Potash Use and MOP Shipments Ag Use (L) Total Shipments (R) Estimated Use (R) Source: IPNI and Mosaic Fertilizer Year Ending June 30 0.0 0.2 0.4 0.6 0.8 1.0 1.2 1.4 1.6 Jul Aug Sep Oct Nov Dec Jan Feb Mar Apr May Jun Mil Tons KCL North America MOP Domestic Shipments MIN MAX Range (2003/04-2007/08) 2008/09 3-Yr Average Source: IPNI and Mosaic 2 |
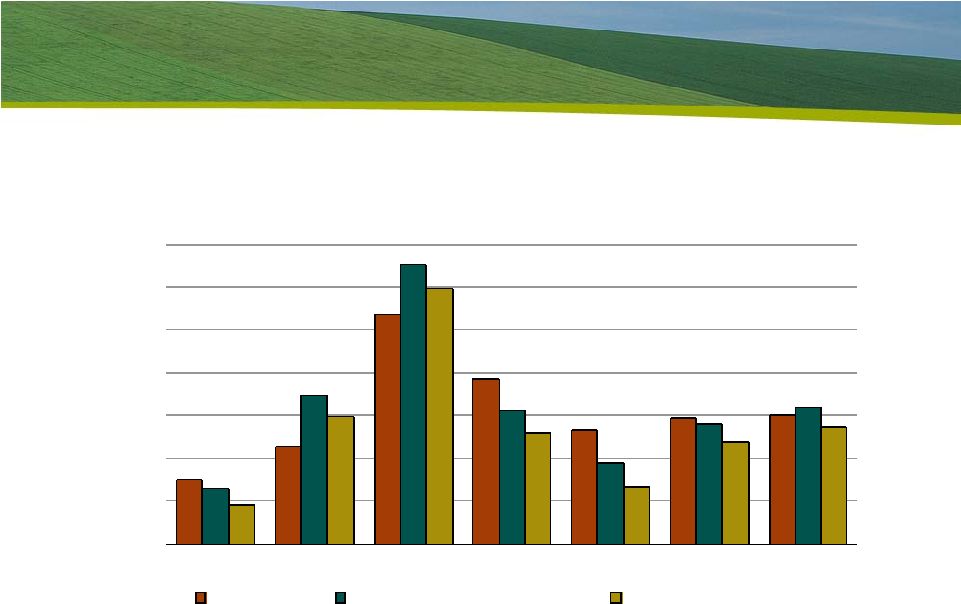
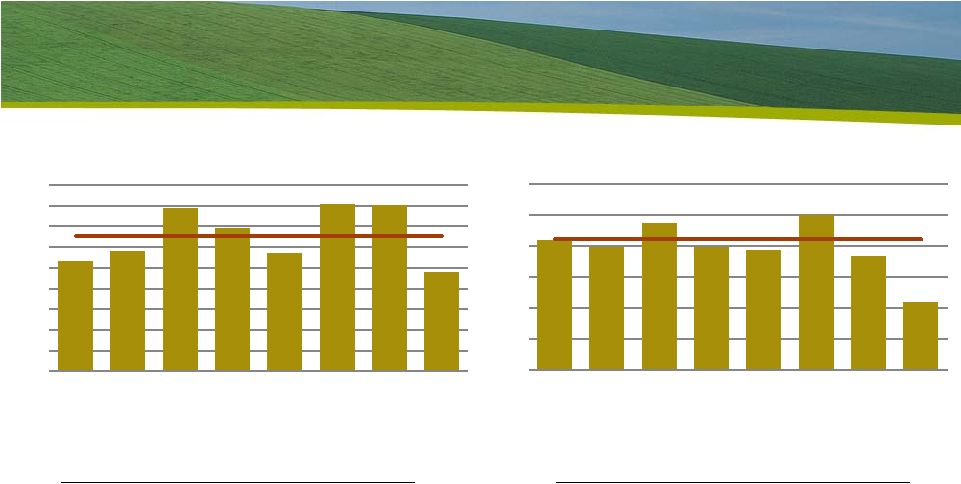 7 May 31, 2010 IFA Fertilizer Demand Meeting State Statistics Show a Large Drop in 2008/09 2008/09 Change from Five-year Average Total Shipments -25% Nitrogen -13% Phosphate -41% Potash -53% 2008/09 Change from Five-year Average Total Shipments -17% Nitrogen -7% Phosphate -35% Potash -36% 2.00 2.25 2.50 2.75 3.00 3.25 3.50 3.75 4.00 4.25 2002 2003 2004 2005 2006 2007 2008 2009 Mil Tons Iowa Fertilizer Sales Fertilizer Year Ending June 30 Source: Iowa Department of Agriculture Commercial Feed and Fertilizer Bureau 1.00 1.25 1.50 1.75 2.00 2.25 2.50 2002 2003 2004 2005 2006 2007 2008 2009 Mil Tons Missouri Fertilizer Sales Fertilizer Year Ending June 30 Source: Missouri Fertilizer/Ag Lime Control Service |
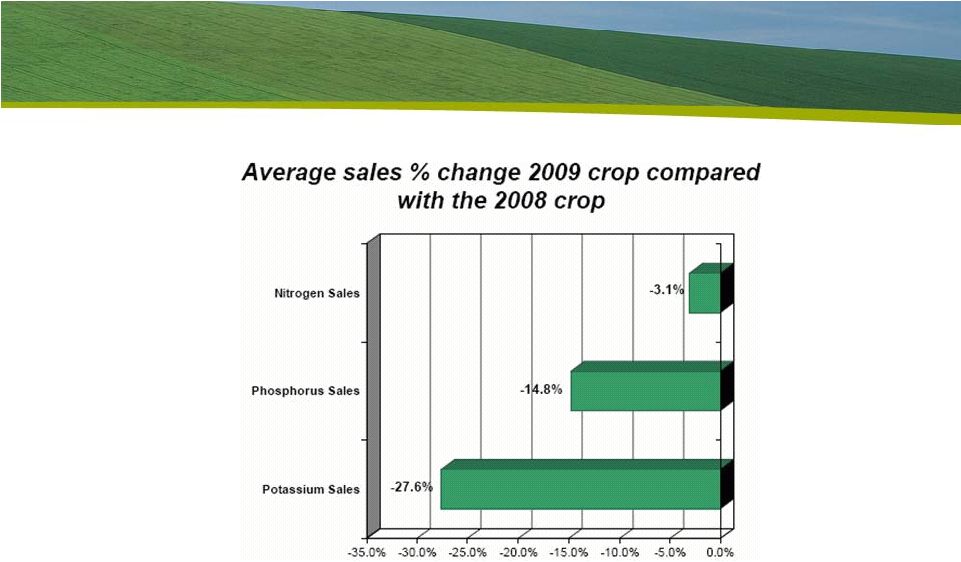 8 May 31, 2010 IFA Fertilizer Demand Meeting Survey Indicates a Large Decline in 2008/09 Source: IPNI and TFI. 2009 North American Retail Fertilizer Survey. |
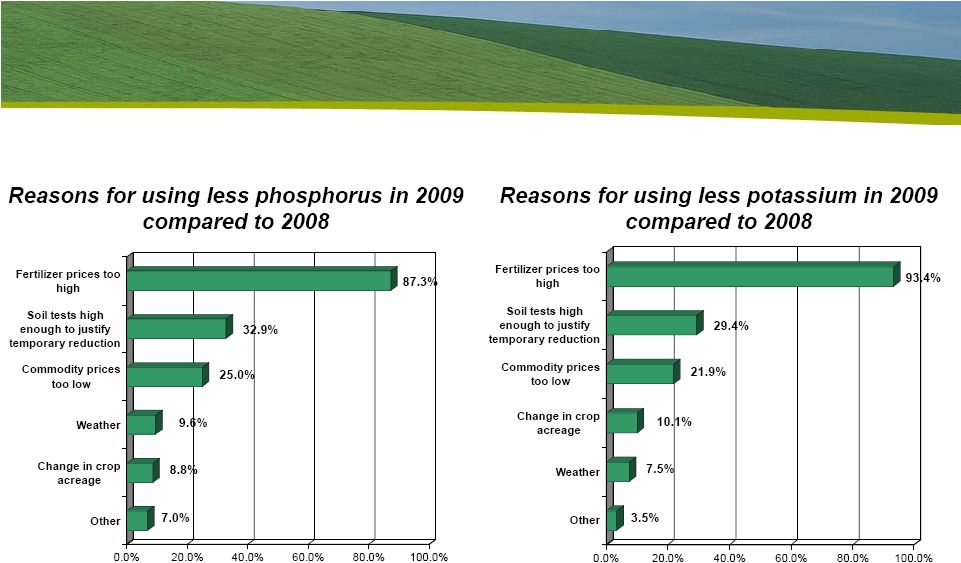 9 May 31, 2010 IFA Fertilizer Demand Meeting High Prices the Main Reason for Declines Source: IPNI and TFI. 2009 North American Retail Fertilizer Survey. |
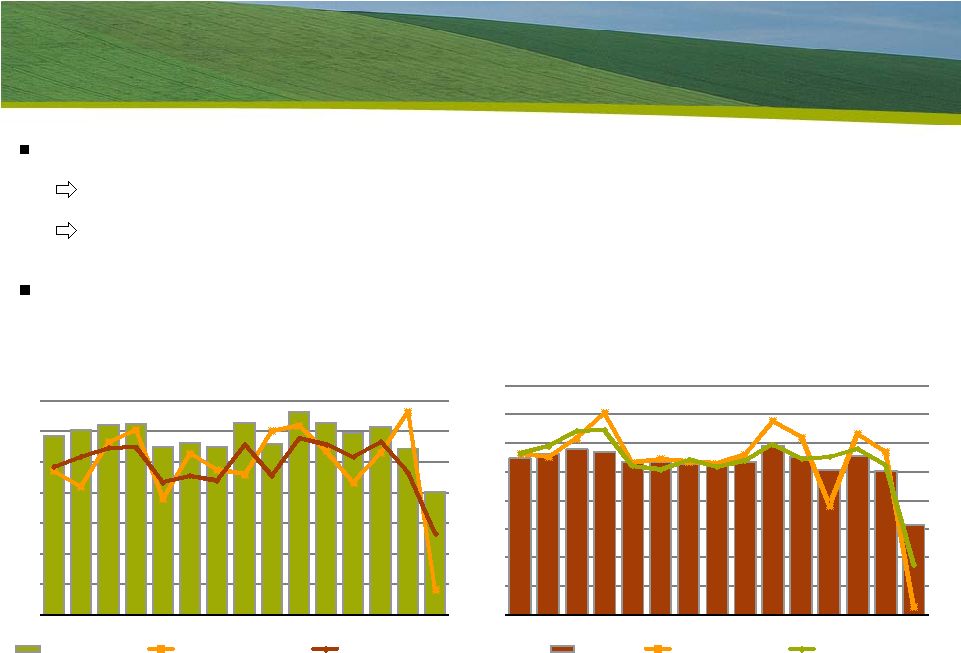 10 May 31, 2010 IFA Fertilizer Demand Meeting De-stocking From the Pipeline to Farm Field De-stocking of the distribution pipeline DAP/MAP: 800,000 to 1.0 million ton decline MOP: 1.4 to 1.6 million ton decline Crop removal exceeded P&K application 4.4 4.5 4.6 4.6 4.2 4.3 4.3 4.6 4.3 4.8 4.6 4.5 4.6 4.2 3.5 6.9 6.6 7.3 7.5 6.4 7.1 6.9 6.8 7.5 7.6 7.2 6.7 7.2 7.8 4.9 4.5 5.0 5.5 6.0 6.5 7.0 7.5 8.0 1.5 2.0 2.5 3.0 3.5 4.0 4.5 5.0 95 96 97 98 99 00 01 02 03 04 05 06 07 08 09E Mil Tons DAP/MAP Mil Tons U.S. Phosphate Use and DAP/MAP Shipments Phosphate Use (L) DAP/MAP Shipments (R) Estimated DAP/MAP Use (R) Source: AAPFCO, TFI and Mosaic Fertilizer Year Ending June 30 5.5 5.6 5.8 5.7 5.4 5.3 5.3 5.3 5.3 5.9 5.5 5.1 5.6 5.0 3.1 10.6 10.5 11.2 12.1 10.3 10.4 10.4 10.3 10.6 11.8 11.2 8.8 11.3 10.7 5.3 5 6 7 8 9 10 11 12 13 0 1 2 3 4 5 6 7 8 95 96 97 98 99 00 01 02 03 04 05 06 07 08 09E Mil Tons KCL Mil Tons North America Potash Use and MOP Shipments Ag Use (L) Total Shipments (R) Estimated Use (R) Source: IPNI and Mosaic Fertilizer Year Ending June 30 P O K O 2 2 5 |
 11 May 31, 2010 IFA Fertilizer Demand Meeting Topics The Collapse of 2008/09: A Post Mortem The Recovery of 2009/10: A First Read Medium Term Outlook: Moderate Growth Prospects Positive agricultural outlook and farm economics Further increases in corn based ethanol production Crop-nutrient-using technical change |
 12 May 31, 2010 IFA Fertilizer Demand Meeting The Recovery of 2009/10: A First Read Demand recovery N: +5% to +7% P: +17% to +22% K: +35% to +40% Estimates based on: Strong rebound in domestic shipments Good to ideal weather this spring Anecdotal reports from customers Cautious distributors and a de-stocked pipeline Just-in-time inventory No-price-established (NPE) contracts or consignment |
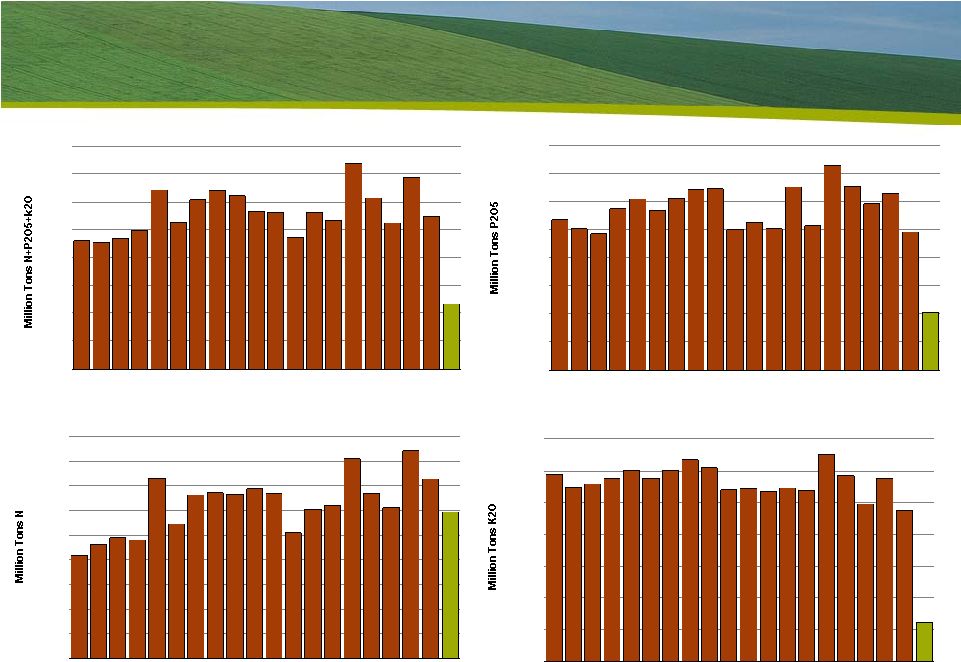
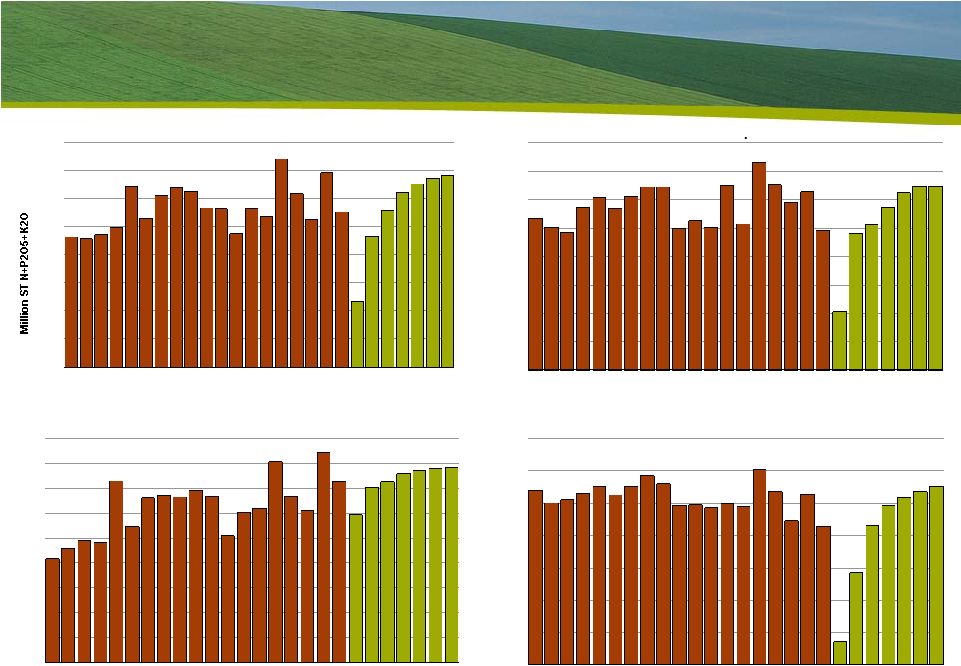
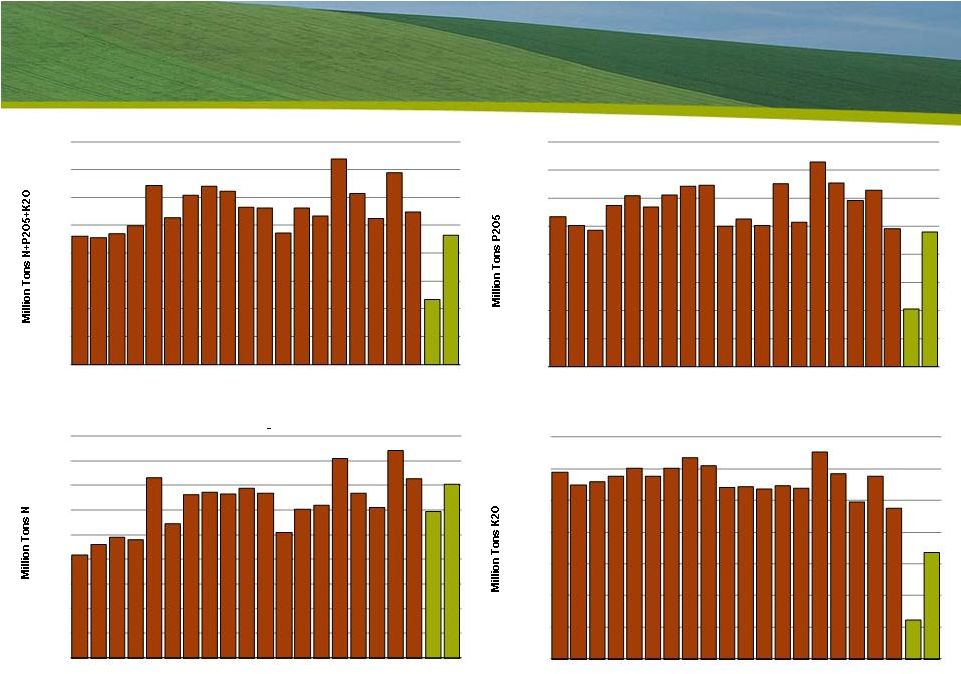 2009/10 Demand Recovery in Pictures 16 17 18 19 20 21 22 23 24 90 91 92 93 94 95 96 97 98 99 00 01 02 03 04 05 06 07 08 09E10F Million Tons N+P2O5+K2O Fertilizer Year Ending June 30 U.S. Nutrient Use Source: AAPFCO and Mosaic 3.00 3.25 3.50 3.75 4.00 4.25 4.50 4.75 5.00 90 91 92 93 94 95 96 97 98 99 00 01 02 03 04 05 06 07 08 09E10F Million Tons P2O5 Fertilizer Year Ending June 30 U.S. Phosphate Use Source: AAPFCO and Mosaic 9.0 9.5 10.0 10.5 11.0 11.5 12.0 12.5 13.0 13.5 90 91 92 93 94 95 96 97 98 99 00 01 02 03 04 05 06 07 08 09E10F Million Tons N Fertilizer Year Ending June 30 U.S. Nitrogen Use Source: AAPFCO and Mosaic 2.25 2.75 3.25 3.75 4.25 4.75 5.25 5.75 90 91 92 93 94 95 96 97 98 99 00 01 02 03 04 05 06 07 08 09E10F Million Tons K2O Fertilizer Year Ending June 30 U.S. Potash Use Source: AAPFCO and Mosaic 13 May 31, 2010 IFA Fertilizer Demand Meeting |
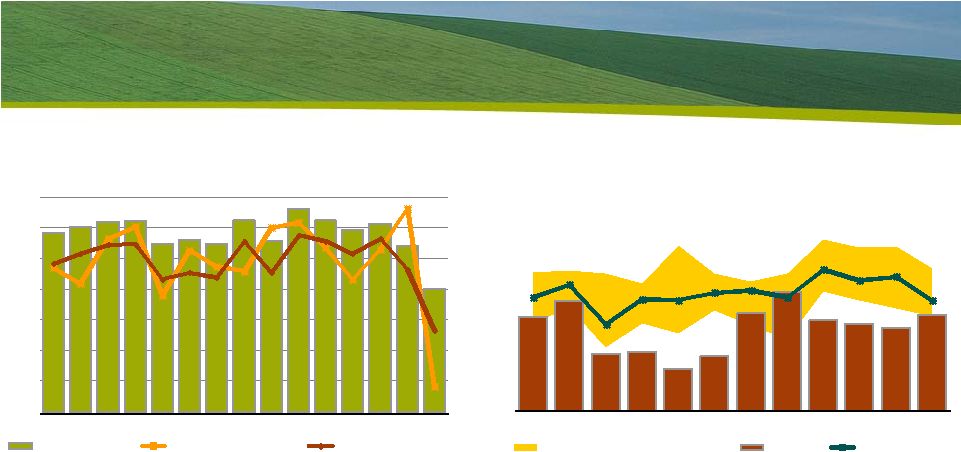
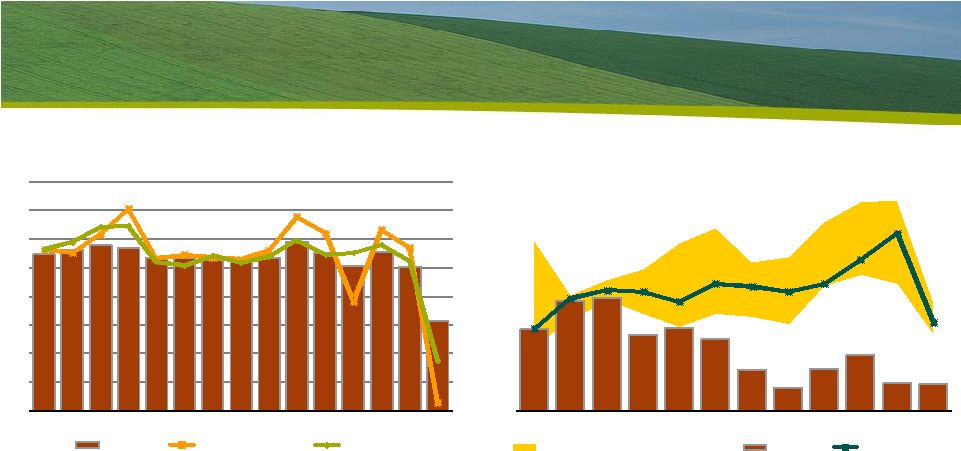
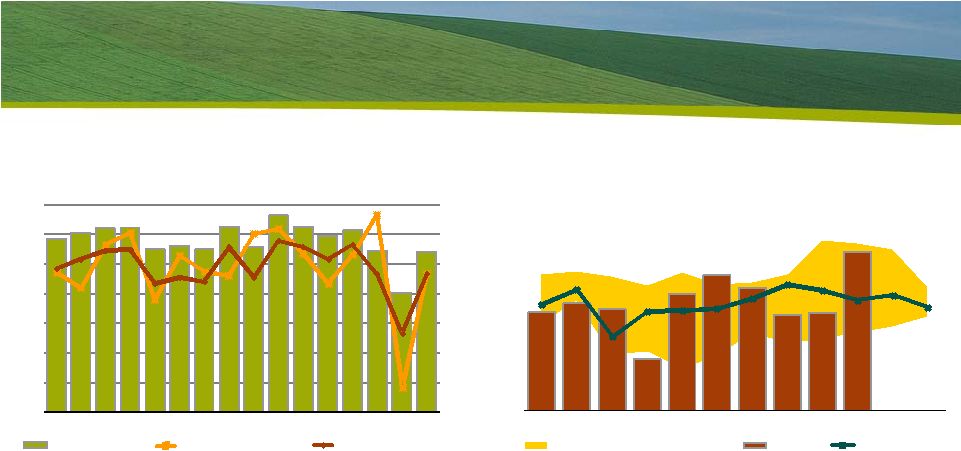 14 May 31, 2010 IFA Fertilizer Demand Meeting DAP/MAP Shipments Up 49% So Far This Year U.S. DAP/MAP shipments surged in April reflecting strong farm demand. Year-to-date (Jul-Apr) shipments totaled 5.9 million tons, up 49% from the low levels a year earlier. Shipments are projected to rebound 39% to 6.8 million tons this fertilizer year or 96% of the 10-year Olympic average of 7.1 million tons (an Olympic average excludes the low and high during the last 10 years). Buyers remain cautious and distribution pipeline inventories are projected to remain at low levels. The spring season is winding down and focus will begin to shift to summer fill programs. 4.4 4.5 4.6 4.6 4.2 4.3 4.3 4.6 4.3 4.8 4.6 4.5 4.6 4.2 3.5 4.2 6.9 6.6 7.3 7.5 6.4 7.1 6.9 6.8 7.5 7.6 7.2 6.7 7.2 7.8 4.9 6.8 4.5 5.0 5.5 6.0 6.5 7.0 7.5 8.0 1.5 2.0 2.5 3.0 3.5 4.0 4.5 5.0 95 96 97 98 99 00 01 02 03 04 05 06 07 08 09E Mil Tons DAP/MAP Mil Tons P 2 O 5 U.S. Phosphate Use and DAP/MAP Shipments Phosphate Use (L) DAP/MAP Shipments (R) Estimated DAP/MAP Use (R) Source: AAPFCO, TFI and Mosaic Fertilizer Year Ending June 30 0.0 0.2 0.4 0.6 0.8 1.0 1.2 Jul Aug Sep Oct Nov Dec Jan Feb Mar Apr May Jun Mil Tons U.S. DAP and MAP Domestic Shipments MIN MAX Range (2004/05-2008/09) 2009/10 3-Yr Average Source: TFI |
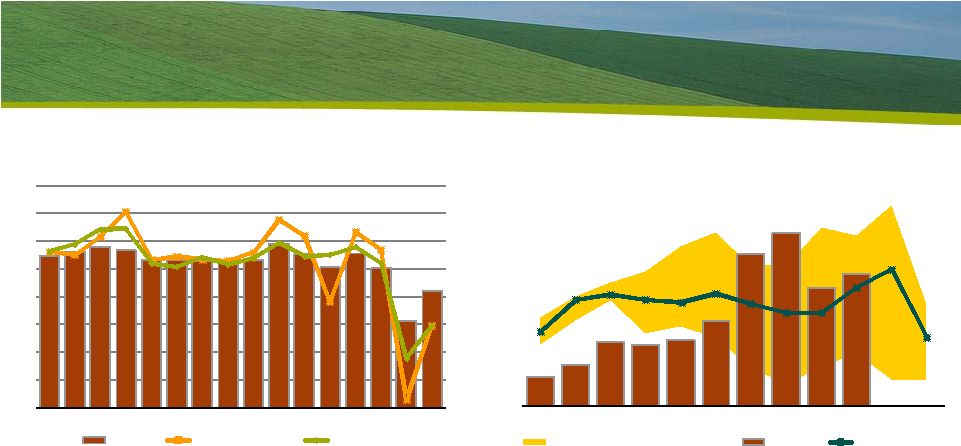 15 May 31, 2010 IFA Fertilizer Demand Meeting MOP Shipments Up 39% So Far This Year MOP domestic shipments exceeded three-year averages for the first four months of 2010. In fact, MOP shipments in Q1 were up 340% or 2.5 million tons from the low level a year earlier. Shipments increased 12% in April reflecting strong farm demand. Fertilizer year-to-date (July- April) shipments now total 6.8 million tons KCL, up 39% from anemic level a year earlier. MOP shipments are projected to rebound 51% to almost 8.0 million tons this fertilizer year, but that still is the second lowest total during the modern era of production agriculture and roughly three-quarters of the 10-year Olympic average of 10.5 million tons. 5.5 5.6 5.8 5.7 5.4 5.3 5.3 5.3 5.3 5.9 5.5 5.1 5.6 5.0 3.1 4.2 10.6 10.5 11.2 12.1 10.3 10.4 10.4 10.3 10.6 11.8 11.2 8.8 11.3 10.7 5.3 8.0 5 6 7 8 9 10 11 12 13 0 1 2 3 4 5 6 7 8 95 96 97 98 99 00 01 02 03 04 05 06 07 08 09E 10F Mil Tons KCL Mil Tons K O North America Potash Use and MOP Shipments Ag Use (L) Total Shipments (R) Estimated Use (R) Source: IPNI and Mosaic Fertilizer Year Ending June 30 2 0.0 0.2 0.4 0.6 0.8 1.0 1.2 1.4 1.6 Jul Aug Sep Oct Nov Dec Jan Feb Mar Apr May Jun Mil Tons KCL North America MOP Domestic Shipments MIN MAX Range (2004/05-2008/09) 2009/10 3-Yr Average Source: IPNI and Mosaic |
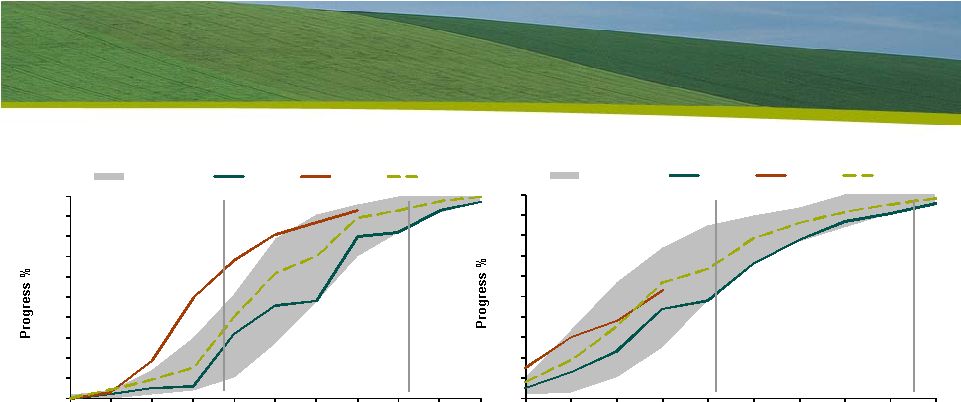 16 May 31, 2010 IFA Fertilizer Demand Meeting An Early Spring Supports Demand Recovery 0 10 20 30 40 50 60 70 80 90 100 02 09 16 23 30 06 13 20 27 04 Report Week Ending (Sunday) U.S. Soybean Planting Progress 10 -yr Range 2009 2010 5-yr Avg May Jun 0 10 20 30 40 50 60 70 80 90 100 04 11 18 25 02 09 16 23 30 06 13 Report Week Ending (Sunday) U.S. Corn Planting Progress 10-yr Range 2009 2010 5-yr Avg Apr May Jun Almost 70% of the U.S. corn crop was planted by May 2 nd this year. Corn planting was 93% complete as of May 23 , up from 80% a year ago and up from the five-year average of 89% for this date. Soybean planting was 53% complete as of May 23 rd . That is up from 44% a year ago but down slightly from the five-year average of 57% for this date. rd |
 17 May 31, 2010 IFA Fertilizer Demand Meeting Topics The Collapse of 2008/09: A Post Mortem The Recovery of 2009/10: A First Read Medium Term Outlook: Moderate Growth Prospects Positive agricultural outlook and farm economics Further increases in corn based ethanol production Crop-nutrient-using technical change |
 18 May 31, 2010 IFA Fertilizer Demand Meeting Medium Term Outlook: Moderate Growth Prospects Positive agricultural outlook Recent stock build cushions a potential supply shock Steady demand growth vs. supply step changes High futures prices and solid farm economics Further increases in corn based ethanol production Energy Independence and Security Act of 2007 Expected production this decade Crop-nutrient-using technical change New seed technology Implications for the crop input bundle Forecasts |
 19 May 31, 2010 IFA Fertilizer Demand Meeting Stock Build Cushions a Potential Supply Shock 2010/11 Scenario Assumptions Low Medium High Harvested Area Change 1.5% 1.5% 1.5% Yield Deviation from Trend Largest Negative 0 Largest Positve Demand Growth 2.0% 2.5% 3.0% 40 50 60 70 80 90 100 110 120 250 300 350 400 450 500 550 600 650 00/01 01/02 02/03 03/04 04/05 05/06 06/07 07/08 08/09 09/10 10/11 10/11 10/11 10/11 L M H Days of Use Mil Tonnes World Grain and Oilseed Stocks Stocks Days of Use Source: USDA and Mosaic (for 10/11 L/M/H scenarios) |
 20 May 31, 2010 IFA Fertilizer Demand Meeting Steady Demand Growth vs. Supply Step Changes 2.0 2.1 2.2 2.3 2.4 2.5 2.6 2.7 2.8 00/01 01/02 02/03 03/04 04/05 05/06 06/07 07/08 08/09 09/10 10/11 10/11 10/11 L M 10/11 H Bil Tonnes World Grain and Oilseed Production and Use Production Use Source: USDA and Mosaic (for 10/11 L/M/H scenarios) |
 21 May 31, 2010 IFA Fertilizer Demand Meeting Record Harvested Area and Yields Required 2.4 2.5 2.6 2.7 2.8 2.9 3.0 3.1 780 800 820 840 860 880 900 920 00/01 01/02 02/03 03/04 04/05 05/06 06/07 07/08 08/09 09/10 10/11 10/11 10/11 10/11 L M H MT Ha Mil Ha World Grain and Oilseed Harvested Area and Yield Harvested Area Yield Trend Source: USDA and Mosaic (for 10/11 L/M/H scenarios) |
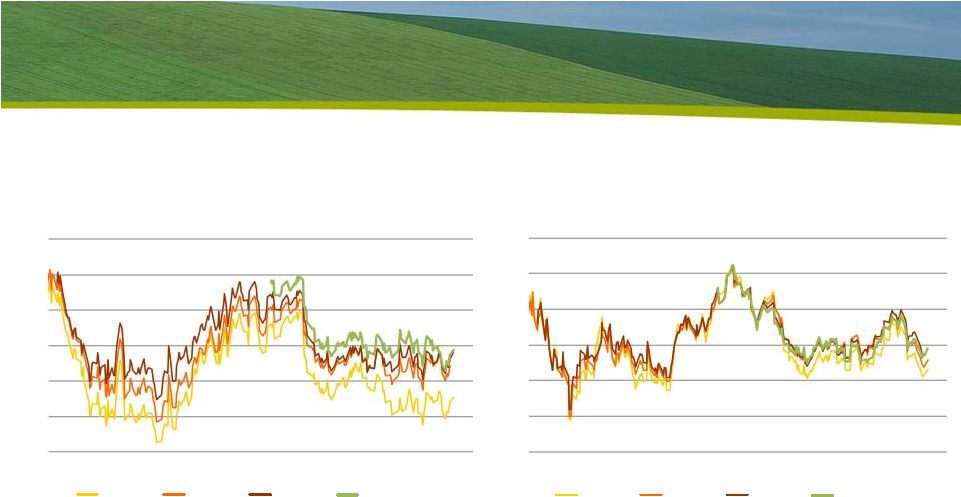 Still Strong Signals for the Next Three Years 3.50 3.75 4.00 4.25 4.50 4.75 5.00 Jun Jul Aug Sep Oct Nov Dec Jan Feb Mar Apr May Jun $ BU New Crop Corn Prices Daily Close of New Crop Options June 2, 2009 to May 24, 2010 Dec 2010 Dec 2011 Dec 2012 Dec 2013 8.00 8.50 9.00 9.50 10.00 10.50 11.00 Jun Jul Aug Sep Oct Nov Dec Jan Feb Mar Apr May Jun $ BU New Crop Soybean Prices Daily Close of New Crop Options June 2, 2009 to May 24, 2010 Nov 2010 Nov 2011 Nov 2012 Nov 2013 22 May 31, 2010 IFA Fertilizer Demand Meeting Source: CBOT Source: CBOT |
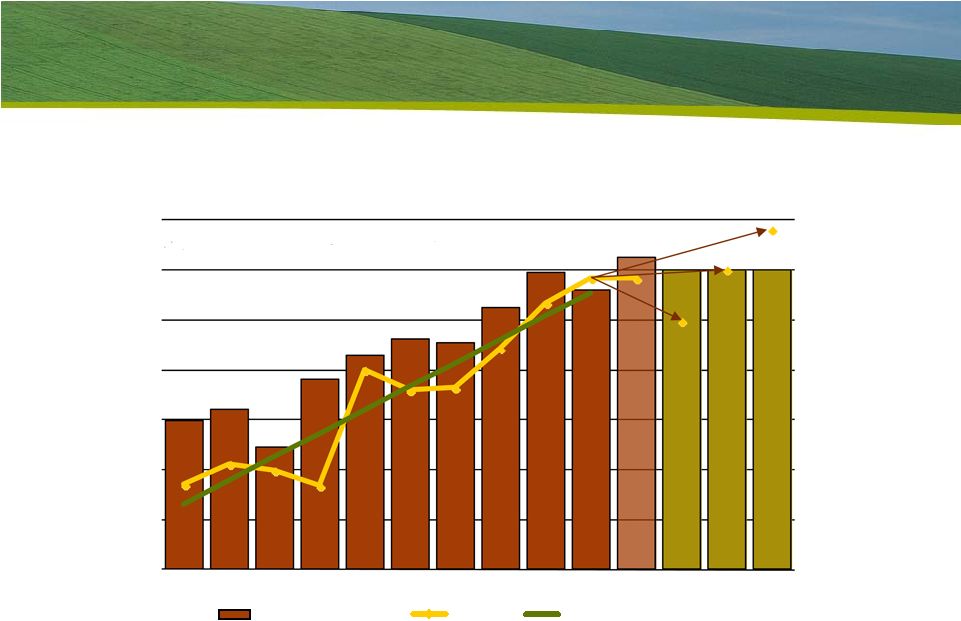
 23 May 31, 2010 IFA Fertilizer Demand Meeting Still Solid U.S. Midwest Farm Economics $0 $100 $200 $300 $400 $500 $600 $700 2005 2006 2007 2008 2009E 2010E 2011F $ Acre Source: Iowa State University and Mosaic Return After Variable Cost for a U.S. Midwest High Yield Farm Operation Soybean Corn Following Soybean Corn Following Corn |
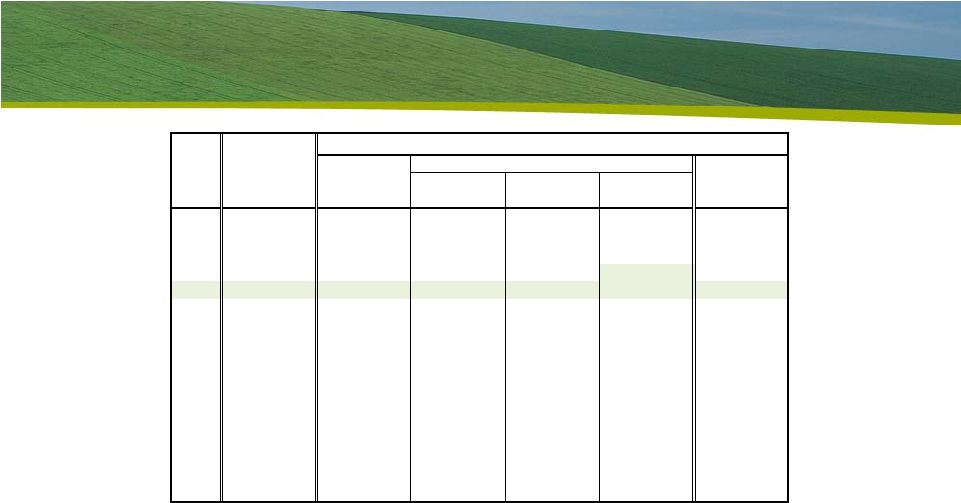 24 May 31, 2010 IFA Fertilizer Demand Meeting Renewable Fuel Standard U.S. Renewable Fuel Standard (bil gal) EISA 2007 RFS2 EPAct Total Advanced Biofuel Conventional 2005 Renewable Total or Total Less Year RFS1 Fuel Advanced Cellulosic Advanced 2006 4.00 na na na na na 2007 4.70 na na na na na 2008 5.40 9.00 na na na 9.00 2009 6.10 11.10 0.60 na 0.33 10.50 2010 6.80 12.95 0.95 0.01 0.82 12.00 2011 7.40 13.95 1.35 0.25 0.80 12.60 2012 7.50 15.20 2.00 0.50 1.00 13.20 2013 tbd 16.55 2.75 1.00 tbd 13.80 2014 tbd 18.15 3.75 1.75 tbd 14.40 2015 tbd 20.50 5.50 3.00 tbd 15.00 2016 tbd 22.25 7.25 4.25 tbd 15.00 2017 tbd 24.00 9.00 5.50 tbd 15.00 2018 tbd 26.00 11.00 7.00 tbd 15.00 2019 tbd 28.00 13.00 8.50 tbd 15.00 2020 tbd 30.00 15.00 10.50 tbd 15.00 2021 tbd 33.00 18.00 13.50 tbd 15.00 2022 tbd 36.00 21.00 16.00 tbd 15.00 Source: Energy Policy Act of 2005 (EPACT 2005) and Energy Independence and Security Act of 2007 (EISA 2007) EPA-420-F-10-007 and Mosaic estimate Biomass- Based Diesel A recent EPA rule adjusts the 2010 RFS to take into account the slower than expected development of cellulosic biofuels and set the requirement at just 6.5 million gallons this year versus the 100 million gallon benchmark. The ruling also set a RFS for biodiesel of 1.15 billion gallons for 2009 and 2010 combined. The overall RFS is 12.95 billion gallons this calendar year so all of this implies that at least 12.12 billion gallons of corn based ethanol will be needed for blending into U.S. gasoline supplies this calendar year. That would require about 4.33 billion bushels of corn if all was produced in the United States. |
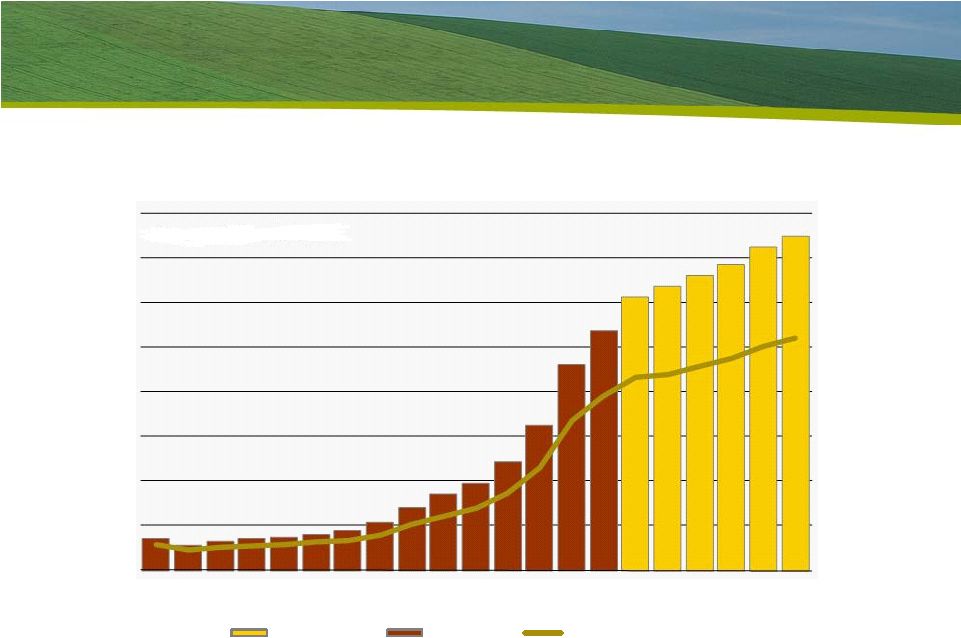 25 May 31, 2010 IFA Fertilizer Demand Meeting Ethanol Production Expected to Increase 0% 2% 4% 6% 8% 10% 12% 14% 16% 0 2 4 6 8 10 12 14 16 95 96 97 98 99 00 01 02 03 04 05 06 07 08 09 10 11 12 13 14 15 Percent Bil Gal Source: EIA and Mosaic U.S. Ethanol Production Forecast Actual Percent of Gasoline Use |
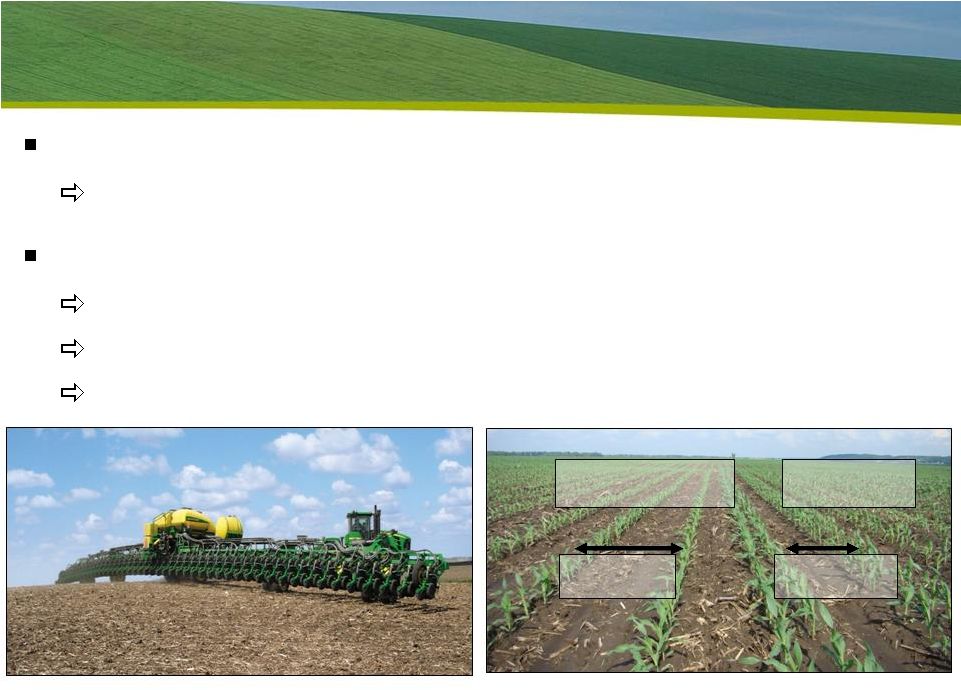 Crop-Nutrient-Using Technical Change New seed technology Traits to make plants thrive in high population environment Implications for the entire crop input bundle Equipment Crop protection chemicals Crop nutrients Twin Row Conventional 30 inches 20 inches 48-row planter capable of planting more than 1000 acres per day 26 May 31, 2010 IFA Fertilizer Demand Meeting |
 27 May 31, 2010 IFA Fertilizer Demand Meeting Medium Term Forecasts in Pictures 16 17 18 19 20 21 22 23 24 90 92 94 96 98 00 02 04 06 08 10F 12F 14F Fertilizer Year Ending June 30 U.S. Nutrient Use 9.0 9.5 10.0 10.5 11.0 11.5 12.0 12.5 13.0 13.5 90 91 92 93 94 95 96 97 98 99 00 01 02 03 04 05 06 07 08 09E10F11F12F13F14F15F Million Tons N Fertilizer Year Ending June 30 U.S. Nitrogen Use 3.00 3.25 3.50 3.75 4.00 4.25 4.50 4.75 5.00 90 91 92 93 94 95 96 97 98 99 00 01 02 03 04 05 06 07 08 09E10F11F12F13F14F15F Fertilizer Year Ending June 30 2.50 3.00 3.50 4.00 4.50 5.00 5.50 6.00 90 91 92 93 94 95 96 97 98 99 00 01 02 03 04 05 06 07 08 09E10F11F12F13F14F15F Fertilizer Year Ending June 30 Mil Tons P O U.S. Phosphate Use Mil Tons K O U.S. Potash Use 2 5 2 |
 U.S. Crop Nutrient Demand Outlook Recovery and Moderate Growth Prospects Dr. Michael R. Rahm Vice President Market and Strategic Analysis IFA Fertilizer Demand Meeting Paris, France May 31, 2010 Thank You! |