Exhibit 99.1

Vol. 1 No. 2
May 2005
Michael. R. Rahm
Vice President
mike.rahm@mosaicco.com
Joseph Fung
Market Analyst
joseph.fung@mosaicco.com
David Kruger
Associate Market Analyst
david.kruger@mosaicco.com
Stan Musial, the great St Louis Cardinal baseball player, once asked Yogi Berra, the Yankee legend who is equally famous for his command of the English language, about a neighborhood restaurant that suddenly had become popular in Yogi’s hometown of St Louis. Yogi advised, “Nobody goes there anymore. It’s too crowded.”
Potash analysts understand that statement. Potash, suddenly a white-hot commodity, has attracted a crowd from beyond the local analyst neighborhood. But unlike Yogi, we join the crowd to assess the outlook for the global potash market and provide an overview of the potash operations of The Mosaic Company.
Uncharted Territory
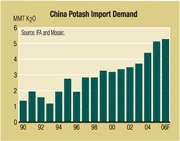
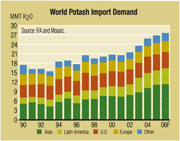
Surging demand has yanked potash prices into uncharted territory. Import demand has increased a remarkable 26 percent during the last three years, according to statistics published by the International Fertilizer Industry Association (IFA). That is equal to 8.8 million tonnes of product or 5.3 million tonnes of nutrient (K2O).
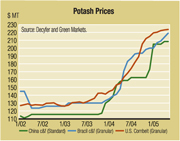
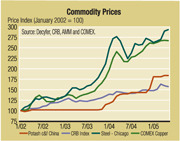
Potash prices have increased roughly 80 percent in major markets around the globe during the last two years. The jump in potash prices, however, is not greatly different from the increase in the index of commodity prices calculated by the Commodity Research Bureau (CRB). For example, the price of potash delivered to China has increased 84 percent since January 2002, according to prices published by Decyfer. The CRB index has increased 57 percent during the same period.
Potash prices, however, have increased significantly less than a number of other commodity prices, particularly those impacted by China’s seemingly insatiable appetite for raw materials. For example, steel and copper prices have increased 193 percent and 167 percent, respectively, since January 2002.
The China Factor
China has played the leading role in the tightening of the global potash market during the last two years. China has drawn down its large grain stocks and planners have begun to focus resources on boosting grain output through balanced nutrient use. That means more potash use.
Market Mosaic is a quarterly newsletter published for our customers and suppliers each February, May, August and November by the Market & Economic Analysis group of The Mosaic Company. The newsletter pieces together small tiles of information to create a picture of the market – a Market Mosaic, so to speak. The analysis draws on external sources of statistical information and from diverse internal resources that span both the globe as well as all links along the value chain. This issue ofMarket Mosaic assesses the potash outlook and provides an overview of the potash operations of The Mosaic Company.
| | | | |
| Market Mosaic Vol. 1, Issue 2 • May 2005 | | 1 | | |
China’s potash imports jumped 19 percent or almost 700,000 tonnes of nutrient last year. In addition, domestic production increased 70 percent or nearly 435,000 tonnes to almost 1.1 million tonnes of nutrient in 2004, according to IFA statistics.
Imports are projected to increase another 16 percent or 715,000 tonnes in 2005. That forecast looks on track so far this year. China customs statistics for the first quarter of 2005 showed that muriate of potash (MOP) imports were up 18 percent or 180,000 tonnes of nutrient from the same period a year earlier.
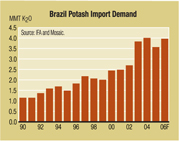
The recent jumps in potash shipments to other major importers such as Brazil, Indonesia and Malaysia are first derivatives of Chinese demand. Rapid economic growth has boosted China’s appetite for oilseeds and oilseed products from these major producers and exporters. China accounted for almost 30 percent of Brazil’s soybean exports last year and for one-half of the growth in soybean exports from Brazil during the last three years. Furthermore, China accounted for 35 percent of Brazil’s soybean oil exports in 2004 and for virtually all of the growth in soybean oil exports from Brazil during the last three years.
More Moderate Growth
After increasing at the torrid rate of 10 percent in 2003 and 2004, world import demand is forecast to grow at a more moderate rate of three percent in 2005 and 2006. That still would pull imports to a record 26.7 million tonnes of nutrient this year and 27.5 million tonnes next year.
Slower growth this year is largely the result of a decline in Brazilian imports. A combination of factors including the drop in soybean prices, sharp increases in farm input costs, the appreciation of the real and a serious drought in Rio Grande do Sul has eroded on-farm economics and dampened demand prospects this year.
That coupled with larger-than-normal carryover stocks caused imports to slow dramatically during the first quarter of 2005. Brazilian customs statistics for the first quarter indicated that MOP imports were off 54 percent or 440,000 tonnes of nutrient from a year earlier.
The good news is that imports for the 2005 calendar year are forecast to decline 11 percent or 440,000 tonnes of nutrient. As a result, inventory adjustments likely have taken place and imports for the rest of the year look in line with levels of last year.
For Canadian pro-ducers, increases in shipments to Asia, Oceania and other Latin American countries have more than offset the slowdown in Brazil. Statistics from the Potash and Phosphate Institute (PPI) show that Canadian offshore shipments during the first four months of 2005 increased 23 percent or 375,000 tonnes of nutrient from a year earlier. For the first quarter of this year, Canadian exports to China were up a whopping 61 percent or 202,000 tonnes and shipments to other Asian customers were up 36 percent or 154,000 tonnes. Shipments to Brazil were off 51 percent or 115,000 tonnes.
Minimal Inventories
Producers worldwide have scrambled to meet the double-digit increases in demand during the last two years by throttling up output and depleting inventories. Statistics published by IFA indicate that global potash production increased 6 percent in 2003 and 11 percent in 2004.
In addition, producers reported that domestic and export shipments exceeded production by more than 480,000 tonnes of nutrient or 800,000 tonnes of product during the last two years. Because most producers have little or no remaining inventories, they will have to boost production significantly in order to meet even moderate increases in demand this year.
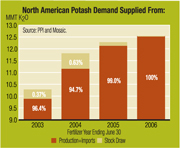
North America is a prime example. According to PPI statistics, producers increased output 13 percent or almost 1.3 million tonnes of nutrient during the fertilizer year that ended June 30, 2004. Producers still had to pull down stocks approximately 630,000 tonnes of nutrient in order to meet domestic and offshore demand last year. That followed a 370,000 tonne draw on stocks the year before. With warehouses now either empty or nearly empty, North American producers will need to boost outputsignificantly just to meet the more moderate increases in demand expected this year. In fact, North American production was up more than nine percent or another 815,000 tonnes from July through April, according to statistics published by PPI in mid-May.
Stocks Stay Low
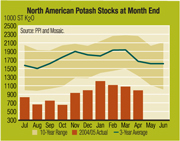
The global potash market is projected to remain tight during the next 12 months. Stocks held by North American producers at on-site and off-site facilities on April 30 totaled just 985,000 tons of nutrient, according to PPI statistics. That was 39 percent or almost 630,000 tons less than the five-year average and 26 percent or 350,000 tons less than the previous 10-year low for this date (set just a year ago). North American producer stocks are projected to stay at or less than the 10-year low throughout the 2005/06 fertilizer year based on our current forecasts of global supply and demand.
Long Term Outlook
The most frequently asked question by the new crowd in this neighborhood is when will supply catch demand.
| | |
| Market Mosaic Vol. 1, Issue 2 • May 2005 | | 2 |
That is a fair question given the sharp run-up in prices and the recent spate of announcements by Saskatchewan producers.
On April 11 Saskatchewan producers announced plans to expand capacity at four mines in response to new tax incentives implemented by the provincial government. Incentives include a 10-year holiday on base payments on the incremental tonnage from expansions of 200,000 tonnes or more as well as accelerated depreciation of capital expenditures on such projects. The base payment is a tax of approximately US$6.25 per tonne of product at the current exchange rate. The clock on the 10-year holiday starts when the provincial government approves the expansion project and therefore includes the construction period.
Three of the four projects initiated by Saskatchewan producers are due on line by the third quarter of 2006. These three projects will add an estimated 1.1 million tonnes of product or 645,000 tonnes of nutrient to annual capacity. Agrium announced that it will expand its Vanscoy mine 310,000 tonnes by the third quarter of 2006. Mosaic will expand its Esterhazy operation 363,000 tonnes by mid-2006. And PotashCorp announced that it will expand its Allan mine 400,000 tonnes by April 2006. PotashCorp completed a 400,000 tonne expansion of its Rocanville mine in late 2004.
In addition to these three incremental expansions, PotashCorp also announced plans to refurbish a large inactive mill at its Lanigan mine. That project will add another 1.5 million tonnes of annual capacity by the fourth quarter of 2007. All of the PotashCorp projects also include capital for the construction of additional compaction capacity that will better align its product mix with market demand.
Assuming projects are completed as scheduled, the four projects now moving forward will add approximately 2.6 million tonnes of product or 1.6 million tonnes of nutrient to annual capacity by the end of 2007. That is a big chunk of new capacity, but the increase must be assessed in the context of recent demand developments.
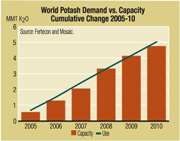
The charts below show cumulative changes in demand and capacity. The first shows actual changes for the last three years and the second shows projected changes from 2005 to 2010. The demand estimates are from Fertecon. Capacities are Mosaic estimates and incorporate the expansions noted above as well as other projects expected to come on stream elsewhere during this period. These estimates exceed the March 2005 capacity forecasts from Fertecon by approximately two million tonnes of nutrient due largely to the addition of the recently announced expansions in Saskatchewan.
The first chart shows that potash demand increased 5.4 million tonnes of nutrient during the last three years. At the same time, capacity increased just 1.1 million tonnes as a result of small expansions in Canada, China, the Mideast and Germany. Producers filled this gap by operating mines at higher rates and drawing down inventories. IFA statistics indicate that global production increased roughly 5.2 million tonnes and stocks were pulled down 0.2 million tonnes during this period. The average operating rate for the global industry increased from 72 percent in 2001 to 84 percent in 2004, based on IFA production and Mosaic capacity estimates.
Demand is projected to grow at respectable but more moderate rates through the end of this decade, according to Fertecon forecasts. Potash use is projected to increase 5.0 million tonnes of nutrient from 2005 to 2010. At the same time, global capacity is expected to grow 4.7 million tonnes, according to our estimates. That implies the global industry still will have to boost operating rates from current high levels in order to fill this small gap as well as make up for the de-stocking that has taken place during the last three years.

| | |
| Market Mosaic Vol. 1, Issue 2 • May 2005 | | 3 |
Mosaic North American Potash Operations
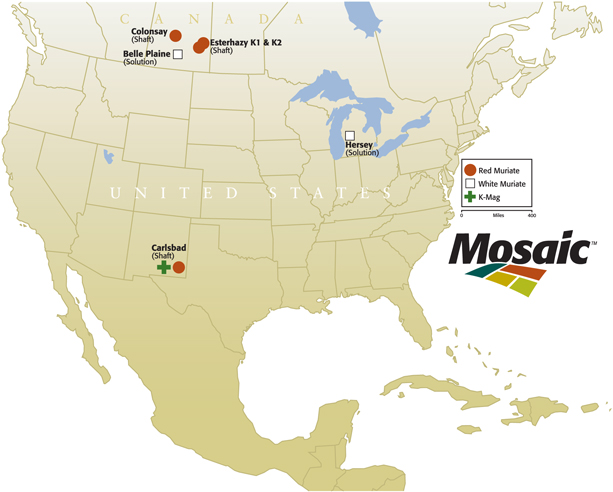
Canadian Operations
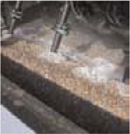
Mosaic operates three shaft mines and one solution mine in Saskatchewan. These mines tap into one of the largest and highest quality deposits of potash ore in the world. The deposit is approximately 1000 meters below the surface of the earth and Mosaic’s mineral rights are sufficient to operate its mines for more than 100 years at current rates.
The Belle Plaine facility is the largest potash solution mine in the world. The solution mining process begins by pumping hot water through a cluster or series of boreholes into the ore deposit. Once dissolved, the ore solution is pumped to the refinery or ponds above ground where potash is separated from salt and other materials through evaporation and crystallization techniques. The refined potash then is dewatered, dried and sized to complete the process. The Belle Plaine management team is recognized as a global leader in solution mining technology. This operation produces more than 20 different agricultural and industrial products, many utilizing proprietary production techniques.
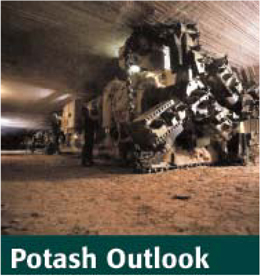
The Colonsay and Esterhazy operations are shaft mines that utilize room and pillar mining techniques. The Esterhazy complex includes two interconnected shaft mines – K1 and K2 – that are located approximately ten kilometers from each other. Esterhazy is the largest potash production facility in the world. Large Marietta continuous miners cut into the ore face. The ore is crushed and moved by conveyors to storage bins where it is hoisted in large buckets or “skips” to the refinery or mill above ground. The ore is put into a brine solution made up of dissolved potash and salt at the mill. Potash is separated from clay and salt through a series of washing and floatation processes and then dried and sized to complete the milling operation.
On April 11, Mosaic announced that it would expand Esterhazy by 363,000 tonnes of product per year. That will increase annual capacity to 4.2 million tonnes by the fall of 2006, based on current construction schedules. The project, which will cost approximately US$28 million, will boost lifting capacity at the mine through the installation of a more powerful hoist and larger skips.
Mosaic continues to evaluate other potash projects including further expansions of Saskatchewan operations in order to increase its capability to meet market demand. In fact, engineering studies have identified approximately 1.5 million tonnes of additional annual capacity that Mosaic could develop at existing mines at an estimated capita cost of just more than US$180 million.
| | |
| Market Mosaic Vol. 1, Issue 2 • May 2005 | | 4 |
U.S. Operations
Mosaic operates two mines in the United States including a shaft mine at Carlsbad, New Mexico and a small solution mine at Hersey, Michigan. The Carlsbad operation mines two different types of ore and produces two main potash products. The ore bodies are only 250 meters below the surface of the earth but the deposits are not as thick as those in Saskatchewan.
The first type of ore mined at Carlsbad is sylvinite. Sylvinite is a mixture of potassium chloride and sodium chloride and is identical to the ore mined in Saskatchewan. Red muriate of potash (MOP) containing 60 percent or more potassium is refined from this ore. Sylvinite reserves are sufficient to run MOP operations for more than 10 years at current rates and Mosaic is evaluating options to extend the life of this operation.
The second type of ore mined at Carlsbad is langbeinite. Langbeinite is a double sulphate of potassium and magnesium ore. The product refined from this ore contains potassium as well as sulphur and magnesium, important nutrients for a variety of crops. Mosaic markets this product under the brand names of K-Mag® and Sul-Po-Mag™. The mix of nutrients and other characteristics such as low chlorine content make these products ideal specialty fertilizers for fruit, vegetable and a variety of other crops. A new mill was commissioned in 1999 following the acquisition of another langbeinite producer and the consolidation of operations at Carlsbad. Langbeinite reserves are sufficient to run operations for more than 20 years at current rates.
The Hersey solution mine produces potash and salt. The ore deposit is predominantly a clean rock salt formation with intertwined beds of sylvinite. The Hersey mine can produce up to 150,000 tonnes of white MOP and 230,000 tonnes of salt per year. Reserves are sufficient to run Hersey operations for more than 100 years at current rates.

| | |
| Market Mosaic Vol. 1, Issue 2 • May 2005 | | 5 |
Mosaic Potash Operations
The Role of Mosaic
The Mosaic Company reports financial results for four operating segments – Phosphates, Potash, Nitrogen and Offshore. The first issue of Market Mosaic featured the Phosphates segment. This issue highlights the Potash segment. It provides an overview of Mosaic’s North American potash operations, reports capacity and production for the 2004 calendar year and describes Mosaic’s position in the global potash market. Future issues will feature the Nitrogen and Offshore segments.
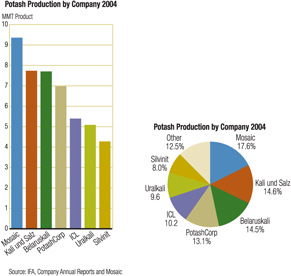
Mosaic plays a leading role in the global potash market by any metric.
Mosaic is the largest miner of potash in the world by a significant margin. Mosaic lifted or pumped more than 9.3 million tonnes of potash from the earth in 2004. That was almost 18 percent of world output last year. Based on statistics published by IFA and company reports, we estimate that Kali und Salz and Belaruskali ranked second and third, respectively, with just less than eight million tonnes of production last year. PotashCorp ranked fourth with output of seven million tonnes from the six mines it operated in 2004. ICL Fertilizers, including operations in Israel, Spain and the U.K., rounded out the top five with more than five million tonnes of production last year.
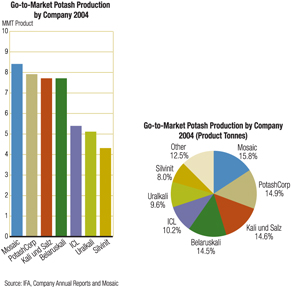
Mosaic ranked first even if you subtract the tonnage toll-produced at Mosaic’s Esterhazy operations. Put another way, Mosaic was the largest producer of potash as measured by the tonnes of output it took to market last year. Mosaic’s go-to-market production of 8.4 million tonnes last year likely topped the number two player by approximately 500,000 tonnes and accounted for 16 percent of the world output last year.
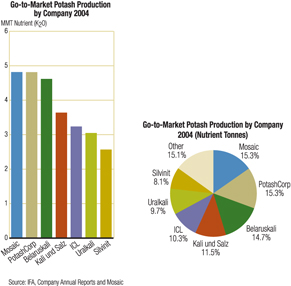
Finally, Mosaic ranked at the top of the list if go-to-market production was measured in nutrient rather than product tonnes.Mosaic took to market output of 4.8 million tonnes of nutrient or 15 percent of global production in 2004.
| | |
| Market Mosaic Vol. 1, Issue 2 • May 2005 | | 6 |
Mosaic Potash Operations
Overview
Mosaic is one of the leading potash producers in the world. The company operates six potash mines in North America including four large-scale mines in Saskatchewan and two smaller-scale mines in the United States. Annual capacity totals 10.3 million tonnes of product or 5.8 million tonnes of nutrient (K2O). Mosaic mined approximately 9.3 million tonnes of product or 5.4 million tonnes of nutrient in 2004. Mines operated at an average rate of 92 percent of nutrient capacity last year.
Mosaic currently mines reserves owned by PotashCorp at its Esterhazy, Saskatchewan operations. The capacity and production statistics above include tonnage supplied to PotashCorp from this complex. Mosaic mines and mills up to 953,000 tonnes of product per year for PotashCorp at cost plus a tolling fee. Excluding this tonnage, Mosaic’s go-to-market capacity is approximately 9.3 million tonnes and its go-to-market production totaled 8.4 million tonnes in 2004.
Mosaic upgrades a larger percentage of its ore into higher value products such as coarse and granular grade potash than any other producer in the world. In fact, coarse and granular grades accounted for more than 60 percent of Mosaic’s go-to-market production in 2004. These grades are used for bulk blending with other fertilizer products in the large U.S. market as well as in other rapidly growing markets such as Brazil.
Mosaic marketed roughly two-thirds of its production last year in North America and exported the remaining one-third. Canpotex, the export association of Saskatchewan potash producers, handles all offshore sales from Mosaic’s Canadian operations. Canpotex provides key sales, transportation and logistical services to Saskatchewan producers. The association owns or leases a large fleet of dedicated rail cars and operates efficient export terminals in Vancouver and Portland. Mosaic’s current allocation of Canpotex sales, based on its share of Saskatchewan capacity, is 36.7 percent. Allocations for PotashCorp and Agrium are 54.2 percent and 9.1 percent, respectively.
Mosaic serves both agricultural and industrial customers. Approximately 86 percent of go-to-market production was sold into the agricultural market last year. The remaining 14 percent was sold to industrial customers who use potash for a variety of applications ranging from water conditioning to re-cycling to the manufacturing of glass products.
The Mosaic Company
Potash Capacity, Production and Operating Rate
Period: 2004 Calendar Year
Unit: 1000 Metric Tonnes
| | | | | | | | | | |
| | | | | | | Mine Capacity
| |
Mine
| | Technology
| | Product
| | Product
| | | Nutrient
| |
Canada | | | | | | | | | | |
Belle Plaine | | Solution | | White MOP | | 2,760 | | | 1,721 | |
Colonsay | | Shaft | | Red MOP | | 1,810 | | | 1,095 | |
Esterhazy K1 & K2 | | Shaft | | Red MOP | | 3,810 | | | 2,328 | |
| | | | | | |
|
| |
|
|
Canada Total Capacity | | | | | | 8,380 | | | 5,144 | |
Canadian Total Production | | | | | | 7,862 | | | 4,825 | |
Canadian Average Operating Rate | | | | | | 94 | % | | 94 | % |
| | | | | | |
|
| |
|
|
United States | | | | | | | | | | |
Carlsbad | | Shaft | | Red MOP | | 530 | | | 323 | |
| | | | | K-Mag | | 1,200 | | | 264 | |
Hersey | | Solution | | White MOP | | 150 | | | 94 | |
| | | | | | |
|
| |
|
|
U.S. Total Capacity | | | | | | 1,880 | | | 681 | |
U.S. Total Production | | | | | | 1,475 | | | 556 | |
U.S. Average Operating Rate | | | | | | 78 | % | | 82 | % |
| | | | | | |
|
| |
|
|
North America Total Capacity | | | | | | 10,260 | | | 5,825 | |
North America Total Production | | | | | | 9,337 | | | 5,381 | |
North America Average Operating Rates | | | | | | 91 | % | | 92 | % |
| | | | | | |
|
| |
|
|
Less Esterhazy Toll Production | | | | | | 953 | | | 581 | |
Mosaic Go-To-Market Capacity | | | | | | 9,307 | | | 5,243 | |
Mosaic Go-To-Market Production | | | | | | 8,384 | | | 4,800 | |
| | |
| Market Mosaic Vol. 1, Issue 2 • May 2005 | | 7 |
Certain statements contained herein constitute “forward-looking statements” as that term is defined under the Private Securities Litigation Reform Act of 1995. Although we believe that the assumptions made in connection with the forward-looking statements are reasonable, such forward-looking statements involve known and unknown risks, uncertainties and other factors that may cause the actual results, performance or achievements of The Mosaic Company, or industry results, to be materially different from those contemplated or projected, forecast, estimated or budgeted in or expressed or implied by such forward-looking statements. Such factors include, among others, the following: the effect of legislative or regulatory changes in jurisdictions in which Mosaic’s businesses are engaged; the ability of Mosaic to obtain the regulatory permits necessary for continued operations of its businesses in a manner consistent with their current operation and for expansion of those operations; contingencies related to environmental liability under U.S. federal and state and foreign environmental laws and regulations.
This publication may not be distributed, reproduced, or used without the express written consent of Mosaic. This publication contains opinions, interpretations and predictions of The Mosaic Company. The Mosaic Company makes no representations or warranties with respect to the accuracy, reliability or completeness of the information contained in this publication. It is not intended that any party rely, in any way, on the information contained in this publication. The Mosaic Company disclaims any liability with respect to any claims arising out of or relating to reliance on any information contained in this publication.
This issue ofMarket Mosaic is available atwww.mosaicco.com.
The Mosaic Company
Atria Corporate Center, Suite E490
3033 Campus Drive
Plymouth, MN 55441
USA
(800) 918-8270 toll free
(763) 577-2700
| | |
| Market Mosaic Vol. 1, Issue 2 • May 2005 | | 8 |