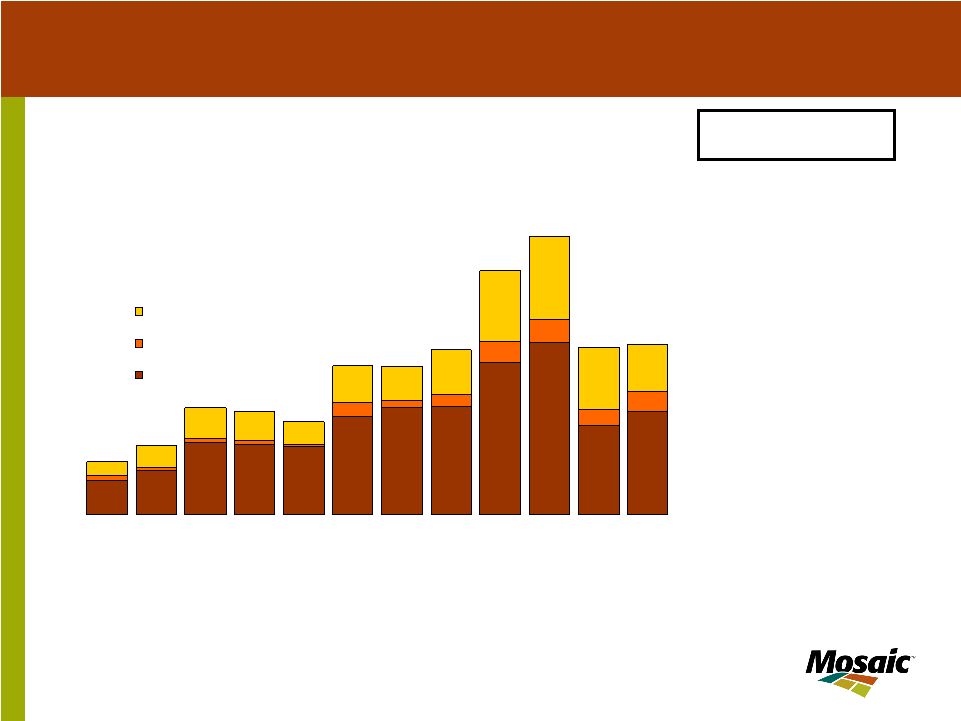
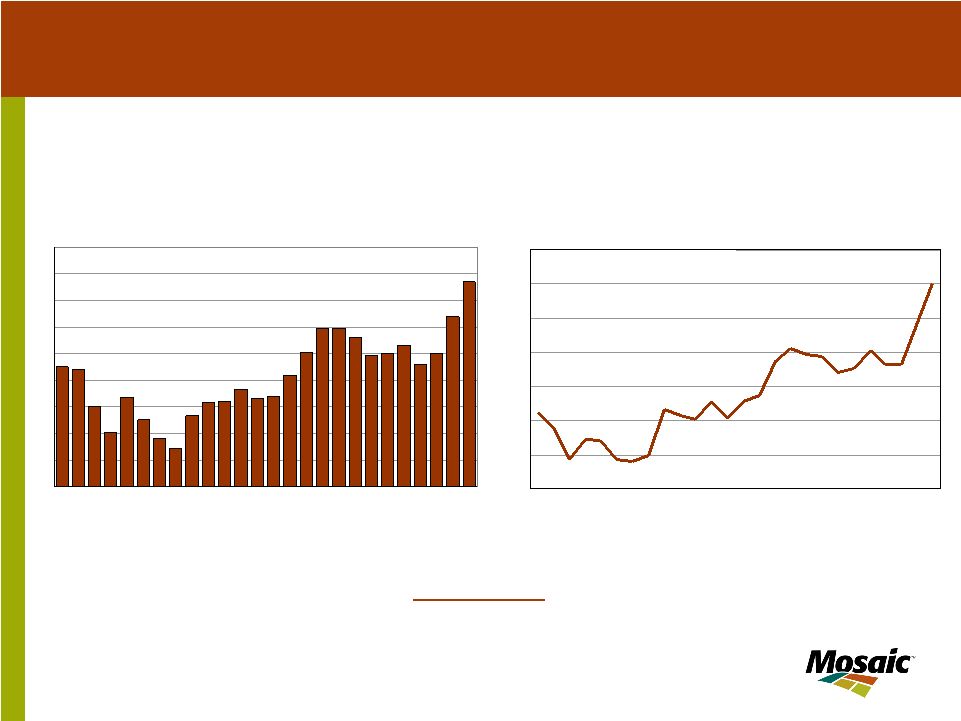
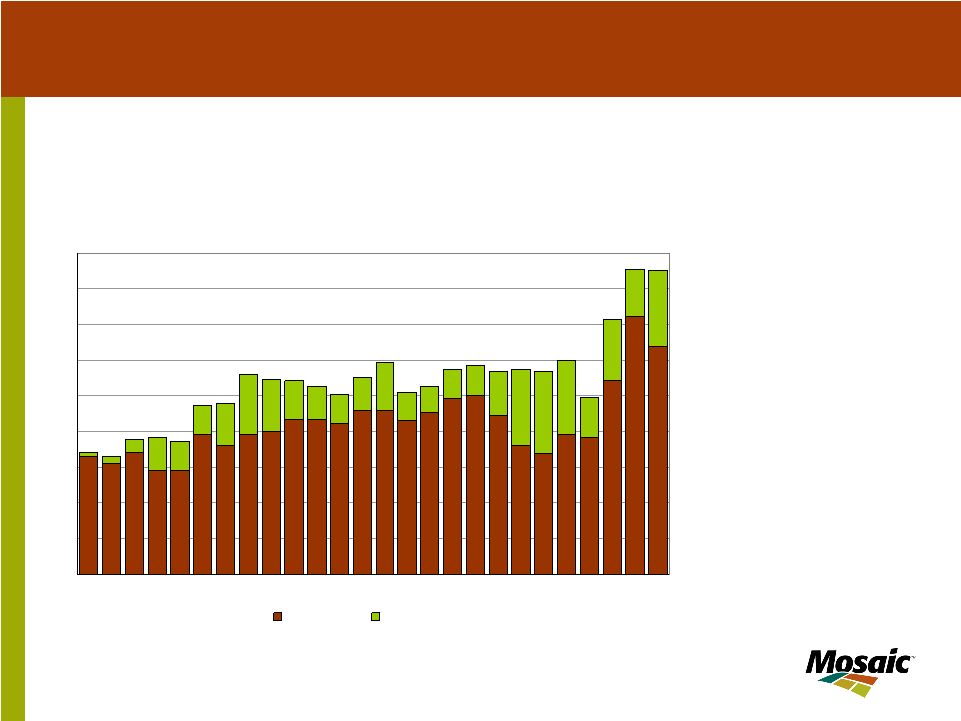
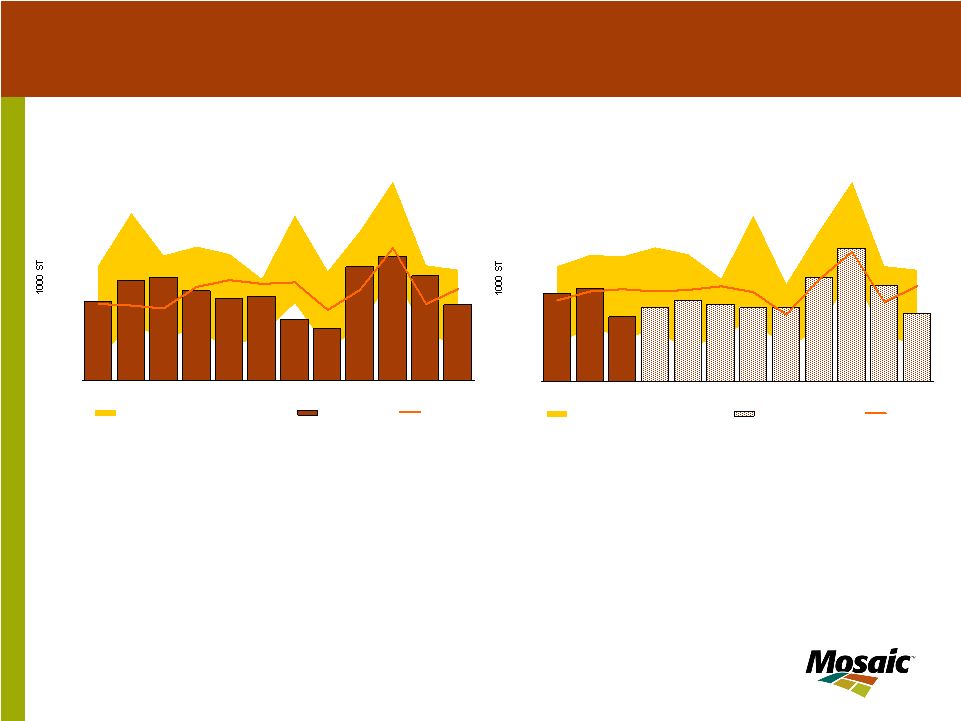
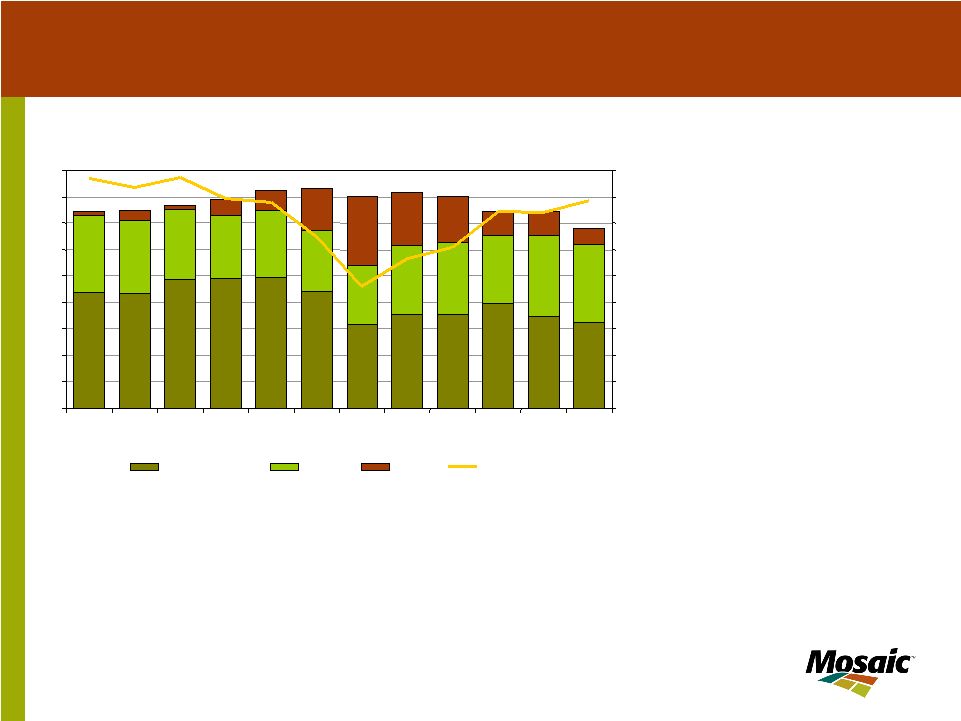
31 DAP and MAP are not the whole story The difference between total acid production and the estimated acid used for high analysis fertilizer production has increased from 2.2 million tonnes P 2 O 5 in 2000/01 to 3.0 million tonnes in 2004/05 (light green part of bar). A growing portion of this acid is upgraded to purified products that are used in a variety of industrial and food applications. Wet process technologies are replacing thermal acid production due to prohibitive energy costs. In addition, producers are processing more acid into feed phosphate. Growing concerns about the safety of feed ingredients made from animal by- products are boosting the demand for feed phosphate worldwide. Phosphoric acid is the most comprehensive measure of phosphate production. After bottoming at 78% of capacity in 2000/01, the U.S. phosphoric acid operating rate has climbed steadily to the mid- 90% range today. This trend is the result of both permanent plant closures as well as increases in acid production. Acid output has increased to make more high analysis fertilizer such as DAP, MAP and TSP, but more acid also is required to meet the growing demand for other uses. U.S. Phosphoric Acid Production and Operating Rate 4 5 6 7 8 9 10 11 12 13 95 96 97 98 99 00 01 02 03 04 05 06F Fertilizer Year Ending June 30 MMT P O 5 55% 60% 65% 70% 75% 80% 85% 90% 95% 100% For DAP/MAP/TSP For Other Capacity Operating Rate 2 |