Agriculture and Fertilizer Situation and Outlook: North America by Jim Thompson Executive Vice President Commercial Enlarged Council Meeting International Fertilizer Industry Association Sevilla, Spain November 14-17, 2005 Exhibit 99.1 |
2 Forward- Looking Statements Certain statements contained herein constitute “forward-looking statements” as that term is defined under the Private Securities Litigation Reform Act of 1995. Although we believe the assumptions made in connection with the forward-looking statements are reasonable, they do involve known and unknown risks, uncertainties and other factors that may cause the actual results, performance or achievements of The Mosaic Company, or industry results generally, to be materially different from those contemplated or projected, forecasted, estimated or budgeted (whether expressed or implied) by such statements. Factors affecting forward-looking statements may include, among others, the ability to successfully integrate the former operations of IMC and the Cargill fertilizer businesses; the ability to fully realize the expected cost savings from the business combination between IMC and the Cargill fertilizer businesses within expected time frames; the ability to develop and execute comprehensive plans for asset optimization and/or rationalization; the financial resources of, and products available to, Mosaic’s competitors; the retention of existing, and continued attraction of additional, customers and key employees; changes in the outlook of the nitrogen, phosphate or potash markets; changes in the costs of raw materials or energy; the effect of any conditions or restrictions imposed on or proposed with respect to Mosaic by regulators; the effect of legislative or regulatory changes in jurisdictions where Mosaic operates; the ability of Mosaic to obtain the regulatory permits necessary for the continued operation of its businesses in a manner consistent with current practices or anticipated expansions; contingencies related to environmental liability under U.S. federal and state and foreign environmental laws and regulations; adverse weather conditions affecting central Florida or the Gulf Coast of the United States, including the impact of potential hurricanes or excess rainfall; the rating of The Mosaic Company’s and Mosaic Global Holding Inc.’s securities and the changes that may occur in the U.S. securities markets; and the factors described in our filings with the SEC, including our Quarterly Report on Form 10-Q for the fiscal quarter ended August 31, 2005. This presentation may not be distributed, reproduced, or used without the express written consent of The Mosaic Company. Safe Harbor Statement |
3 1. Agricultural Developments Farmers harvested two large crops in a row Demand will match the large harvest this year U.S. farm income will remain at high levels Record energy prices will impact farm production costs and crop mix 2. Nutrient Demand Prospects High energy costs will cause a modest switch from corn to soybeans Record high fertilizer prices will force moderate cuts in application rates North American nutrient use is forecast to drop 5% 3. Nutrient Market Drivers High and volatile gas prices will further reduce NA nitrogen production Hurricanes and an anticipated plant closure will cut phosphate supply Potash supply is catching up with demand Outline of Presentation |
Agricultural Developments |
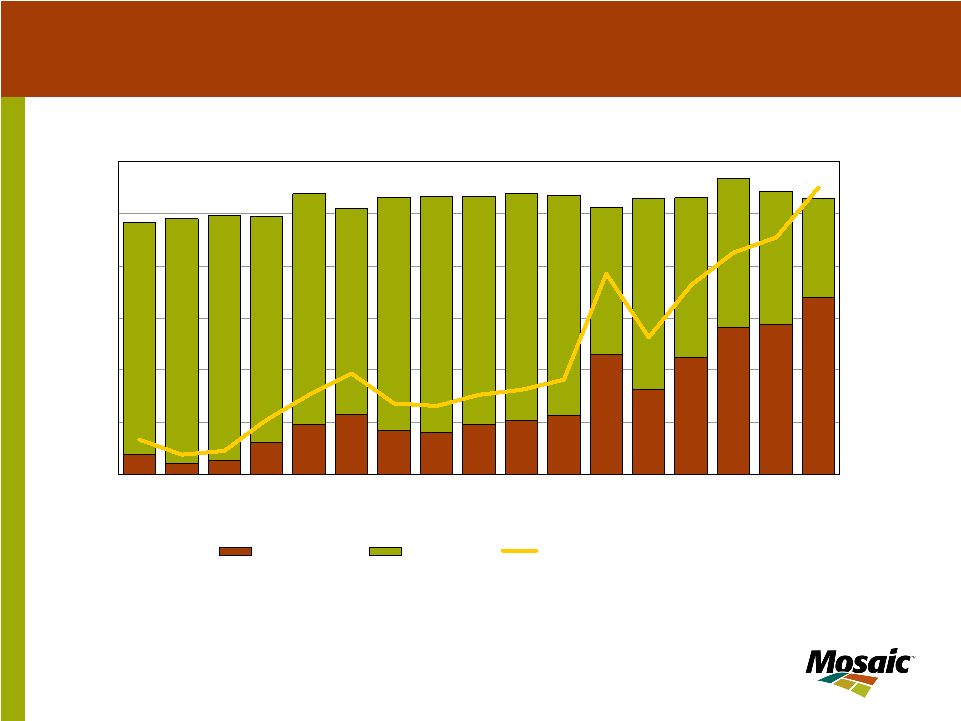
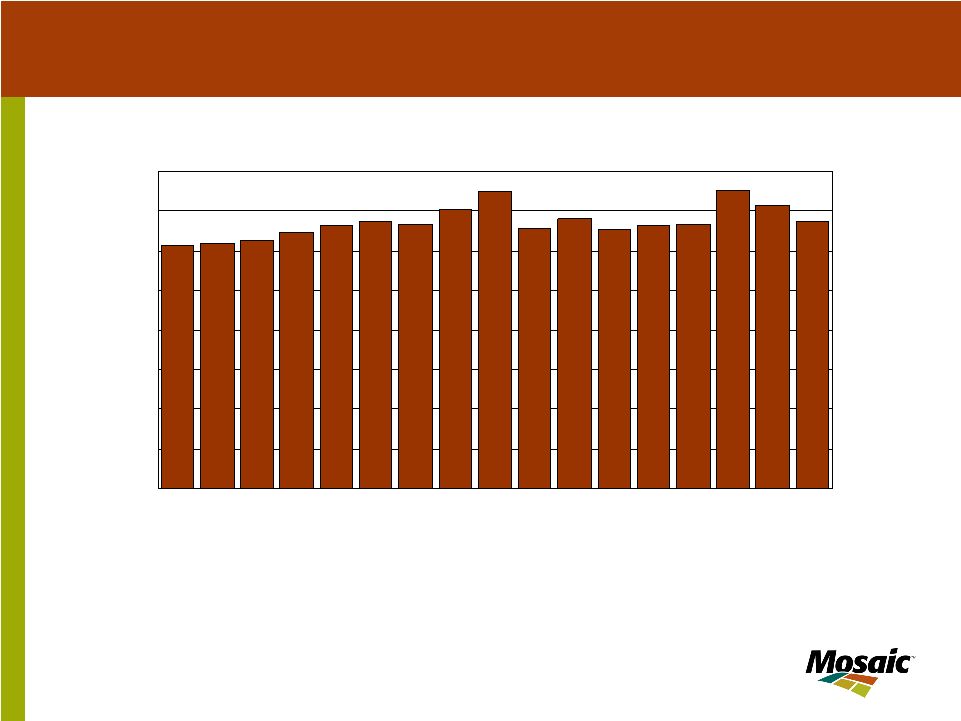
5 North American Grain and Oilseed Production 200 250 300 350 400 450 500 550 600 90 91 92 93 94 95 96 97 98 99 00 01 02 03 04 05 MMT USA Canada Source: USDA Farmers harvested two large crops in a row |
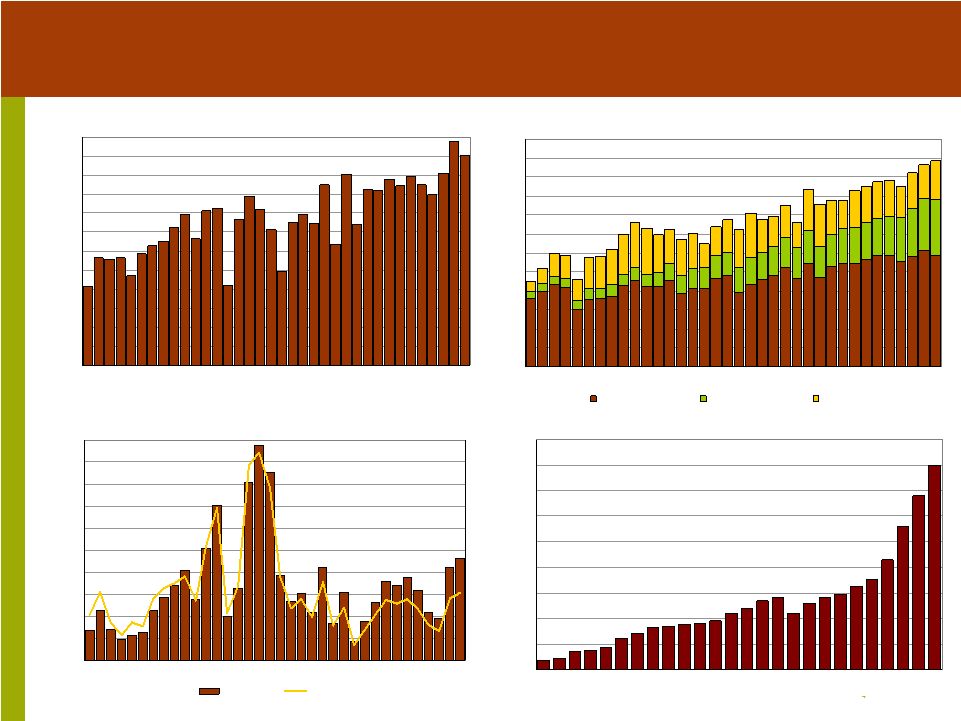
6 U.S. Ethanol Production 0 500 1000 1500 2000 2500 3000 3500 4000 4500 80 81 82 83 84 85 86 87 88 89 90 91 92 93 94 95 96 97 98 99 00 01 02 03 04 05E Mil Gallons Source: EIA & Renewable Fuel Association Record corn demand will absorb the large harvest U.S. Corn Production 0 1000 2000 3000 4000 5000 6000 7000 8000 9000 10000 11000 12000 70 75 80 85 90 95 00 05 Mil Bu Source: USDA U.S. Corn Use 0 1000 2000 3000 4000 5000 6000 7000 8000 9000 10000 11000 12000 70 75 80 85 90 95 00 05 Mil Bu Feed & Residual Food & Industrial Exports Source: USDA U.S. Corn Stocks 0 500 1000 1500 2000 2500 3000 3500 4000 4500 5000 70 75 80 85 90 95 00 05 Mil Bu 0 7 14 21 28 35 42 49 56 63 70 Pct of Use Million Bu Pct of Use Source: USDA |
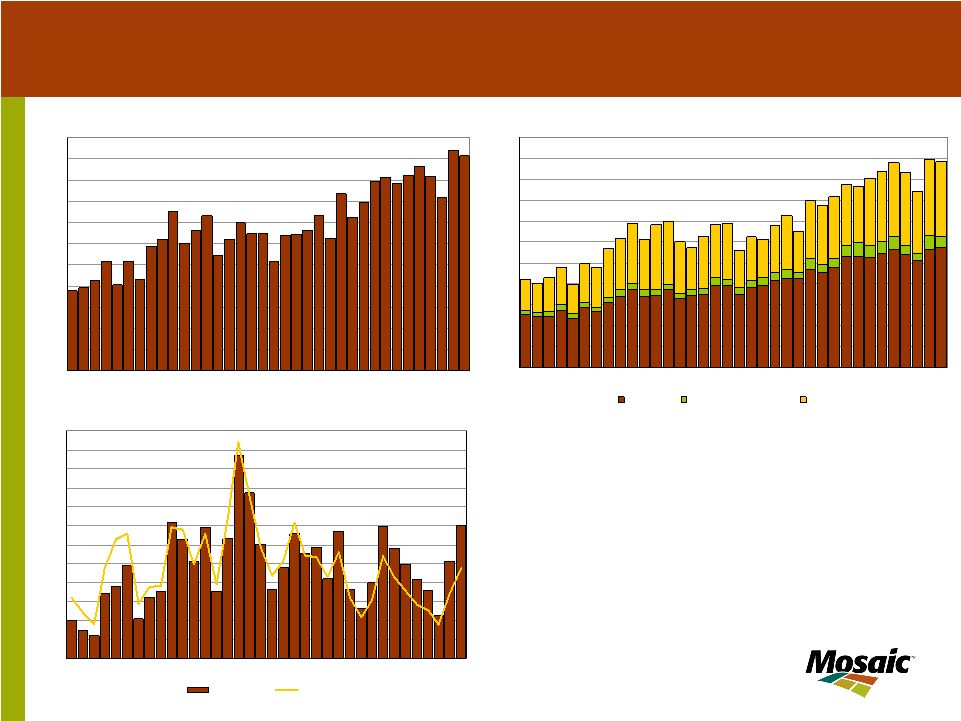
7 U.S. Soybean Stocks 0 50 100 150 200 250 300 350 400 450 500 550 600 70 75 80 85 90 95 00 05 Mil Bu 0 5 10 15 20 25 30 Pct of Use Million Bu Pct of Use Source: USDA U.S. Soybean Production 0 300 600 900 1200 1500 1800 2100 2400 2700 3000 3300 70 75 80 85 90 95 00 05 Mil Bu Source: USDA U.S. Soybean Use 0 300 600 900 1200 1500 1800 2100 2400 2700 3000 3300 70 75 80 85 90 95 00 05 Mil Bu Crush Seed & Residual Exports Source: USDA Soybean stocks increase due to big crop |
8 New Crop Wheat 2.8 3.0 3.2 3.4 3.6 3.8 4.0 4.2 4.4 4.6 0602 0801 0930 1129 0128 0328 0527 MM/DD $ BU KCBOT 2004N KCBOT 2005N KCBOT 2006N Source: KCBOT New crop prices are the same or higher than last year New Crop Corn 2.0 2.1 2.2 2.3 2.4 2.5 2.6 2.7 2.8 2.9 3.0 3.1 3.2 3.3 3.4 0701 0915 1130 0214 0430 0715 MM/DD $ BU CBOT 2004Z CBOT 2005Z CBOT 2006Z Source: CBOT New Crop Soybean 5.0 5.2 5.4 5.6 5.8 6.0 6.2 6.4 6.6 6.8 7.0 7.2 7.4 7.6 7.8 8.0 0701 0915 1130 0214 0430 0715 MM/DD $ BU CBOT 2004X CBOT 2005X CBOT 2006X Source: CBOT |
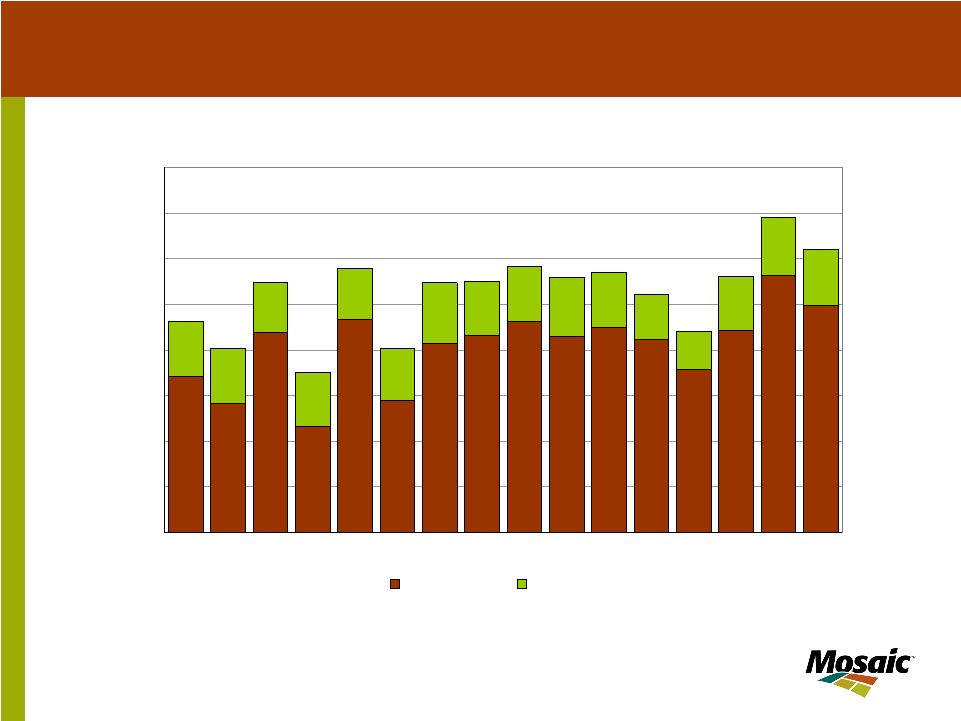
9 U.S. farm income will remain at high levels U.S. Net Cash Farm Income 0 10 20 30 40 50 60 70 80 90 80 81 82 83 84 85 86 87 88 89 90 91 92 93 94 95 96 97 98 99 00 01 02 03 04 05F Bil $ Market Gov Payments Source: USDA |
Nutrient Demand Prospects |
11 Only a modest switch from corn to soybeans U.S. Planted Acreage 56 58 60 62 64 66 68 70 72 74 76 78 80 82 84 90 91 92 93 94 95 96 97 98 99 00 01 02 03 04 05E 06F Mil Acres Corn Soybeans All Wheat Source: USDA and Mosaic |
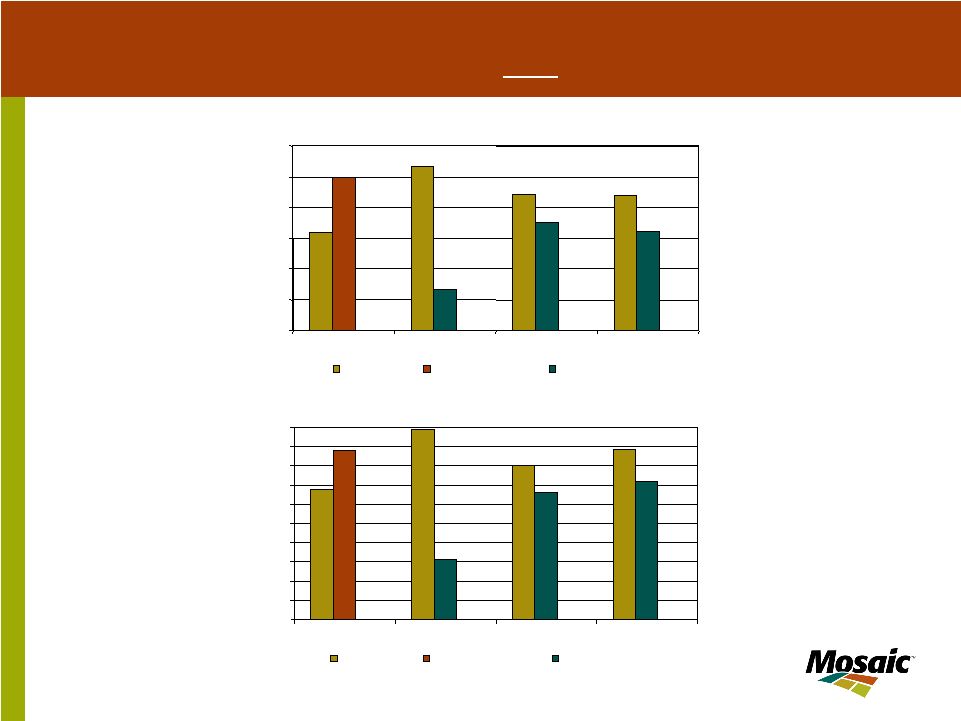
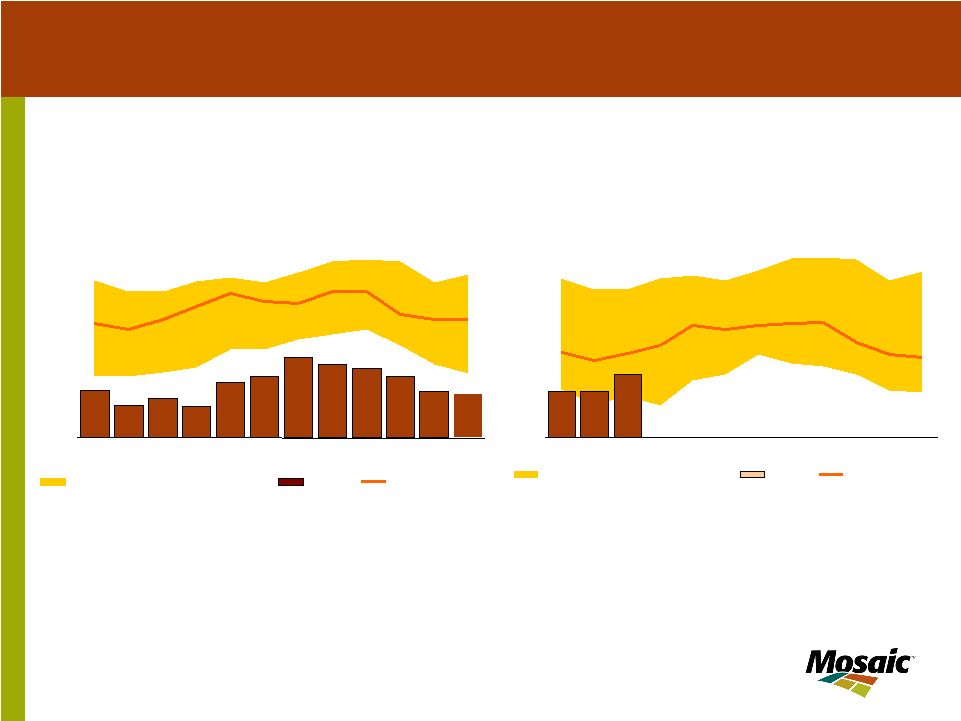
12 Moderate declines in application rates are forecast U.S. Phosphate Application Rates 1988-92 Average = 100 80 85 90 95 100 105 110 90 91 92 93 94 95 96 97 98 99 00 01 02 03 04 05E 06F Source: USDA and CBOT Percent 1.80 2.10 2.40 2.70 3.00 3.30 3.60 $ BU On Corn New Crop Corn Price (AMJ Average) U.S. Potash Application Rates 1988-92 Average = 100 80 85 90 95 100 105 110 90 91 92 93 94 95 96 97 98 99 00 01 02 03 04 05E 06F Source: USDA and CBOT Percent 1.8 2.1 2.4 2.7 3.0 3.3 3.6 $ BU On Corn New Crop Corn Prices (AMJ Quarterly Avg.) |
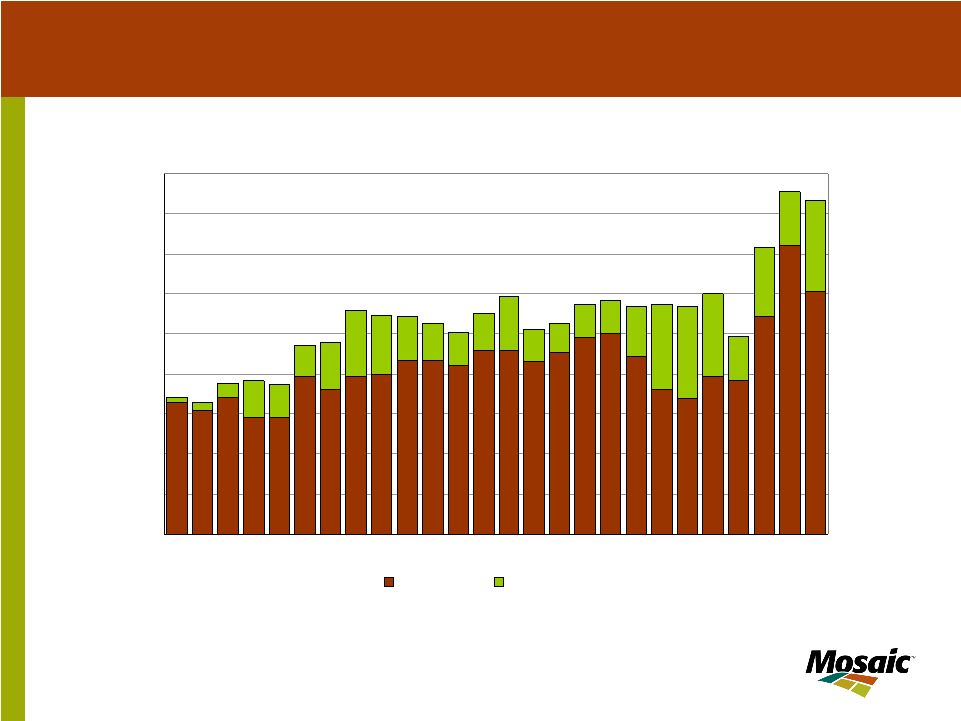
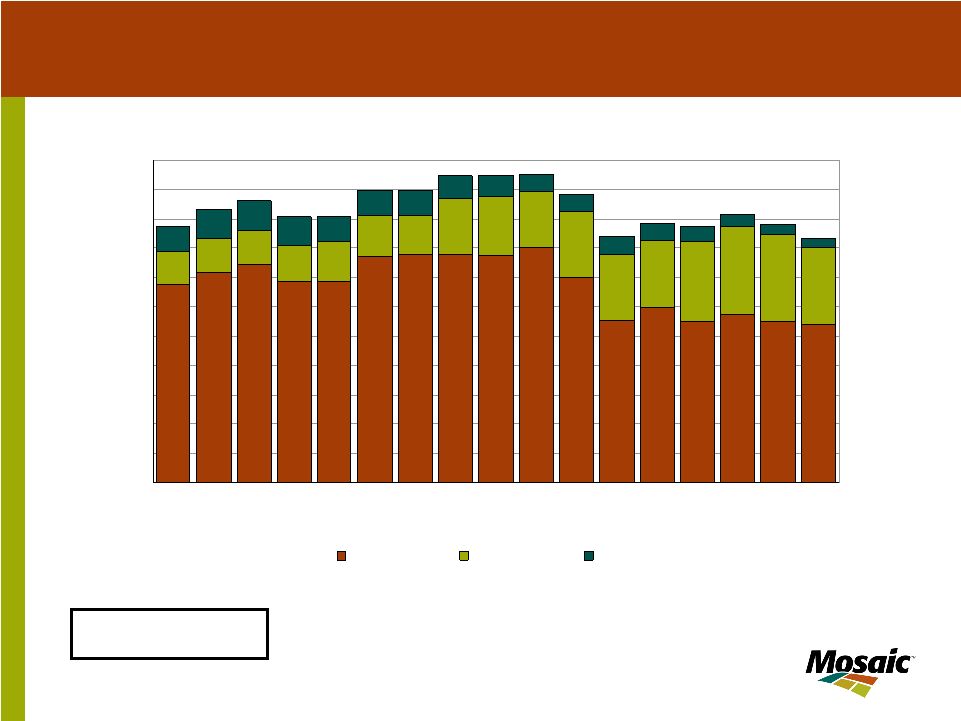
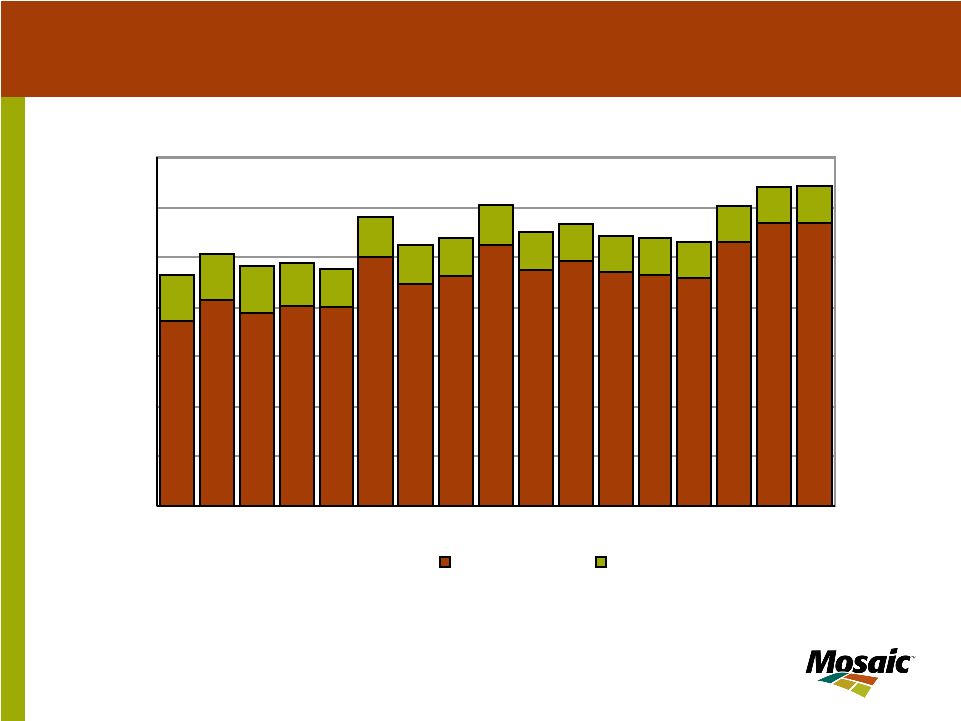
U.S. Fertilizer Use 0 2 4 6 8 10 12 14 16 18 20 22 90 91 92 93 94 95 96 97 98 99 00 01 02 03 04 05E 06F MMT N P2O5 K2O U.S. nutrient use is forecast to decline 5% in 05/06 |
Canada Nutrient Use 0.00 0.25 0.50 0.75 1.00 1.25 1.50 1.75 2.00 2.25 2.50 2.75 3.00 90 91 92 93 94 95 96 97 98 99 00 01 02 03 04 05E 06F MMT N P2O5 K2O Canadian use also is forecast to decline 5% in 05/06 |
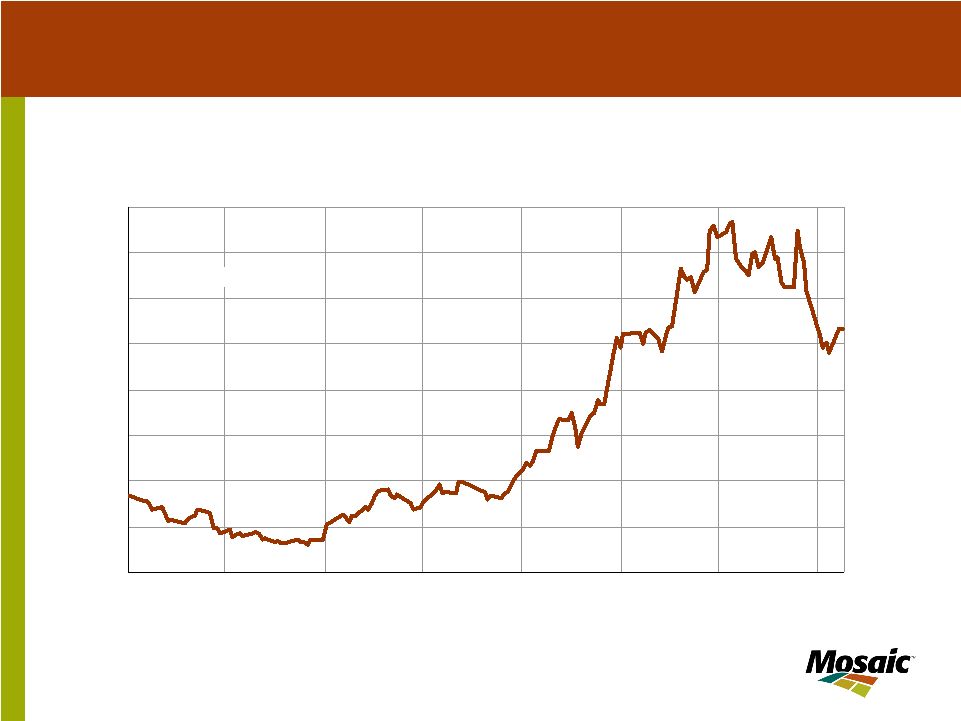
16 NYMEX Henry Hub Natural Gas Winter Strip Average of the Daily Closing Prices of the Nov 05 to Mar 06 Options 7.0 8.0 9.0 10.0 11.0 12.0 13.0 14.0 15.0 Apr 05 May 05 Jun 05 Jul 05 Aug 05 Sep 05 Oct 05 Nov 05 $ MMBTU Source: NYMEX U.S. natural gas prices remain high and volatile |
17 N.A. nitrogen production expected to decline again North American Ammonia Production 0 3 6 9 12 15 18 21 24 90 91 92 93 94 95 96 97 98 99 00 01 02 03 04 05 06F Fertilizer Year Ending June 30 Mil ST U.S. Canada Source: TFI and Mosaic |
18 Imports have filled the gap U.S. Nitrogen Use 0 3 6 9 12 15 18 90 91 92 93 94 95 96 97 98 99 00 01 02 03 04 05F 06F Fertilizer Year Ending June 30 Mil ST N 0 10 20 30 40 50 60 70 Percent Net Imports Total Use Imports as Percent of Use Source: TFI and Mosaic |
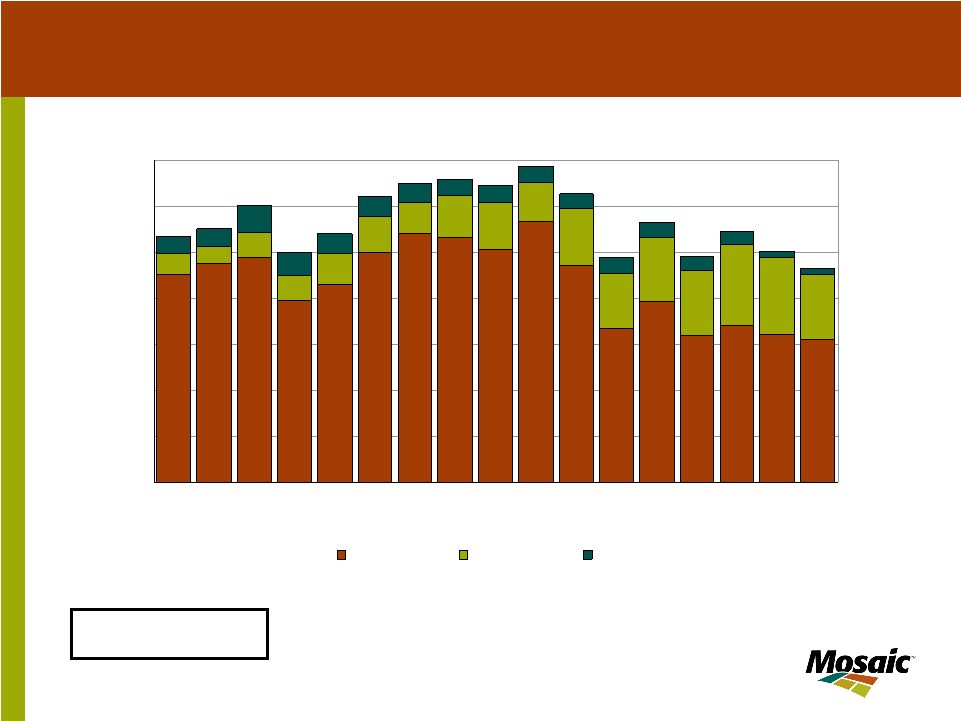
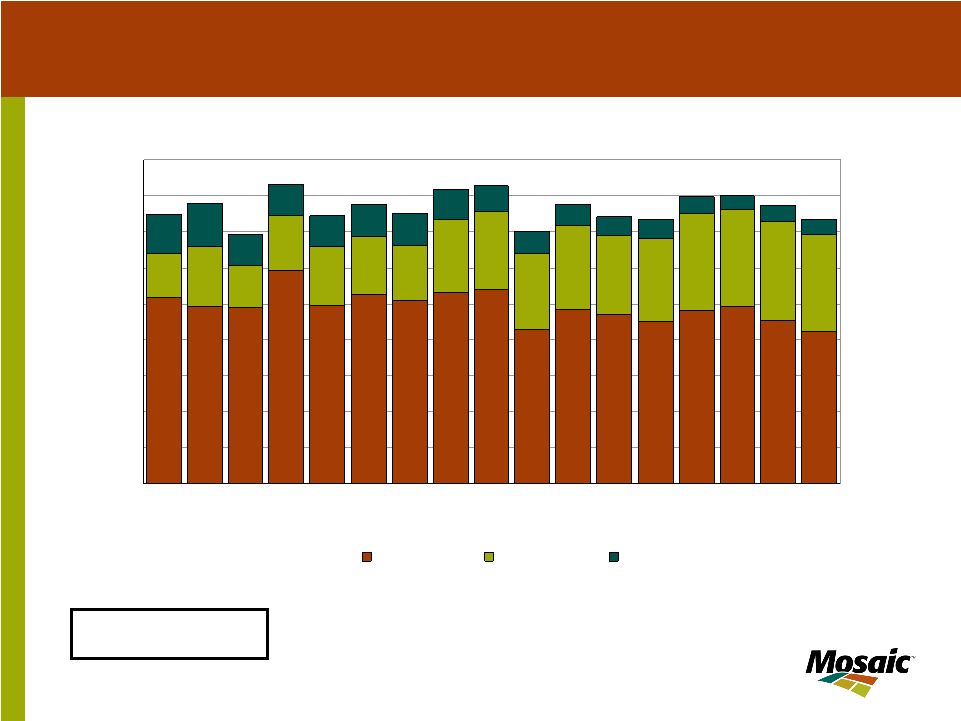
20 U.S. phosphate exports are projected to decline Processed phosphate includes DAP, MAP and TSP U.S. Processed Phosphate Exports 0 2 4 6 8 10 12 14 90 91 92 93 94 95 96 97 98 99 00 01 02 03 04 05 06F Fertilizer Year Ending June 30 Mil Tons DAP MAP TSP |
21 U.S. domestic shipments are projected to decline Processed phosphate includes DAP, MAP and TSP U.S. Processed Phosphate Domestic Shipments 0 1 2 3 4 5 6 7 8 9 90 91 92 93 94 95 96 97 98 99 00 01 02 03 04 05 06F Fertilizer Year Ending June 30 Mil Tons DAP MAP TSP |
22 Processed phosphate includes DAP, MAP and TSP U.S. Processed Phosphate Production 0 2 4 6 8 10 12 14 16 18 20 22 90 91 92 93 94 95 96 97 98 99 00 01 02 03 04 05 06F Fertilizer Year Ending June 30 MST DAP MAP TSP Supply decreases are in line with the drop in demand |
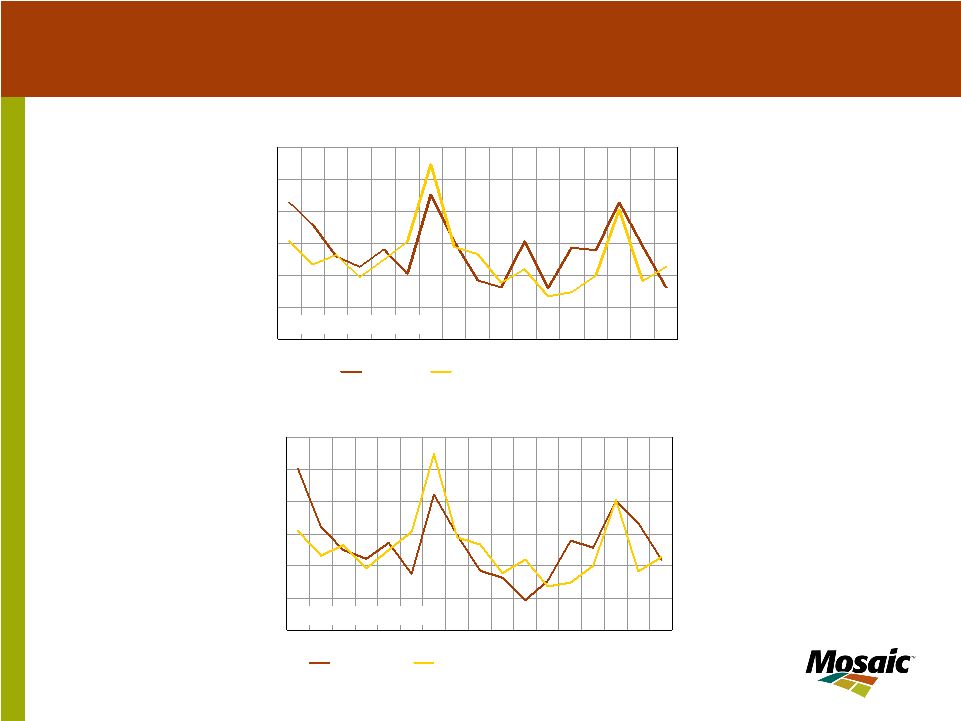
23 U.S. phosphate production will decline significantly U.S. DAP/MAP Production 3,000 3,100 3,200 3,300 3,400 3,500 3,600 3,700 3,800 3,900 4,000 JAS OND JFM AMJ Source: TFI and Mosaic 1000 MT 2004/05 2005/06 Actual 2005/06 Forecast U.S. Phosphoric Acid Production 2,200 2,300 2,400 2,500 2,600 2,700 2,800 JAS OND JFM AMJ Source: TFI and Mosaic 1000 MT P O 5 2004/05 2005/06 Actual 2005/06 Forecast 2 |
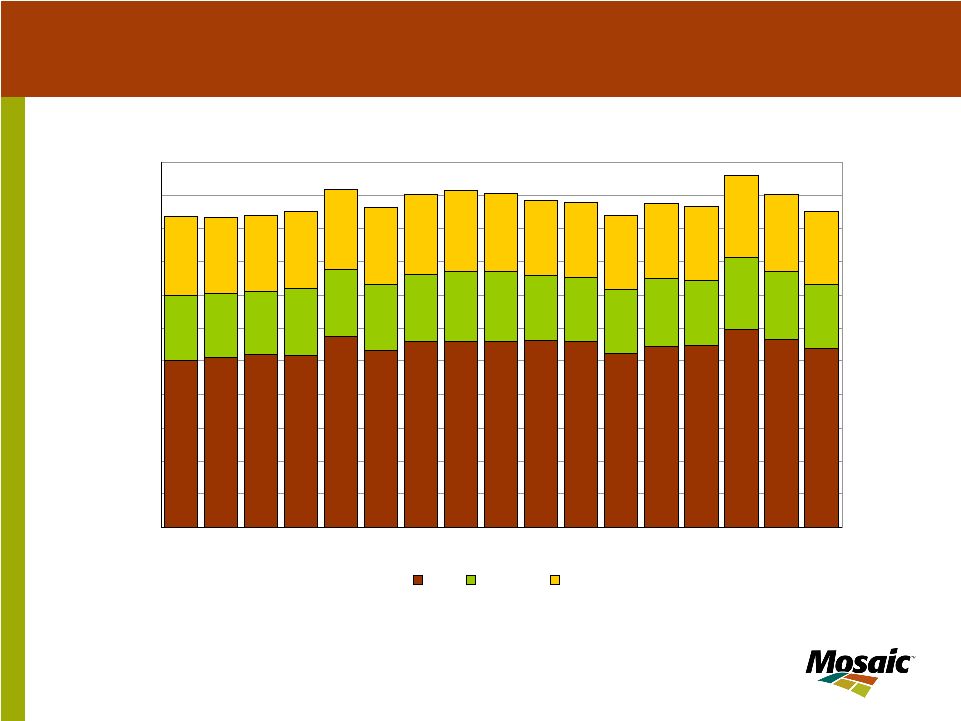
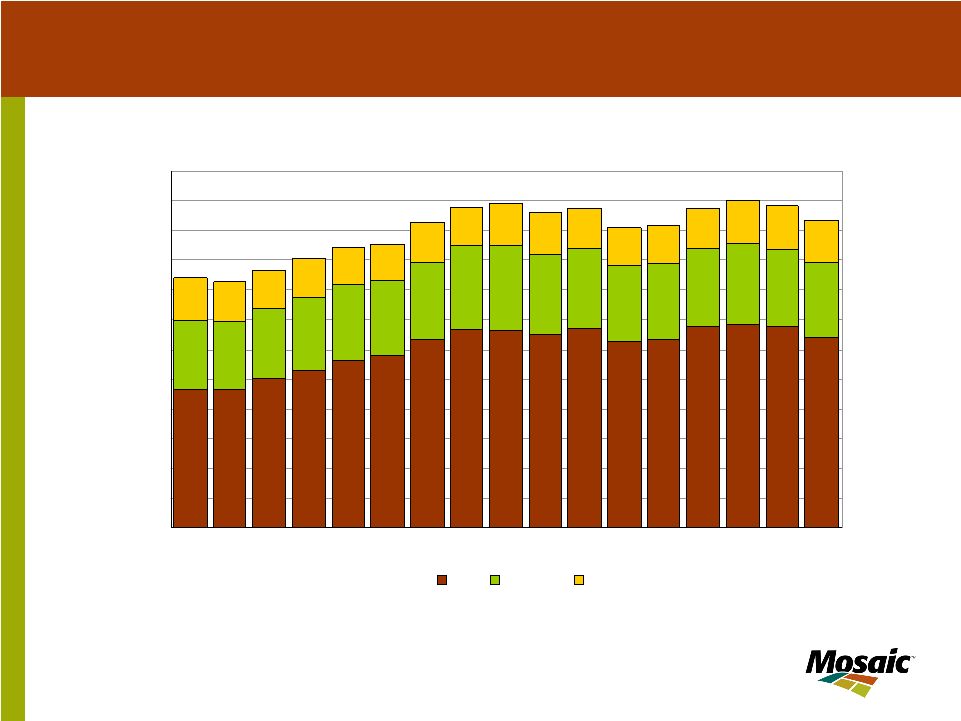
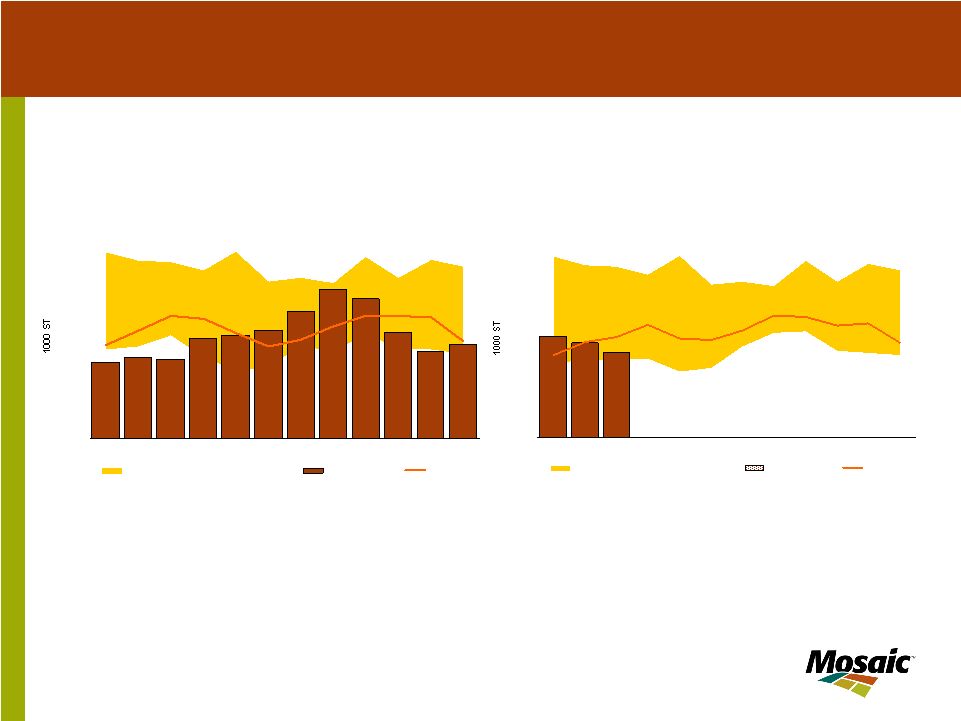
24 Stocks have dropped to low levels today U.S. DAP and MAP Producer Total Stocks 200 400 600 800 1000 1200 1400 1600 1800 2000 2200 JUL AUG SEP OCT NOV DEC JAN FEB MAR APR MAY JUN MIN MAX Range (1994/95-2003/04) 04/05 Actual 3-Yr Avg Source: TFI and Mosaic U.S. DAP and MAP Producer Total Stocks 200 400 600 800 1000 1200 1400 1600 1800 2000 2200 JUL AUG SEP OCT NOV DEC JAN FEB MA APR MAY JUN MIN MAX Range (1995/96-2004/05) 05/06 Actual 3-Yr Avg Source: TFI and Mosaic |
26 Demand growth slows but stays at high levels NA Potash Offshore Exports 0 1 2 3 4 5 6 7 90 91 92 93 94 95 96 97 98 99 00 01 02 03 04 05 06F Fertilizer Year Ending June 30 MST K2O Canada US Source: PPI and Mosaic |
27 Domestic shipments likely will fall 5% North American Potash Shipments 0 1 2 3 4 5 6 7 8 90 91 92 93 94 95 96 97 98 99 00 01 02 03 04 05 06F Fertilizer Year Ending June 30 MST K2O |
28 Production likely will remain flat in 2005/06 North American Potash Production 0 2 4 6 8 10 12 14 90 91 92 93 94 95 96 97 98 99 00 01 02 03 04 05 06F Fertilizer Year Ending June 30 MST K2O Canada US Source: PPI and Mosaic |
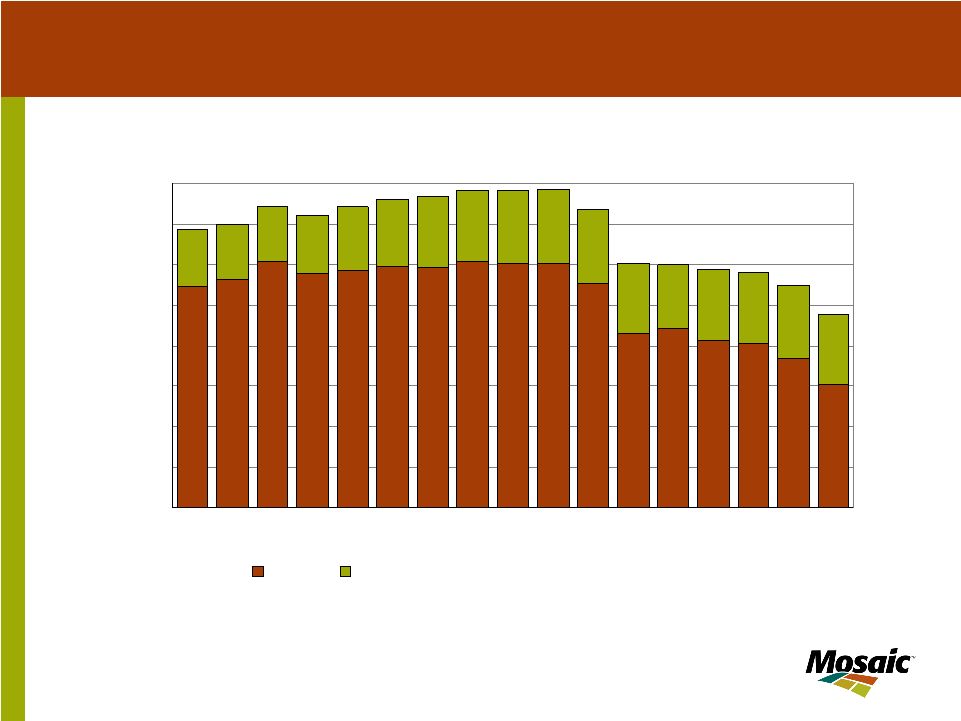
29 Stocks likely will build to more adequate levels NA Potash Stocks at Month End 300 500 700 900 1100 1300 1500 1700 1900 2100 2300 2500 JUL AUG SEP OCT NOV DEC JAN FEB MAR APR MAY JUN 1000 ST K 2 O MIN MAX Range (1994/95-2003/04) 2004/05 3 Year Average Source: PPI and Mosaic NA Potash Stocks at Month End 300 500 700 900 1100 1300 1500 1700 1900 2100 2300 2500 JUL AUG SEP OCT NOV DEC JAN FEB MA APR MAY JUN MIN MAX Range (1995/96-2004/05) 2005/06 3 Year Average Source: PPI and Mosaic 1000 ST K 2 O |
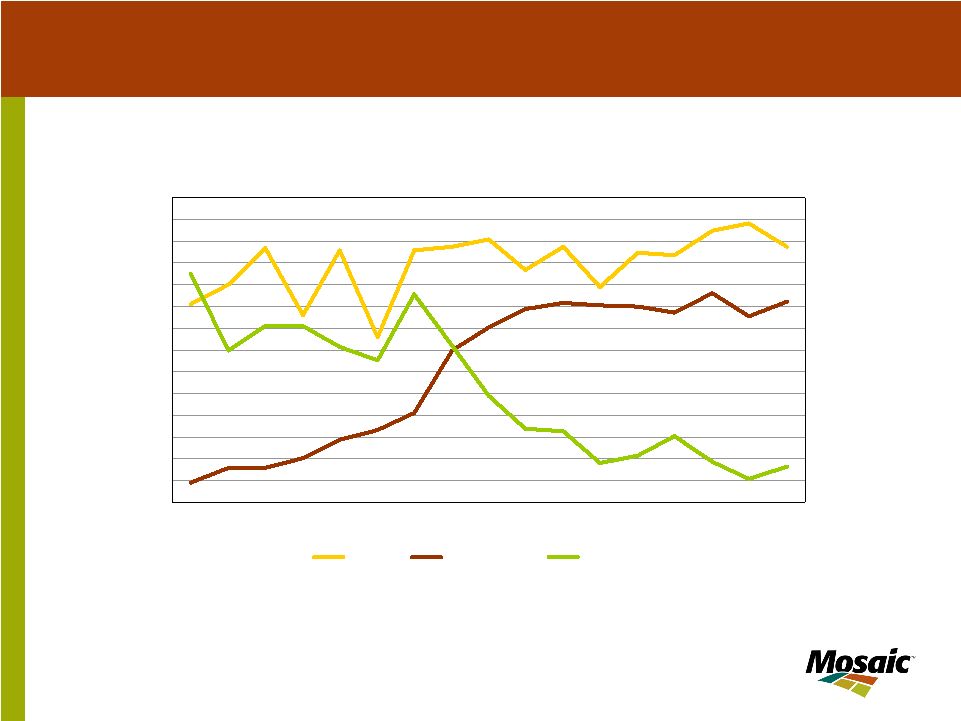
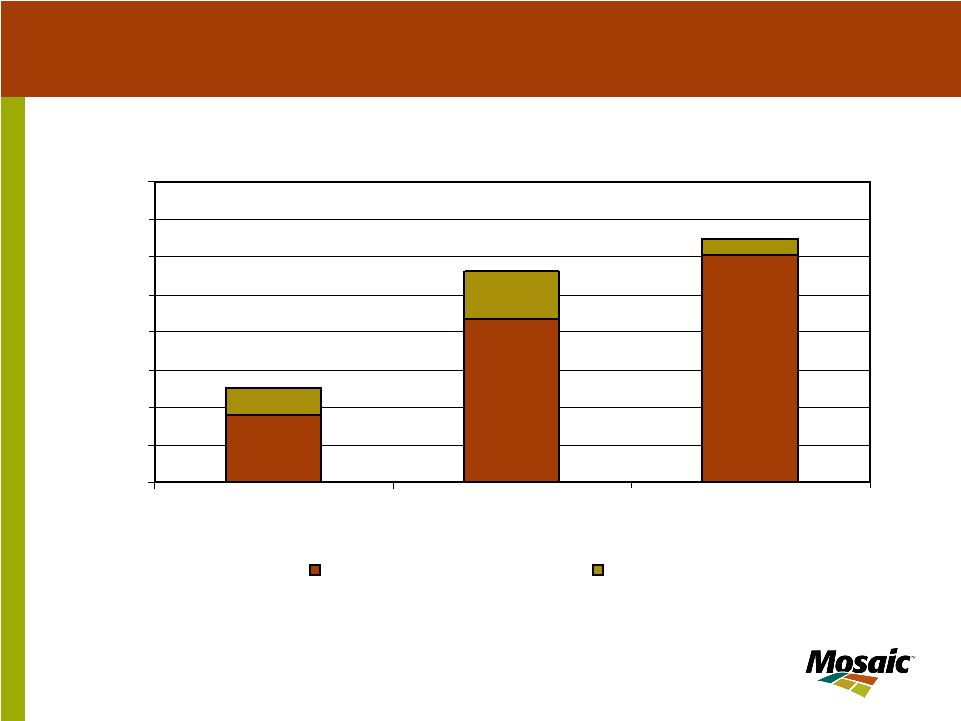
30 North American Potash Demand Supplied From: 0.37 0.63 96.4% 94.7% 98.3% 0.21 9.0 9.5 10.0 10.5 11.0 11.5 12.0 12.5 13.0 2003 2004 2005 Fertilizer Year Ending June 30 MMT K 2 O Production+Imports Stock Draw Source: PPI, US DOC Recent demand was met by a large stock draw-down |
Agriculture and Fertilizer Situation and Outlook: North America by Jim Thompson Executive Vice President Commercial Enlarged Council Meeting International Fertilizer Industry Association Seville, Spain November 14-17, 2005 Thank You |