 The Mosaic Company Overview and Fiscal 2006 Outlook Larry Stranghoener, Executive VP & CFO November 29, 2005 Exhibit 99.1 |
 Thank you and good afternoon. I am Larry Stranghoener, CFO and Executive Vice-President of The Mosaic Company. It is a pleasure to be here in Oslo at this conference and to present to the European investment community. |
 November 2005 2 Forward - Looking Statements Certain statements contained herein or made today constitute “forward-looking statements” as that term is defined under the Private Securities Litigation Reform Act of 1995. Although we believe that the assumptions made in connection with the forward-looking statements are reasonable, these forward-looking statements involve known and unknown risks, uncertainties and other factors that may cause the actual results, performance or achievements of The Mosaic Company, or industry results, to be materially different from those contemplated or projected, forecasted, estimated or budgeted in or expressed or implied by such forward- looking statements. Factors affecting forward-looking statements may include, among others, the ability to successfully integrate the former operations of IMC and the Cargill fertilizer businesses; the ability to fully realize the expected cost savings from the business combination between IMC and the Cargill fertilizer businesses within expected time frames; the ability to develop and execute comprehensive plans for asset optimization and/or rationalization; the financial resources of, and products available to, Mosaic’s competitors; the retention of existing, and continued attraction of additional, customers and key employees; changes in the outlook of the nitrogen, phosphate or potash markets; changes in the costs of raw materials or energy; the effect of any conditions or restrictions imposed on or proposed with respect to Mosaic by regulators; the effect of legislative or regulatory changes in jurisdictions where Mosaic operates; the ability of Mosaic to obtain the regulatory permits necessary for the continued operation of its businesses in a manner consistent with current practices or anticipated expansions; contingencies related to environmental liability under U.S. federal and state and foreign environmental laws and regulations; adverse weather conditions affecting our operations in central Florida or the Gulf Coast of the United States, including the impact of potential hurricanes or excess rainfall; the rating of The Mosaic Company’s and Mosaic Global Holding Inc.’s securities and the changes that may occur in the U.S. securities markets; and the factors described in our filings with the SEC, including our quarterly report on Form 10-Q for the fiscal year ended August 31, 2005. This presentation may not be distributed, reproduced, or used without the express written consent of The Mosaic Company. Safe Harbor Statement |
 November 2005 2 Before we start today, I want to remind you that there are forward-looking statements in this presentation. The remarks made today are based on information and understanding that we believe to be accurate as of today’s date. Actual results may differ from those set forth in the forward looking statements. |
 November 2005 3 Business Overview Phosphates Potash Nitrogen / Offshore Financial Outlook Presentation Outline |
 November 2005 3 Today I’d like to give you an overview of Mosaic, discuss our business segments and our strategy. In addition, I will provide a brief overview of the phosphate outlook as I imagine you already have heard about the outlook for nitrogen and potash. I’ll also address Mosaic’s priorities for fiscal 2006 and give you an overview of our expectations for the fiscal year. Please note that our fiscal year ends on May 31 st . |
 November 2005 4 Mosaic Profile The Company Formed on October 22, 2004 through the combination of Cargill Crop Nutrition and IMC Global Headquartered in Plymouth, MN Management CEO and President: Fritz Corrigan EVP and CFO: Larry Stranghoener Selected the best people from both companies to fill out management team Countries where we have assets and/or employees who provide crop nutrition solutions: United States and Canada Argentina, Brazil, Chile, and Mexico in Latin America China, India, and Thailand France, Ukraine and Russia in Europe Services customers in nearly 50 countries. Locations Employees Approximately 8000 employees worldwide Among the best in the business because they are richly diverse in their skills, experiences and backgrounds. |
 November 2005 4 Over one year ago, on October 22, 2004, the combination of Cargill Crop Nutrition and IMC Global was completed. With more than $5 billion in pro forma annual sales, a diversified business portfolio, and a global distribution network, Mosaic emerged as a leader in the crop nutrition industry. The rationale for creating Mosaic included: annual synergy savings forecasted at up to $145 million by the end of fiscal 2007; a stronger balance sheet for the combined company; a diversified organization with the best attributes of both predecessor companies, along with an extensive global production and distribution business. In addition to those factors, our predecessor companies brought a history of operational excellence to Mosaic, and today, we believe we not only have the right business model, but also the right resources and team to advance our strong market position. |
 Financially Strong Low Cost Diversified Industry Leader Positioned to deliver superior returns during the cyclical swings in global crop nutrient markets Value Proposition |
 Our value proposition starts with becoming financially strong. Cargill’s crop nutrition business was contributed with very little debt. Thus, Mosaic’s credit ratings have improved versus IMC’s prior ratings and we intend to further strengthen the balance sheet to achieve investment grade ratings. We are already a low cost producer, but the combination will result in the opportunity to further reduce costs for our phosphate business, as we realize the cost synergies to be achieved as a result of the combination. The new company is also more diversified with production of all three major nutrients plus an international distribution system. We are positioned to deliver good financial results. |
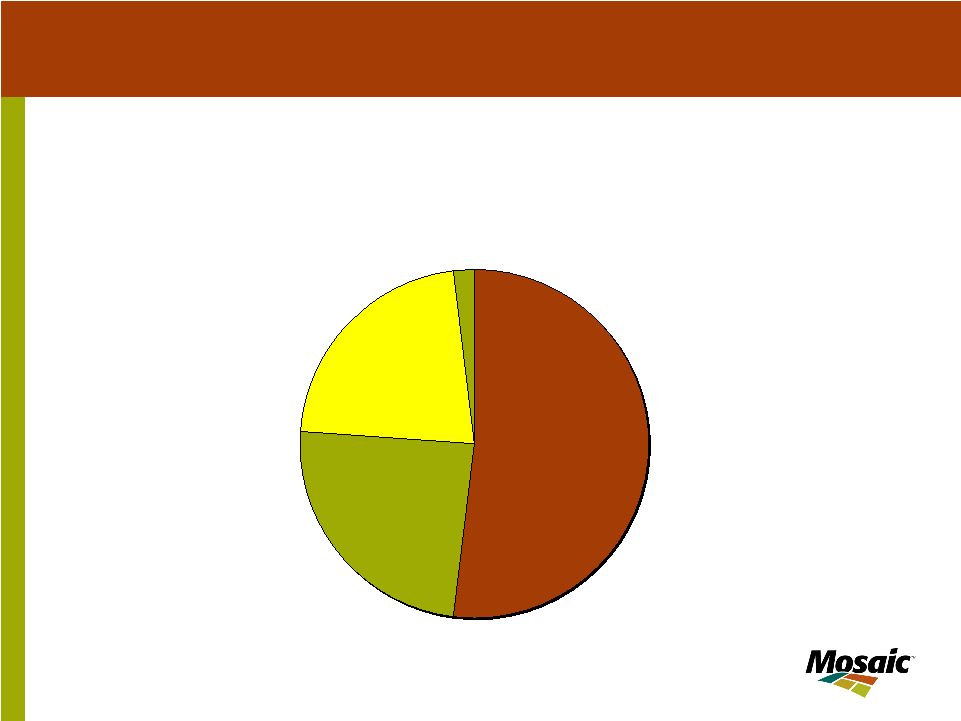 November 2005 6 Mosaic Net Sales by Business Segment Potash 22% Offshore 24% Phosphate 52% Nitrogen 2% 9/1/2004 – 8/31/2005 Total Net Sales were $5.1 billion |
 November 2005 6 For the last twelve months ending August 31, 2005, Mosaic’s net sales were $5.1 billion. Approximately half of our net sales were from the Phosphate business with 24% from our Offshore business; 22% from the Potash business segment and 2% from the Nitrogen business. |
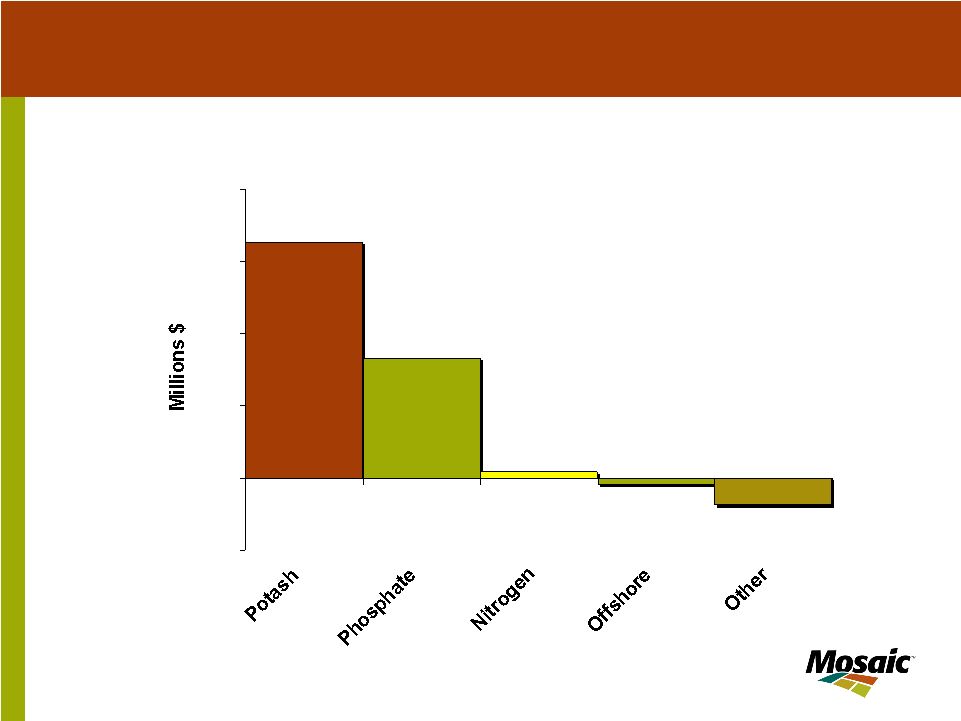 November 2005 7 Mosaic Operating Earnings by Business Segment -37.1 8.1 165.1 326.2 -8.8 -100 0 100 200 300 400 LTM Ending 8/31/2005 Total Operating Earnings - $453.5 million |
 November 2005 7 This chart shows Mosaic’s operating earnings by business segment but note that it does not include equity income from Mosaic’s investments in non-consolidated joint ventures, which was $56 million in Fiscal 2005. Potash is the star performer with operating earnings of $326 million, or about two-thirds of the total. Our phosphate business segment had earnings of $165 million or about one-third of earnings. Nitrogen earnings were $8 million and Offshore earnings were slightly negative. One of the reasons for the merger is the opportunity to significantly improve Phosphate’s profitability, a primary source of synergy savings. We began to see improved phosphate earnings in the fourth quarter of Fiscal 2005 and this continued into our first quarter of 2006. |
 November 2005 8 Business Overview Phosphates Potash Nitrogen / Offshore Financial Outlook Presentation Outline |
 November 2005 8 Next I will discuss Mosaic’s phosphates business along with the world and U.S. phosphate market and 2006 outlook. |
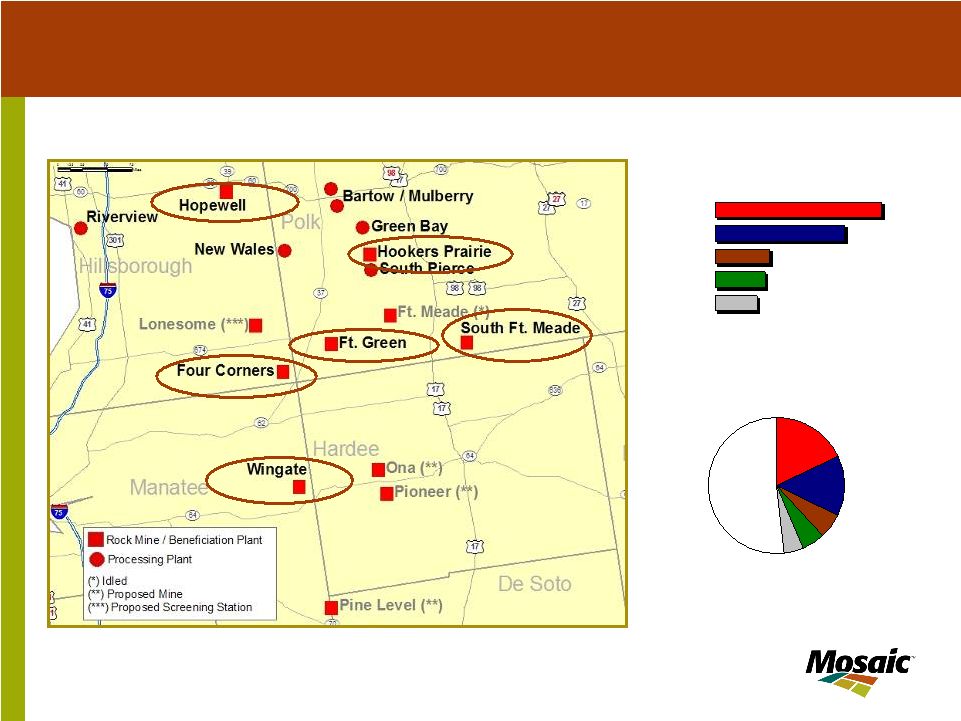 November 2005 9 Top Five Rock Producers 2004 0 5 10 15 20 25 30 OCP Mosaic PhosAgro GCT PotashCorp Million Tonnes Rock Phosphate Rock Production 2004 PhosAgro 6% OCP 18% PotashCorp 5% GCT 5% Mosaic 14% Other 52% Mosaic: The Phosphate Leader Rock Mining Operations |
 November 2005 9 Mosaic is a leader in the phosphate business. As you can see from this slide, we currently have six active mining locations in Central Florida. These mines are capable of producing 21 million tonnes of phosphate ore that is ready for further processing each year. The combination of mine locations that you see on the map is a result of multiple previous owners each building their own mine capacity. This has many of the synergy opportunities we are pursuing. As you can also see from the charts, our capacity and performance in the mining arena places us second in the world to OCP of Morocco in terms of total tons mined each year, as we account for approximately 14% of global phosphate rock production. |
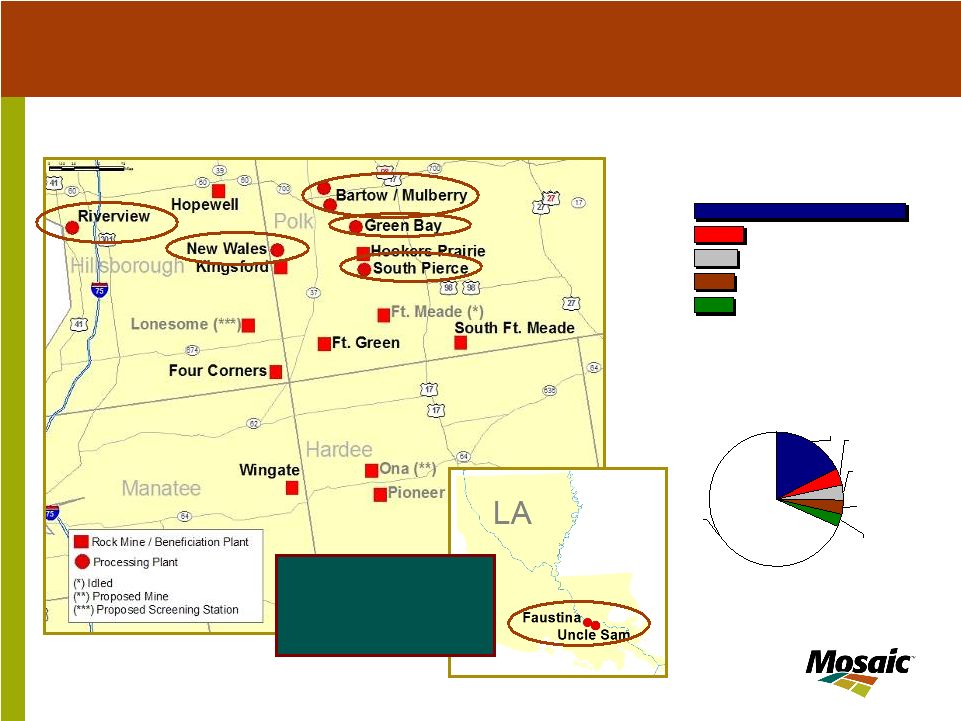 November 2005 10 Phosphate Fertilizer Capacity 2005 Other 68% OCP 4% PhosAgro 3% CF Industries 3% Mosaic 18% PotashCorp 4% Top Five Phosphate Fertilizer Players by Capacity 2005 0 2 4 6 8 10 12 14 Mosaic OCP PotashCorp PhosAgro CF Industries MMT DAP+MAP+TSP+MES Mosaic: The Phosphate Leader Phosphate Fertilizer Operations Mosaic’s Uncle Sam facility produces only phosphoric acid. Acid from this facility is barged to Faustina where it is granulated into DAP and MAP using ammonia that is produced on-site. Mosaic has closed permanently the smaller acid plant at Faustina and the granulation plant at Taft. Both plants will be dismantled in 2005/06. |
 November 2005 10 It is the production of the finished crop nutrient products that our customers and their customers – the farmer - can actually use. This is the product that we actually ship. Mosaic’s capabilities lie in the five manufacturing facilities in Florida as well as one in Louisiana where we produce phosphate products such as DAP, MAP and TSP. The charts to the side show that Mosaic accounted for 18% of world phosphate production in 2005 and approximately 61% of the U.S. total. Mosaic is larger than the next four largest competitors combined and is truly the global phosphate leader. |
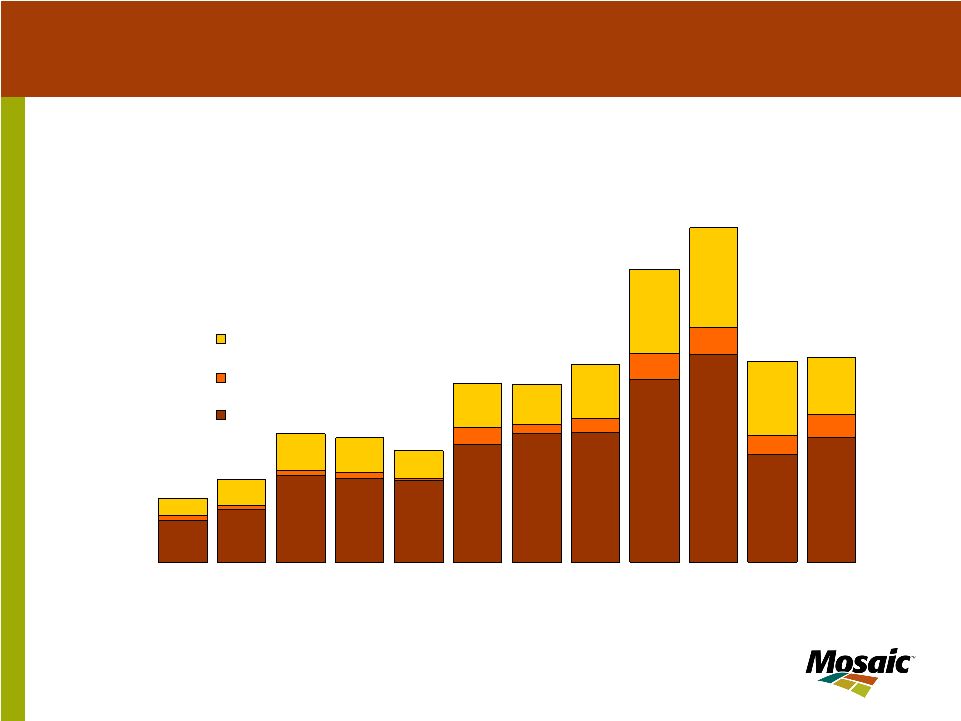
 November 2005 World Processed Phosphate Import Demand Processed Phosphate Trade 0 5 10 15 20 25 90 91 92 93 94 95 96 97 98 99 00 01 02 03 04 05E 06F MMT Source: Fertecon and Mosaic Processed Phosphate Import Demand by Region 0 2 4 6 8 10 12 90 91 92 93 94 95 96 97 98 99 00 01 02 03 04 05E 06F MMT Asia Europe L Amer Source: Fertecon and Mosaic Processed phosphate includes DAP, MAP and TSP |
 November 2005 In 2005, world processed phosphate import demand is projected to decline by around 2% to 21 million metric tonnes. Brazil has been a slow market in 2005 but this has been partially offset by growth in Asia, particularly India and Pakistan. In 2006, world import demand is forecast to decline by about 4% to 5% due to a decline in China, a pull-back in India and just a modest recovery in Brazil. |
 November 2005 12 India and Pakistan Processed Phosphate Imports 0.0 0.5 1.0 1.5 2.0 2.5 3.0 3.5 4.0 4.5 95 96 97 98 99 00 01 02 03 04 05E 06F Source: IFA and Mosaic MMT India Pakistan Strong Growth in India and Pakistan |
 November 2005 12 A key factor in the phosphates market in 2005 has been the strong Asian demand. As already noted, there will be a large increase in India's and Pakistan’s imports. This has been due to strong GDP growth and good monsoons resulting in strong demand growth. In 2005, imports are projected at 3.5 million tonnes, the highest level since 1999. We are forecasting a decline of about one million tonnes in 2006 due to higher domestic production in India, though this is still uncertain. In fact, recent reports suggest that we may be conservative and that demand may be stronger than expected in India. |
 November 2005 13 Brazil Market Remains Weak Brazilian Processed Phosphate Imports 0.0 0.5 1.0 1.5 2.0 2.5 3.0 3.5 4.0 95 96 97 98 99 00 01 02 03 04 05E 06F Source: ANDA and Mosaic MMT TSP DAP MAP |
 November 2005 13 In 2003 and 2004, Brazil showed remarkable growth in imports of 47% and 14% respectively. However, imports are expected to decline 40% in 2005 due to the appreciation of the real , lower soybean prices, higher input costs and a severe drought in Southern Brazil. We are projecting a modest recovery in 2006 which could be stronger if the real depreciates or soybean prices rebound. |
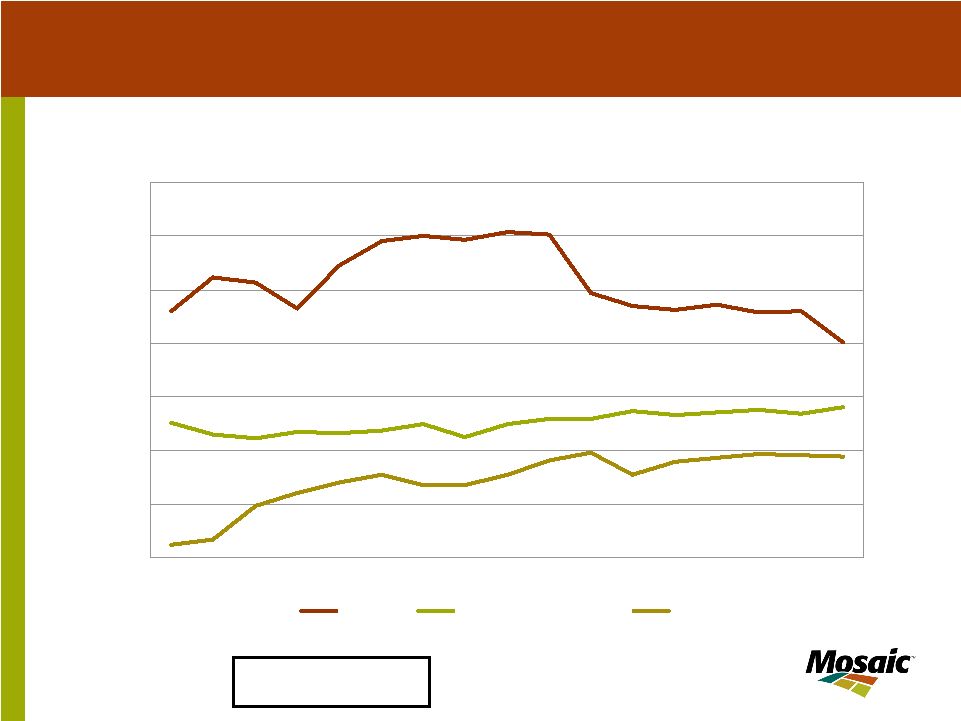 November 2005 14 Phosphate Export Supply Declining Processed phosphate includes DAP, MAP and TSP Processed Phosphate Export Supply by Region 0 2 4 6 8 10 12 14 90 91 92 93 94 95 96 97 98 99 00 01 02 03 04 05E 06F MMT USA Africa & Mideast FSU Source: Fertecon and Mosaic |
 November 2005 14 The U.S. phosphate industry exported 12 million tonnes of processed phosphate per year during the last half of the 1990s. U.S. exports have dropped to the 9.2 to 9.4 million tonne range since 2000. As already noted, world phosphate trade is expected to decline 2% in 2005. U.S. processed phosphate exports are projected to be about unchanged at 9.2 million tonnes in 2005. In 2006, world exports will decline by about 4% to 5%. U.S. exports are forecast to decline approximately one million tonnes in 2006. However, this will be approximately matched by our expected closure of a phosphate plant in the United States. |
 November 2005 15 U.S. Phosphates Production Lower U.S. Agri-Chem closes plant with 1.2 million tonnes per annum capacity Mississippi Phosphates idled Sept 05 – Jan 06 with 0.8 million tonnes per annum capacity Mosaic announces 400,000 to 600,000 tonnes cutback from Nov 05 to Mar 06 Mosaic reduces phosphate sales volume guidance by 500,000 tonnes to 9.7 – 10.1 million tonnes for Fiscal 2006 |
 November 2005 15 So let’s turn to the supply side of U.S. phosphates industry. The key development is the expected closure of the U.S. Agri-Chemical plant in Florida this month. Capacity will decline by about 1.2 million tonnes of finished phosphate fertilizer and assist in bringing the phosphate market to a balanced situation in 2006. In addition, Mississippi Phosphates is temporarily idled following damage from Hurricane Katrina. Finally Mosaic recently announced some temporary production reductions to balance our supply to seasonally slow purchasing activity. North American farmers have delayed purchases and the export market has slowed. Mosaic does not intend to build high-cost inventories based on record high ammonia prices which would likely result in lower cash margins. As a result, we have chosen to more actively manage our inventory, which will help reduce Mosaic’s working capital during this period. |
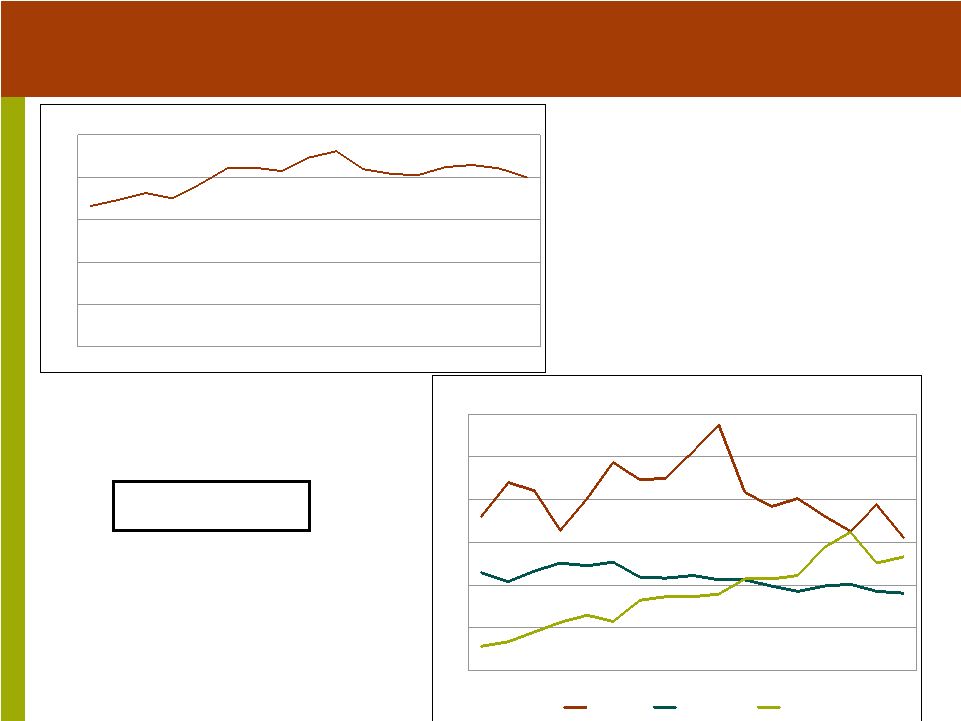
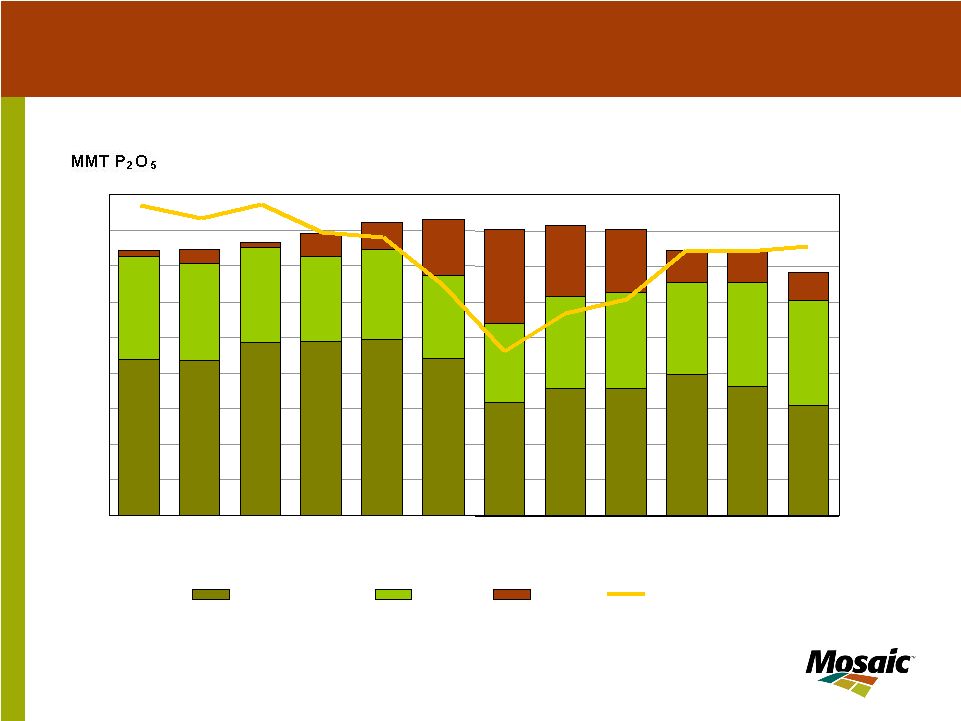 November 2005 16 U.S. Phosphoric Acid Operating Rate Remains High U.S. Phosphoric Acid Production and Operating Rate 4 5 6 7 8 9 10 11 12 13 95 96 97 98 99 00 01 02 03 04 05 06F Fertilizer Year Ending June 30 55% 60% 65% 70% 75% 80% 85% 90% 95% 100% For DAP/MAP/TSP For Other Capacity Operating Rate |
 November 2005 16 Phosphoric acid is the most comprehensive measure of phosphate production. After bottoming at 78% of capacity in 2000/01, the U.S. phosphoric acid operating rate has climbed steadily to the mid-90% range today. This trend is the result of both permanent plant closures as well as increases in acid production. Acid output has increased to make more high analysis fertilizer such as DAP, MAP and TSP, but more acid also is required to meet the growing demand for other uses. The difference between total acid production and the estimated acid used for high analysis fertilizer production has increased from 2.2 million tonnes P2O5 in 2000/01 to 3.0 million tonnes in 2004/05 (light green part of bar). This has been due to the growth of feed phosphates and industrial use products. U.S. idle capacity in 2006 is predicted to be the lowest since the late 1990s. |
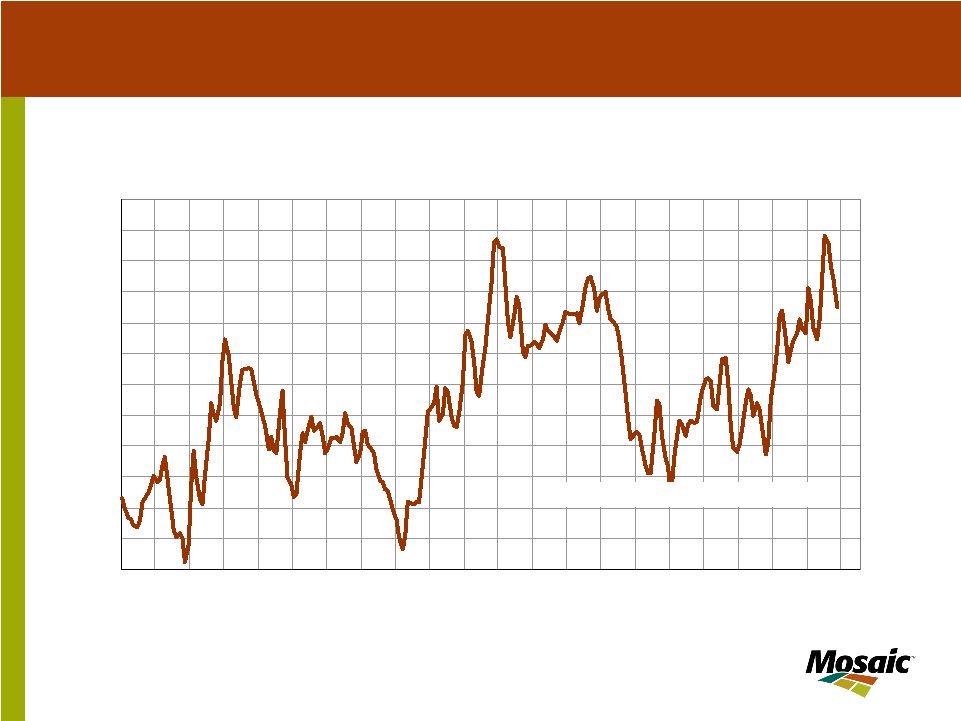
 November 2005 17 DAP Prices near record highs DAP Prices fob Tampa Vessel 130 150 170 190 210 230 250 270 95 96 97 98 99 00 01 02 03 04 05 06 $ MT Source: Fertecon |
 November 2005 17 Now let’s look at phosphate prices. DAP prices have been on the rise for the last three years and reached $265 per tonne fob Tampa in July. Prices have remained at these high levels due largely to strong demand from India and Pakistan and the tightening supply/demand balance in the global phosphate market. |
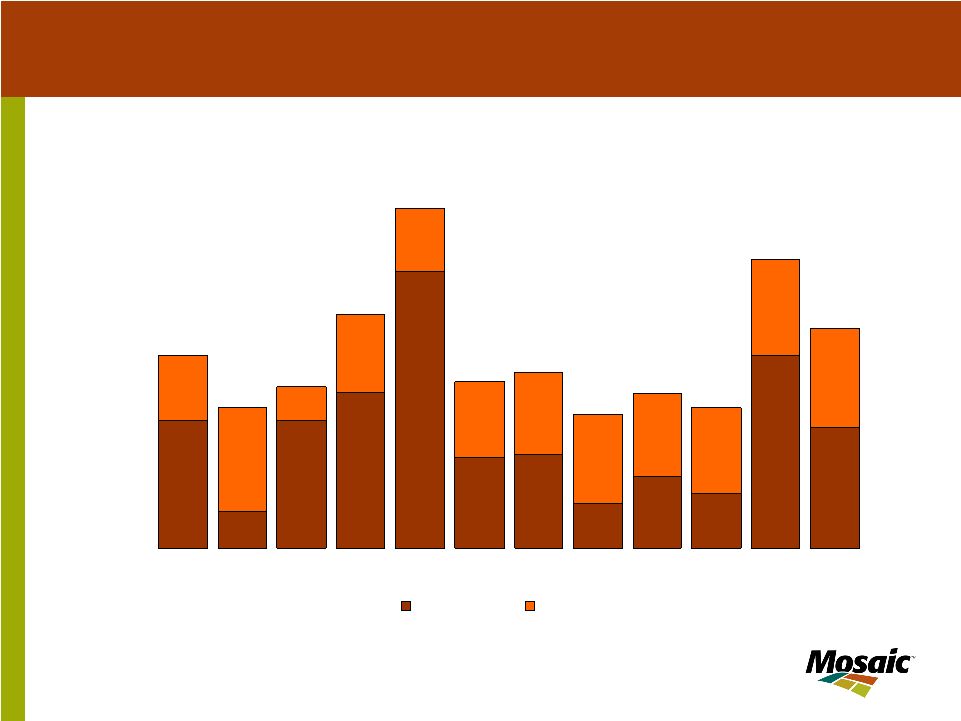
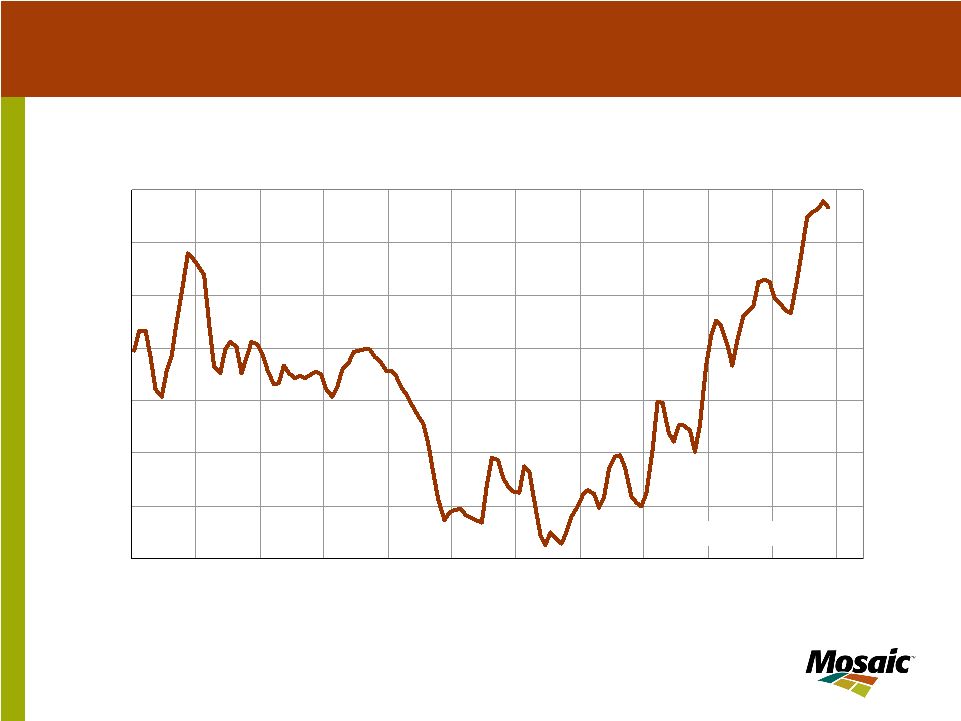
 November 2005 18 DAP Market Margins Pressured by Raw Materials DAP Margin Before Rock Calculated from Published Spot Prices for a Central Florida Plant 30 40 50 60 70 80 90 100 110 120 130 140 150 85 86 87 88 89 90 91 92 93 94 95 96 97 98 99 00 01 02 03 04 05 06 $ ST Source: Fertecon, Green Markets, Mosaic |
 November 2005 18 We like to manage our business based on margins. This charts show the DAP market margin or DAP margin minus sulfur and ammonia costs. Similar to the price trend, the DAP market margin has also been increasing, particularly over the last year and was also recently near a 20-year high. The strong export market resulted in high “market margins” over the last six months. However, raw material prices and their volatility continue to concern us, and are a greater concern today due to the recent increases in natural gas costs. Ammonia prices have recently risen to near $400 per tonne in Tampa and resulted in a decline in the market margin. This decline in margins combined with slow demand is one of the reasons why we recently decided to temporarily reduce phosphates production at some of our locations in Florida. |
 November 2005 19 Business Overview Phosphates Potash Nitrogen / Offshore Financial Outlook Presentation Outline |
 November 2005 19 I’ll turn now to Potash, where we have a strong position in an attractive industry. |
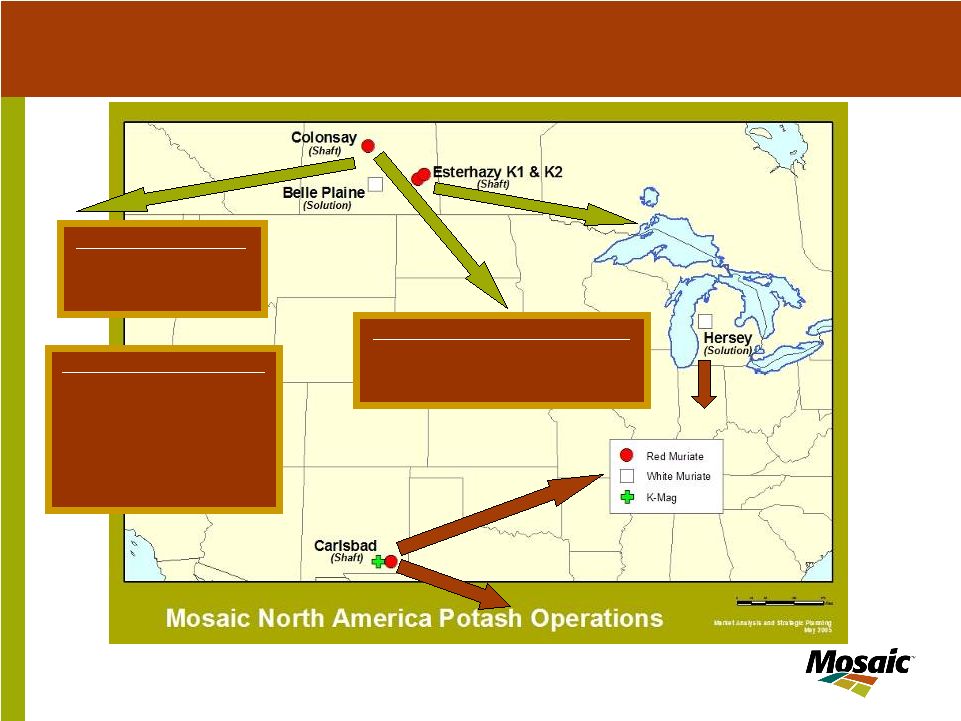 November 2005 20 Export Shipments 3.50 mmt 41% of Total North American Shipments 5.10 mmt 59% of Total Top 5 Export Markets China Brazil India Indonesia Malaysia Potash - World Scale and Low Cost Operations |
 November 2005 20 Potash is a business with good supply - demand fundamentals, strong prices, widening margins, and strong cash flow. We operate four significant mines in Canada as well as two in the United States. About 59% of our product is shipped into the North American market where Mosaic is a significant market participant. Mosaic exports the remaining 41% mainly through Canpotex, the export association of Saskatchewan potash producers. Mosaic accounts for about 37% of Canpotex exports and they are expected to have record high exports in calendar 2005. |
 November 2005 21 0.0 0.5 1.0 1.5 2.0 2.5 3.0 3.5 Rest of the Industry Mosaic Mines Source: British Sulphur Mosaic: Low Cost Operations Mosaic’s four Canadian facilities rank among the lowest cost mines worldwide |
 November 2005 21 Mosaic has a good cost structure in this industry, as do all of the Saskatchewan potash producers. Our one higher-cost potash mine produces a profitable specialty product. We have previously announced a 500,000 tonne per year expansion at our Esterhazy mine which is expected to be onstream by the end of next summer. |
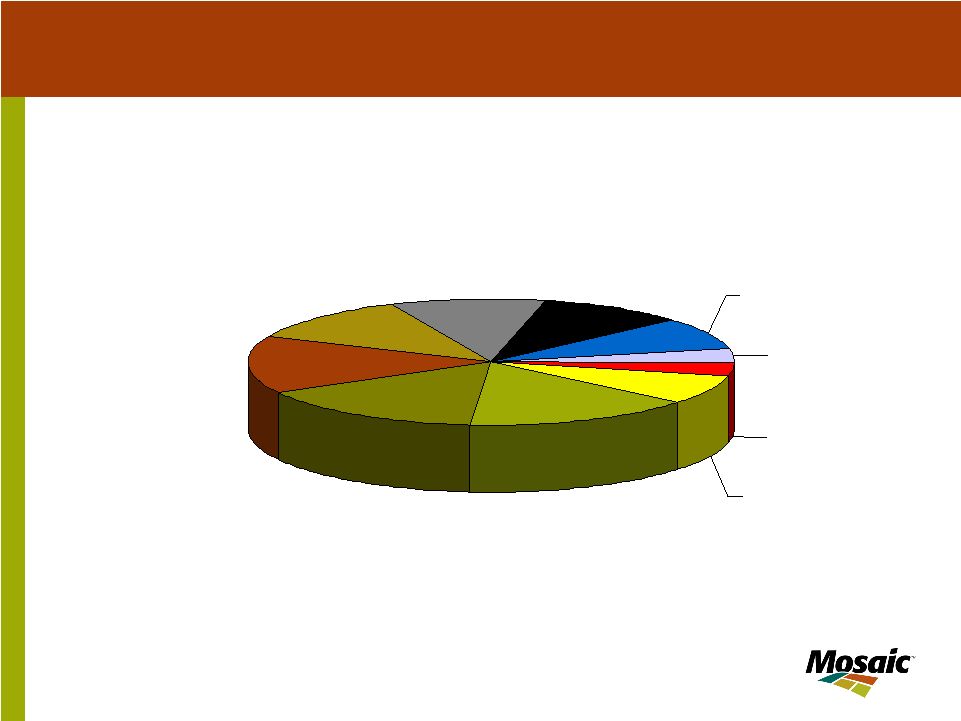 November 2005 22 2004 Estimated Potash Production by Company PCS 15.4% Belaruskali 14.8% Kali & Salz 11.6% Uralkali 9.7% Silvinit 8.2% APC 3.7% Agrium 3.3% Other 7.5% Mosaic 15.4% ICL 10.3% World Potash Production 2004 31,240 MT K 2 O Source: IFA & Mosaic |
 November 2005 22 In 2004 Mosaic produced 15.4% of the world’s potash products. The chart indicates we produced about the same as PCS. However, Mosaic produced approximately 580,000 tonnes K2O for PCS in 2004 or almost 2% of the world’s production. So, if you consider the tons toll-produced for PCS, we were the world’s largest potash producer in 2004 and we expect to remain one of the world’s largest producers in 2005. |
 November 2005 23 Mosaic Announces Lower Potash Production and Sales Volume Production reduced by approximately 200,000 million tonnes per annum • Downtime during the upcoming holiday period • Lower production at Belle Plaine to reduce high-cost natural gas consumption Mosaic Potash sales guidance reduced by 400,000 tonnes to 7.9 – 8.3 million tonnes |
 November 2005 23 Consistent to my prior comments relating to our Phosphate segment, Mosaic recently announced plans to reduce potash production by about 200,000 tonnes. This will mostly occur during the upcoming holiday period combined with lower production rates at our Belle Plaine plant to reduce high-cost natural gas consumption. The potash market remains strong, but we are seeing a seasonally slow period right now. |
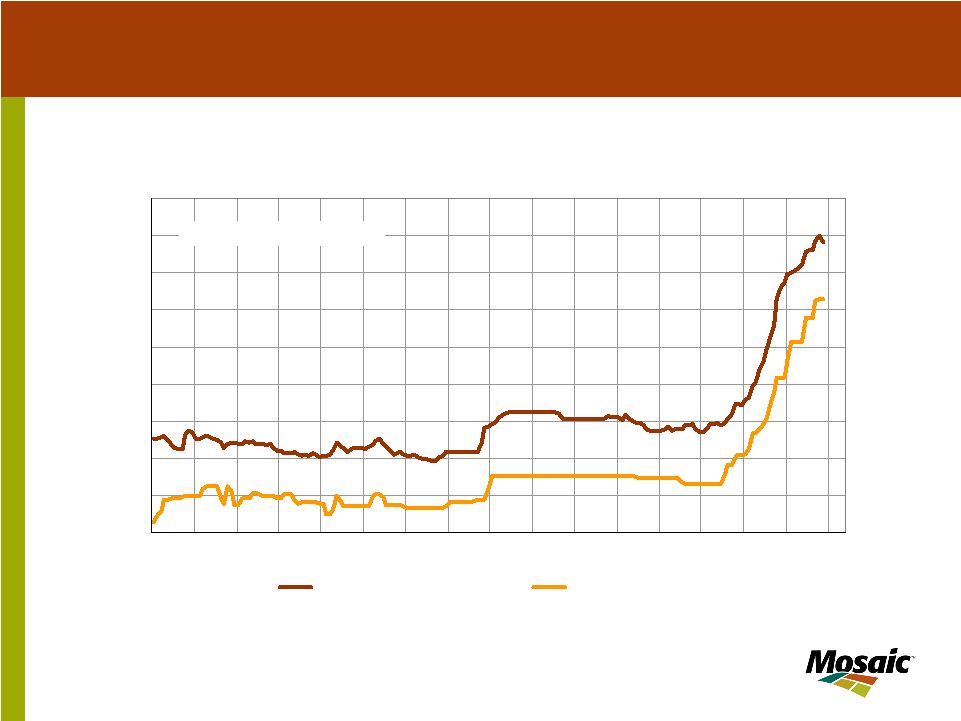 November 2005 24 Potash prices stabilizing at high levels Cornbelt-Saskatchewan Potash Prices US$ ST Granular Grade 60 80 100 120 140 160 180 200 220 240 90 91 92 93 94 95 96 97 98 99 00 01 02 03 04 05 06 Cornbelt Saskatchewan Source: Green Markets |
 November 2005 24 Potash prices are at record high levels. Prices were historically quite stable from 1990 to 2002, but the supply/demand situation tightened over the last three years because of high world demand growth. Therefore, prices have steadily climbed since mid-2003. Demand growth was initially strong in Latin America, mainly Brazil, but this last year the growth has been in Asia, mainly in China. While potash price momentum has slowed, prices are expected to remain high with excellent margins. No new greenfield potash mines are expected come on-stream in the medium term, so the potash outlook remains solid. |
 November 2005 25 Business Overview Phosphates Potash Nitrogen / Offshore Financial Outlook Presentation Outline |
 November 2005 25 Our other two business segments are Nitrogen and Offshore. |
 500,000 metric ton ammonia plant that supplies DAP/MAP granulation requirements in Louisiana Faustina Saskferco (Equity Earnings of $15 mil for Fiscal 2005 JV with Investment Saskatchewan, Inc. (49%) and Citibank Canada (1%) Owner and operator of 1.2 million metric ton nitrogen fertilizer plant located in Belle Plaine, Sask., across the road from the potash solution mine Saskferco capacity totals 1.2 million tonnes of product with a sales mix of roughly 880,000 tonnes of granular urea, 230,000 tonnes of 28% UAN solution, 50,000 tonnes of MicroGran feed urea and 30,000 tonnes of ammonia Highly energy efficient facility Strong North American Nitrogen Position |
 Mosaic has a good North American Nitrogen position. This is through our 50% equity investment in Saskferco – a nitrogen plant strategically located in Saskatchewan. This facility has a competitive cost position as it is highly energy efficient plus it is able to purchase lower price natural gas compared with U.S. plants. We earned $15 million in equity earnings from this investment in 2005. |
 November 2005 27 Distribution assets including port terminals, bagging lines, warehouses and blending/NPK plants in Argentina, Brazil, Canada, Chile, China, India, Thailand, Ukraine and the United States Approximately 1.0 million tonnes of owned storage capacity at two dozen facilities worldwide SSP and feed phosphate production in South America and NPK compound production and bulk blending plants in China Strategic Equity Stakes (Equity earnings of $39 mil in fiscal 2005) 20% equity stake in Fosfertil, the largest phosphate and nitrogen producer in Brazil. 35% equity stake in a 660,000 tonne DAP granulation plant in Haikou, China Offshore – Global Footprint in Attractive Markets |
 November 2005 27 Our Offshore business segment differentiates Mosaic from our North American competitors. We have a large global production and distribution footprint in key growth markets, particularly in Latin America and Asia. It includes approximately one million tonnes of storage capacity at two dozen facilities worldwide. In addition, we have SSP and feed production in Brazil and NPK compound and bulk blending plants in China. We also had equity earnings of $39 million from this business due to our equity positions in production facilities in Brazil and China. |
 November 2005 28 Distribution – A Competitive Advantage Capturing time and place utility Squeezing inefficiencies out of the supply chain Adding value by delivering crop nutrition solutions Harvesting market intelligence |
 November 2005 28 Our distribution business today is a low margin business which nonetheless produces attractive returns on capital due to low capital intensity. Longer term, we believe there is a substantial opportunity to capture more value “Beyond the plant gate.” By combining our considerable agricultural experience and knowledge with our extensive global infrastructure, we believe we can better manage the inherent seasonality of the business, squeeze significant inefficiencies out of the supply chain, deliver higher value solutions. All while harvesting useful market intelligence. |
 November 2005 29 Business Overview Phosphates Potash Nitrogen / Offshore Financial Outlook Presentation Outline |
 November 2005 29 I will end with a brief discussion of Mosaic’s financial outlook. |
 November 2005 30 Fiscal 2006 First Quarter Highlights Net sales of $1.4 billion Net earnings of $76.1 million Improved Phosphate segment results with net sales of $865 million and operating earnings of $107 million Strong Potash segment with net sales $268 million and operating earnings of $99 million Offshore net sales of $340 million and operating loss of $8 million Equity earnings of $14 million from Brazil, China and investment in Saskferco |
 November 2005 30 For the first quarter of 2006, we earned $76.1 million or $0.18 per share with net sales of $1.4 billion. During the first quarter, our Phosphate business showed continued improvement with earnings of $107 million, aided by a strong pricing environment and good market fundamentals. The export market has been the main reason for higher phosphate prices. Our Potash business continues to benefit from record high prices with earnings of $99 million. Sales volumes were soft in the quarter due to seasonal factors, including planned maintenance and expansion downtime. Mosaic’s Offshore business segment had an operating loss of $8 million in the first quarter, mainly the result of continued poor farm economics in Brazil, which we hope will slowly improve in calendar year 2006. Finally, our investments in non-consolidated companies contributed $14 million for the quarter, an increase of 45% compared with a year ago. These investments include Saskferco, and our equity interests in the key strategic growth markets of Brazil and China. |
 November 2005 31 Mosaic’s Balance Sheet Highlights 42.8% $6.1 million $3.5 billion $2.6 billion Debt:Capital Ratio Total Capital Total Equity Total Debt 8-31-05 |
 November 2005 31 I would like to quickly highlight some of Mosaic’s balance sheet information as information of August 31, 2005. Our total debt was $2.6 billion and total capital was $6.1 billion giving us a debt-to- capital ratio of 42.8%. One of our key goals is to strengthen the balance sheet and achieve investment grade ratings. |
 November 2005 32 Fiscal 2006 Mosaic Financial Outlook Phosphate sales volume of 9.7 to 10.1 million tonnes Potash sales volume of 7.9 to 8.3 million tonnes Second Quarter: High phosphate prices and higher potash shipments partially offset by higher raw material prices Second Half: Seasonally slow third quarter and strong fourth quarter Focus on generating cash and lowering costs, including synergy capture |
 November 2005 32 For 2006, we are focused on earnings and cash generation. We are projecting phosphate sales volumes of 9.7 to 10.1 million tonnes for fiscal 2006. DAP prices and margins should remain at or near current levels during the second quarter, but increases in raw materials cost will pressure Mosaic to increase prices in order to maintain margins. As many of you know, the recent hurricanes in the U.S. Gulf have put pressure on energy costs, including ammonia, which is one of our key raw materials in producing various phosphate fertilizers. In potash, we are projecting sales of 7.9 to 8.3 million tonnes for fiscal 2006, down 0.4 million tonnes compared with our prior guidance. This means our potash mines will be working at higher levers compared with last fiscal year. We are optimistic about our second quarter results because of continued high phosphate prices and an increase in potash shipments compared with the first quarter. However, this positive outlook is slightly tempered by current high raw material prices. The third quarter is expected to be our seasonally weakest quarter of the year and our fourth quarter is expected to be the strongest, as is typical. |
 November 2005 33 Fiscal 2006 Mosaic Financial Outlook S,G&A cost projected at about $60 million per quarter, including new ERP costs Interest cost expected about $40 million per quarter including about $12 million of amortization credit Capital Expenditures expected of $350 to $400 million including some synergy projects Equity Earnings projected to range from $35 to $50 million |
 November 2005 33 For the Fiscal 2006 outlook, let me finish with some additional financial drivers. S,G&A costs are projected to be about $60 million per quarter. As we have noted before, SG&A costs will benefit from the implementation of a new enterprise resource planning system, which is on track for a summer implementation. This system will allow us to eliminate duplicate systems, and greatly streamline business processes. Our interest costs are expected to average about $40 million per quarter and this includes about $12 million per quarter of an amortization credit. For the first quarter, Mosaic’s effective tax rate was 44.5%, which is at the high end of our guidance. Increasing our U.S. profitability – primarily in the phosphate business – is a major key to a lower tax rate. We are making progress on that front and could see a lower tax rate by year end. Capital expenditures are expected to be in about $350 to $400 million including some synergy projects. Finally, equity earnings are projected to range from $35 to $50 million for Fiscal 2006. |
 November 2005 34 Sensitivities ($ in millions, except per share data) Change Earnings ($ in millions) EPS Marketing MOP Price ($/tonne) $10 $54.6 $0.07 Potash Volume (000 tonnes) 500 $37.5 $0.05 DAP Price ($/tonne) $10 $100.0 $0.13 Phosphate Volume (000 tonnes) 500 $10.0 $0.01 Raw Materials Sulfur ($/lt) $5 $23.9 $0.03 Ammonia ($/mt) $10 $13.6 $0.02 Natural Gas ($/mmbtu) $1.00 $31.2 $0.04 |
 November 2005 34 Note that our results can vary widely based upon external trends, as shown by this sensitivity analysis. Clearly, the most upside potential is for our phosphates business. The one item that is not on this chart over which we have direct control – rock cost – is an area that is getting significant focus and attention, as we’ve already noted. As noted earlier, high natural gas prices are a concern as it results in slightly higher costs. In our potash business, natural gas has accounted for about 17% of Mosaic’s cost structure. These energy costs will rise but the Potash business is expected to continue to show high margins. The main impact of higher natural gas on our phosphates business is on the price of ammonia. Today, ammonia accounts for about 40% of the cost per tonne of DAP. |
 November 2005 35 Mosaic Management Priorities Focus on Execution & Cash Flow Generation Harvest cost synergies - $145 million annual run rate goal Cash flow generation Sustain potash momentum Reduce phosphate mining and processing costs Pay down debt – achieve investment grade status Demonstrate market leadership Show operating discipline Earn the right to grow |
 November 2005 35 From the start, Mosaic has an experienced management team that is driven to deliver superior returns during the industry’s cyclical swings. Our immediate priorities are to harvest the cost synergies and reduce phosphate mining and processing costs. We plan to sustain the excellent momentum in the potash business, including the expansion of capacity at Esterhazy. We are committed to delivering significant annual run rate synergy savings from the combined operation with a total of $145 million by the end of fiscal 2007. As the end of August 2005, annualized synergies reached $87 million, ahead of our projections. Superior execution means we also are focused on strengthening our balance sheet. Our goal is to become an investment grade company as soon as possible. To reach that goal, we are placing a major emphasis on: improving net cash flow; reducing working capital; and, paying down our debt. And finally, we plan to earn the right to grow. This means we need to further strengthen our balance sheet, complete our merger integration and reduce costs, as we work toward achieving our vision of becoming a global, low-cost producer of crop nutrients. |
 November 2005 36 http://www.mosaicco.com |
 November 2005 36 I am excited about Mosaic’s prospects. We’ve made good progress during the past year, but realize this is just one step toward our full potential. Thank you. |