Exhibit 99.1


The fertilizer year ending June 30, 2006 will go down as one of the most challenging in recent history. Many of these challenges were linked to the powerful hurricanes that ripped through the U.S. Gulf Coast last summer. The deadly storms sparked an explosion in energy prices, knocked out local phosphate and sulphur recovery operations and crippled the transportation system on the lower Mississippi River. High and volatile energy and nutrient prices caused U.S. distributors to delay purchases, buy on a hand-to-mouth basis and make absolutely certain bins were empty at the end of the spring season.
Hurricane-related developments were not the only challenges in 2005/06, however. The appreciation of thereal coupled with flat soybean prices further eroded farm economics in Brazil and caused a downturn in nutrient use and imports. Negotiations between Chinese potash buyers and Belarusian and Russian potash suppliers got bogged down in politics and that, combined with a large drop in domestic shipments, forced potash producers to sharply curtail output during the first half of 2006. India’s chaotic fertilizer subsidy policy continued to foster uncertainty in the world’s third largest nutrient market.
This issue ofMarket Mosaic recaps a few lessons we learned during the 2005/06 fertilizer year.
Monitor the Pipeline
The crop nutrient pipeline that connects production points to farm fields is long and large. The pipeline is long because the resources required to produce crop nutrients often are found in regions that are located long distances from where they are used. The pipeline is large because mining and processing operations typically run on a 24-7 basis while farmers apply fertilizer during just a few short application windows each year.
This large pipeline expands and contracts depending on a number of variables. Price expectations are a key driver. If buyers expect prices to go up they stock up on product in order to beat the next price increase or to avoid delivery delays due to tight supplies. If buyers expect prices to drop and believe that suppliers can deliver product just in time they de-stock the pipeline.

Henry Hub gas prices spiked to the $15 per million Btu range following the devastating hurricanes that hit the U.S. Gulf Coast last summer. Prices retreated to the $9 per million Btu level by early November due in large part to the recognition that demand losses resulting from the hurricanes nearly equaled the supply disruptions. Concerns about adequate supplies of gas in storage to meet winter heating requirements caused a strong price rally from mid-November to mid-December with the Henry Hub daily cash price index peaking at $15.40 per million Btu on December 13. A mild end of December followed by the warmest January on record in most parts of North America eased supply fears and resulted in a sharp sell off. Gas prices declined to less than $6 per million Btu by mid-May.
Vol. 2 No. 2
May 2006
Michael R. Rahm
Vice President
mike.rahm@mosaicco.com
Joseph Fung
Market Analyst
joseph.fung@mosaicco.com
Market Mosaic is a quarterly newsletter published for our customers and suppliers each February, May, August and November by the Market Analysis group of The Mosaic Company. The February and August issues recap our near term outlook for global agricultural and crop nutrient markets. The May and November issues take an in-depth look at a topic of special interest to our customers and suppliers.
| | | | |
| Market Mosaic Vol. 2, Issue 2· May 2006 | | 1 | | |
Developments in the North American potash market during the last three years provide a vivid example of swings in pipeline inventories and demonstrate the importance of monitoring the pipeline. The chart shows North American shipments and our estimate of actual use. Shipments are calculated from reliable production, inventory and trade statistics and are defined as beginning stocks plus production and imports less exports and ending inventories. Use is estimated from statistics compiled by state regulatory agencies from tonnage tax receipts as well as from industrial and other use estimates.
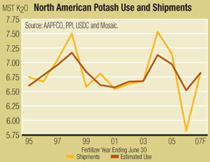
We calculate that shipments into the North American market exceeded actual use during the 2003/04 and 2004/05 fertilizer years by a combined total of about 600,000 tons K2O. Distributors stocked up on potash in order to beat the next price increase and to avoid delivery delays caused by strong offshore demand and record low producer stocks.
Potash supply caught up with demand during the 2005/06 fertilizer year due to the combination of production increases worldwide and a slowdown in demand growth. That calmed concerns about price and product availability. As a result, distributors are working down large pipeline stocks this year. In fact, we estimate that domestic shipments will decline a staggering 19 percent in 2005/06. And that feels even worse to North American producers because offshore imports have increased sharply and captured a record share of the U.S. market this year.
We estimate that the drop in actual potash use this year was much less than the large decline in shipments. Based on reasonable planted acreage and application rate assumptions, we estimate that North American potash use was off seven to nine percent in 2005/06. That implies a 750,000 ton K2O draw-down in pipeline stocks this year.
This development is not unique to North America. We estimate that a similar expansion and contraction of the distribution pipeline took place in the other large potash markets – namely Brazil, China and India – during the last few years.
The good news is that these developments have flushed the global potash pipeline and set up the market for a strong rebound in shipments. For example, we forecast that North American potash shipments will snap back 18 percent in 2006/07.
Understand Kitchen Table Economics
Most crop nutrient producers and distributors feed this large pipeline and have limited contact with the millions of farmers from around the globe who till, plant and nourish the soil. Nutrient demand originates on the farm and understanding a farmer’s kitchen table economics is another important lesson of 2005/06.
Farmers consider many factors when making decisions about what to plant or how much of an input to use. Crop prices, the costs of crop nutrients and other inputs, production risks, new technologies such as genetically modified seed and even macroeconomic variables such as exchange and interest rates influence their decisions. Kitchen table economics vary significantly by region and by crop, but nutrient demand at the farm level often is less volatile than shipments into pipeline.
In the United States, the surge in energy and nutrient costs caused farmers to switch some acreage from corn to soybeans. The U.S. Department of Agriculture reported on March 31 that farmers intended to plant just 78 million acres of corn this year, down about 5 percent or 3.75 million acres from last year. Most analysts expect that corn acreage will exceed this early reading by one to two million acres due to the recent rally in corn prices. Other farmers plan to delay use from pre-plant to side-dress application and some simply decided to reduce application rates, mine soil nutrients and accept the risk of lower yields. We project that U.S. nutrient use will drop about seven percent this year with nitrogen use down approximately five percent and phosphate and potash use each down seven to nine percent.
In India, the kitchen table economics of wheat production look mighty good today. Reports from our Indian team indicate that local wheat prices are at all time highs with a prices topping $200 per tonne in a few markets. Farmers reportedly are hoarding wheat in anticipation of even higher values. The surge in wheat prices combined with low government controlled retail fertilizer prices has boosted nutrient demand prospects in India.
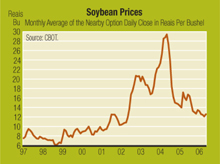
In Brazil, the kitchen table economics of soybean production remain problematic. The chart shows the monthly average of the daily closing price of the nearby soybean option inreais per bushel. This barometer of the local currency price of soybeans declined from the R16 per bushel to the R12 per bushel range during the last year. Current prices are less than one-half of the 2004 peak. A meaningful recovery in Brazilian nutrient use will require a rebound in soybean prices or a significant devaluation of thereal.
| | | | |
| Market Mosaic Vol. 2, Issue 2· May 2006 | | 2 | | |
Manage Beyond Seasonality
If you drive too fast at night, you drive “beyond your headlights.” That means you can not adjust the speed of your vehicle in time for the sharp curve ahead or for the deer standing in the middle of the road just beyond your headlights. That’s not good driving. But managing “beyond your headlights” or beyond what you can see just a few weeks or months out is imperative, especially in markets characterized by strong seasonal swings in demand.
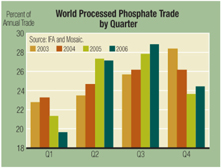
Processed phosphate trade is a good example. Recent developments have caused significant changes in the seasonality of global trade. The chart shows the percentage of annual processed phosphate trade shipped each calendar quarter since 2003 including our forecasts for the last three quarters of 2006. The drop in exports to China coupled with growth in markets such as Brazil, India and Pakistan has shifted shipments from the first and fourth quarters to the second and third quarters of the year.
Shipments during the first quarter of 2006 accounted for less than 20 percent of projected annual shipments. Estimated shipments for the third quarter of 2006 are forecast to climb to almost 30 percent of the annual forecast. That translates into a difference of almost two million tonnes between the first and third quarter shipments based on an annual trade forecast of almost 20.3 million tonnes in 2006.
Changes in the seasonality of processed phosphate trade were exacerbated this year by developments in the domestic market. Transportation disruptions as well as the uncertainty caused by extremely volatile energy prices caused domestic distributors to delay purchases. For example, domestic shipments of DAP and MAP during the first six months of the fertilizer year (Jul-Dec) were down 17 percent from a year earlier and were off 12 percent from the five year average. Steady if not spectacular shipments during the last half of the fertilizer year (Jan-Jun) will cause shipments to end the year down about seven to eight percent and in line with the expected decrease in phosphate use.
Managing beyond the seasonality of the current quarter is another important lesson of 2005/06. Phosphate players who now face lower lows during the slack quarters and higher highs during the boom quarters are adapting to these changes by adjusting turnaround schedules, idling plants during off-peak periods, utilizing and expanding storage capacity throughout the supply chain and working with strategic customers to ship product during slow demand periods.
Respect the Market
Crop nutrient markets are global commodity markets. They function quickly, efficiently and indifferently to allocate resources to their highest valued use. Producers throttle production up or down in response to market prices. Trading companies scour the globe for arbitrage opportunities. Farmers adjust their crop mix and input usage based on market signals. The 2005/06 fertilizer year once again taught us to respect the market.
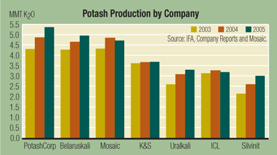
The supply response of potash producers following the run-up in prices during the last two years is a good example. According to IFA statistics, global potash output increased 17 percent or 4.9 million tonnes K2O between 2003 and 2005. Long time industry observers believed that potash producers in the former Soviet Union (FSU) were at or close to maximum output in 2003. Yet the three FSU producers accounted for almost one-half of the increase in global output during the last two years.
The jump in U.S. nitrogen imports this year is another good example of the speed and efficiency of nutrient markets. Traders and distributors quickly lined up record volumes of ammonia, urea and nitrogen solutions for the U.S. market following the post-Katrina run-up in natural gas and nitrogen prices. For example, we estimate that U.S. urea imports from offshore origins will soar to almost five million tons in 2005/06, up 47 percent from last year and up 25 percent from the previous peak in 2000/01. Imports from offshore origins for the six months from October through March totaled more than 3.8 million tons or an average of 630,000 tons per month!
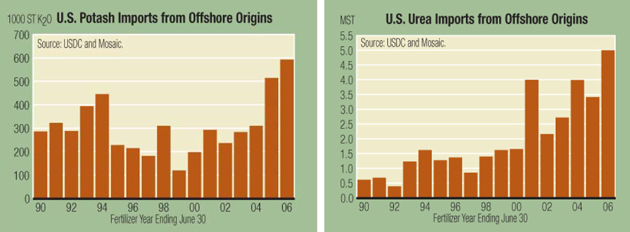
U.S. potash imports from offshore origins also climbed to record levels this year as a result of the large increases in global production and the sharp decline in Brazilian imports. We project that U.S. potash imports from offshore origins will increase more than 15 percent to a just less than 600,000 tons K2O in 2005/06.
| | | | |
| Market Mosaic Vol. 2, Issue 2· May 2006 | | 3 | | |
Mosaic phosphate and potash production
Where Did Mosaic Rank in 2005?
The tables and charts below report Mosaic’s phosphate and potash production by facility for calendar year 2005 and show where Mosaic ranked among global producers last year. Production estimates for competitors were taken from 2005 annual reports or from statistics published by the International Fertilizer Industry Association (IFA). The tables also list Mosaic’s phosphate capacity following the indefinite closures of the Fort Green mine and the Green Bay and South Pierce facilities at the end of May.
Phosphate Rock
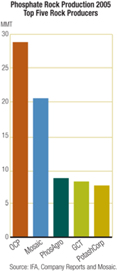
Mosaic mined 20.5 million tonnes of phosphate rock in 2005, accounting for 13 percent of estimated global output. Mosaic ranked as the second largest phosphate rock miner last year.
The company operated seven mines and beneficiation plants in 2005. The facilities operated at an average rate of 86 percent of capacity Rock production declined during the second half of the year following the mine-out and closure of the Kingsford mine in September and the shut down of the beneficiation plant at Wingate Creek during the fourth quarter. The decline in production coincided with the drop in rock requirements due to the shut down of the U.S. Agri-Chemicals plant and lower operating rates at Mosaic’s phosphate facilities during the last half of 2005.
Mosaic will operate four mines and beneficiation plants with annual capacity of about 15 million tonnes following the indefinite closure of the Fort Green mine at the end of May. Capacity is projected to climb to 16 million tonnes as a result of de-bottlenecking the South Fort Meade and Four Corners operations.
The Mosaic Company
U.S. Phosphate Rock Capacity, Production and Operating Rate by Mine
2005 Calendar Year
| | | | | | | | | |
Unit: 1000 Tonnes | | | | | | | | | |
Mine | | Current
Capacity | | 2005
Capacity | | 2005
Production | | 2005
Oper Rate | |
Fort Green | | na | | 4,900 | | 4,771 | | 97 | % |
Four Corners | | 6,710 | | 6,710 | | 5,612 | | 84 | % |
Hookers Prairie | | 2,090 | | 2,090 | | 1,806 | | 86 | % |
Hopewell | | 550 | | 620 | | 468 | | 75 | % |
Kingsford | | na | | 2,720 | | 1,844 | | 68 | % |
South Fort Meade | | 5,620 | | 5,620 | | 5,207 | | 93 | % |
Wingate | | na | | 1,090 | | 771 | | 71 | % |
| | | | | | | | | |
Total | | 14,970 | | 23,750 | | 20,479 | | 86 | % |
Phosphoric Acid
Phosphoric acid is the intermediate product used to produce a number of downstream fertilizer and animal feed products. This stage of processing is one of the best spots to gauge a facility’s overall phosphate output and operating rate.
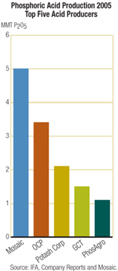
Mosaic produced 5.0 million tonnes (P2O5) of phosphoric acid in 2005, accounting for 15 percent of estimated world production. Mosaic ranked as the largest phosphoric acid producer last year.
The company produced phosphoric acid at six facilities in 2005. The plants ran at an average rate of 90 percent of capacity. The deadly hurricanes that hit the U.S. Gulf Coast last summer reduced operating rates by knocking out the Uncle Sam plant for a few weeks and by disrupting sulphur supplies to both Louisiana and Florida plants for several weeks. Mosaic also curtailed output at Green Bay and Uncle Sam toward the end of the year due to weak demand.
Mosaic will operate four facilities with annual capacity of 4.4 million tonnes P2O5 following the indefinite closures of the Green Bay and South Pierce facilities at the end of May. Capacity is projected to creep up to almost 4.7 million tonnes as a result of de-bottlenecking at each of the other facilities.
| | | | |
| Market Mosaic Vol. 2, Issue 2· May 2006 | | 4 | | |
The Mosaic Company
U.S. Phosphoric Acid Capacity, Production and Operating Rate by Facility
2005 Calendar Year
Unit: 1000 Tonnes P2O5
| | | | | | | | | |
Facility | | Current
Capacity | | 2005
Capacity | | 2005
Production | | 2005
Oper Rate | |
Bartow | | 950 | | 950 | | 957 | | 101 | % |
Green Bay | | na | | 640 | | 451 | | 71 | % |
New Wales | | 1,720 | | 1,720 | | 1,654 | | 96 | % |
Riverview | | 860 | | 860 | | 829 | | 96 | % |
South Pierce | | na | | 540 | | 459 | | 85 | % |
Uncle Sam | | 870 | | 870 | | 657 | | 75 | % |
| | | | | | | | | |
Total | | 4,400 | | 5,580 | | 5,007 | | 90 | % |
Processed Phosphate
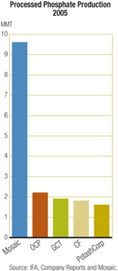
Mosaic produced 9.6 million tonnes of processed phosphate in 2005. Processed phosphate includes diammonium phosphate (DAP), monoammonium phosphate (MAP), MicroEssentials™ (MES) and triple superphosphate (TSP). The company accounted for about 20 percent of estimated world production in 2005 and ranked as the largest processed phosphate producer last year.
Mosaic produced processed phosphate at six facilities in 2005. The facilities operated at an average rate of 80 percent of capacity. DAP production totaled 6.5 million tonnes and accounted for more than two-thirds of processed phosphate output in 2005. MAP output totaled 2.4 million tonnes or just less than one-quarter of the total. TSP and MES accounted for the remainder of processed phosphate production last year. Mosaic operated 15 granulation plants at these six facilities. Nine of the granulation plants produced just one product such as DAP or MAP, but six of the plants made more than one product last year.
Mosaic will operate four large facilities with capacity of approximately 10.0 million tonnes of processed phosphate following the indefinite closure of the Green Bay and South Pierce facilities at the end of May. The closure of the South Pierce facility means that Mosaic will no longer produce TSP. The company will run 12 granulation plants at these four facilities. Seven plants will produce just one product, but five plants will be capable of switching between products depending on market conditions. We project that MAP and MES production will increase at the expense of DAP output during the next few years.
The Mosaic Company
U.S. Processed Phosphate Capacity, Production and Operating Rate by Facility
2005 Calendar Year
| | | | | | | | | |
Unit: 1000 Tonnes of DAP, MAP, MES and TSP | | | | | | | |
| | | | |
Facility | | Current
Capacity | | 2005
Capacity | | 2005
Production | | 2005
Oper Rate | |
Bartow | | 2,280 | | 2,270 | | 2,097 | | 92 | % |
Faustina | | 1,920 | | 1,900 | | 1,358 | | 71 | % |
Green Bay | | na | | 1,300 | | 896 | | 69 | % |
New Wales | | 3,860 | | 3,810 | | 3,263 | | 86 | % |
Riverview | | 1,880 | | 2,000 | | 1,431 | | 72 | % |
South Pierce | | na | | 730 | | 570 | | 78 | % |
| | | | | | | | | |
Total | | 9,940 | | 12,010 | | 9,616 | | 80 | % |
| | | | |
DAP | | 6,400 | | 7,870 | | 6,480 | | 82 | % |
MAP | | 3,140 | | 3,040 | | 2,299 | | 76 | % |
MES | | 400 | | 370 | | 267 | | 72 | % |
TSP | | na | | 730 | | 570 | | 78 | % |
| | | | |
| Market Mosaic Vol. 2, Issue 2· May 2006 | | 5 | | |
Feed Phosphate
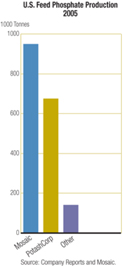
Mosaic produced about 950,000 tonnes of feed phosphate and accounted for more than one-half of U.S. feed phosphate production in 2005. Mosaic ranked as the largest feed phosphate producer in the United States last year.
The company produces feed at its New Wales and Riverview facilities. The plants ran at an average rate of 95 percent of capacity in 2005. The New Wales complex produces dicalcium phosphate (Dical), monocalcium phosphate (Monocal), monoammonium phosphate and defluorinated rock phosphate (DFP). The Riverview operations produce Dical and Monocal.
Mosaic markets its U.S. feed phosphate production under long-established and well-respected brands. Dical is marketed under the brand name Dynafos® and Monocal is sold under the brand name Biofos®. DFP is marketed under the brand name Multifos®.
The Mosaic Company
U.S. Feed Phosphate Capacity, Production and Operating Rate by Facility
2005 Calendar Year
| | | | | | | |
Unit: 1000 Tonnes | | | | | | | |
| | | |
Facility | | 2005
Capacity | | 2005
Production | | 2005
Op. Rate | |
New Wales - Dical/Monocal | | 580 | | 560 | | 97 | % |
New Wales - DFP | | 170 | | 170 | | 100 | % |
Riverview - Dical/Monocal | | 250 | | 219 | | 87 | % |
| | | | | | | |
Total | | 1,000 | | 949 | | 95 | % |
Potash
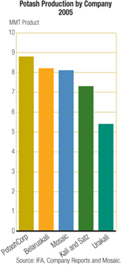
Mosaic’s potash operations lifted or pumped 9.1 million tonnes of potash from the earth in 2005 – more than any other company in the world last year. Of the total, 953,000 tonnes were toll-mined for PotashCorp from the reserves it owns at Esterhazy. That put Mosaic’s own production at 8.1 million tonnes for the year.
Mosaic ranked as the third largest potash producer last year, down two notches from the number one spot in 2004 when Mosaic produced 8.4 million tonnes of potash. Mosaic mined less potash in 2005 than in 2004 as a result of extended turnarounds for catch-up maintenance in mid-2005 and curtailments for inventory control at the end of 2005.
Mosaic operated six mines and mills last year including four large-scale mines in Saskatchewan and two smaller-scale mines in the United States. The facilities operated at an average rate of 91 percent of capacity. The four large Canadian mines accounted for 83 percent of Mosaic’s production.
Potash Capacity, Production and Operating Rates by Mine
Calendar Year 2005
| | | | | | | | | | | | | | | |
Unit: 1000 Metric Tonnes | | | | | | | | | | | | | | | |
| | | | | | | Mine Capacity | | Mine Production | | Oper | |
Mine | | Technology | | Product | | Product | | Nutrient | | Product | | Nutrient | | Rate | |
Canada | | | | | | | | | | | | | | | |
Belle Plaine | | Solution | | White MOP | | 2,760 | | 1,710 | | 2,390 | | 1,492 | | 87 | % |
Colonsay | | Shaft | | Red MOP | | 1,810 | | 1,100 | | 1,469 | | 887 | | 81 | % |
Esterhazy K1 & K2 | | Shaft | | Red MOP | | 3,810 | | 2,320 | | 3,873 | | 2,369 | | 102 | % |
| | | | | | | | | | | | | | | |
Canada Total | | | | | | 8,380 | | 5,130 | | 7,732 | | 4,749 | | 93 | % |
| | | | | | | |
United States | | | | | | | | | | | | | | | |
Carlsbad | | Shaft | | Red MOP | | 540 | | 325 | | 470 | | 283 | | 87 | % |
| | | | K-Mag | | 1,200 | | 258 | | 776 | | 167 | | 65 | % |
Hersey | | Solution | | White MOP | | 150 | | 93 | | 116 | | 72 | | 77 | % |
| | | | | | | | | | | | | | | |
| | | | | | | |
U.S. Total | | | | | | 1,890 | | 676 | | 1,362 | | 522 | | 77 | % |
| | | | | | | | | | | | | | | |
North America Total | | 10,270 | | 5,806 | | 9,094 | | 5,270 | | 91 | % |
Less Esterhazy Toll Production for Potash Corp | | 953 | | 581 | | 953 | | 581 | | na | |
Mosaic Capacity and Production | | 9,317 | | 5,225 | | 8,141 | | 4,689 | | na | |
| | | | |
| Market Mosaic Vol. 2, Issue 2· May 2006 | | 6 | | |
Certain statements contained herein constitute forward-looking statements within the meaning of the Private Securities Litigation Reform Act of 1995. Such statements include, but are not limited to, statements about future financial and operating results. Such statements are based upon the current beliefs and expectations of The Mosaic Company’s management and are subject to significant risks and uncertainties. These risks and uncertainties include but are not limited to the predictability of fertilizer, raw material and energy markets subject to competitive market pressures; changes in foreign currency and exchange rates; international trade risks including, but not limited to, changes in policy by foreign governments; changes in environmental and other governmental regulation; the ability to successfully integrate the former operations of Cargill Crop Nutrition and IMC Global Inc. and the ability to fully realize the expected cost savings from their business combination within expected time frames; adverse weather conditions affecting operations in central Florida or the Gulf Coast of the United States, including potential hurricanes or excess rainfall; actual costs of closure of the South Pierce, Green Bay and Fort Green facilities differing from management’s current estimates; realization of management’s expectations regarding reduced raw material or operating costs, reduced capital expenditures and improved cash flow and anticipated time frames for the closures; and the ability to obtain any requisite waivers or amendments from lenders or regulatory agencies with oversight of The Mosaic Company or its phosphate business, as well as other risks and uncertainties reported from time to time in The Mosaic Company’s reports filed with the Securities and Exchange Commission. Actual results may differ from those set forth in the forward-looking statements.
Copyright© 2006. The Mosaic Company. All rights reserved. This issue ofMarket Mosaic is available at www.mosaicco.com.
The Mosaic Company
Atria Corporate Center, Suite E490
3033 Campus Drive
Plymouth, MN 55441
USA
(800) 918-8270 toll free
(763) 577-2700
| | | | |
| Market Mosaic Vol. 2, Issue 2· May 2006 | | 7 | | |