Exhibit 99.2
The Mosaic Company
Goldman Sachs Ag Forum February 13, 2007
Good Morning and thank you for inviting Mosaic to present at the Goldman Sachs 11th Annual Ag Forum. I am Larry Stranghoener, Executive Vice President and Chief Financial Officer for Mosaic.
1
Safe Harbor Statement
Certain statements contained herein constitute “forward-looking statements” as that term is defined under the Private Securities Litigation Reform Act of 1995. Although we believe the assumptions made in connection with the forward-looking statements are reasonable, they do involve known and unknown risks, uncertainties and other factors that may cause the actual results, performance or achievements of The Mosaic Company, or industry results generally, to be materially different from those contemplated or projected, forecasted, estimated or budgeted (whether express or implied) by such statements. These risks and uncertainties include but are not limited to the predictability of fertilizer, raw material and energy markets subject to competitive market pressures; changes in foreign currency and exchange rates; international trade risks including, but not limited to, changes in policy by foreign governments; changes in environmental and other governmental regulation; the ability to successfully integrate the former operations of Cargill Crop Nutrition and IMC Global Inc. and the ability to fully realize the expected cost savings from their business combination within expected time frames; adverse weather conditions affecting operations in central Florida or the Gulf Coast of the United States, including potential hurricanes or excess rainfall; actual costs of closure of the South Pierce, Green Bay and Fort Green facilities differing from management’s current estimates; realization of management’s expectations regarding reduced raw material or operating costs, reduced capital expenditures and improved cash flow and anticipated time frames for the closures and the ability to obtain any requisite waivers or amendments from regulatory agencies with oversight of The Mosaic Company or its phosphate business; management’s estimates of the current volumes of brine inflows at the Company’s Esterhazy mines, the available capacity of brine storage reservoirs at the Esterhazy mines, the possibility that the rate of the brine inflows could materially increase, management’s expectations regarding the potential efficacy of remedial measures to control the brine inflows, and the level of capital and operating expenditures necessary to control the inflows; accidents involving our operations, including mine fires, floods and potential explosions or releases of hazardous or volatile chemicals, as well as other risks and uncertainties reported from time to time in The Mosaic Company’s reports filed with the Securities and Exchange Commission. Actual results may differ from those set forth in the forward-looking statements.
This presentation may not be distributed, reproduced, or used without the express written consent of The Mosaic Company.
Before we start today, I want to remind you that there are forward-looking statements in this presentation. The remarks made today are based on information and understandings that we believe to be accurate as of today’s date, February 13, 2007. Actual results are likely to differ from those set forth in the forward looking statements.
2
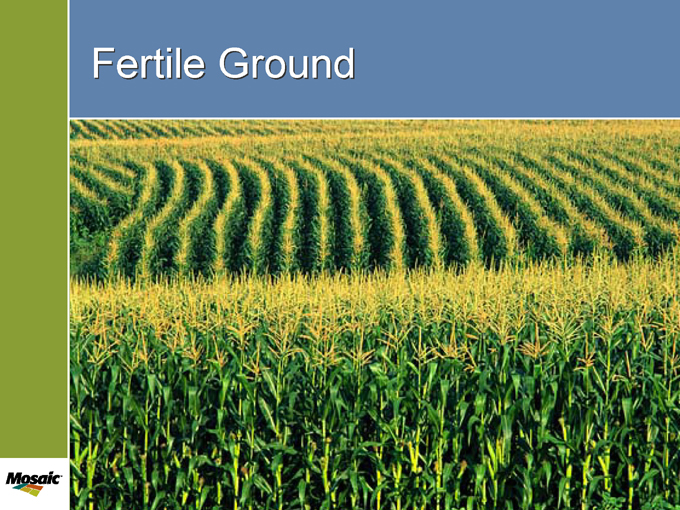
Fertile Ground
It is truly an exciting time to be in the agricultural and fertilizer industries. Corn prices are at 10-year highs and this is leading to increasing demand for all three major crop nutrients. This demand growth is resulting in tight market balances and rising prices for most products and especially for phosphates and nitrogen. As a result, Mosaic’s prospects are better than ever.
3
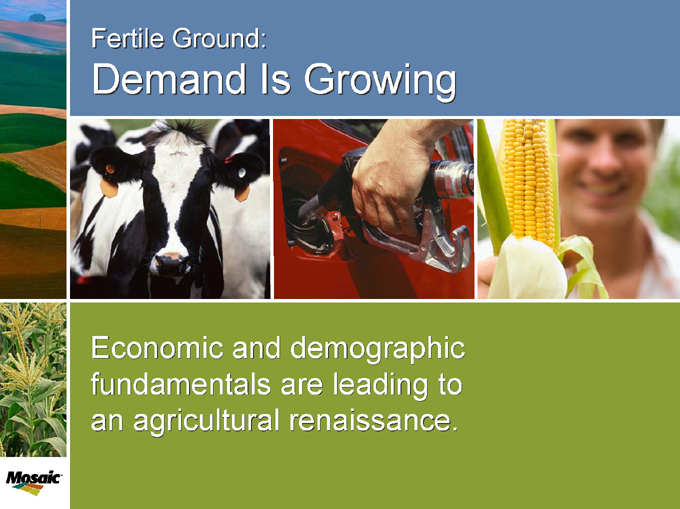
Economic and demographic fundamentals are leading to an agricultural renaissance.
Fertile Ground:
Demand Is Growing
An increasingly robust outlook for global nutrient use is powered by the need to produce more grain and oilseeds to meet the growing demand for food and fuel along with feed. Industry fundamentals - on the farm, in the crop nutrition industry and the agricultural sector in general - are benefiting from this strong and growing global demand. This is especially true in North America, and increasingly so throughout the world. These improved fundamentals provide a strong foundation upon which Mosaic can thrive.
4
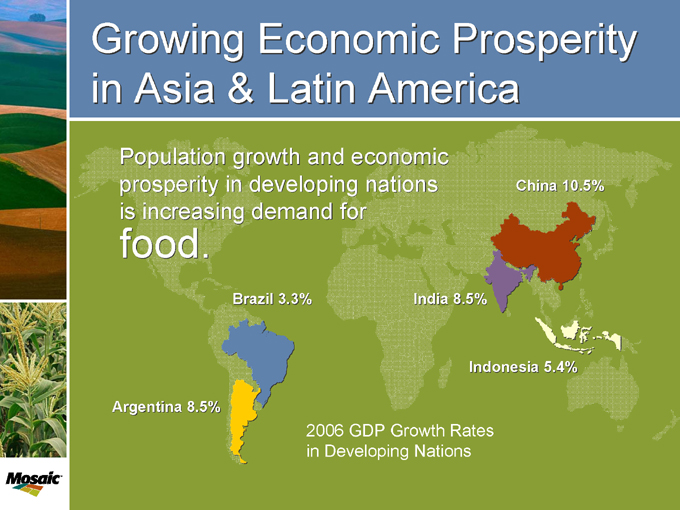
Growing Economic Prosperity in Asia & Latin America
Population growth and economic prosperity in developing nations is increasing demand for food. China 10.5%
Brazil 3.3% India 8.5%
Indonesia 5.4%
Argentina 8.5%
2006 GDP Growth Rates in Developing Nations
Mosaic serves a noble and necessary purpose - namely providing the means and methods to feed the world’s escalating demands for human nutrition. Steady increases in population and solid economic growth worldwide are boosting the demand for food. Population is growing at about 1.1% per year, adding an additional 96 million people per year, mostly in the developing regions of Asia, Africa and Latin America. In addition, diets are rapidly improving in the developing countries, translating into more demand for protein staples, which in turn, drives increased demand for feed.
5
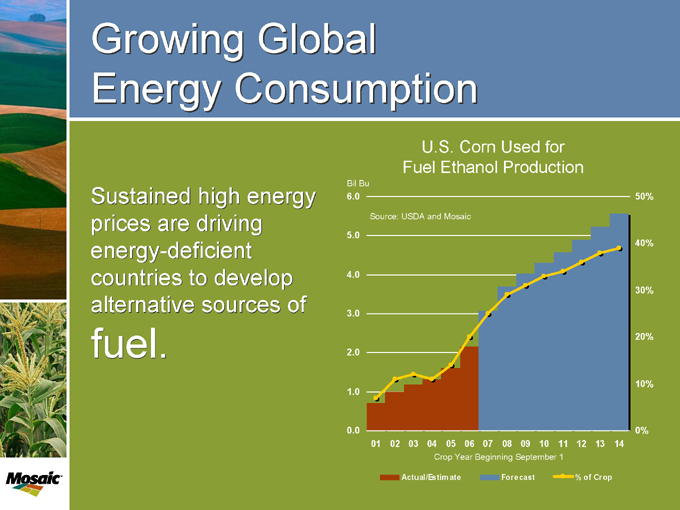
Growing Global Energy Consumption
Sustained high energy prices are driving energy-deficient countries to develop alternative sources of
fuel.
U.S. Corn Used for Fuel Ethanol Production
Bil Bu
6.0 5.0 4.0 3.0 2.0 1.0 0.0
Source: USDA and Mosaic
50% 40% 30% 20% 10% 0%
01 02 03 04 05 06 07 08 09 10 11 12 13 14
Crop Year Beginning September 1
Actual/Estimate Forecast % of Crop
The newest and most interesting grain demand is for fuel. Nearly every energy-deficit or grain-surplus country is developing a biofuels industry in response to persistently high energy prices. This is particularly true in the United States, where ethanol capacity is forecast to increase by about one-third over the next year.
Corn used for ethanol production in the United States has tripled over the last five years to an estimated 2.2 billion bushels during the current crop year. The percentage of the corn crop used for ethanol production has increased from seven percent five years ago to 20 percent in 2006/07.
Based on the current forecasts for ethanol production, corn processed into ethanol will increase to more than three billion bushels next year and then climb to 5.6 billion bushels by 2014/2015 and account for about 39 percent of projected U.S. corn production.
6
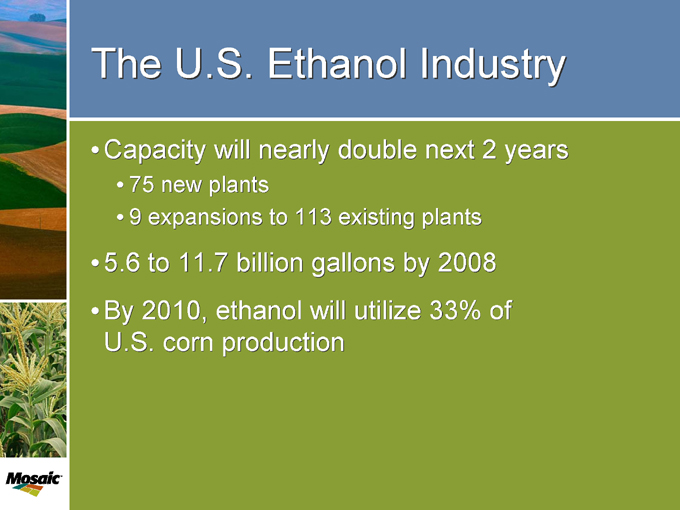
The U.S. Ethanol Industry
Capacity will nearly double next 2 years
75 new plants
9 expansions to 113 existing plants
5.6 to 11.7 billion gallons by 2008 By 2010, ethanol will utilize 33% of U.S. corn production
In the United States, capital is flowing into the ethanol industry and capacity is rapidly expanding. There are currently 113 existing plants with 75 new ethanol projects along with 9 expansions under construction. In addition, there are many other projects in development, and the number of projects is a moving target. U.S. ethanol capacity is forecast to nearly double over the next two years alone.
7
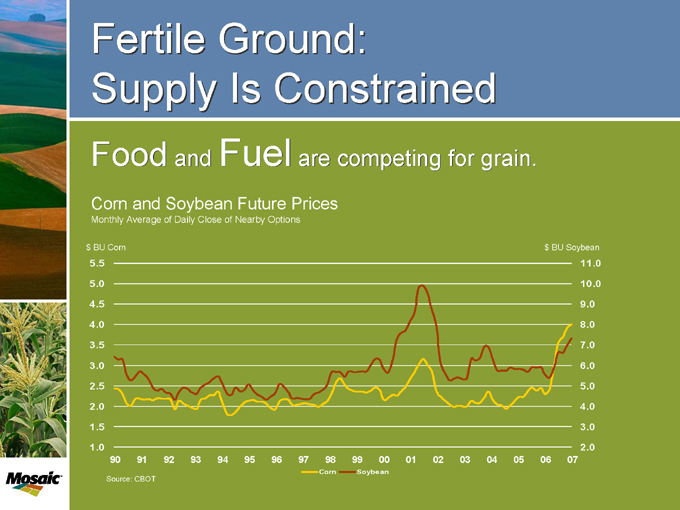
Fertile Ground: Supply Is Constrained
Food and Fuel are competing for grain.
Corn and Soybean Future Prices
Monthly Average of Daily Close of Nearby Options $ BU Corn
5.5 5.0 4.5 4.0 3.5 3.0 2.5 2.0 1.5 1.0 $ BU Soybean
11.0 10.0 9.0 8.0 7.0 6.0 5.0 4.0 3.0 2.0
90 91 92 93 94 95 96 97 98 99 00 01 02 03 04 05 06 07
Corn Soybean
Source: CBOT
While the use of grains and oilseeds for fuel is increasing, supply is limited. According to the latest U.S. Department of Agriculture statistics, farmers around the globe harvested the third largest crop on record in 2006, but the world will use about 75 million tonnes more grain and oilseeds than it produced.
Therefore, grains stocks as a percentage of use will drop to the third lowest level in recent history. These tight stock levels have resulted in soaring corn and soybean prices. Corn prices are now around $4 per bushel for next year’s crop, and on-farm economics have dramatically improved compared with the last few years.
8
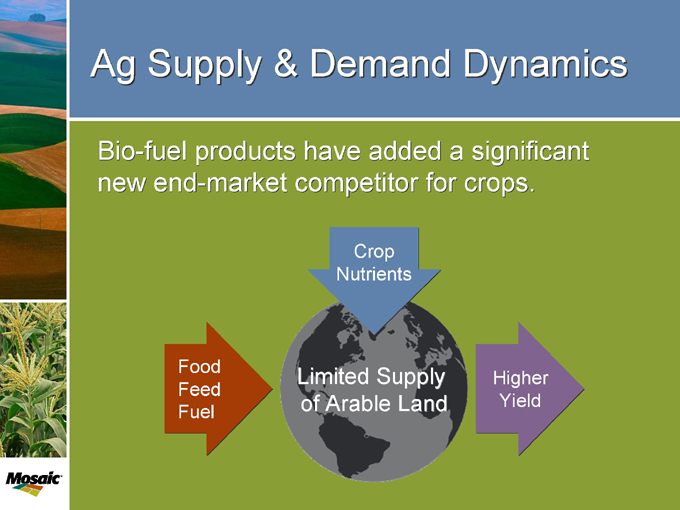
Ag Supply & Demand Dynamics
Bio-fuel products have added a significant new end-market competitor for crops.
Food Feed Fuel
Crop Nutrients
Higher Yield
Limited Supply of Arable Land
There is a limited supply of arable land to meet this increased demand for grains and oilseeds. In order to meet this demand growth, farmers will need to plant more corn.
In the United States, U.S. farmers are expected to plant 87 million acres of corn this spring. The challenge is whether farmers can find this many acres for corn even though market signals call for them. As $4 corn attracts acreage away from other crops, like soybeans, prices for these crops will also rise. This in turn improves the outlook for other countries, especially Brazil.
Much more important for us than increased corn acreage, however, will be higher fertilizer application rates across all acres – higher crop prices will encourage framers to apply more fertilizer to maximize their yield.
9
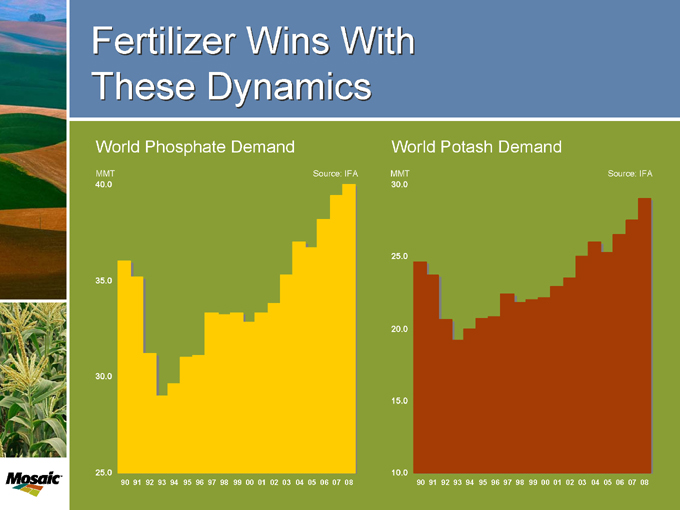
Fertilizer Wins With These Dynamics
World Phosphate Demand
MMT
40.0 35.0 30.0 25.0
Source: IFA
90 91 92 93 94 95 96 97 98 99 00 01 02 03 04 05 06 07 08
World Potash Demand
MMT
30.0 25.0 20.0 15.0 10.0
Source: IFA
90 91 92 93 94 95 96 97 98 99 00 01 02 03 04 05 06 07 08
These strong agricultural fundamentals are expected to result in strong demand growth for phosphates and potash over the next several years. After large declines during the last two years, U.S. nutrient use is projected to rebound 10% to 22.4 million tons in the 2007 fertilizer year.
Turning to the global outlook, phosphates and potash demand are both expected to increase 3 to 4% in 2007 according to the International Fertilizer Association or IFA. The phosphates market balance looks to be particularly tight through the remainder of 2007.
10
Mosaic:
Ready to Take Advantage
Mosaic is in an extraordinary position to capitalize on this strong set of industry fundamentals and is ready to take advantage of them.
11

World’s Top Phosphate Producer
World’s largest capacity of phosphate fertilizer
15% Global 56% U.S.
Largest producer of feed phosphate in U.S. World scale & efficient operations
Phosphate Fertilizer Capacity 2007
1000 tonnes DAP/MAP/TSP
10.0 8.0 6.0 4.0 2.0 0.0
Mosaic OCP PhosAgro CF GCT
We are the world’s largest phosphate producer. Our capacity is larger for finished phosphates than the next three largest producers combined. We are also the largest U.S. feed phosphates producer.
We have world-scale and efficient plants. Mosaic ships about 30% of its product into the North American market where we are a significant market participant. We ship from three plants in Florida and one in Louisiana.
Mosaic exported over 70% of its phosphates in fiscal 2006 with most of the exports handled by Phoschem, the export association of United States phosphates producers, which is managed by Mosaic. The largest export markets are mainly in the developing countries of Asia and Latin America, such as India, China and Brazil.
12
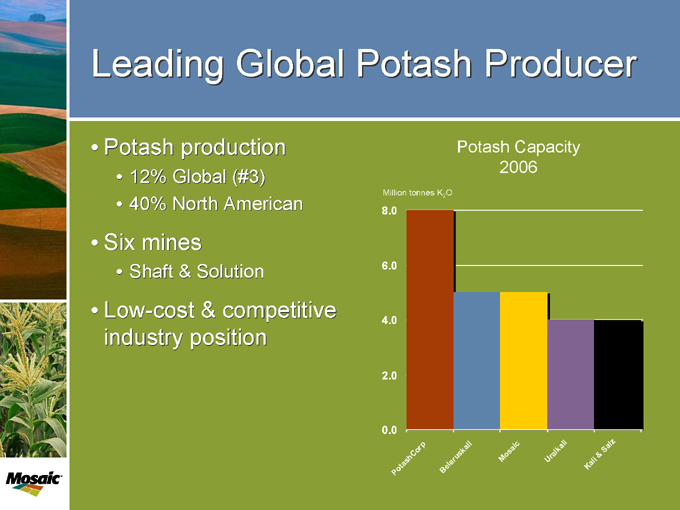
Leading Global Potash Producer
Potash production
12% Global (#3) 40% North American
Six mines
Shaft & Solution
Low-cost & competitive industry position
Potash Capacity 2006
Million tonnes K2O
8.0 6.0 4.0 2.0 0.0
PotashCorp
Belaruskali
Mosaic
Uralkali
Kali & Salz
Mosaic is the world’s third largest potash producer by capacity. Our facilities are world-scale and efficient which helps us maintain a low-cost and competitive position in the industry. Our current capacity is 9.3 million tonnes, which does not include a recent expansion at our Esterhazy mine, that is being proved right now.
We ship nearly 60% of our product into the North America market where Mosaic is a significant market participant. We ship from our four mines in Saskatchewan and two in the U.S.
Mosaic exports over forty percent of its potash with Canadian exports handled by Canpotex, the export association of Saskatchewan potash producers. Mosaic accounts for about 35% of Canpotex exports. As with phosphates, the key customers are mainly in Asia and Latin America, including India, China and Brazil.
13
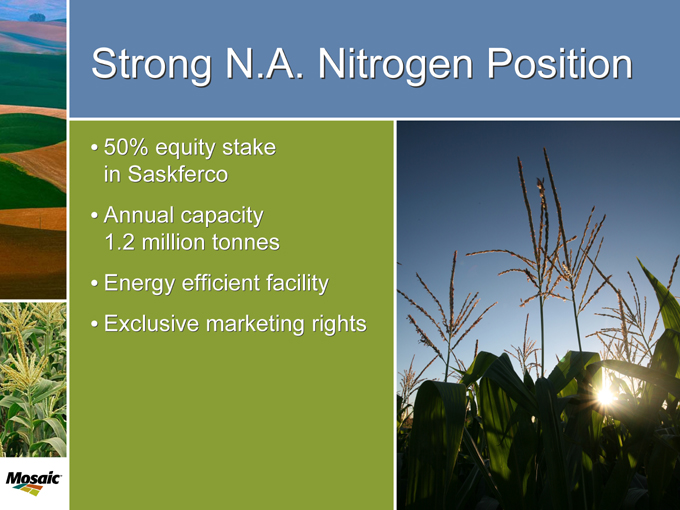
Strong N.A. Nitrogen Position
50% equity stake in Saskferco Annual capacity 1.2 million tonnes Energy efficient facility Exclusive marketing rights
We also have a strong nitrogen position in North America. This is mainly the result of our 50% equity position in Saskferco. This is an energy efficient and world scale plant in Western Canada with capacity to produce 1.2 million tonnes of product. Mosaic has exclusive marketing rights for all of Saskferco’s production.
14
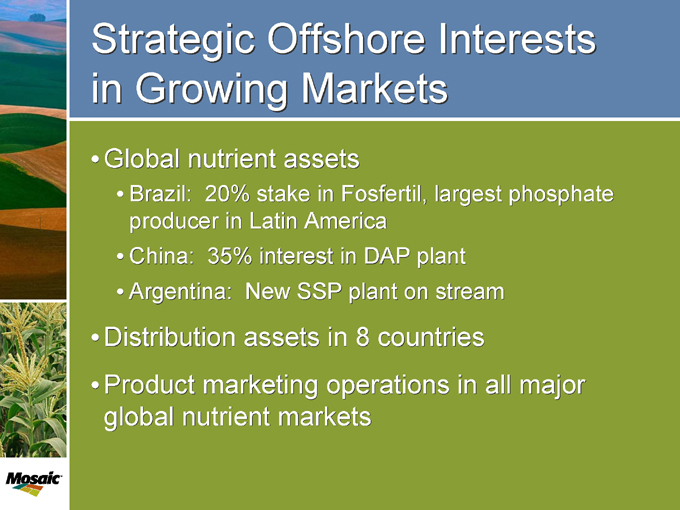
Strategic Offshore Interests in Growing Markets
Global nutrient assets
Brazil: 20% stake in Fosfertil, largest phosphate producer in Latin America China: 35% interest in DAP plant Argentina: New SSP plant on stream
Distribution assets in 8 countries
Product marketing operations in all major global nutrient markets
Our Offshore business segment differentiates Mosaic from our competitors. We have a large global production and distribution network in key growth markets, particularly in Latin America and Asia. It includes approximately one million tonnes of storage capacity at about two dozen facilities worldwide.
We have SSP and feed production facilities in Brazil and NPK compound and bulk blending plants in China. We also just opened a SSP plant in Argentina. In addition to our fully consolidated operations, we have equity positions in phosphate production facilities in Brazil and China which produced $8 million of equity income in the first half of fiscal 2007.
The Offshore segment helps manage the seasonality of our business plus provides on the ground expertise and timely market intelligence. It will help us fully exploit the strong current global agricultural fundamentals.
15
Fertile Ground:
The Opportunity Is Significant
As the industry’s newest player, Mosaic has the most upside to realize.
Mosaic is one of the industry’s newest players and we have spent the last two years laying the foundation for the company. We have had our share of start-up challenges, and have not produced the results that either we – or investors – expect of us. What we have worked through, however, only increases our excitement about the significant opportunity ahead. We believe there is great potential to improve our results over the next year and to create substantial shareholder value longer term.
The phosphates market is clearly our most improved sector over just the past few months and we believe it now has the tightest market balance of all three nutrients. This plays to our strength as the world’s largest phosphate producer.
16
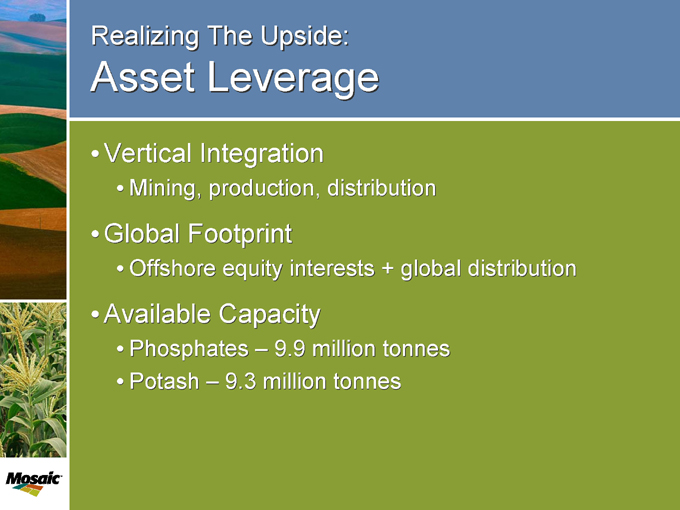
Realizing The Upside:
Asset Leverage
Vertical Integration
Mining, production, distribution
Global Footprint
Offshore equity interests + global distribution
Available Capacity
Phosphates – 9.9 million tonnes Potash – 9.3 million tonnes
So how do we plan to realize this potential for Mosaic? We have tremendous asset leverage starting with vertical integration. We mine phosphates and potash plus produce all three major crop nutrients in North America. In addition, we have a strong marketing presence in North America.
We also have a global footprint including offshore equity interests in Brazil and China plus we have global distribution assets in the largest growing markets in Latin America and Asia.
Finally, we have phosphates and potash capacity available that we can bring onstream in fiscal 2008 and beyond to meet the strong demand growth. For Phosphates, we expect to produce around 9.0 million tonnes in fiscal 2007, as we had reduced operating rates in the first half of fiscal 2007 due to market conditions. We should be able to increase our operating rates next year resulting in additional production of about another 400,000 tonnes, depending on market conditions and product mix.
For potash, our capacity is 9.3 million tonnes, which does not include our recent capacity expansion at Esterhazy which is currently being proved. Due to slow market conditions at the beginning of our fiscal 2007 and other factors, we will likely produce only about 8.0 million tonnes in fiscal 2007.
17
Realizing The Upside:
Operational Excellence
Volume/Scale Economies
Growing sales leverage high fixed cost
Operating Discipline
Phosphate cost restructuring completed
Customer Focus
Strengthened relationships are high management priority
We will continue to be focused on operational excellence in order to reduce costs. This is a high fixed-cost business and any increase in our operating rates should result in lower costs on a per tonne basis, helping to improve our margins.
We restructured our Phosphates business last year, including the closure of one phosphate rock mine and two granulation plants. This was based on their high operating costs; while the cost savings from the restructuring have been masked to date by other factors, we expect much-improved cost performance in quarters to come.
Our new enterprise resource planning system will allow us to have one common platform in North America. Over the longer run, this new system will allow us to manage our costs better and should help reduce our S, G &A costs.
We also have an intense focus on our customers and it is a high priority. We are now beginning to see results. This was clear at our recent Ag College attended by over 160 enthusiastic and engaged customers.
18
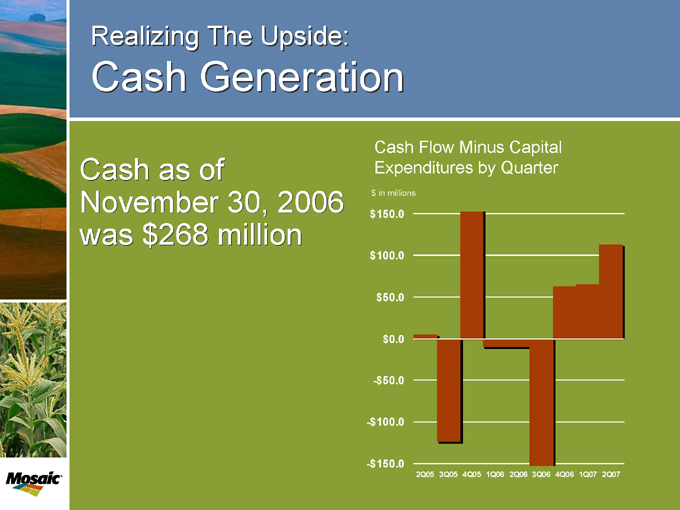
Realizing The Upside:
Cash Generation
Cash as of November 30, 2006 was $268 million
Cash Flow Minus Capital Expenditures by Quarter $ in millions $150.0 $100.0 $50.0 $0.0
-$ 50.0
-$ 100.0
-$ 150.0
2Q05 3Q05 4Q05 1Q06 2Q06 3Q06 4Q06 1Q07 2Q07
A key goal from the start of Mosaic has been to generate cash and pay down debt. The cash generated by operations has been slowly improving, and we have seen great progress thus far into fiscal 2007.
A year ago, investors were worried about how much we were borrowing under our revolving credit line. We don’t get those questions any more and for good reason. As of the end of November 2006, we had cash of approximately $270 million, an amount which has increased considerable since then, and we are now considering our options for paying down debt. More importantly, our operations continue to generate cash.
19
Realizing The Upside:
Balance Sheet Strength
Refinancing Initiatives
Cash interest expense reduced by $25 to $30 million
Improved Ratios
Total debt to total capitalization
Investment Grade Goal
We completed a $2 billion refinancing in early December, a milestone for our company.
This refinancing reduced our cash interest expense by $25 to $30 million per year. It also provided us with improved operating flexibility and a better mix of bonds and bank debt. As we generate more cash and pay off debt, we will strengthen our balance sheet and move toward our investment grade goal.
20
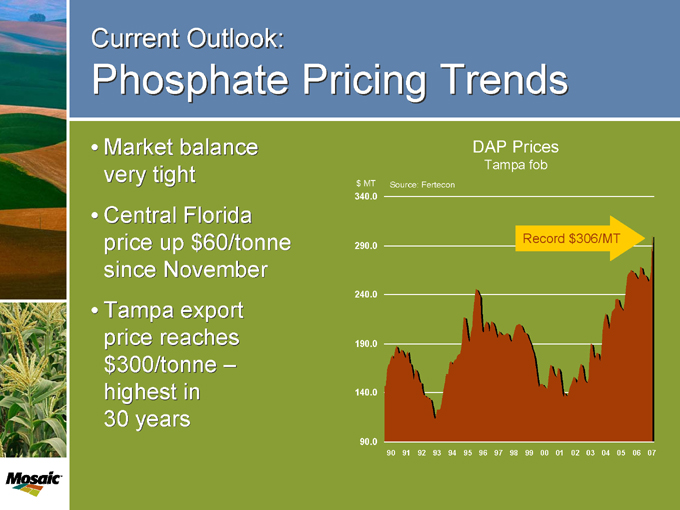
Current Outlook:
Phosphate Pricing Trends
Market balance very tight Central Florida price up $60/tonne since November Tampa export price reaches $300/tonne – highest in 30 years
DAP Prices
Tampa fob $ MT
Source: Fertecon
340.0 290.0 240.0 190.0 140.0 90.0
90 91 92 93 94 95 96 97 98 99 00 01 02 03 04 05 06 07
Record $306/MT
Before I wrap things up, let me give you a quick business update, starting with phosphates.
DAP prices have taken off over the last two months due to a very tight market balance. This is the result of an awakened market in North America. Shipments have rapidly increased and industry inventories were at 20-year lows as of the end of December.
Our current Central Florida spot price is $295 per short ton, which is about $80 per ton higher than early December prices. The DAP export price in Tampa has climbed by about $60 per tonne over the last two months.
This has been partially offset by about a $12 cost increase due to higher ammonia prices, but clearly our margins will be improving. These higher prices and margins are recent, so don’t expect them to show up in our third quarter results. Note that we regularly forward sell our product out several months, so spot prices turn into realized prices with a lag. However, we still have two-thirds of our total sales to price for the remainder of the fiscal year – which we expect will be at higher prices and margins compared with the second quarter.
21
Current Outlook:
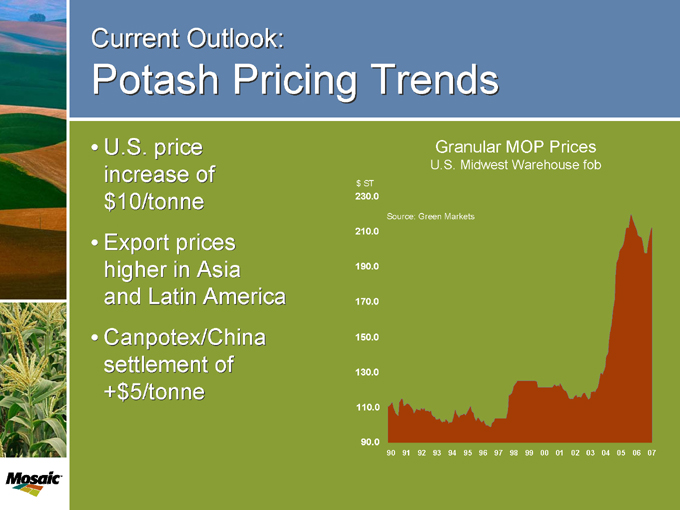
Potash Pricing Trends
U.S. price increase of $10/tonne Export prices higher in Asia and Latin America Canpotex/China settlement of +$ 5/tonne
Granular MOP Prices
U.S. Midwest Warehouse fob $ ST
230.0 210.0 190.0 170.0 150.0 130.0 110.0 90.0
Source: Green Markets
90 91 92 93 94 95 96 97 98 99 00 01 02 03 04 05 06 07
Turning to potash, the growth in demand in 2003 and 2004 resulted in the awakening of the potash market and tight supplies. Both domestic and international potash prices currently remain at strong levels relative to historical values.
These prices are supported by good fundamentals in the global potash market including demand growth in key countries, such as the United States, China and India. In addition, there was the recent flooding of a Russian potash mine that reduced world capacity by 2%. This should result in a tighter potash market balance over at least the next two years, and potentially longer.
Mosaic raised its North American potash prices by $5 to $8 per short ton in October and an additional $10 per short ton in early January. We also just announced a $7 per ton increase effective on March one. In the export market, Canpotex recently completed the 2007 potash supply contract with the Chinese with an increase of $5 per tonne and potash prices are increasing by this amount or more in other key Latin American and Asian countries.
Finally, we expect to have higher production rates in the second half of fiscal 2007, which should reduce costs on a per tonne basis and improve our margins.
22
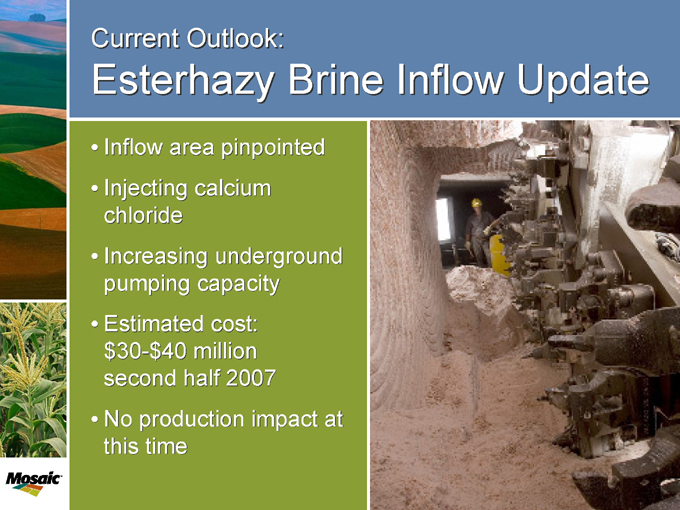
Current Outlook:
Esterhazy Brine Inflow Update
Inflow area pinpointed Injecting calcium chloride Increasing underground pumping capacity Estimated cost: $30-$40 million second half 2007 No production impact at this time
Judging from the phone calls we get, many of your have just one thing on your mind right now - the saturated brine inflow at our Esterhazy, Saskatchewan potash mines. We are treating this inflow as we have treated similar ones over the past twenty years, which is to inject calcium chloride into the inflow area. This is expected to result in gypsum crystals forming and pinching off the inflow area. Using 3D seismic testing and also through visual confirmation, we have located the source of the inflow in an “old workings” area of our K2 mine. We have completed installation of four strategically located wells where calcium chloride can be injected, and further intend to install several additional injection wells over the next few weeks, as necessary. Four oil drilling rigs are on site working simultaneously.
We have begun to see a slight rise in the pressure in the Dawson Bay formation, which is where the inflow comes from suggesting that our efforts are working which should result in an initial modest but continuous decline in the inflow rate. Of course, we would prefer not to have to deal with this situation, but based on our previous experience in managing brine inflows, we are cautiously optimistic in addressing this recent challenge and intend to aggressively continue our mitigation efforts at Esterhazy.
We are also expanding the underground pumping capacity and are currently pumping about 6,000 gallons per minute above ground and injecting the inflow brine from the surface into natural brine bearing formations below the mining horizon. We are progressing well on plans to increase pumping capacities.
The inflow has not impacted production at Esterhazy and we are currently producing potash at record high levels. The estimated additional cost related to this inflow is $30 to $40 million for Mosaic, a majority of which is expected to be capitalized.
23
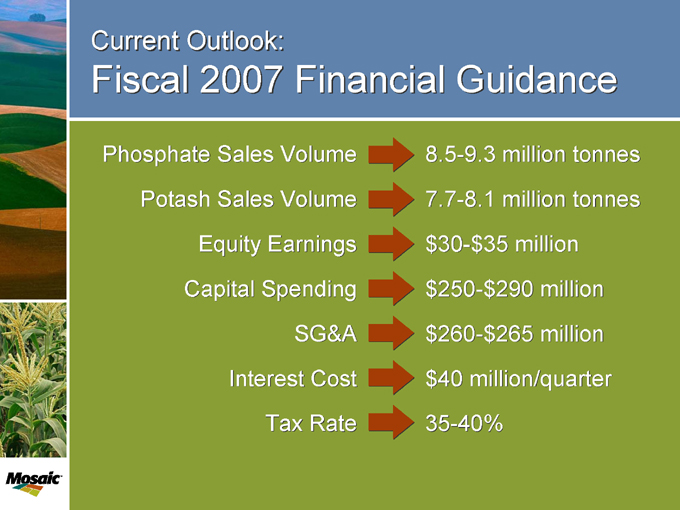
Current Outlook:
Fiscal 2007 Financial Guidance
Phosphate Sales Volume 8.5-9.3 million tonnes
Potash Sales Volume 7.7-8.1 million tonnes
Equity Earnings $30-$35 million
Capital Spending $250-$290 million
SG&A $260-$265 million
Interest Cost $40 million/quarter
Tax Rate 35-40%
This charts shows our updated fiscal 2007 guidance as of our earnings release in late January. There has been no reason to change any of these factors since the earnings call.
24
Fertile Ground:
An Investment in Mosaic
Once-in-a-generation industry fundamentals Exceptional asset base Proven management Focused plan of execution
Let me conclude by stating that many of my colleagues have been in agriculture for thirty years and have never seen strong fundamentals like we have now. Mosaic has a unique and exceptional set of assets that will allow us to take advantage of the current markets through higher volumes and increasing gross margins. We have a proven management team, with a long history in this industry. Finally, we have an execution plan focused on generating cash, paying down debt and strengthening our balance sheet. Over the last two years, Mosaic has laid a strong foundation and we are now ready to take advantage of it.
25
Fertile Ground:
Market Potential with Margin Upside
Thank you for your time. I will now take any questions.
26