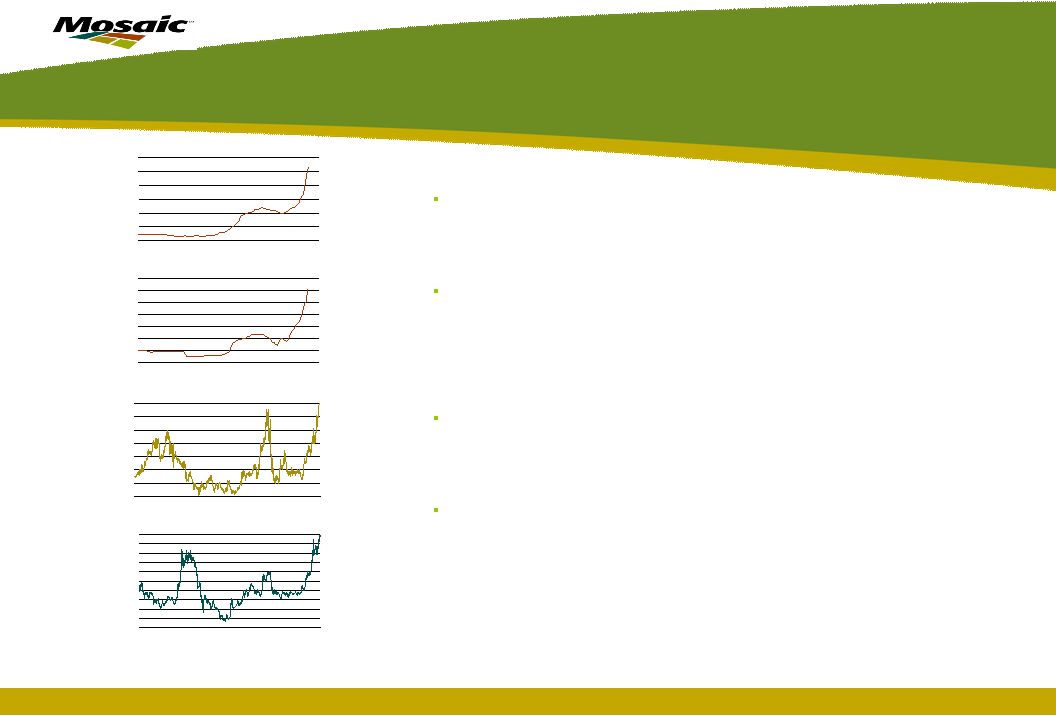
 Why the Surge in Potash Prices? November 30, 2007 Market Analysis and Strategic Planning analysis@mosaicco.com Some analysts have fingered supply disruptions or threatened disruptions such as the potential cutoff of exports from Russian producer Sylvinit due to an encroaching sinkhole that threatens an important rail line as the main culprits for the recent surge in global potash prices. These minor or potential disruptions may have sparked the rally, but it is exceptional demand that is pulling prices into uncharted territory. Demand starts on the farm and farm economics for a wide array of crops grown in almost all regions of the world continue to strengthen as a result of the boom in agricultural commodity prices. Consider the closing prices on November 23 for key potash consuming crops. New crop corn prices for 2008, 2009 and 2010 all closed at $4.32 per bushel. The nearby price of soybeans settled at the round figure of $11.00 per bushel. The nearby rice contract closed at a life-of- contract high of 13.31 cents per pound. The nearby price of palm oil on the Kuala Lumpur exchange broke 3000 ringgits for the first time and closed at a record high of 3002 ringgits per tonne (or 40 cents per pound). These extraordinary farm economics are boosting potash demand from every corner of the globe. Demand is the Fundamental Driver Potash Prices Surge Granular Potash Prices fob U.S. Midwest Warehouse 100 150 200 250 300 350 400 00 01 02 03 04 05 06 07 08 $ ST Source: Green Markets Granular Potash Prices c&f Brazil 100 150 200 250 300 350 400 450 00 01 02 03 04 05 06 07 08 $ MT Source: The Market Potash prices, like many other crop nutrient and commodity prices, climbed to record levels this fall and recently have surged even higher into uncharted territory. For example, the price of granular potash fob a Midwest warehouse increased from $210 per ton at the beginning of 2007 to a record of more than $270 per ton this fall. Winter fill prices have surged approximately $80 to more than $350 per ton today. International prices also have skyrocketed during recent weeks. For example, the Belarus Potash Company (BPC) increased the price of standard potash delivered to Southeast Asian markets from $360 to $400 per tonne in early November. By the end of the month, suppliers already had sold product to Southeast Asian buyers at $450 per tonne. BPC also is implementing an increase in the price of granular potash delivered to Brazil to $400 per tonne effective January 1, a jump of $55 per tonne. Soybean Price Daily Close of the CBOT Nearby Futures Contract 4 5 6 7 8 9 10 11 95 96 97 98 99 00 01 02 03 04 05 06 07 $ BU Source: CBOT Palm Oil Future Prices Daily Close of Nearby Option 500 750 1000 1250 1500 1750 2000 2250 2500 2750 3000 95 96 97 98 99 00 01 02 03 04 05 06 07 RM/MT Source: Kuala Lumpur Exchange Exhibit 99 |
 2 Certain statements contained herein constitute “forward-looking statements” as that term is defined under the Private Securities Litigation Reform Act of 1995. Although we believe the assumptions made in connection with the forward-looking statements are reasonable, they do involve known and unknown risks, uncertainties and other factors that may cause the actual results, performance or achievements of The Mosaic Company, or industry results generally, to be materially different from those contemplated or projected, forecasted, estimated or budgeted (whether express or implied) by such statements. These risks and uncertainties include but are not limited to the predictability of fertilizer, raw material and energy markets subject to competitive market pressures; changes in foreign currency and exchange rates; international trade risks including, but not limited to, changes in policy by foreign governments; changes in environmental and other governmental regulation; adverse weather conditions affecting operations in central Florida or the Gulf Coast of the United States, including potential hurricanes or excess rainfall; actual costs of closure of the South Pierce, Green Bay and Fort Green facilities differing from management’s current estimates; accidents involving our operations, including brine inflows at our Esterhazy, Saskatchewan potash mine as well as potential mine fires, floods, explosions or releases of hazardous or volatile chemicals, as well as other risks and uncertainties reported from time to time in The Mosaic Company’s reports filed with the Securities and Exchange Commission. Actual results may differ from those set forth in the forward-looking statements. Potash stocks held by North American producers at both on- and off-site locations have declined to minimal levels and are forecast to remain at extremely low levels throughout the remainder of the 2007/08 fertilizer year. Exceptionally strong demand is testing the production limits of global potash suppliers. For example, producers in the former Soviet Union will export about as much potash this year as in 2005 due to the loss of the 1.4 million tonne KCL Berezniki I mine. As a result, both domestic and offshore customers are depending increasingly on Canadian producers to meet demand increases. Other Factors Also Impact Prices In addition to rock solid fundamentals, other factors also have combined to push up the price of potash. Record ocean freight and large rail rate surcharges have increased delivered prices to both offshore and domestic customers. Higher energy prices have pressured production costs. Finally, Canadian producers have to realize a higher U.S. dollar price in order to cover Canadian dollar costs as a result of a much stronger Canadian dollar. Demand Forecasts Revised Up Record Low NA Producer Stocks Analysts are revising up potash demand estimates for 2007 as well as forecasts for 2008. For example, the International Fertilizer Industry Association (IFA) in June estimated that global use would jump a healthy 4.8% to 28.44 million tonnes K2O in 2007 and then increase another 3.1% to 29.32 million tonnes in 2008. The most recent IFA survey, compiled during November, now estimates that use will increase 6.5% to 28.90 million tonnes in 2007 and projects that demand will grow another 5.0% to 30.35 million tonnes in 2008 -- an increase of one million tonnes K2O from the June forecast! The impact of extraordinary farm economics on potash demand also is evident in import statistics from the big three importers – namely Brazil, China and India. Imports by these three countries were up 33%, 74% and 40%, respectively, during the first nine months of 2007. Brazil will import record volumes of potash this year, eclipsing the previous high mark set in 2004, and we project that imports will increase another 8% in 2008 due to continued strong farm economics, especially for soybean production. Domestic demand also remains red hot. We estimate that U.S. potash use increased almost 11% during the 2006/07 fertilizer year due largely to the 15 million acre increase in corn acreage in 2007. Domestic potash shipments surged 24% last year as a result of the increase in use as well as a large de-stocking of the distribution pipeline a year earlier. Domestic demand and shipments in 2007/08 are projected to increase 1% to 2% as a result of a more modest increase in total acreage and an expected switch from corn to wheat and soybeans. Shipments during the first four months of the fertilizer year (Jul-Oct) were up about 5% from a year ago. Brazil Potash Import Demand 0.0 0.5 1.0 1.5 2.0 2.5 3.0 3.5 4.0 4.5 5.0 90 91 92 93 94 95 96 97 98 99 00 01 02 03 04 05 06 07 08 MMT K 2 O Source: IFA and Mosaic NA Potash Use and Shipments 3.5 4.0 4.5 5.0 5.5 6.0 6.5 7.0 7.5 8.0 95 96 97 98 99 00 01 02 03 04 05 06 07 08 Fertilizer Year Ending June 30 MST K 2 O Ag Use Total Shipments Estimated Use Source: AAPFCO, IPNI and Mosaic NA Potash Stocks at Month End 300 500 700 900 1100 1300 1500 1700 1900 2100 2300 2500 JUL AUG SEP OCT NOV DEC JAN FEB MAR APR MAY JUN 1000 ST KO 2 MIN MAX Range (1997/98-2006/07) 2007/08 3 Year Average Source: IPNI and Mosaic |