 Mosaic and Groundbreaking Opportunity: A Compelling Alignment Citi Investment Research Basic Materials Symposium, New York December 4, 2007 Exhibit 99 |
Thank you for inviting Mosaic to present at this conference. Everyone in this room today is aware of the extraordinary environment that agricultural markets have been experiencing over the past 12 months. I hope my remarks today impart two key messages - First, we believe this opportunity is a sustainable trend and, second, we believe that Mosaic is exceptionally well positioned to capitalize on these dynamics. 1 |
 Safe Harbor Statement Certain statements contained herein constitute “forward-looking statements” as that term is defined under the Private Securities Litigation Reform Act of 1995. Although we believe the assumptions made in connection with the forward-looking statements are reasonable, they do involve known and unknown risks, uncertainties and other factors that may cause the actual results, performance or achievements of The Mosaic Company, or industry results generally, to be materially different from those contemplated or projected, forecasted, estimated or budgeted (whether express or implied) by such statements. These risks and uncertainties include but are not limited to the predictability of fertilizer, raw material and energy markets subject to competitive market pressures; changes in foreign currency and exchange rates; international trade risks including, but not limited to, changes in policy by foreign governments; changes in environmental and other governmental regulation; adverse weather conditions affecting operations in central Florida or the Gulf Coast of the United States, including potential hurricanes or excess rainfall; actual costs of closure of the South Pierce, Green Bay and Fort Green facilities differing from management’s current estimates; accidents involving our operations, including brine inflows at our Esterhazy, Saskatchewan potash mine as well as potential mine fires, floods, explosions or releases of hazardous or volatile chemicals, as well as other risks and uncertainties reported from time to time in The Mosaic Company’s reports filed with the Securities and Exchange Commission. Actual results may differ from those set forth in the forward-looking statements. This presentation may not be distributed, reproduced, or used without the express written consent of The Mosaic Company. |
Before going any further, I want to remind you that this presentation contains forward- looking statements. The remarks I make are based on information and understandings we believe to be accurate as of today’s date -- December 4, 2007. Actual results are likely to differ from those set forth in the forward-looking statements. 2 |
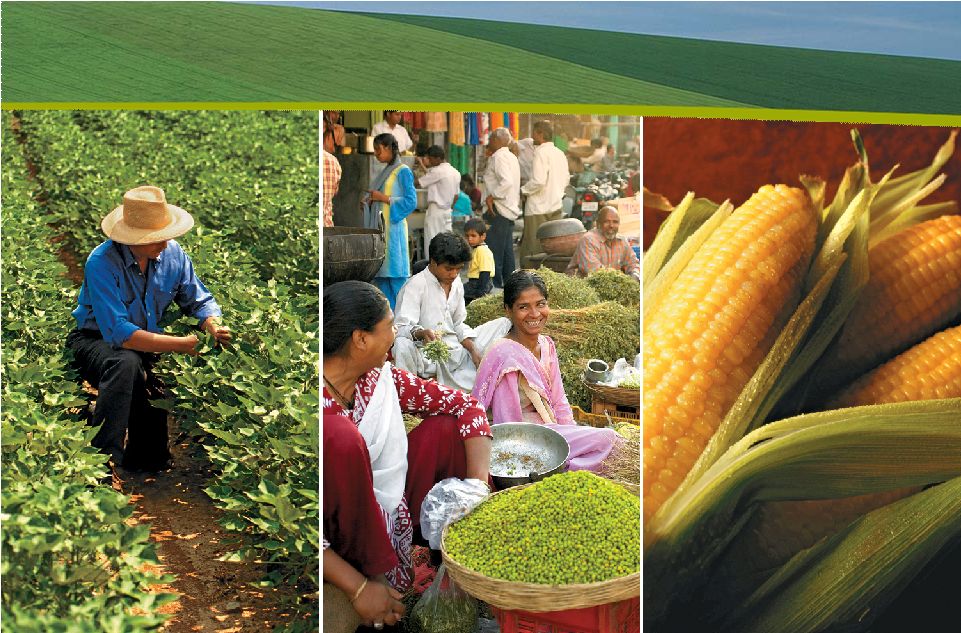
 Mosaic: Who We Are Global producer of crop nutrients • #1 Phosphate producer in the world • #2 Potash producer in the world • North American nitrogen position Vertically integrated • Mining, production, distribution Formed in 2004 • New company with veteran industry experience |
Let me share a few details with you about The Mosaic Company. We produce more phosphate fertilizer than anyone else in the world - about 9.4 million tonnes annually, which exceeds the combined production of the next three largest producers. Our potash position is similarly strong as we are currently the second largest producer in the world. In fact, our annual capacity for potash production - 10.4 million tonnes - is even larger than our phosphate capacity. Our portfolio also includes a 50% stake in Saskferco - a Saskatchewan nitrogen producer. We have world-scale and efficient plants located near our mines, and a global distribution network that enables us to reach every major agricultural region in the world. This vertical integration provides us with great operational flexibility and asset leverage. Mosaic is in its fourth year as a public company. Our rich asset base was formed by the 2004 merger of IMC Global and the crop nutrient business of Cargill. The timing of this merger could not have been better given recent history. 3 |
 Fundamental Fundamental Sustainable Sustainable Global Global Groundbreaking Opportunity |
We describe the current industry environment as an agricultural renaissance, with demand and pricing trends that have not been seen in a generation. The factors converging to create these market conditions have the potential to produce an entirely new era of productivity for agriculture. Our view of this opportunity is really shaped by three words - Fundamentals are excellent - driven by demand to meet basic needs. The trends are global - encompassing every major agricultural region of the world. And most importantly – we believe these trends are sustainable into the future. 4 |
 Groundbreaking Opportunity: Driven by Fundamental Demand Food, Feed, Fiber… World GDP Growth Rate 0.0% 1.0% 2.0% 3.0% 4.0% 5.0% 6.0% 80 81 82 83 84 85 86 87 88 89 90 91 92 93 94 95 96 97 98 99 00 01 02 03 04 05 06 07 08 Source: Global Insight |
Let’s start with a look at the fundamental drivers. Biofuels have gotten all the ink in recent months, but agriculture is still first and foremost about feeding people. There are more people than ever to feed, and more people than ever who can afford to eat well. World GDP is projected to increase 3.7% in 2007 and 3.6% in 2008. This creates a healthy and stable environment for crop nutrients. In some areas such as China, India, Malaysia and Pakistan - GDP growth is exceptional. Economies in these countries are growing well above the global average. The result is an emerging affluent middle class that is demanding more protein rich foods, which, in turn, translates into strong nutrient demand growth. 5 |
 Groundbreaking Opportunity: Plus a New Demand Driver and Fuel |
Biofuels have accelerated already strong demand for grain and oilseeds and turned a positive environment into an extraordinary one. The USDA estimates that U.S. ethanol producers used 550 million bushels more of corn for the 2007 crop year than the previous year -- that’s a 34% increase year over year. 6 |
 Groundbreaking Opportunity: The Fundamentals are Global Widespread demographic and economic factors Fuel Economic Food |
The net effect is that possibly for the first time ever, demand fundamentals are strong in both the developed and developing regions so that the opportunity is truly a global one. In Asia, we have large populations plus a new protein-craving middle class. In Latin America, economies are growing again. In North America and Europe - both mature ag markets - alternative energy needs have re- invigorated agricultural demand. So, this groundbreaking opportunity is being driven by a diverse set of demographic, economic and geographic fundamentals. But the big question is, of course, “Is this opportunity sustainable?” We ask ourselves this question and here’s why we keep answering it with a resounding “yes.” 7 |
 World Less China Grain and Oilseed Use 0.0 50.0 100.0 150.0 200.0 250.0 300.0 350.0 400.0 450.0 75 76 77 78 79 80 81 82 83 84 85 86 87 88 89 90 91 92 93 94 95 96 97 98 99 00 01 02 03 04 05 06 07 0.0% 5.0% 10.0% 15.0% 20.0% 25.0% 30.0% Stock % of Use Groundbreaking Opportunity: The Fundamentals are Sustainable Million Tonnes % of Use Source: USDA Food stocks at historic lows |
This rally is fundamentally different from past periods of price increases because it is being driven by demand, not by supply shortages. In fact, global grain and oilseed stocks will decline again in 2007/2008 despite the large increase in planted area this year. Production was forecast to increase 4% to a record 2 billion tonnes in 2007, but projected use exceeded this year’s harvest by about 29 million tonnes. Global wheat stocks at the end of the 2007/2008 crop year are projected to drop to their lowest level since 1976 and the stocks-to-use ratio will be the lowest in modern history. 8 |
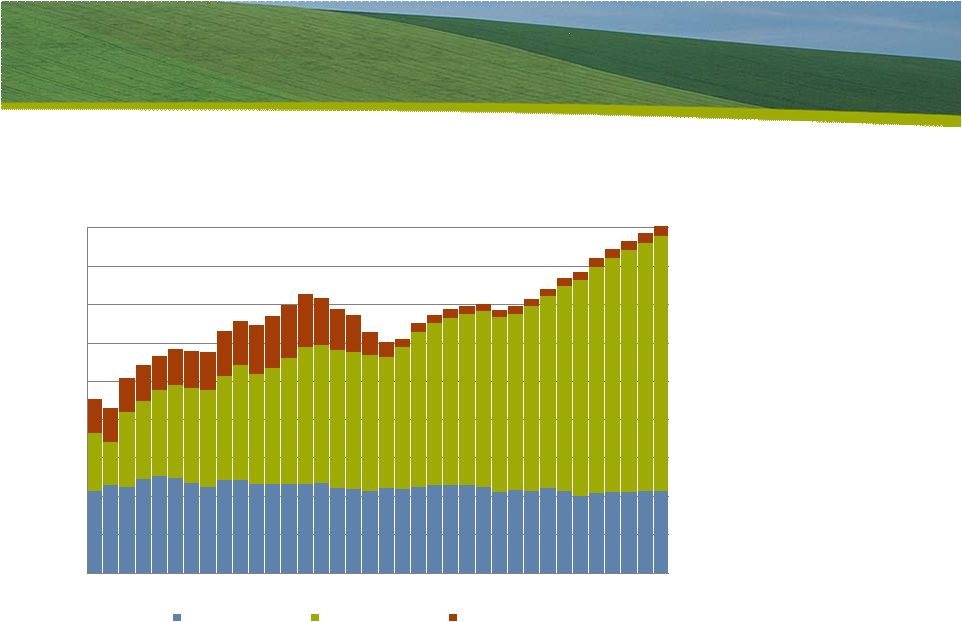 Groundbreaking Opportunity: The World Will Not Get “Less” Hungry… Developing nations are driving 90% of demand World Nutrient Demand Through 2010 0 20 40 60 80 100 120 140 160 180 75 76 77 78 79 80 81 82 83 84 85 86 87 88 89 90 91 92 93 94 95 96 97 98 99 00 01 02 03 04 05 06 07 08 09 10 Developed Nations Developing Nations Transition Economies Source: IFA Million Tonnes |
This situation is not likely to change soon. Developing nations have accounted for all of the growth in world nutrient demand since 1995 - demand fueled by traditional population and income drivers. The latest forecasts from the International Fertilizer Industry Association show that developing nations will account for more than 90% of projected demand growth during the the next five years, even with large bio-fuels initiatives in the U.S. and Europe. 9 |
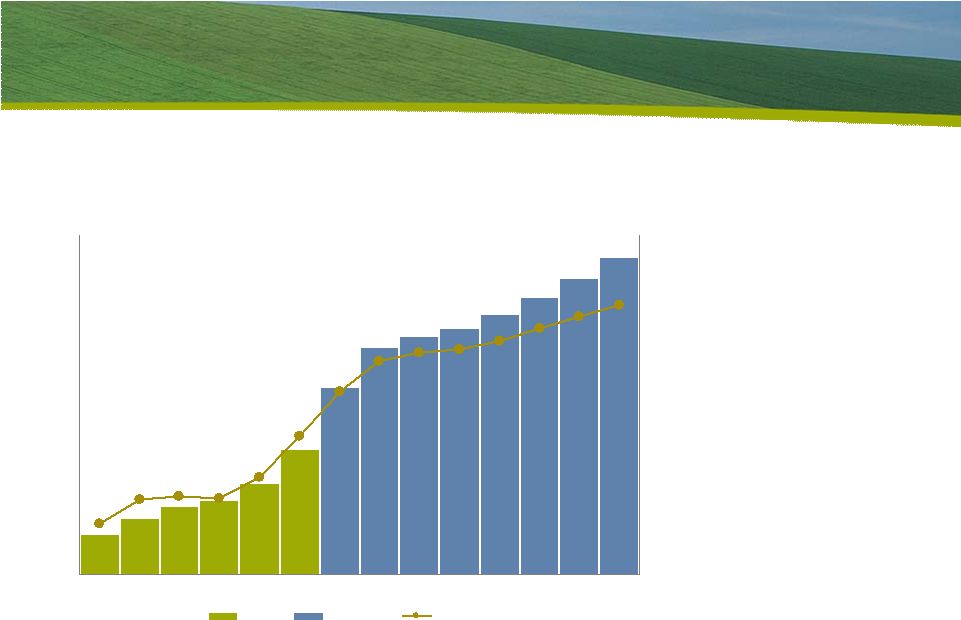 Groundbreaking Opportunity: Nor Less Energy Dependent 0.0 1.0 2.0 3.0 4.0 5.0 6.0 01 02 03 04 05 06 07 08 09 10 11 12 13 14 0% 10% 20% 30% 40% 50% Actual Forecast % of Corn Crop U.S. Corn Used for Ethanol Production Ethanol is here to stay % of Corn Crop Billion Bushels |
And this biofuels situation is not likely to change. Corn used for ethanol production is forecast to increase at least another 700 million bushels to more than 4.1 billion bushels of the 2008/2009 crop. By 2014, biofuels are expected to consume as much as 40% of the U.S. corn crop. Currently, there are 130 ethanol plants operating in North America, another 73 new plants are under construction and there are 10 expansions of existing plants. And while this emerging industry will undergo some growing pains, the politics of biofuels are too compelling to discount its continued impact on U.S. agriculture. From the national strategic need for domestic energy supplies to the environmental need for clean fuel, to the economic need for rural development -- we believe biofuels as an end-use will only grow. 10 |
 Fundamental Fundamental Sustainable Sustainable Global Global The Mosaic Opportunity |
As I mentioned earlier, Mosaic’s attributes are well aligned with those of the industry opportunity. These same words describe how Mosaic is capitalizing on this opportunity. Fundamental execution is driving our business today. Our unique global position is a competitive strength. And, our growth is sustainable thanks to capacity expansion. Let’s take a closer look at each of these points. 11 |
 The Mosaic Opportunity Driven by Fundamental Execution Customer’s supplier of choice • Market share gains Supply chain management • “Plan, promise & deliver” Cost-containment • Economies of scale |
The market opportunity that I’ve described in the last few minutes is only relevant if we execute on the fundamentals. We’ve spent the past three years integrating Mosaic’s operations in order to build a stable and solid foundation. This has been hard work that is beginning to pay off for us. We have made customer relationships a top priority and the successful implementation of our “plan, promise and deliver” program has led to highly collaborative relationships. These relationships combined with our commitment to have the right product at the right place at the right time - an absolutely critical step in the crop nutrient supply chain - is helping us to gain market share in North America We remain highly focused on operating discipline and optimal capacity in order to maximize asset utilization, decrease costs per tonne and expand margins to fully capitalize on the very strong market conditions that we have described. 12 |
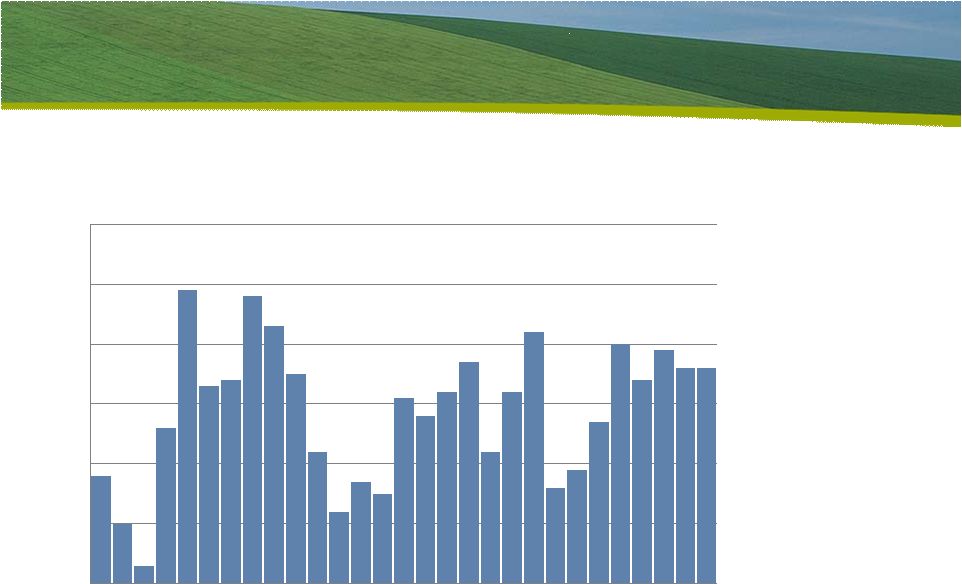
 The Mosaic Opportunity Delivering Fundamental Performance -$125 $0 $125 $250 $375 $500 $625 Q 1 Q 2 Q 3 Q 4 Q 1 Q 2 Q 3 Q 4 Q 1 Quarterly EBITDA* Momentum in all fundamental metrics In Millions 06 07 08 *See EBITDA reconciliation to net earnings in addendum |
Our focus on operational excellence is translating into solid financial results including record results in our latest quarter. You can see the dramatic turnaround in EBITDA in just the past three quarters, and there is more of this to come. It is worth noting that this momentum applies to every measure of performance – growth, margins, and return on capital. 13 |
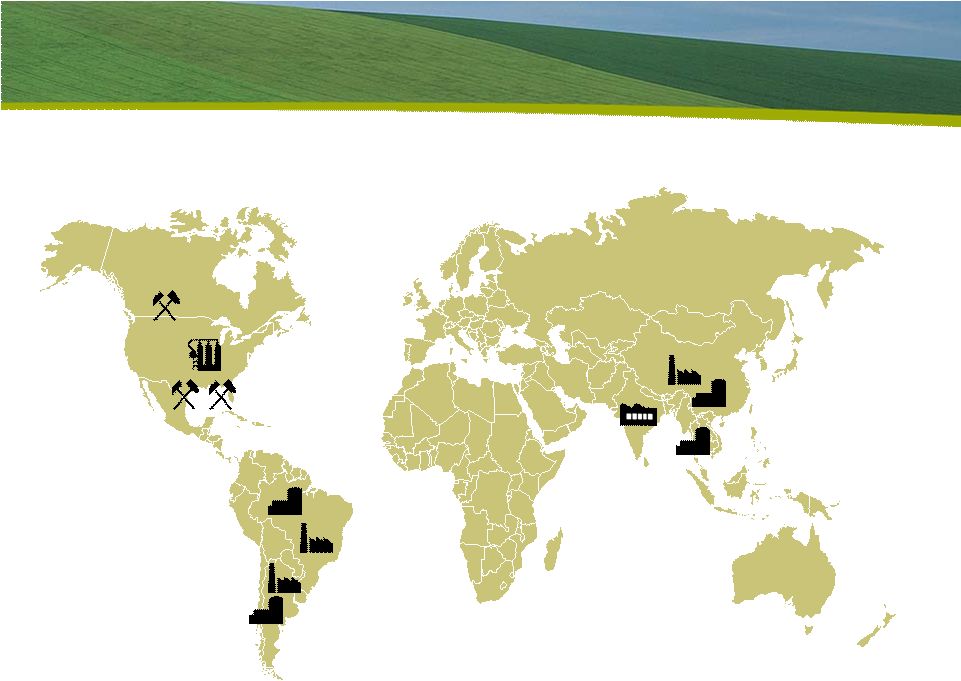 The Mosaic Opportunity Capitalizing on Our Global Reach Offshore assets aligned with global demand Canada 4 Mines United States 7 Mines 4 Phosphate Plants Argentina 1 Warehouse & Blender 1 Production/Warehouse Brazil 7 Warehouse & Blender 2 Production/Warehouse China 2 Warehouse & Blender 2 Production/Warehouse Thailand 1 Warehouse & Blender India 1 Warehouse |
Our global footprint is a key competitive differentiator for Mosaic and one that is well- aligned with key growth markets. In addition to our North American mines and plants, we have a significant on-the-ground presence in Asia and Latin America. Mosaic own plants, warehouses and distribution infrastructure in Brazil, Argentina, China, India and Thailand. We also have equity positions in phosphate production facilities in Brazil and China. Our Offshore presence provides us with a wealth of local expertise and regional intelligence within each area, and also helps to balance the seasonality of our business. 14 |
 The Mosaic Opportunity: Potash is Key to Sustainability A “KO” Business: Only 12 exporting nations • China, India, Brazil import dependent Greenfield projects are expensive • No new mines on-stream through 2011 Historic under-utilization in developing world |
We’ve talked a lot today about the sustainability of market demand drivers. But there’s another dimension to the sustainability of Mosaic’s performance - one that is often under-appreciated - and it can be summarized in one word - potash. Simply put, it is a great business. Potash is exported from only 12 countries in the world and imports account for more than 60% of demand, in part because ag giants such as China, India and Brazil are all import dependent. A new 2 million tonne per year potash mine would require capital investment of over $2 billion, making new greenfield projects very hard to justify even by current potash prices. Finally, because of its historically low under-utilization rates in developing countries, potash is enjoying an added benefit from growing demand in these countries, where its nutritional value is more critical than ever to optimizing crop yields. 15 |
 The Mosaic Opportunity Our K Position Today is Excellent Mosaic Potash Capacity by Mine 2008 One of the largest players in the world (a) Finished product (KCI) (b) Potash operations at our Hersey, Michigan facility will be discontinued in the second half of fiscal 2008. (c) We toll produce potash at our Esterhazy mine for a third party. 10.4 Total (excluding toll production) (c) 11.7 Total 0.1 Hersey (b) 1.7 Carlsbad United States: 5.3 Esterhazy 1.8 Colonsay 2.8 Belle Plaine Canada: Annual Capacity (a) (Million tonnes per year) |
With these dynamics, its not surprising that the Potash business segment is a strong performer for Mosaic. It accounts for approximately one-fifth of net sales, and for fiscal 2007, Potash accounted for about 60% of operating earnings. As I have already noted, current net capacity is about 10.4 million tonnes annually from our five mines in Canada and the United States, including our Esterhazy facility, which is the largest potash mine in the world. In May, we completed a $38 million expansion of Esterhazy that added an incremental 1.1 million metric tonnes of new annual capacity – an extraordinarily low-cost expansion. This project was the first phase of an ambitious potash expansion plan that is one of our most important strategic priorities. 16 |
 The Mosaic Opportunity Our K Position Tomorrow Is Even Better Quick and Cost Effective Mosaic Mine Expansions 0 Soon to Expire 1,240 Esterhazy Toll Agreement Expiration 92 170 120 75 15 25 Total Estimated Cost US ($) Millions Engineering Stage Engineering Stage Engineering Stage Internal Approval Pending Underway Underway Status 2012 360 Belle Plaine 2010 115 Belle Plaine 2014 450 Esterhazy 2014 270 Belle Plaine 2012 360 Colonsay 2010 Completion 225 Capacity Increase (000 tonnes KCI) Colonsay Mine |
This plan calls for approximately three million tonnes, or 30%, increase in total potash capacity by 2015. The next phase comes on-line as early as 2010. Our potash expansions will be brought on line as required by growing demand, and the economics of these expansions will provide a significant competitive advantage. We believe our brownfield expansions have some of the lowest capital costs in the world. We are well prepared to take full advantage of these low-cost opportunities. 17 |
 The Mosaic Opportunity Phosphates: Controlling Our Own Destiny In a League of Our Own: • Unique cost synergies • Maximum asset leverage • Leadership |
Mosaic’s Phosphates business possesses its own very attractive attributes due to its sheer size. With an approximate 16% global market share, our breadth and depth of phosphate operations provide us with many significant advantages. Our scale of operations produces significant cost efficiencies. Vertical integration provides tremendous asset leverage. And, most importantly, our volume puts us in a commanding position. Our expectation is that the current tight market conditions for Phosphates will be maintained over the next four years. 18 |
 The Mosaic Opportunity: A Strengthening Balance Sheet Supports Expansion $2 billion refinancing $850 million debt prepayment Nearly 10% decrease in debt-to-capital ratio Investment grade goal 32.8% Debt-To-Capital 8/31/07 |
Whether expanding capacity in our Potash business or funding other capital investments, our means to do so have improved dramatically over the past year as we have strengthened our balance sheet. Investment grade status has been one of our major strategic goals since the formation of Mosaic three years ago. Once this is attained, we will be free of some covenants that restrict operational and strategic flexibility, allowing us to pursue new investment and growth opportunities. Therefore, debt reduction has been our first priority for cash use. During the past 12 months, we have made significant progress towards this goal. Since May, 2007 we have prepaid a total of $850 million in long-term debt. In the process, our debt-to-capital ratio improved from 41.8% to 32.8% year-over-year as of the end of the first fiscal quarter, and we paid down an additional $450 million of long- term debt in our second quarter, which just ended November 30. 19 |
 Current Phosphate Trends 100 150 200 250 300 350 400 450 500 550 J an- 90 De c- 90 No v- 91 O ct- 92 Se p- 93 Au g- 94 Jul- 95 J un- 96 Ma y- 97 Ap r- 98 Ma r- 99 Fe b- 00 J an- 01 De c- 01 No v- 02 O ct- 03 Se p- 04 Au g- 05 Jul- 06 J un- 07 DAP Prices (fob Tampa) $ MT 90 Source: Fertecon • Tight market continues • North American inventories at lowest level in more than 15 years • Recent $35 per short ton price increases 07 91 92 93 94 95 96 97 98 99 00 01 02 03 04 05 06 |
I have focused my remarks today intentionally on the mid-to-long term in order to demonstrate the sustainability of current trends. Before closing, here’s a brief update on the short-term outlook. Demand prospects remain strong as we continue to enjoy robust markets in Brazil and India. High wheat prices in the Soviet Union and Ukraine and more planted area in EU countries mean that we will see phosphate and potash from this region of the world stay in the region - further tightening supply in other parts of the world. In North America, phosphate shipments are up 38% from last year and inventories are at their lowest levels since the early 90s. As a result, pricing remains strong. Over the past month, we have completed a total of over $35 per short ton price increases for DAP, fob Central Florida; and the export price in Tampa has also increased to over $500 per tonne. 20 |
 Current Potash Trends 90 120 150 180 210 240 270 300 330 360 Ja n- 90 Ja n- 91 Ja n- 92 Ja n- 93 Ja n- 94 Ja n- 95 Ja n- 96 Ja n- 97 Ja n- 98 Ja n- 99 Ja n- 00 Ja n- 01 Ja n- 02 Ja n- 03 Ja n- 04 Ja n- 05 Ja n- 06 Ja n- 07 Granular Potash Price (fob U.S. Midwest Warehouse) $ ST 90 Source: Green Markets 07 91 92 93 94 95 96 97 98 99 00 01 02 03 04 05 06 • Tight market and attractive prices • K imports to Brazil 11/06 = $185 12/07 = $355 • Recent price increase in North America |
Market dynamics are similar for potash. As an example, take a look at the delivered price of potash to Brazil a year ago - $185 per tonne. The most recent potash price increase will take that to $355 per tonne – double the price within 12 months. In North America, prices also are on the rise. We are currently selling potash for shipment in the last half of December through February at a $50 price increase per short ton in addition to about a $30 per ton increase that took effect in October. We are also seeing strong pricing trends elsewhere in the world. 21 |
 Price Increase Sensitivities $0.01 $09.0 $0.01 Canadian dollar $0.01 $08.9 10% Brazilian real Exchange Rate $0.06 $36.9 $1.00 Natural Gas ($/mmbtu) $0.02 $12.4 $0.10 Ammonia ($/tonne) $0.03 $20.1 $0.05 Sulfur ($/lt) Raw Materials $0.14 $91.7 500 Phosphate Volume (000 tonnes) $0.14 $89.0 $0.10 DAP Price ($/tonne) $0.08 $49.8 500 Potash Volume (000 tonnes) $0.12 $78.1 $0.10 MOP Price ($/tonne) Marketing EPS Change Pre-Tax Earnings ($ in millions) |
This chart gives you some idea of how price increases impact our bottom line. For example, a $10 per tonne increase in our potash realized price has about a $.12 impact on our earnings per shares. A $10 per tonne price increase in our DAP realized price has about a $0.14 EPS impact. 22 |
 Fiscal 2008: Financial Guidance Phosphate Sales Volume 8.5 - 9.0 Million Tonnes $50 - $75 Million $360 - $400 Million $280 - $300 Million Low 30s% 8.6 - 9.1 Million Tonnes Potash Sales Volume Tax Rate SG&A Capital Spending Equity Earnings |
Turning to guidance for fiscal 2008. Phosphate sales volume is expected to be within close range of last year’s 8.9 million tonnes, while we expect potash volume to grow anywhere from 7% to 14% over last year’s 7.9 million tonnes. Equity earnings from non-consolidated subsidiaries remain on track in a range of $50 to $75 million due to expected strong results from nitrogen producer Saskferco and our Brazilian subsidiary, Fosfertil. Cap Ex for fiscal 2008 should grow from $292 million to a range of $360 to $400 million. The increase is largely for growth or cost-reduction opportunities, such as the potash capacity expansions we discussed earlier and projects to reduce operating costs in phosphates. SG&A should be down slightly from $310 million in FY07. And finally, we expect a tax rate in the low 30% range. 23 |
 In Conclusion… Crop Nutrients Have Never Looked So Good • Competing end-uses • Growing fundamental demand • Diverse global customer base • Limited number of global suppliers • Greenfield projects are expensive |
In closing today, it is worth pointing out that the crop nutrient business as a whole has a highly attractive set of fundamental attributes. Competing end-uses and growing demand for food, feed, fiber and, now, fuel translate into a critical need for crop nutrients that can optimize crop yields. Our customer base encompasses farmers and distributors - both large and small - in almost every agricultural economy of the world. 24 |
 Mosaic & Groundbreaking Opportunity: A Compelling Alignment It’s Fundamental Market Drivers & MOS Execution It’s Global Market Demand & MOS Presence It’s Sustainable Market Growth & MOS Capacity |
When you apply these attributes to the opportunity that the industry and Mosaic are looking at - it creates a very compelling scenario. It’s an opportunity with excellent fundamental demand drivers and one that Mosaic will capitalize on by executing its own fundamentals well. It’s a global opportunity and Mosaic has a unique global presence to match it. Finally, it’s a market opportunity with sustainable growth prospects, in which Mosaic is well-positioned for future growth. I appreciate your listening to our story today and now I’d be happy to take questions. 25 |
 Addendum: EBITDA Calculation Selected Non-GAAP Financial Measures and Reconciliations EBITDA Calculation August 31 November 30 February 28 May 31 August 31 November 30 February 28 May 31 August 31 2005 2005 2006 2006 2006 2006 2007 2007 2007 Net earnings 76.1 $ 55.0 $ (71.6) $ (180.9) $ 109.0 $ 65.9 $ 42.2 $ 202.6 $ 305.5 $ Interest expense, net 35.2 38.6 41.2 38.2 40.0 36.5 43.0 30.1 34.0 Income taxes 51.5 42.3 (27.2) (61.2) 7.4 24.1 6.6 85.3 100.8 Depreciation, depletion & amortization 74.3 84.4 80.7 84.7 75.4 78.8 81.4 93.9 82.2 Amortization of out-of-market contracts (4.5) (4.5) (4.1) (4.4) (3.8) (4.4) (3.9) (4.1) (4.1) EBITDA Calculation 232.6 $ 215.8 $ 19.0 $ (123.6) $ 228.0 $ 200.9 $ 169.3 $ 407.8 $ 518.4 $ (dollars in millions) Three months ended The Company has presented above EBITDA, which is a non-GAAP financial measure. Generally, a non-GAAP financial measure is a supplemental numerical measure of a company's performance, financial position or cash flows that either excludes or includes amounts that are not normally excluded or included in the most directly comparable measure calculated and presented in accordance with U.S. generally accepted accounting principles ("GAAP"). EBITDA is not a measure of financial performance under GAAP. Because not all companies use identical calculations, our calculation of EBITDA may not be comparable to other similarly titled measures presented by other companies. Moreover, EBITDA as presented in this presentation is different than similarly titled measures used for purposes of financial covenants in our senior secured bank credit facility and other covenants relating to our indebtedness, all of which require different adjustments, both positive and negative, that were the result of negotiationswith the lenders. In evaluating these measures, investors should consider that our methodology in calculating such measures may differ from that used by other companies. EBITDA is frequently used by securities analysts, investors, lenders and others to evaluate companies' performance, including, among other things, cash flows and profitability before the effect of financing and similar decisions. Because securities analysts, investors, lenders and others use EBITDA, Mosaic's management believes that our presentation of EBITDA affords them greater transparency in assessing our financial performance. EBITDA should not be considered as a substitute for, nor superior to, measures of financial performance prepared in accordance with GAAP. |