Exhibit 99
Market Mosaic
Vol. 4 No.3 August 2008
Second Half Outlook:
Pedal to the Metal
Market Mosaic is a quarterly newsletter published for our customers, suppliers and stakeholders each February, May, August and November by the Market Analysis group of The Mosaic Company. The February and August issues recap our assessment of the near term outlook for agricultural and crop nutrient markets. The May and November issues provide an in-depth look at topics of special interest to our readers.
Michael R. Rahm
Vice President mike.rahm@mosaicco.com
Joseph Fung
Market Analyst joseph.fung@mosaicco.com
Mathew Philippi
Market Analysis Assistant matt.philippi@mosaicco.com
We have used a metaphor of an engine to describe the agricultural and crop nutrient outlook in the last several issues of Market Mosaic. We introduced this metaphor in the February 2007 issue. That issue, titled Rewing Up Production Agriculture, concluded that farmers around the globe needed to rev up the powerful engines of production agriculture in order to meet the accelerating demands for food and fuel. The August 2007 issue, titled Hitting On All Cylinders, highlighted the
fundamental strength in agricultural markets and the positive outlook for crop nutrient demand. The February 2008 issue, titled No Let Up, noted that farmers dare not to take their foot off the accelerator despite the record harvest of 2007.
Based on the summer sell-off of all things related to agriculture, bubble proponents no doubt would have nominated Running Out of Gas as the title for this issue! However, after studying the most recent facts, we have boldly titled this issue Pedal to the Metal to describe the still urgent need for farmers to step on the accelerator – even hitting the floorboard – in order boost production in 2009 and build global grain and oilseed stocks to more secure levels.
Rock Solid Agricultural Outlook
Despite the volatility in grain and oilseed prices this spring and summer, agricultural fundamentals remain tight. Markets still are just one weather problem away from the type of crisis hinted at in June when excessive rainfall delayed planting and flooded fields throughout large parts of the U.S. corn belt. The record harvest of 2007 and the prospect of another record crop in 2008 will just stop rather than reverse the decade-long decline in global grain and oilseed stocks. Estimates released by the U.S. Department of Agriculture (USDA) on August 12 show that inventories of the 16 leading grain and oilseed crops are projected to increase a puny 20.7 million tonnes this year compared to projected use of almost 2.58 billion tonnes. Stocks at the end of the 2008/09 crop year are forecast to account for only 16.2 percent of use, the second lowest percentage since 1974/75.
Global grain and oilseed stocks have dwindled due to a pick-up in the pace of demand growth. Growth has accelerated as a result of continued strong income and food demand growth, particularly in the large and rapidly developing countries in Asia, as well as increases in biofuels production, especially the exponential increase in U.S. ethanol output. According to the latest USDA estimates, global grain and oilseed demand is increasing 2.5 percent per year – 120 basis points greater than the historical rate.
Farmers have responded to higher grain and oilseed prices by planting more area and intensifying cropping practices. The supply response during the last two growing seasons was good, but not good enough to build global grain and oilseed stocks to secure levels. For example, global grain and oilseed production increased 3.9 percent or 94 million tonnes to a record 2.50 billion tonnes in 2007. Roughly 40 percent of this increase resulted from a 1.5 percent or 13 million hectare increase in harvested area and the other 60 percent was due to a 2.5 percent or 69 kilograms per hectare increase in average yield. Global grain and oilseed production is projected to increase another 4.2 percent or 104 million tonnes to 2.61 billion tonnes in 2008, according to USDA’s August estimates. Again, approximately 40 — continued inside
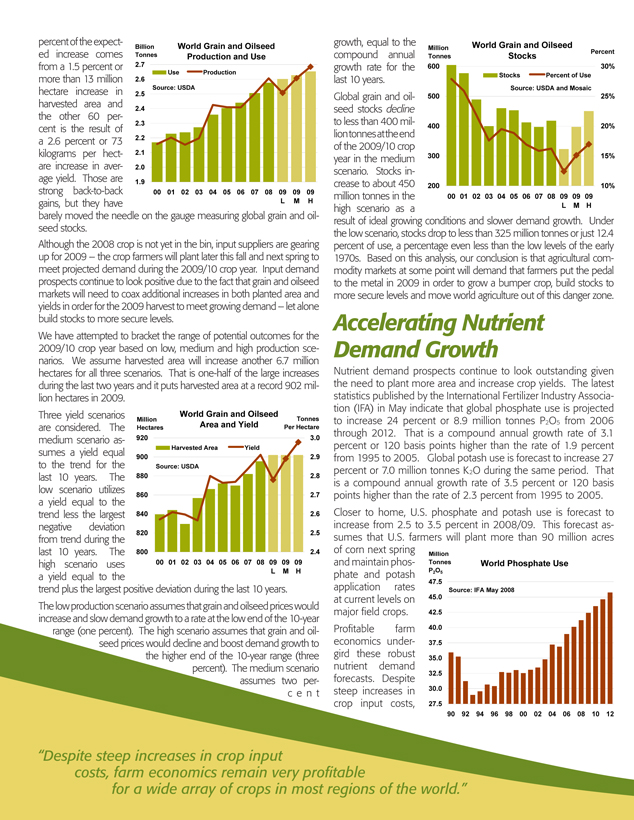
percent of the expect- ed increase comes from a 1.5 percent or
more than 13 million hectare increase in
harvested area and
the other 60 per-
cent is the result of a 2.6 percent or 73 kilograms per hect- are increase in aver- age yield. Those are
strong back-to-back
gains, but they have L M H barely moved the needle on the gauge measuring global grain and oil-seed stocks.
Billion
Tonnes World Grain and Oilseed
Production and Use
2.6
Source: USDA
2.5
2.4
2.3
2.2
2.1
2.0
1.9
00 | | 01 02 03 04 05 06 07 08 09 09 09 |
Although the 2008 crop is not yet in the bin, input suppliers are gearing up for 2009 – the crop farmers will plant later this fall and next spring to meet projected demand during the 2009/10 crop year. Input demand prospects continue to look positive due to the fact that grain and oilseed markets will need to coax additional increases in both planted area and yields in order for the 2009 harvest to meet growing demand – let alone build stocks to more secure levels.
We have attempted to bracket the range of potential outcomes for the 2009/10 crop year based on low, medium and high production scenarios. We assume harvested area will increase another 6.7 million hectares for all three scenarios. That is one-half of the large increases during the last two years and it puts harvested area at a record 902 million hectares in 2009.
World Grain and Oilseed
Million Tonnes
Hectares Per Hectare
920 3.0
Harvested Area Yield
Source: USDA
900 2.9
880 2.8
860 2.7
840 2.6
820 2.5
800 2.4 00 01 02 03 04 05 06 07 08 09 09 09 L M H
Three yield scenarios
are considered. The Area and Yield medium scenario as- sumes a yield equal
to the trend for the last 10 years. The low scenario utilizes
a yield equal to the trend less the largest negative deviation
from trend during the last 10 years. The
high scenario uses
a yield equal to the trend plus the largest positive deviation during the last 10 years. The low production scenario assumes that grain and oilseed prices would increase and slow demand growth to a rate at the low end of the 10-year range (one percent). The high scenario assumes that grain and oil-seed prices would decline and boost demand growth to the higher end of the 10-year range (three percent). The medium scenario assumes two per-c e n t
growth, equal to the
compound annual growth rate for the
last 10 years.
Global grain and oil- seed stocks decline to less than 400 mil- lion tonnes at the end of the 2009/10 crop year in the medium scenario. Stocks increase to about 450
million tonnes in the
high scenario as a L M H result of ideal growing conditions and slower demand growth. Under the low scenario, stocks drop to less than 325 million tonnes or just 12.4 percent of use, a percentage even less than the low levels of the early 1970s. Based on this analysis, our conclusion is that agricultural commodity markets at some point will demand that farmers put the pedal to the metal in 2009 in order to grow a bumper crop, build stocks to more secure levels and move world agriculture out of this danger zone.
Million
Tonnes World Grain and Oilseed
Stocks
Percent
Stocks Percent of Use Source: USDA and Mosaic
600 30%
500 25%
400 20%
300 15%
200 10%
00 01 02 03 04 05 06 07 08 09 09 09
Accelerating Nutrient Demand Growth
Nutrient demand prospects continue to look outstanding given the need to plant more area and increase crop yields. The latest statistics published by the International Fertilizer Industry Association (IFA) in May indicate that global phosphate use is projected to increase 24 percent or 8.9 million tonnes P2O5 from 2006 through 2012. That is a compound annual growth rate of 3.1 percent or 120 basis points higher than the rate of 1.9 percent from 1995 to 2005. Global potash use is forecast to increase 27 percent or 7.0 million tonnes K2O during the same period. That is a compound annual growth rate of 3.5 percent or 120 basis points higher than the rate of 2.3 percent from 1995 to 2005. Closer to home, U.S. phosphate and potash use is forecast to increase from 2.5 to 3.5 percent in 2008/09. This forecast assumes that U.S. farmers will plant more than 90 million acres of corn next spring Million and maintain phos- Tonnes World Phosphate Use phate and potash P2O5
47.5 application rates Source: IFA May 2008
at current levels on 45.0 major field crops. 42.5 Profitable farm 40.0 economics under- 37.5 gird these robust 35.0 nutrient demand
32.5
forecasts. Despite steep increases in 30.0 crop input costs, 27.5
90 92 94 96 98 00 02 04 06 08 10 12
“Despite steep increases in crop input costs, farm economics remain very profitable for a wide array of crops in most regions of the world.”
farm economics re- Million main very profitable Tonnes World Potash Use for a wide array of K2O
35.0
crops in most regions Source: IFA May 2008 of the world. For ex- 32.5 ample, our analysis for 30.0 a high-yield corn and
27.5
soybean operation in the Midwest shows 25.0 that variable costs will 22.5 approximately double between 2006 and 20.0 2009 due to higher 17.5
diesel, seed, herbi- 90 92 94 96 98 00 02 04 06 08 10 12
cide, crop nutrient and LP gas prices. Despite these increases and despite the recent declines in corn and soybean prices, farm economics remain very profitable. In fact, estimated revenue after variable cost, although off from the expected record for the 2008 crop, is projected to remain at a level more than double the average from 2003 to 2006.
Phosphate Market – Stable
Phosphate prices have stabilized at high levels this summer following the sharp run-up in values earlier this year. The outlook for the second half of 2008 hinges on three factors – agricultural commodity prices, raw materials costs and Chinese exports. Our handicapping of these factors indicates that the market will continue to stay balanced during the last half of the year.
Phosphate demand prospects continue to look positive in this robust agricultural environment. As noted above, farm economics remain very profitable at current new crop prices and agricultural fundamentals look rock solid. We expect the major crops will fight another price battle for acres between now and next spring. Raw materials costs also remain at high levels for phosphate producers. Sulphur prices appear to have finally peaked at values eight to ten times those of just 12 to 18 months ago, but now ammonia prices have spiked to record highs due to the prospect of lower nitrogen exports from China, the loss of significant tonnage from a large plant in Western Australia and strong nitrogen demand prospects. In addition, phosphate rock prices paid by non-integrated producers increased another $100 per tonne in the third quarter. Absent a collapse of any of these prices, high raw materials costs will continue to underpin phosphate values at current high levels. Finally, exports from Million China DAP/MAP Exports
China during the last Tonnes half of the year are a 4.0
3.5 Source: IFA and Mosaic
key swing factor. We
DAP MAP
expect that China 3.0 will export signifi-cantly less tonnage 2.5 this year
than a year 2.0 ago. As a result, U.S. 1.5 and other producers
1.0
will need to make up for the loss of 0.5 these tonnes during 0.0
the last half of 2008. 90 92 94 96 98 00 02 04 06 08
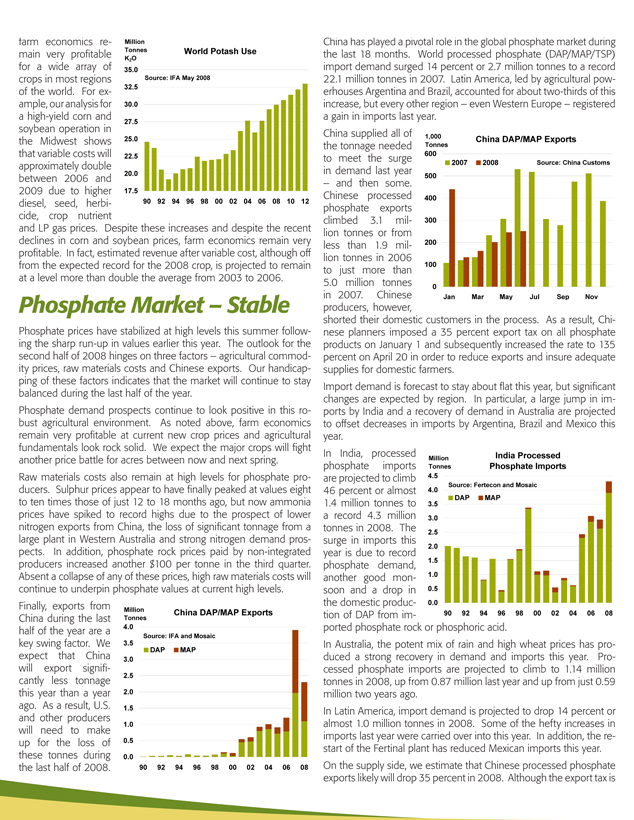
China has played a pivotal role in the global phosphate market during the last 18 months. World processed phosphate (DAP/MAP/TSP) import demand surged 14 percent or 2.7 million tonnes to a record
22.1 million tonnes in 2007. Latin America, led by agricultural pow-erhouses Argentina and Brazil, accounted for about two-thirds of this increase, but every other region – even Western Europe – registered a gain in imports last year.
China supplied all of 1,000
China DAP/MAP Exports the tonnage needed Tonnes to meet the surge 600
in demand last year 2007 2008 Source: China Customs 500
– and then some. Chinese processed 400 phosphate exports climbed 3.1 mil- 300 lion tonnes or from less than 1.9 mil- 200 lion tonnes in 2006
100
to just more than
5.0 million tonnes 0
in 2007. Chinese Jan Mar May Jul Sep Nov
producers, however, shorted their domestic customers in the process. As a result, Chi-nese planners imposed a 35 percent export tax on all phosphate products on January 1 and subsequently increased the rate to 135 percent on April 20 in order to reduce exports and insure adequate supplies for domestic farmers.
Import demand is forecast to stay about flat this year, but significant changes are expected by region. In particular, a large jump in imports by India and a recovery of demand in Australia are projected to offset decreases in imports by Argentina, Brazil and Mexico this year.
In India, processed India Processed
Million
phosphate imports Tonnes Phosphate Imports are projected to climb 4.5
Source: Fertecon and Mosaic
46 percent or almost 4.0
DAP MAP
1.4 million tonnes to 3.5 a record 4.3 million 3.0 tonnes in 2008. The 2.5 surge in imports this
2.0
year is due to record 1.5 phosphate demand, another good mon- 1.0 soon and a drop in 0.5 the domestic produc- 0.0
tion of DAP from im- 90 92 94 96 98 00 02 04 06 08
ported phosphate rock or phosphoric acid.
In Australia, the potent mix of rain and high wheat prices has produced a strong recovery in demand and imports this year. Processed phosphate imports are projected to climb to 1.14 million tonnes in 2008, up from 0.87 million last year and up from just 0.59 million two years ago.
In Latin America, import demand is projected to drop 14 percent or almost 1.0 million tonnes in 2008. Some of the hefty increases in imports last year were carried over into this year. In addition, the restart of the Fertinal plant has reduced Mexican imports this year. On the supply side, we estimate that Chinese processed phosphate exports likely will drop 35 percent in 2008. Although the export tax is
Another
Battle for Acres in 2009
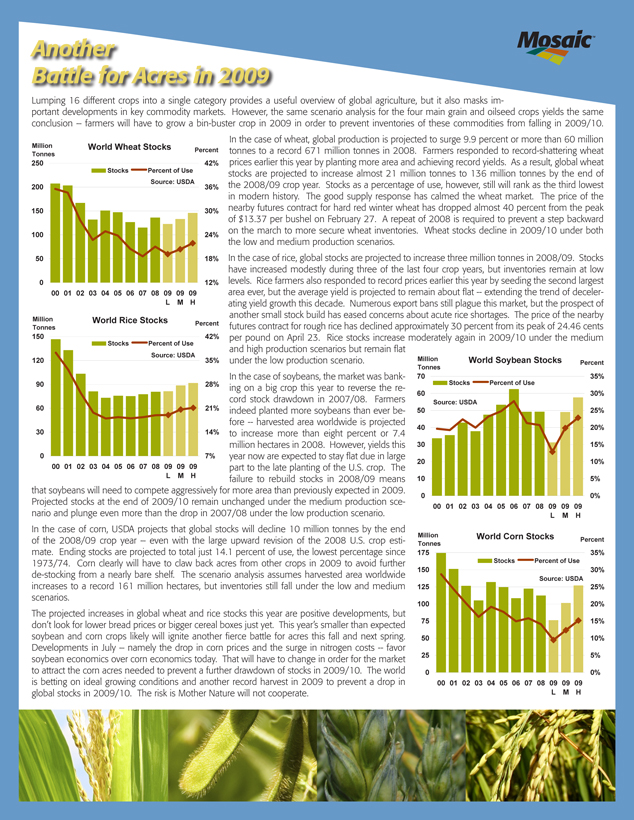
Lumping 16 different crops into a single category provides a useful overview of global agriculture, but it also masks important developments in key commodity markets. However, the same scenario analysis for the four main grain and oilseed crops yields the same conclusion – farmers will have to grow a bin-buster crop in 2009 in order to prevent inventories of these commodities from falling in 2009/10.
In the case of wheat, global production is projected to surge 9.9 percent or more than 60 million
Million World Wheat Stocks
Percent tonnes to a record 671 million tonnes in 2008. Farmers responded to record-shattering wheat Tonnes prices earlier this year by planting more area and achieving record yields. As a result, global wheat
250 42%
Stocks Percent of Use stocks are projected to increase almost 21 million tonnes to 136 million tonnes by the end of Source: USDA the 2008/09 crop year. Stocks as a percentage of use, however, still will rank as the third lowest
200 36%
in modern history. The good supply response has calmed the wheat market. The price of the 150 30% nearby futures contract for hard red winter wheat has dropped almost 40 percent from the peak of $13.37 per bushel on February 27. A repeat of 2008 is required to prevent a step backward on the march to more secure wheat inventories. Wheat stocks decline in 2009/10 under both
100 24%
the low and medium production scenarios.
50 18% In the case of rice, global stocks are projected to increase three million tonnes in 2008/09. Stocks have increased modestly during three of the last four crop years, but inventories remain at low
0 12% levels. Rice farmers also responded to record prices earlier this year by seeding the second largest
00 01 02 03 04 05 06 07 08 09 09 09 area ever, but the average yield is projected to remain about flat — extending the trend of deceler-L M H ating yield growth this decade. Numerous export bans still plague this market, but the prospect of another small stock build has eased concerns about acute rice shortages. The price of the nearby
Million World Rice Stocks
Percent futures contract for rough rice has declined approximately 30 percent from its peak of 24.46 cents
Tonnes
150 Stocks Percent of Use 42% per pound on April 23. Rice stocks increase moderately again in 2009/10 under the medium and high production scenarios but remain flat
Source: USDA
120 35% under the low production scenario. Million
Tonnes World Soybean Stocks Percent
Percent Tonnes
In the case of soybeans, the market was bank- 70 Stocks Percent of Use 35%
90 28% ing on a big crop this year to reverse the re-
60 30%
cord stock drawdown in 2007/08. Farmers Source: USDA
60 21% indeed planted more soybeans than ever be- 50 25% fore — harvested area worldwide is projected
40 20%
30 14% to increase more than eight percent or 7.4 million hectares in 2008. However, yields this 30 15%
0 7% year now are expected to stay flat due in large
20 10%
00 01 02 03 04 05 06 07 08 09 09 09 part to the late planting of the U.S. crop. The
L M H failure to rebuild stocks in 2008/09 means 10 5% that soybeans will need to compete aggressively for more area than previously expected in 2009.
0 0%
Projected stocks at the end of 2009/10 remain unchanged under the medium production sce-
00 01 02 03 04 05 06 07 08 09 09 09
nario and plunge even more than the drop in 2007/08 under the low production scenario. L M H In the case of corn, USDA projects that global stocks will decline 10 million tonnes by the end
Million World Corn Stocks of the 2008/09 crop year – even with the large upward revision of the 2008 U.S. crop esti- Percent mate. Ending stocks are projected to total just 14.1 percent of use, the lowest percentage since Tonnes
175 35%
1973/74. Corn clearly will have to claw back acres from other crops in 2009 to avoid further Stocks Percent of Use
150 30%
de-stocking from a nearly bare shelf. The scenario analysis assumes harvested area worldwide Source: USDA increases to a record 161 million hectares, but inventories still fall under the low and medium 125 25% scenarios.
100 20%
The projected increases in global wheat and rice stocks this year are positive developments, but 75 15% don’t look for lower bread prices or bigger cereal boxes just yet. This year’s smaller than expected soybean and corn crops likely will ignite another fierce battle for acres this fall and next spring. 50 10% Developments in July – namely the drop in corn prices and the surge in nitrogen costs — favor 25 5% soybean economics over corn economics today. That will have to change in order for the market to attract the corn acres needed to prevent a further drawdown of stocks in 2009/10. The world 0 0% is betting on ideal growing conditions and another record harvest in 2009 to prevent a drop in 00 01 02 03 04 05 06 07 08 09 09 09 global stocks in 2009/10. The risk is Mother Nature will not cooperate. L M H
scheduled to drop to 35 percent on October 1, most analysts expect that authorities will extend or even increase the tax through at least the fourth quarter. Chinese authorities appear serious about promoting food security and fighting food inflation. The expected decline in Chinese exports creates a hole that U.S. and other producers will need to fill, especially during the last half of this year. For example, China exported as much DAP/MAP during the first half of 2008 as it did during the first half of 2007. So, the entire decline in DAP/MAP exports is expected to take place during the second half of this year. In particular, we project that China will export less than one million tonnes of DAP/MAP during the last half of this year compared to 2.5 million tonnes during the last half of 2007.
U.S. producers exported just less than 7.0 million tons of DAP/MAP during the fertilizer year that ended on June 30, 2008. We forecast that U.S. exports will increase 12 percent or 860,000 tons to more than 7.8 million tons in 2008/09 due to continued strong demand and the expected loss of Chinese exports.
Million Latin America Processed Tonnes Phosphate Imports
8.0
7.0 Source: IFA and Mosaic DAP MAP TSP
6.0
5.0
4.0
3.0
2.0
1.0
0.0
90 92 94 96 98 00 02 04 06 08
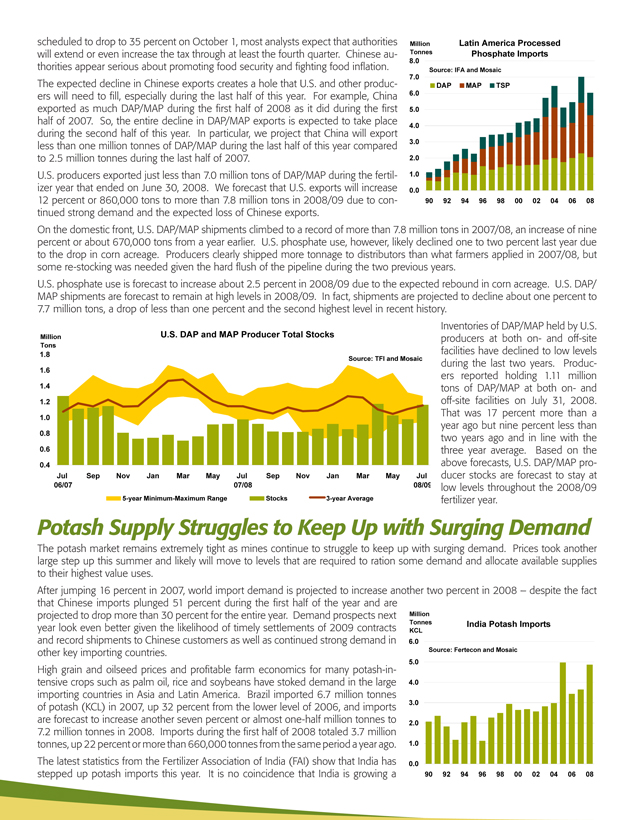
On the domestic front, U.S. DAP/MAP shipments climbed to a record of more than 7.8 million tons in 2007/08, an increase of nine percent or about 670,000 tons from a year earlier. U.S. phosphate use, however, likely declined one to two percent last year due to the drop in corn acreage. Producers clearly shipped more tonnage to distributors than what farmers applied in 2007/08, but some re-stocking was needed given the hard flush of the pipeline during the two previous years.
U.S. phosphate use is forecast to increase about 2.5 percent in 2008/09 due to the expected rebound in corn acreage. U.S. DAP/ MAP shipments are forecast to remain at high levels in 2008/09. In fact, shipments are projected to decline about one percent to 7.7 million tons, a drop of less than one percent and the second highest level in recent history.
Million U.S. DAP and MAP Producer Total Stocks
Tons
1.8
Source: TFI and Mosaic
1.6
1.4
1.2
1.0
0.8
0.6
0.4
Jul Sep Nov Jan Mar May Jul Sep Nov Jan Mar May Jul 06/07 07/08 08/09
5-year Minimum-Maximum Range Stocks 3-year Average
Inventories of DAP/MAP held by U.S. producers at both on- and off-site facilities have declined to low levels during the last two years. Producers reported holding 1.11 million tons of DAP/MAP at both on- and off-site facilities on July 31, 2008. That was 17 percent more than a year ago but nine percent less than two years ago and in line with the three year average. Based on the above forecasts, U.S. DAP/MAP producer stocks are forecast to stay at low levels throughout the 2008/09 fertilizer year.
Potash Supply Struggles to Keep Up with Surging Demand
The potash market remains extremely tight as mines continue to struggle to keep up with surging demand. Prices took another large step up this summer and likely will move to levels that are required to ration some demand and allocate available supplies to their highest value uses.
After jumping 16 percent in 2007, world import demand is projected to increase another two percent in 2008 – despite the fact
that Chinese imports plunged 51 percent during the first half of the year and are projected to drop more than 30 percent for the entire year. Demand prospects next year look even better given the likelihood of timely settlements of 2009 contracts and record shipments to Chinese customers as well as continued strong demand in other key importing countries.
High grain and oilseed prices and profitable farm economics for many potash-intensive crops such as palm oil, rice and soybeans have stoked demand in the large importing countries in Asia and Latin America. Brazil imported 6.7 million tonnes of potash (KCL) in 2007, up 32 percent from the lower level of 2006, and imports are forecast to increase another seven percent or almost one-half million tonnes to 7.2 million tonnes in 2008. Imports during the first half of 2008 totaled 3.7 million tonnes, up 22 percent or more than 660,000 tonnes from the same period a year ago. The latest statistics from the Fertilizer Association of India (FAI) show that India has stepped up potash imports this year. It is no coincidence that India is growing a
Million
Tonnes India Potash Imports
KCL
6.0
Source: Fertecon and Mosaic
5.0
4.0
3.0
2.0
1.0
0.0
90 92 94 96 98 00 02 04 06 08
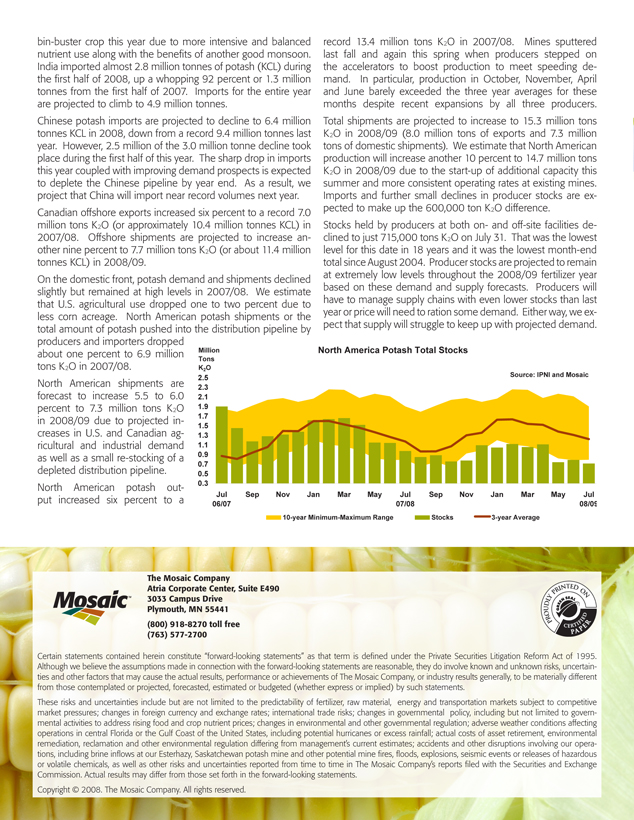
bin-buster crop this year due to more intensive and balanced nutrient use along with the benefits of another good monsoon. India imported almost 2.8 million tonnes of potash (KCL) during the first half of 2008, up a whopping 92 percent or 1.3 million tonnes from the first half of 2007. Imports for the entire year are projected to climb to 4.9 million tonnes.
Chinese potash imports are projected to decline to 6.4 million tonnes KCL in 2008, down from a record 9.4 million tonnes last year. However, 2.5 million of the 3.0 million tonne decline took place during the first half of this year. The sharp drop in imports this year coupled with improving demand prospects is expected to deplete the Chinese pipeline by year end. As a result, we project that China will import near record volumes next year. Canadian offshore exports increased six percent to a record 7.0 million tons K2O (or approximately 10.4 million tonnes KCL) in 2007/08. Offshore shipments are projected to increase another nine percent to 7.7 million tons K2O (or about 11.4 million tonnes KCL) in 2008/09.
On the domestic front, potash demand and shipments declined slightly but remained at high levels in 2007/08. We estimate that U.S. agricultural use dropped one to two percent due to less corn acreage. North American potash shipments or the total amount of potash pushed into the distribution pipeline by
producers and importers dropped about one percent to 6.9 million tons K2O in 2007/08.
North American shipments are forecast to increase 5.5 to 6.0 percent to 7.3 million tons K2O in 2008/09 due to projected increases in U.S. and Canadian agricultural and industrial demand as well as a small re-stocking of a depleted distribution pipeline. North American potash output increased six percent to a
record 13.4 million tons K2O in 2007/08. Mines sputtered last fall and again this spring when producers stepped on the accelerators to boost production to meet speeding demand. In particular, production in October, November, April and June barely exceeded the three year averages for these months despite recent expansions by all three producers. Total shipments are projected to increase to 15.3 million tons K2O in 2008/09 (8.0 million tons of exports and 7.3 million tons of domestic shipments). We estimate that
North American production will increase another 10 percent to 14.7 million tons K2O in 2008/09 due to the start-up of additional capacity this summer and more consistent operating rates at existing mines. Imports and further small declines in producer stocks are expected to make up the 600,000 ton K2O difference.
Stocks held by producers at both on- and off-site facilities declined to just 715,000 tons K2O on July 31. That was the lowest level for this date in 18 years and it was the lowest month-end total since August 2004. Producer stocks are projected to remain at extremely low levels throughout the 2008/09 fertilizer year based on these demand and supply forecasts. Producers will have to manage supply chains with even lower stocks than last year or price will need to ration some demand. Either way, we expect that supply will struggle to keep up with projected demand.
Million North America Potash Total Stocks
Tons
K2O Source: IPNI and Mosaic
2.5
2.3
2.1
1.9
1.7
1.5
1.3
1.1
0.9
0.7
0.5
0.3
Jul Sep Nov Jan Mar May Jul Sep Nov Jan Mar May Jul 06/07 07/08 08/09 10-year Minimum-Maximum Range Stocks 3-year Average
The Mosaic Company
Atria Corporate Center, Suite E490 3033 Campus Drive Plymouth, MN 55441 (800) 918-8270 toll free (763) 577-2700
Certain statements contained herein constitute “forward-looking statements” as that term is defined under the Private Securities Litigation Reform Act of 1995. Although we believe the assumptions made in connection with the forward-looking statements are reasonable, they do involve known and unknown risks, uncertainties and other factors that may cause the actual results, performance or achievements of The Mosaic Company, or industry results generally, to be materially different from those contemplated or projected, forecasted, estimated or budgeted (whether express or implied) by such statements.
These risks and uncertainties include but are not limited to the predictability of fertilizer, raw material, energy and transportation markets subject to competitive market pressures; changes in foreign currency and exchange rates; international trade risks; changes in governmental policy, including but not limited to governmental activities to address rising food and crop nutrient prices; changes in environmental and other governmental regulation; adverse weather conditions affecting operations in central Florida or the Gulf Coast of the United States, including potential hurricanes or excess rainfall; actual costs of asset retirement, environmental remediation, reclamation and other environmental regulation differing from management’s current estimates; accidents and other disruptions involving our operations, including brine inflows at our Esterhazy, Saskatchewan potash mine and other potential mine fires, floods, explosions, seismic events or releases of hazardous or volatile chemicals, as well as other risks and uncertainties reported from time to time in The Mosaic Company’s reports filed with the Securities and Exchange Commission. Actual results may differ from those set forth in the forward-looking statements.
Copyright © 2008. The Mosaic Company. All rights reserved.