 Phosphate and Potash Outlook Dr. Michael Rahm, Vice President Market Analysis and Strategic Planning BofA-Merrill Lynch Investor Visit Plymouth, MN March 5, 2009 Exhibit 99.1 |
 Slide 2 Safe Harbor Statement This presentation contains forward-looking statements within the meaning of the Private Securities Litigation Reform Act of 1995. Such statements include, but are not limited to, statements about future financial and operating results. Such statements are based upon the current beliefs and expectations of The Mosaic Company’s management and are subject to significant risks and uncertainties. These risks and uncertainties include but are not limited to the predictability and volatility of, and customer expectations about, agriculture, fertilizer, raw material, energy and transportation markets that are subject to competitive and other pressures and the effects of the current economic and financial turmoil; the build-up of inventories in the distribution channels for crop nutrients; changes in foreign currency and exchange rates; international trade risks; changes in government policy; changes in environmental and other governmental regulation; adverse weather conditions affecting operations in Central Florida or the Gulf Coast of the United States, including potential hurricanes or excess rainfall; actual costs of asset retirement, environmental remediation, reclamation or other environmental regulation differing from management’s current estimates; accidents and other disruptions involving Mosaic’s operations, including brine inflows at its Esterhazy, Saskatchewan potash mine and other potential mine fires, floods, explosions, seismic events or releases of hazardous or volatile chemicals, as well as other risks and uncertainties reported from time to time in The Mosaic Company’s reports filed with the Securities and Exchange Commission. Actual results may differ from those set forth in the forward-looking statements. |
 Slide 3 Topics • Current Situation or . . . How did we get to where we’re at today? • Near Term Outlook or . . . What’s ahead for the spring season? • Long Term Outlook or . . . Have recent developments changed long term fundamentals? |
 Slide 4 What happened? • Customers stepped out of the market • Distribution pipeline plugs • Stocks back-up at production points • Production declines as a result • Crop nutrient markets recalibrate • Supply chain exposed to large inventory valuation risk |
 Slide 5 Customers stepped out of the market • Build up of distribution pipeline stocks last year • A late North American harvest • Reduced credit availability in some regions • Expectations of lower crop nutrient prices • Large drops in energy and raw materials costs • Declines in crop prices |
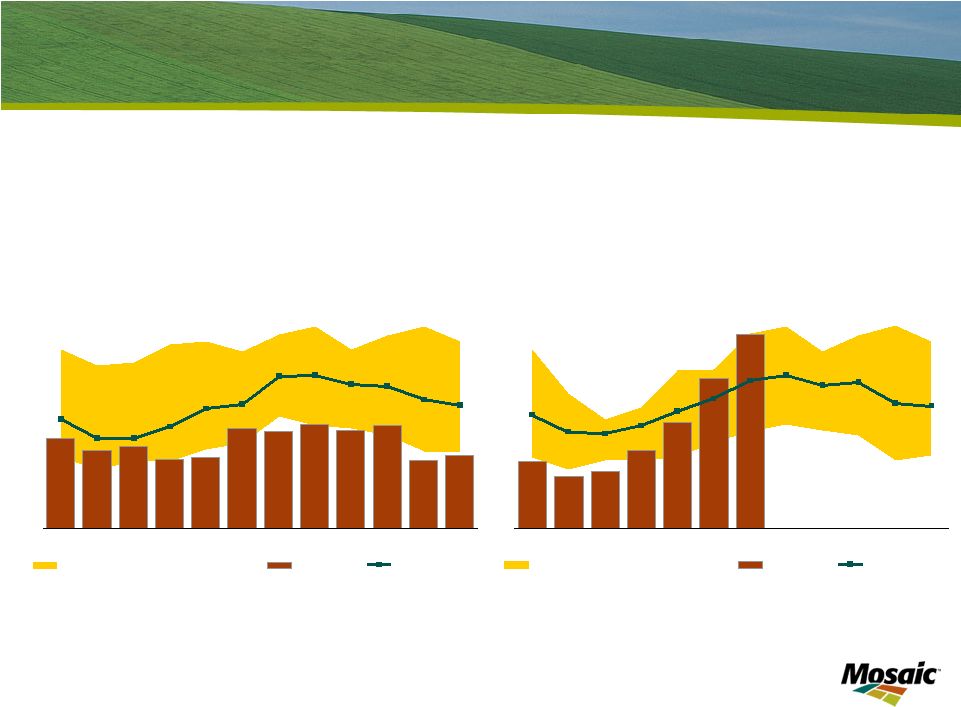
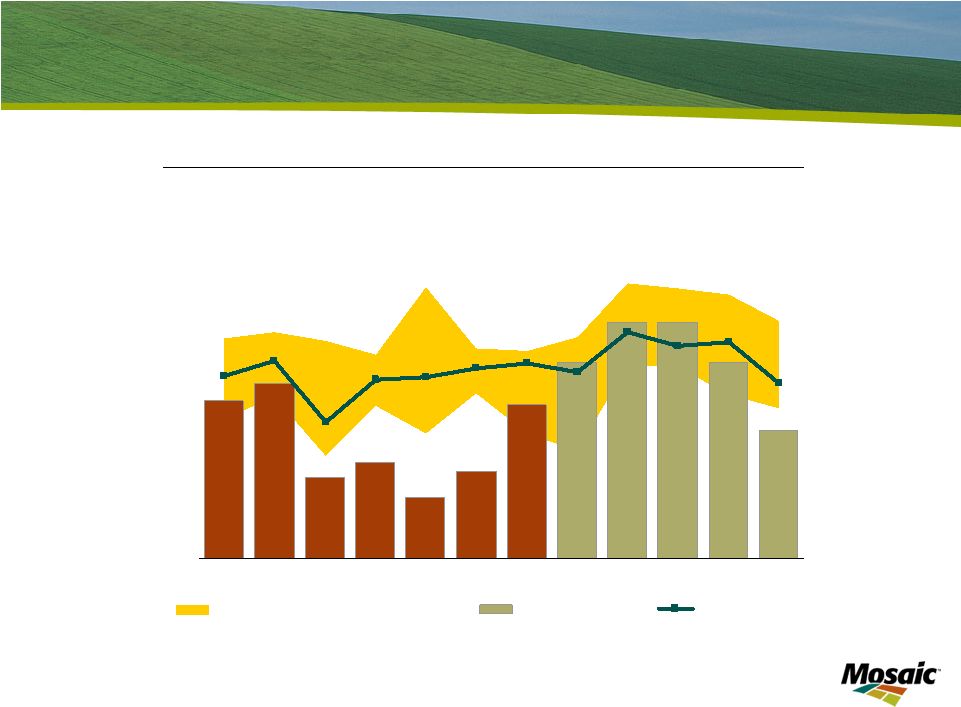
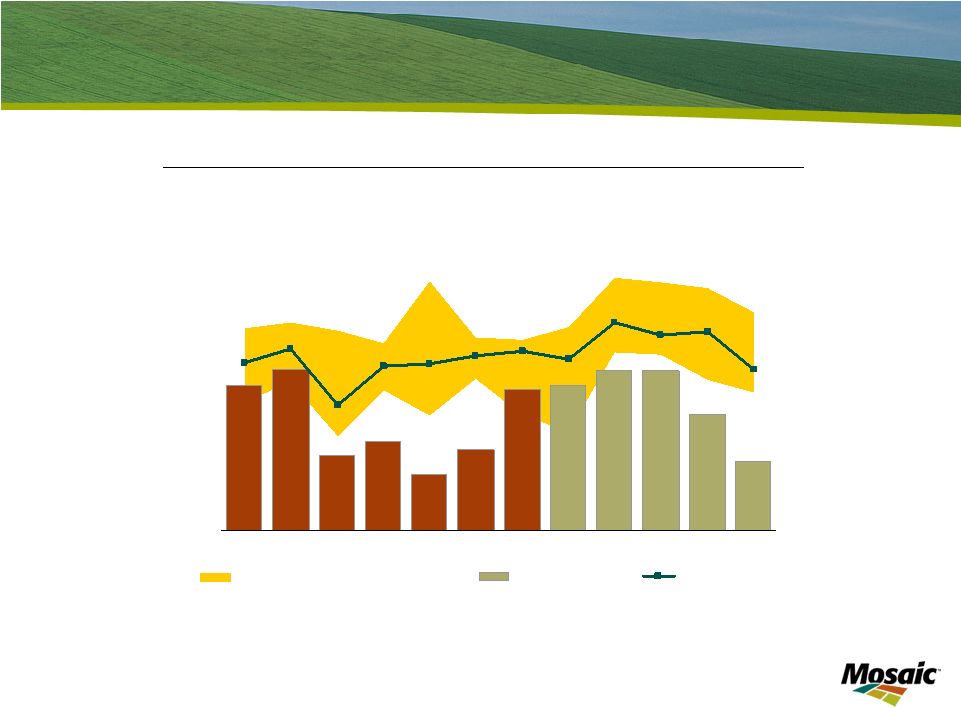
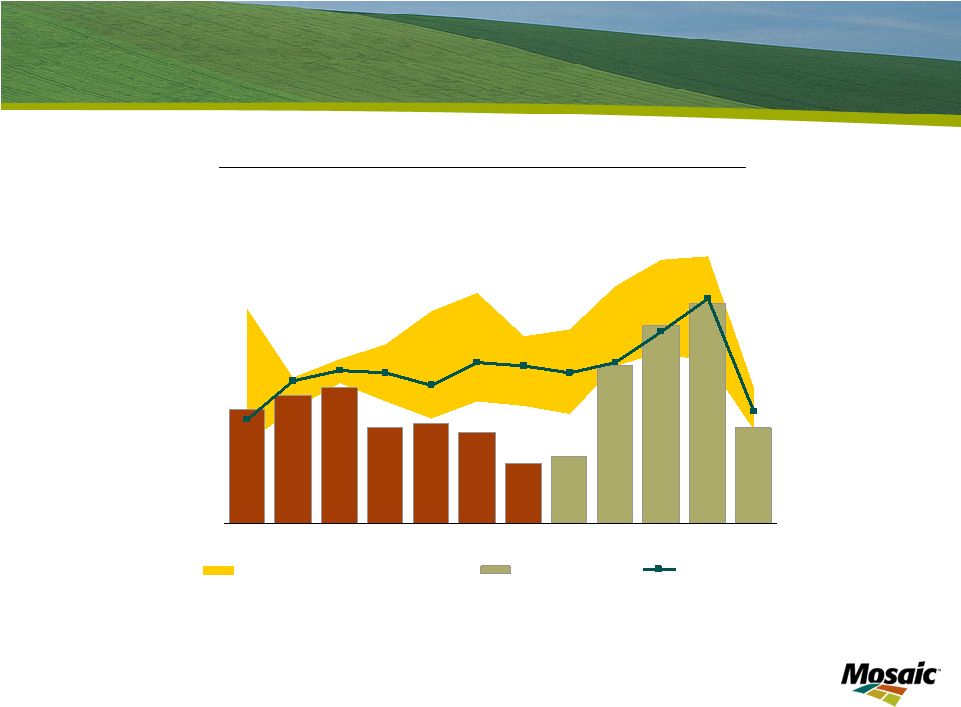
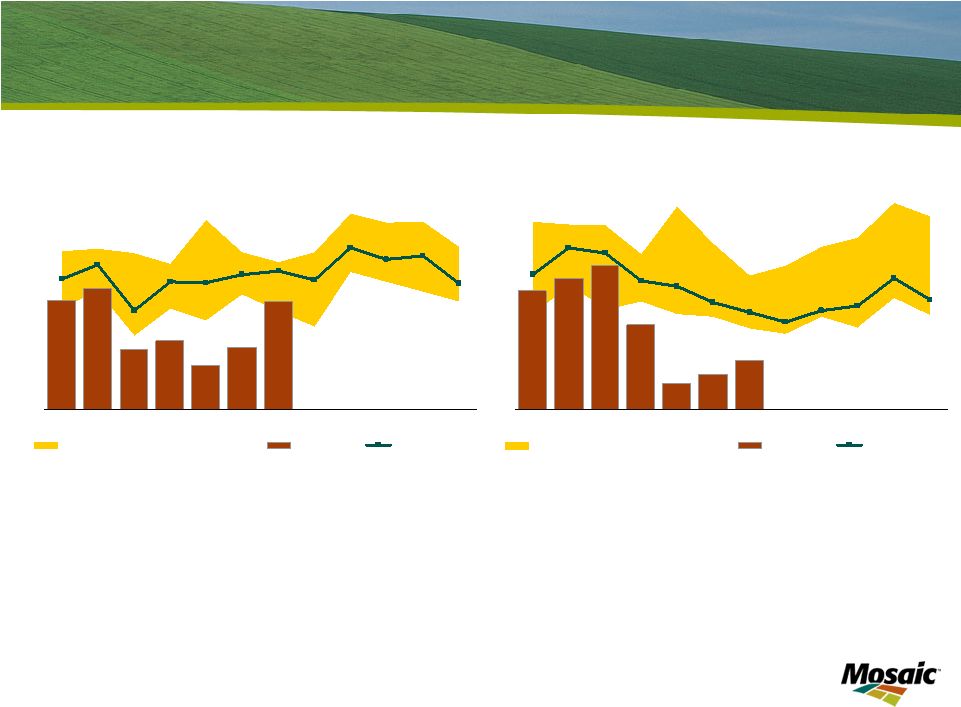 Slide 6 Customers stepped out of the phosphate market last fall but began to buy again in January Year-to-date (Jul-Jan) DAP/MAP domestic shipments were down 45% from the high levels a year ago. Shipments during the last quarter of calendar 2008 (Oct-Dec) were off 61% from a year earlier. Domestic shipments in January recovered to higher levels as customers returned to the market to order spring tons . Year-to-date (Jul-Jan) DAP/MAP exports were down 22% from a year ago due to a sharp decline since September. Exports during the last quarter of calendar 2008 (Oct-Dec) were off 54% from a year ago. Exports have increased slightly during the last two months and forward sales books are beginning to build. U.S. DAP and MAP Domestic Disapperance 0.0 0.1 0.2 0.3 0.4 0.5 0.6 0.7 0.8 0.9 1.0 Jul Aug Sep Oct Nov Dec Jan Feb Mar Apr May Jun Mil Tons MIN MAX Range (2003/04-2007/08) 2008/09 3-Yr Average Source: TFI U.S. DAP and MAP Exports 0.0 0.2 0.4 0.6 0.8 1.0 1.2 Jul Aug Sep Oct Nov Dec Jan Feb Mar Apr May Jun Mil Tons MIN MAX Range (2003/04-2007/08) 2008/09 3-Yr Average Source: TFI |
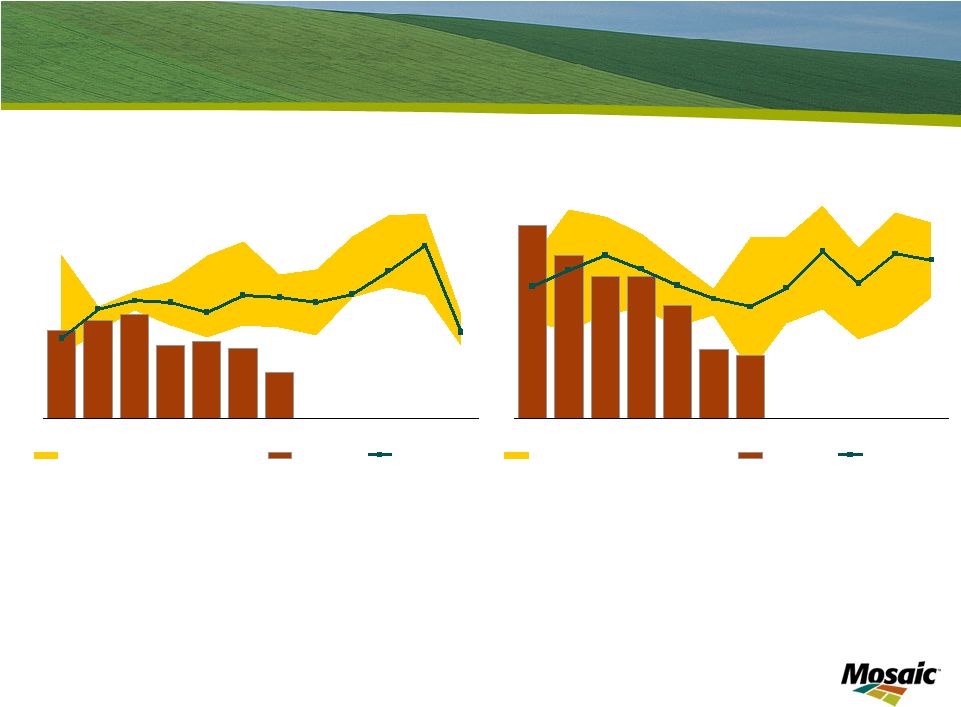
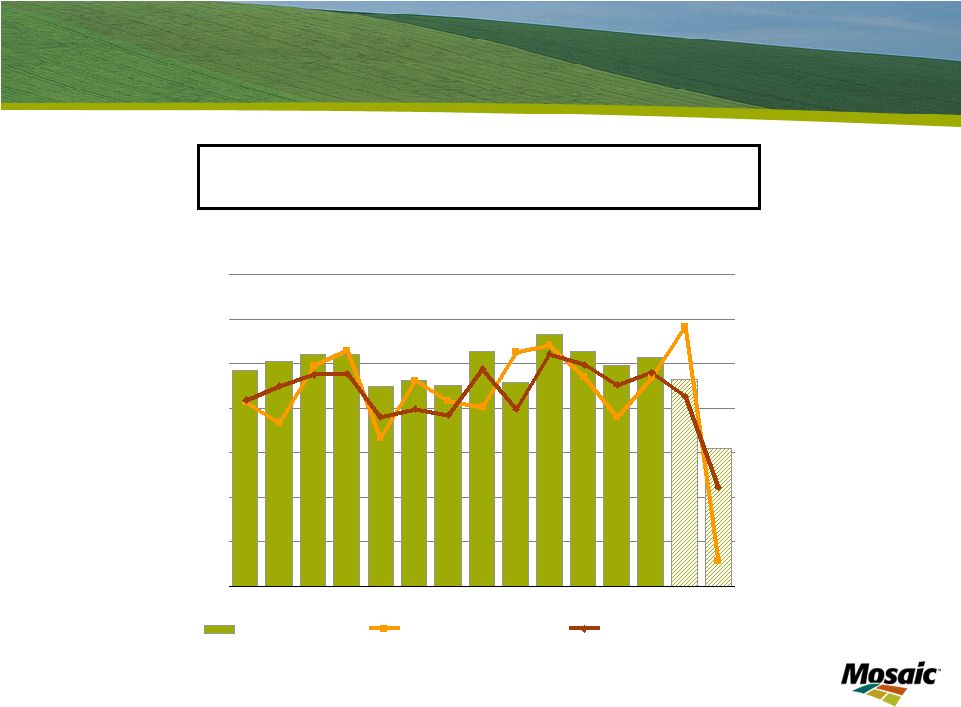
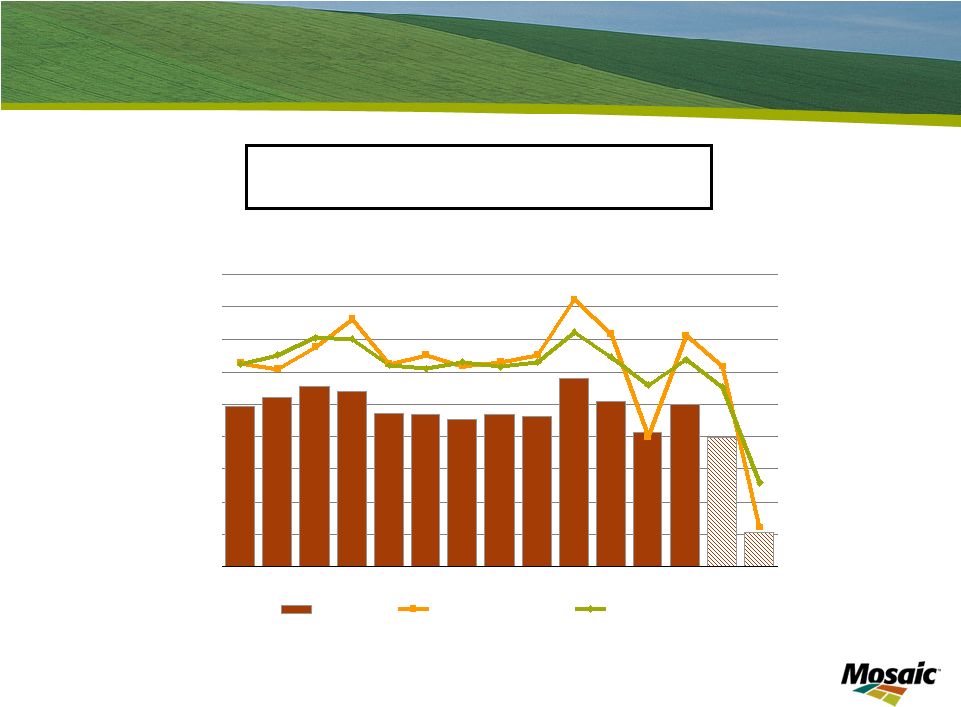
 Slide 7 Phosphate inventories peaked on December 31 and have begun to decline DAP/MAP inventories held by U.S. producers at on- and off-site warehouses 2008/09 2007/08 U.S. DAP and MAP Producer Stocks 0.0 0.5 1.0 1.5 2.0 Jul Aug Sep Oct Nov Dec Jan Feb Mar Apr May Jun Mil Tons MIN MAX Range (2002/03-2006/07) 2007/08 3-Yr Average Source: TFI U.S. DAP and MAP Producer Stocks 0.0 0.5 1.0 1.5 2.0 Jul Aug Sep Oct Nov Dec Jan Feb Mar Apr May Jun Mil Tons MIN MAX Range (2003/04-2007/08) 2008/09 3-Yr Average Source: TFI |
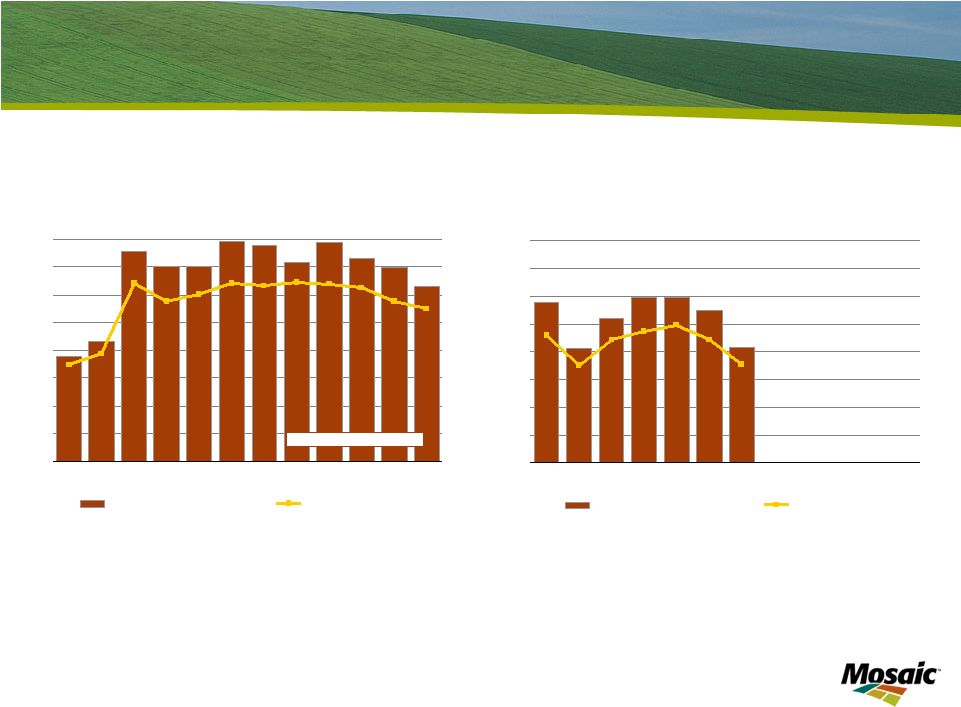
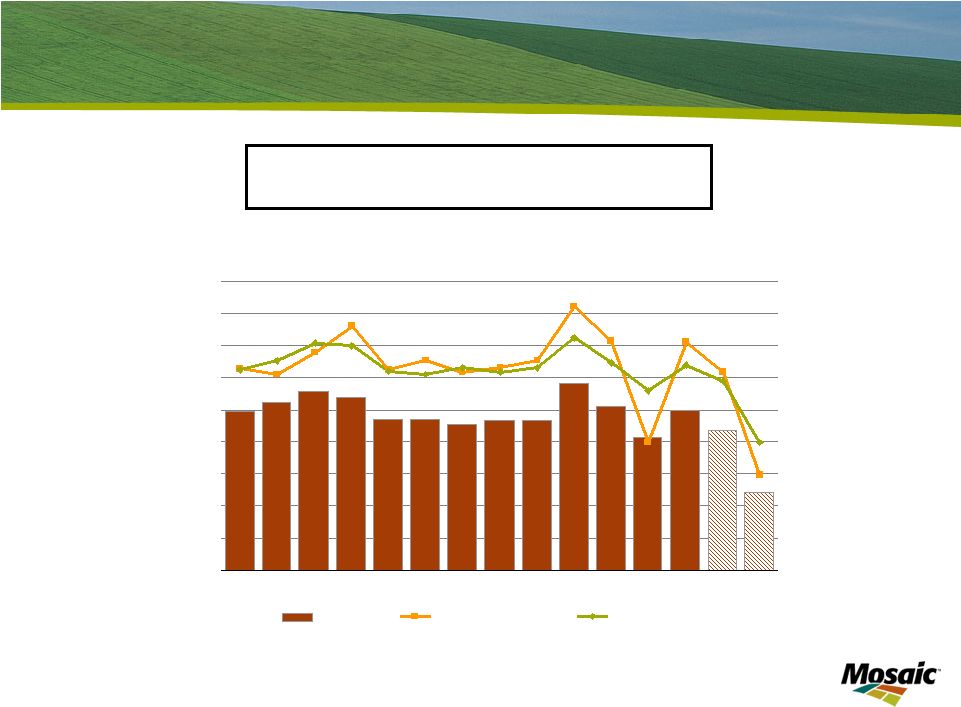
 Slide 8 U.S. phosphate production decreases Year-to-date (Jul-Jan) U.S. phosphoric acid production was down 28% from a year earlier. The U.S. industry operated at just 30% of capacity in January. U.S. Phosphoric Acid Production and Op. Rates 0.3 0.4 0.5 0.6 0.7 0.8 0.9 1.0 Jul Aug Sep Oct Nov Dec Jan Feb Mar Apr May Jun Mil Tons P 2 O 5 30 40 50 60 70 80 90 100 Percent 2007/08 Production 2007/08 Operating Rate Source: TFI and Mosaic U.S. Phosphoric Acid Production and Op. Rates 0.2 0.3 0.4 0.5 0.6 0.7 0.8 0.9 1.0 Jul Aug Sep Oct Nov Dec Jan Feb Mar Apr May Jun Mil Tons P 2 O 5 20 30 40 50 60 70 80 90 100 Percent 2008/09 Production 2008/09 Operating Rate Source: TFI and Mosaic |
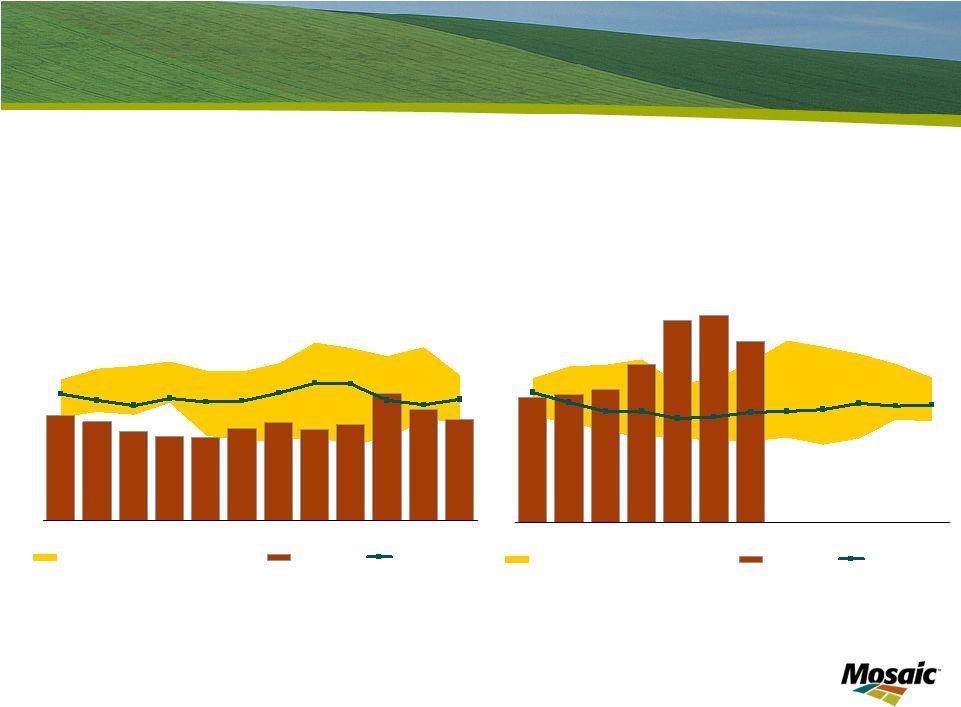
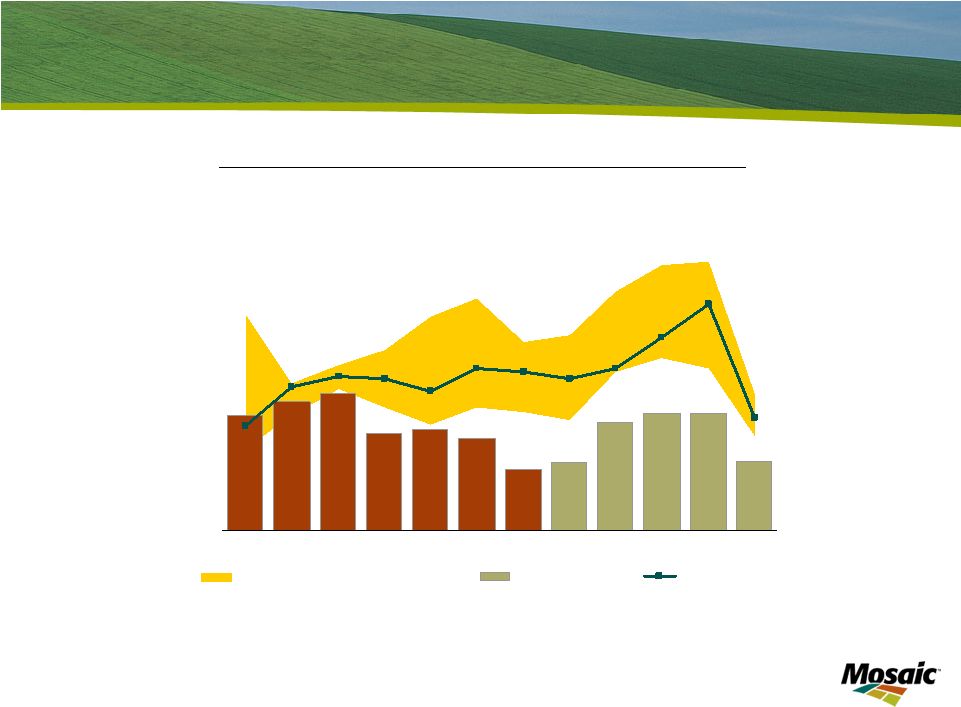
 Slide 9 Customers stepped out of the potash market Year-to-date (Jul-Jan) domestic shipments were down 29% from a year ago. Shipments during the last quarter of calendar 2008 (Oct- Dec) were off 38% from last year. Estimated and implied domestic shipments dropped another 100,000 tons K 2 O in January. Year-to-date (Jul-Jan) exports were down 22% from a year ago. Exports during the last quarter of calendar 2008 (Oct-Dec) were off 31% from last year. Exports in January also declined to less than 225,000 tons K 2 O. North America MOP Domestic Disapperance 0.0 0.1 0.2 0.3 0.4 0.5 0.6 0.7 0.8 0.9 1.0 Jul Aug Sep Oct Nov Dec Jan Feb Mar Apr May Jun Mil Tons K 2 O MIN MAX Range (2003/04-2007/08) 2008/09 3-Yr Average Source: IPNI, TFI and Mosaic North America MOP Exports 0.0 0.1 0.2 0.3 0.4 0.5 0.6 0.7 0.8 Jul Aug Sep Oct Nov Dec Jan Feb Mar Apr May Jun Mil Tons K 2 O MIN MAX Range (2003/04-2007/08) 2008/09 3-Yr Average Source: IPNI |
 Slide 10 NA potash producer inventories increase MOP inventories held by NA producers at on- and off-site warehouses 2007/08 2008/09 North America MOP Producer Stocks 0.0 0.3 0.6 0.9 1.2 1.5 1.8 2.1 2.4 Jul Aug Sep Oct Nov Dec Jan Feb Mar Apr May Jun Mil Tons K 2 O MIN MAX Range (2002/03-2006/07) 2007/08 3-Yr Average Source: IPNI North America MOP Producer Stocks 0.0 0.3 0.6 0.9 1.2 1.5 1.8 2.1 2.4 Jul Aug Sep Oct Nov Dec Jan Feb Mar Apr May Jun Mil Tons K 2 O MIN MAX Range (2003/04-2007/08) 2008/09 3-Yr Average Source: IPNI |
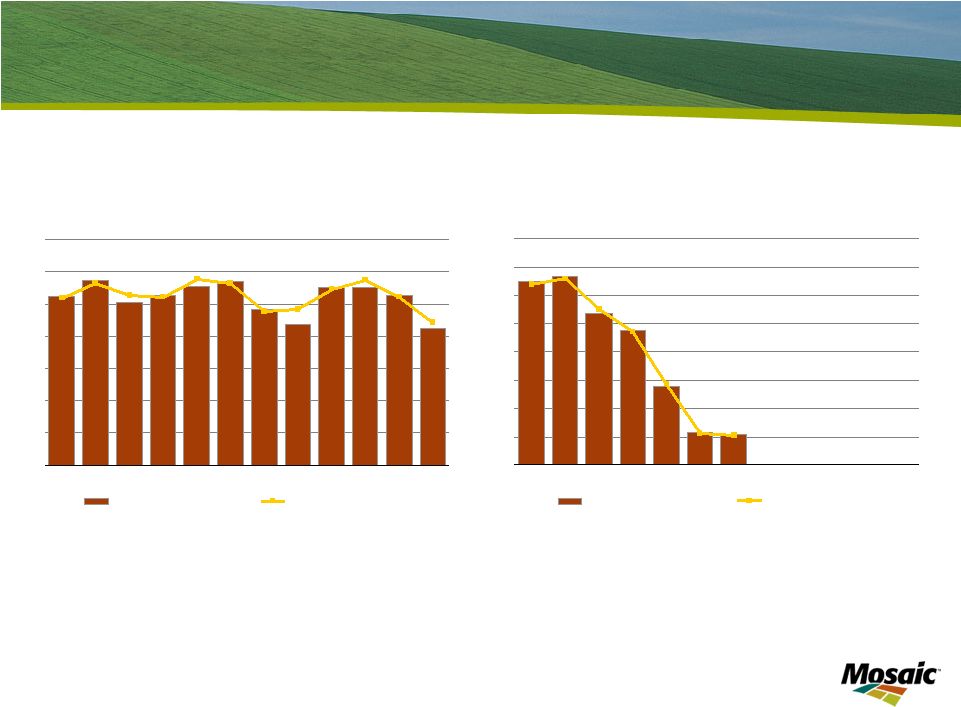
 Slide 11 NA potash production begins to decline Year-to-date (Jul-Jan) NA MOP production was down 12% from a year earlier. Production during the last quarter of calendar 2008 (Oct-Dec) was down 13% from a year ago. Output in January dropped further to less than 820,000 tons K 2 O. A larger decline is expected in February based on announced plant turnarounds in Canada. NA MOP Production and Operating Rate 2007/08 400 500 600 700 800 900 1,000 1,100 1,200 Jul Aug Sep Oct Nov Dec Jan Feb Mar Apr May Jun 1000 Tons K 2 O 20 30 40 50 60 70 80 90 100 Percent 2007/08 Production 2007/08 Operating Rate Source: IPNI and Mosaic NA MOP Production and Operating Rate 2008/09 400 500 600 700 800 900 1,000 1,100 1,200 Jul Aug Sep Oct Nov Dec Jan Feb Mar Apr May Jun 1000 Tons K 2 O 20 30 40 50 60 70 80 90 100 Percent 2008/09 Production 2008/09 Operating Rate Source: IPNI and Mosaic |
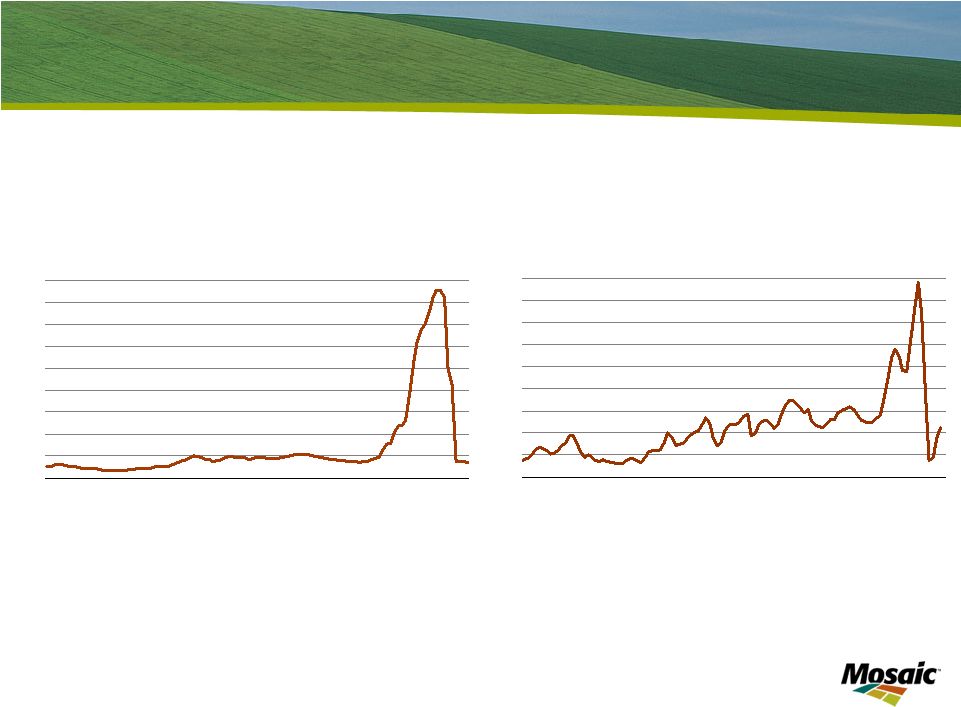 Slide 12 Expectations of lower crop nutrient prices Ammonia Prices c&f Tampa 50 150 250 350 450 550 650 750 850 950 00 01 02 03 04 05 06 07 08 09 $ MT Source: Fertecon Sulphur Prices c&f India 0 100 200 300 400 500 600 700 800 900 00 01 02 03 04 05 06 07 08 09 $ MT Source: Fertecon The rise and fall of phosphate raw materials costs |
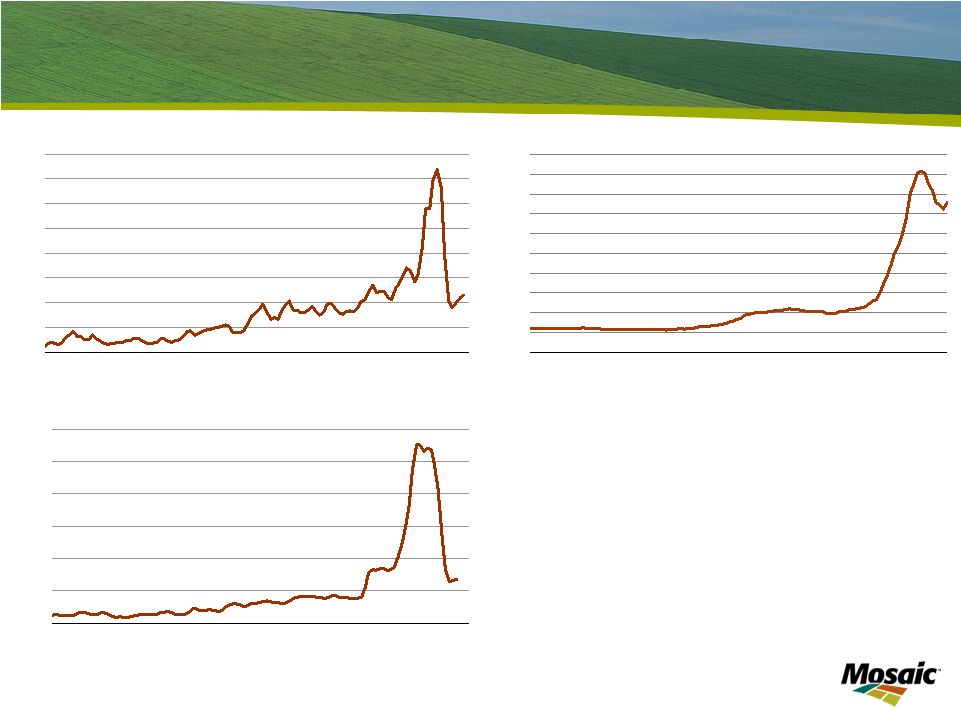 Slide 13 Crop nutrient markets recalibrate Potash Prices Blend Grade fob U.S. Midwest Warehouse 0 100 200 300 400 500 600 700 800 900 1000 00 01 02 03 04 05 06 07 08 09 $ ST Source: Green Markets Prilled Urea Prices fob Yuzhnyy 50 150 250 350 450 550 650 750 850 00 01 02 03 04 05 06 07 08 09 $ MT Source: Fertilizer Week America DAP Prices fob Tampa Vessel 100 300 500 700 900 1100 1300 00 01 02 03 04 05 06 07 08 09 $ MT Source: Fertecon The entire supply chain captured large inventory gains on the way up, but now is exposed to potentially equally large inventory losses on the way down. |
 Slide 14 Near Term Outlook • How much will nutrient demand decline this year? • Another record crop is required in 2009 • Lower crop input costs • Demand deferral vs. destruction • Reduction in production worldwide • Adjustments to get product moving through the supply chain • Inventory write-downs • Averaging down inventory costs via new purchases • Cost-based retail pricing • Potential test of NA supply chain capacity this spring • Challenges and Opportunities • High and high-priced distribution pipeline stocks • Crop prices and planted acreage this spring • Crop nutrient price expectations |
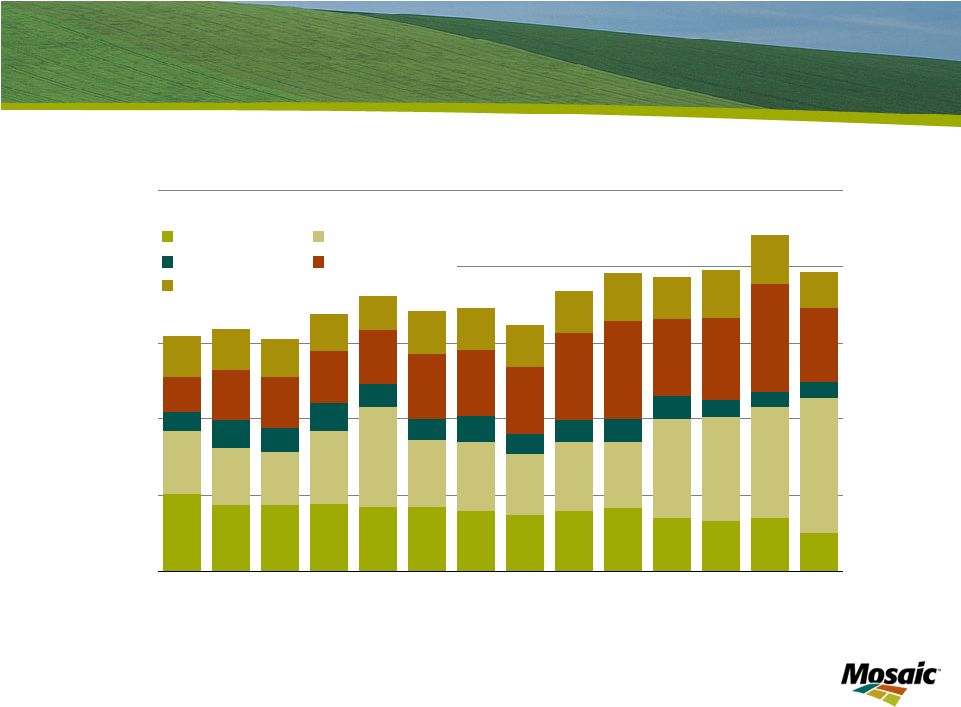
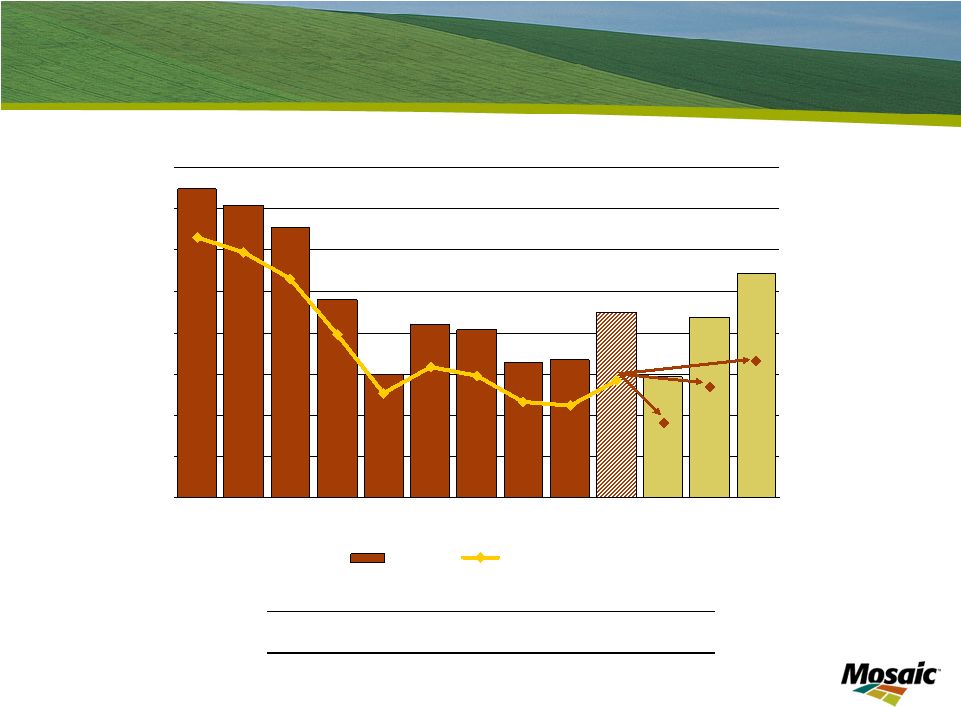 Slide 15 Another large crop is required in 2009 World Grain and Oilseed Stocks 250 300 350 400 450 500 550 600 650 99/00 00/01 01/02 02/03 03/04 04/05 05/06 06/07 07/08 08/09E 09/10 L 09/10 M 09/10 H Mil Tonnes 10% 13% 16% 19% 22% 25% 28% 31% 34% Percent Stocks Percent of Use Source: USDA and Mosaic (for 09/10 estimates) 2009/10 Scenario Assumptions Low Medium High Increase in Harvested Area (Mil HA) 0 0 0 Yield (Deviation from 10-Year Trend) Largest Negative 0 Largest Positive Demand Growth 0.0% 1.0% 2.0% |
 The world needs to produce another bumper crop in 2009 in order to prevent global grain and oilseed stocks from declining to unsafe levels. This chart illustrates the main reason for that assessment. The bars show global stocks of the 16 leading grain and oilseed crops. The cross-hatched bar is the USDA’s December estimate of 2008/09 ending stocks. The green bars are our estimates of 2009/10 ending stocks under low, medium and high production and use scenarios. The line shows stocks as a percentage of use. Farmers all around the globe harvested massive crops during the last two years, yet stocks have grown by 56 million tonnes and stocks as a percentage of use has inched up from 16.7% to 18.5% in 2008/09. More importantly, the world needs to produce another record crop in 2009 to prevent stocks from falling to unsafe levels. We have made a few changes in assumptions since this chart was first published in the August issue of Market Mosaic. Given the slowdown in the global economy, we now assume grain and oilseed demand grows at 0%, 1% and 2%, respectively, in the low, medium and high scenarios. Furthermore, we assume harvest area remains flat at the record levels of last year for all three scenarios. Finally, we assume an average yield equal to the 10-year trend in the medium scenario, a yield equal to trend plus the largest positive deviation from trend in the high scenario and a yield equal to trend minus the largest negative deviation from trend in the low scenario. Clearly, the world requires a three-peat of record harvests to prevent a large drop in global stocks in 2009/10. Needless to say, supply prospects are not off to a stellar start so far. |
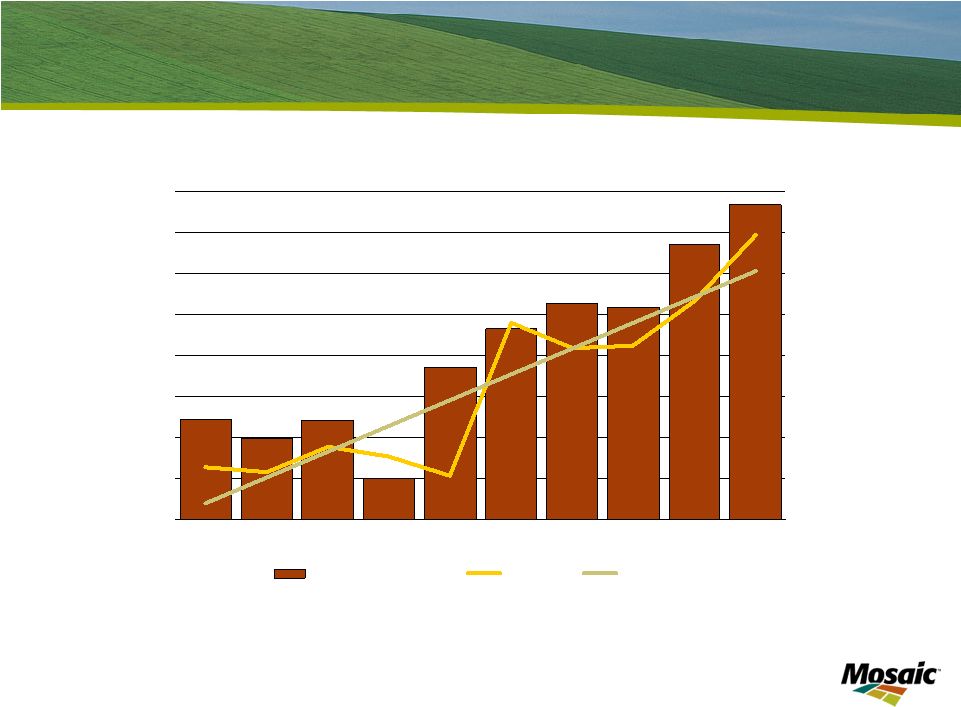 Slide 16 Record harvested area and average yield World Grain and Oilseed Area and Yields 820 830 840 850 860 870 880 890 900 99/00 00/01 01/02 02/03 03/04 04/05 05/06 06/07 07/08 08/09E Mil Ha 2.50 2.56 2.63 2.69 2.75 2.81 2.88 2.94 3.00 MT Ha Harvested Area Yield Trend Source: USDA |
 The world produced bumper crops during the last two years as a result of record harvested area and record yields. This chart illustrates the challenges of repeating last year’s performance. The bars show harvested area. Farmers harvested almost 25 million more hectares in 2008 than in 2006. That is slightly more than the area harvested by Canadian farmers last year! We project that, at best, harvested area will remain at the record level of last year. The lines show the actual and trend yield during the last ten years. The average yield last year exceeded the 10-year trend by a significant margin. In fact, if the yield last year would have just equaled trend, global production would have totaled 77 million tonnes less than the actual harvest and the world would have drawn down stocks by more than 30 million tonnes this year! |
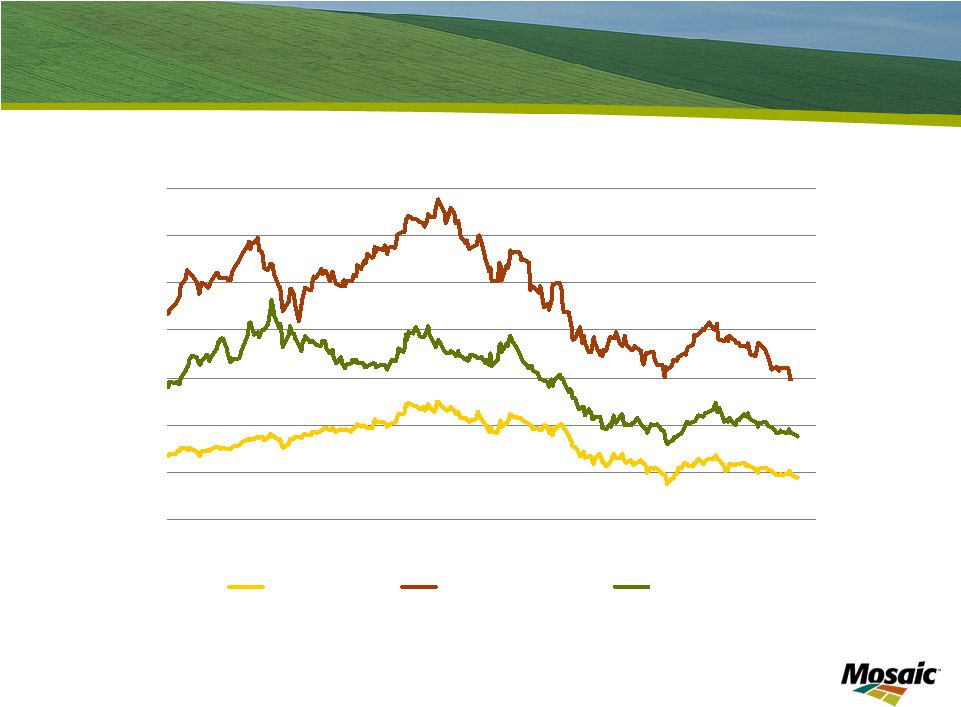 Slide 17 2009 new crop prices 2009 New Crop Prices Daily Close of New Crop Options Jan 2, 2008 to March 3, 2009 2 4 6 8 10 12 14 16 Jan Feb Mar Apr May Jun Jul Aug Sep Oct Nov Dec Jan Feb Mar $ BU Dec 09 Corn Nov 09 Soybeans Jul 09 Wheat Source: CBOT and KCBOT |
 Slide 18 Impact of reductions in P&K application rates on corn yields and profitability Economic P&K Cut Optimum 10% 50% 100% Yield Potential (bu acre): 180 180 180 180 Estimated Yield Without N (bu acre): 100 100 100 100 P Soil Test - Bray P1 (ppm): 10 10 10 10 K Soil Test (ppm): 110 110 110 110 Corn Price ($ bu): 4.25 4.25 4.25 4.25 Ammonia Price ($ ton) 600 600 600 600 N Cost ($ lb N): 0.37 0.37 0.37 0.37 DAP Cost ($ ton) 500 500 500 500 P Cost ($ lb P2 O 5 ): 0.40 0.40 0.40 0.40 MOP Cost ($ ton) 725 725 725 725 K Cost ($ lb K2 O): 0.60 0.60 0.60 0.60 Yield (bu acre) 180 175 155 113 Profit Maximizing Application Rates N (lbs N): 142 142 142 142 P (lbs P2 O 5 ): 82 74 41 0 K (lbs K2 O): 59 53 30 0 Fertilizer Cost ($ acre) 120 114 86 52 Yield Change (bu acre) -5 -25 -67 Yield Change (%) na -2.8 -13.9 -37.2 Change in Revenue ($ acre) na -21.25 -106.25 -284.75 Change in Cost ($ acre) na -6.85 -34.24 -68.47 Change in Profit ($ acre) na -14.40 -72.01 -216.28 |
 Slide 19 Domestic Phosphate Outlook: Case 1 2008/09 Change U.S. Phosphate Demand: -10.6% 2008/09 Change in U.S. DAP/MAP Shipments: -26.8% U.S. Phosphate Use and DAP/MAP Shipments 2.50 3.00 3.50 4.00 4.50 5.00 5.50 95 96 97 98 99 00 01 02 03 04 05 06 07 08E 09F Mil Tons P 2 O 5 4.50 5.00 5.50 6.00 6.50 7.00 7.50 8.00 8.50 Mil Tons DAP/MAP Phosphate Use DAP/MAP Shipments Estimated DAP/MAP Use Source: AAPFCO, TFI and Mosaic Fertilizer Year Ending June 30 |
 Slide 20 Above-average shipments are required this spring if DAP/MAP shipments decline 27% this year U.S. DAP and MAP Domestic Shipments 0.0 0.1 0.2 0.3 0.4 0.5 0.6 0.7 0.8 0.9 1.0 Jul Aug Sep Oct Nov Dec Jan Feb Mar Apr May Jun Mil Tons MIN MAX Range (2003/04-2007/08) 2008/09 Act/Fcst 3-Yr Average Source: TFI and Mosaic Case 1: 27% Drop in U.S. DAP/MAP Shipments in 2008/09 |
 Slide 21 Domestic Phosphate Outlook: Case 2 2008/09 Change U.S. Phosphate Demand: -17.9% 2008/09 Change in U.S. DAP/MAP Shipments: -38.5% U.S. Phosphate Use and DAP/MAP Shipments 2.00 2.50 3.00 3.50 4.00 4.50 5.00 5.50 95 96 97 98 99 00 01 02 03 04 05 06 07 08E 09F Mil Tons P 2 O 5 4.50 5.00 5.50 6.00 6.50 7.00 7.50 8.00 8.50 Mil Tons DAP/MAP Phosphate Use DAP/MAP Shipments Estimated DAP/MAP Use Source: AAPFCO, TFI and Mosaic Fertilizer Year Ending June 30 |
 Slide 22 Below average shipments required this spring if shipments run 39% below last year Case 2: 39% Drop in U.S. DAP/MAP Shipments in 2008/09 U.S. DAP and MAP Domestic Shipments 0.0 0.1 0.2 0.3 0.4 0.5 0.6 0.7 0.8 0.9 1.0 Jul Aug Sep Oct Nov Dec Jan Feb Mar Apr May Jun Mil Tons MIN MAX Range (2003/04-2007/08) 2008/09 Act/Fcst 3-Yr Average Source: TFI and Mosaic |
 Slide 23 Domestic Potash Outlook: Case 1 2008/09 Change U.S. Potash Demand: -19.6% 2008/09 Change in NA MOP Shipments: -23.9% North America Potash Use and Shipments 3.0 3.5 4.0 4.5 5.0 5.5 6.0 6.5 7.0 7.5 95 96 97 98 99 00 01 02 03 04 05 06 07 08E 09F Mil Tons K 2 O Ag Use Total Shipments Estimated Use Source: IPNI and Mosaic Fertilizer Year Ending June 30 |
 Slide 24 Average shipments are required this spring if MOP shipments decline 24% this year North America MOP Domestic Shipments 0.0 0.2 0.4 0.6 0.8 1.0 1.2 1.4 1.6 Jul Aug Sep Oct Nov Dec Jan Feb Mar Apr May Jun Mil Tons KCL MIN MAX Range (2003/04-2007/08) 2008/09 Act/Fcst 3-Yr Average Source: IPNI and Mosaic Case 1: 24% Drop in MOP Shipments in 2008/09 |
 Slide 25 Domestic Potash Outlook: Case 2 2008/09 Change U.S. Potash Demand: -31.5% 2008/09 Change in NA MOP Shipments: -37.5% North America Potash Use and Shipments 3.0 3.5 4.0 4.5 5.0 5.5 6.0 6.5 7.0 7.5 95 96 97 98 99 00 01 02 03 04 05 06 07 08 09F Mil Tons K 2 O Ag Use Total Shipments Estimated Use Source: IPNI and Mosaic Fertilizer Year Ending June 30 |
 Slide 26 Extremely slow movements this spring if shipments run 38% less than last year Case 2: 38% Drop in MOP Shipments in 2008/09 North America MOP Domestic Shipments 0.0 0.2 0.4 0.6 0.8 1.0 1.2 1.4 1.6 Jul Aug Sep Oct Nov Dec Jan Feb Mar Apr May Jun Mil Tons KCL MIN MAX Range (2003/04-2007/08) 2008/09 Act/Fcst 3-Yr Average Source: IPNI and Mosaic |
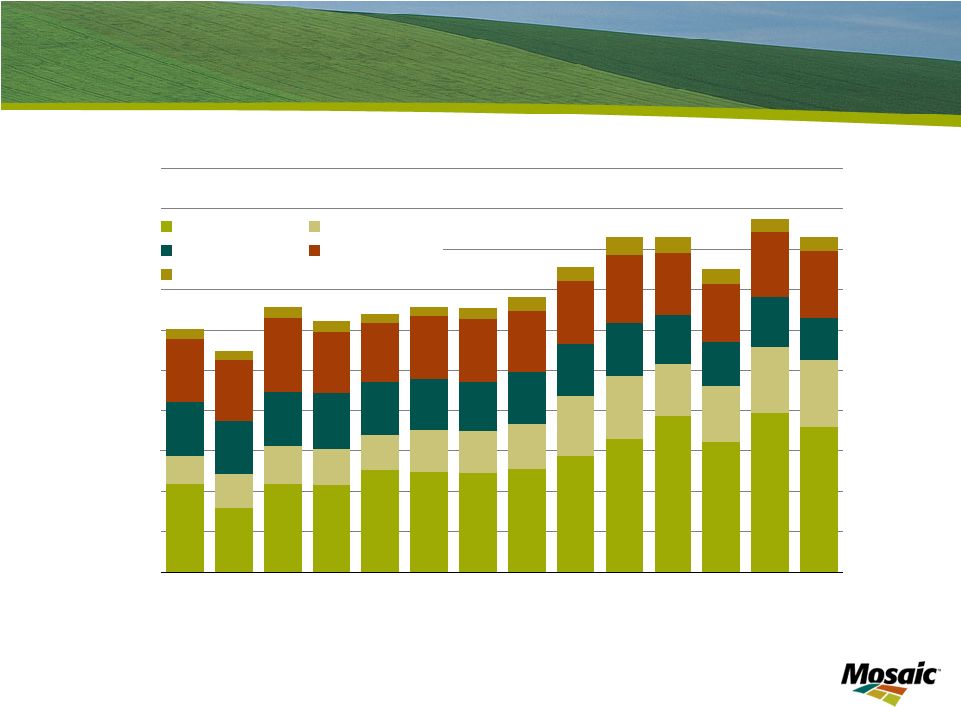
 Slide 27 Near term phosphate import demand outlook World Less China Phosphate Import Demand 0 5 10 15 20 25 95 96 97 98 99 00 01 02 03 04 05 06 07 08E Mil Tonnes DAP/MAP/TSP W Europe Asia Less China Oceania L America Other Source: Fertecon, IFA and Mosaic |
 Slide 28 Near term potash import demand outlook World MOP Import Demand 0 5 10 15 20 25 30 35 40 45 50 95 96 97 98 99 00 01 02 03 04 05 06 07 08E Mil Tonnes Asia Latin America West Europe US Other Source: Fertecon and Mosaic |
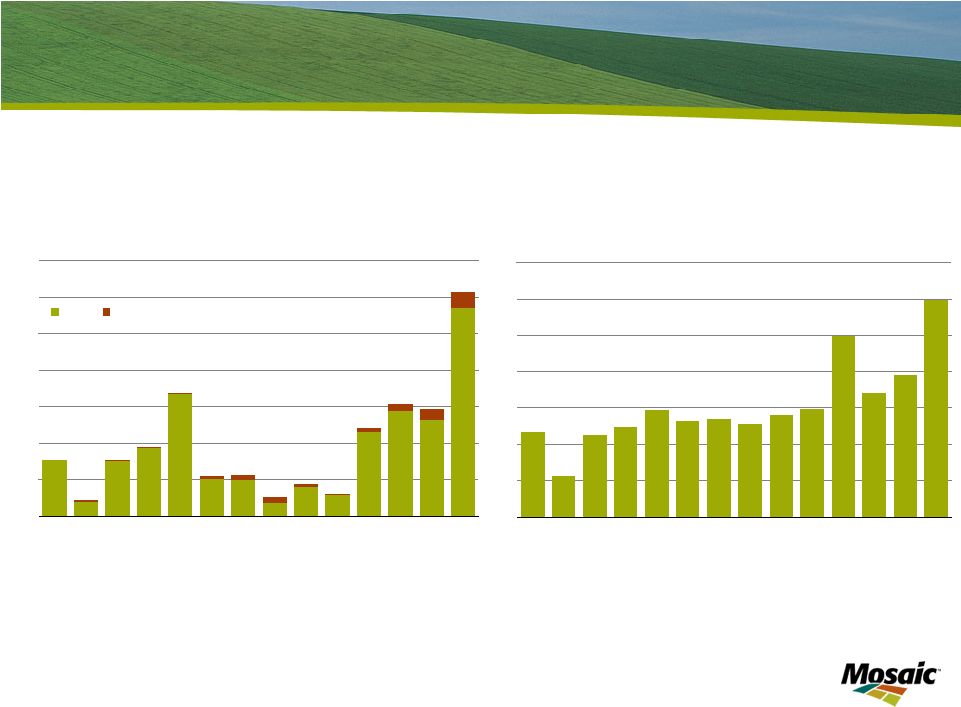 Slide 29 Indian demand outlook remains strong Indian subsidies insulate domestic farmers from higher crop nutrient costs India MOP Import Demand 0.0 1.0 2.0 3.0 4.0 5.0 6.0 7.0 95 96 97 98 99 00 01 02 03 04 05 06 07 08 Mil Tonnes Source: Fertecon and Mosaic India Processed Phosphate Import Demand 0.0 1.0 2.0 3.0 4.0 5.0 6.0 7.0 95 96 97 98 99 00 01 02 03 04 05 06 07 08 Mil Tonnes DAP MAP Source: Fertecon, IFA and Mosaic |
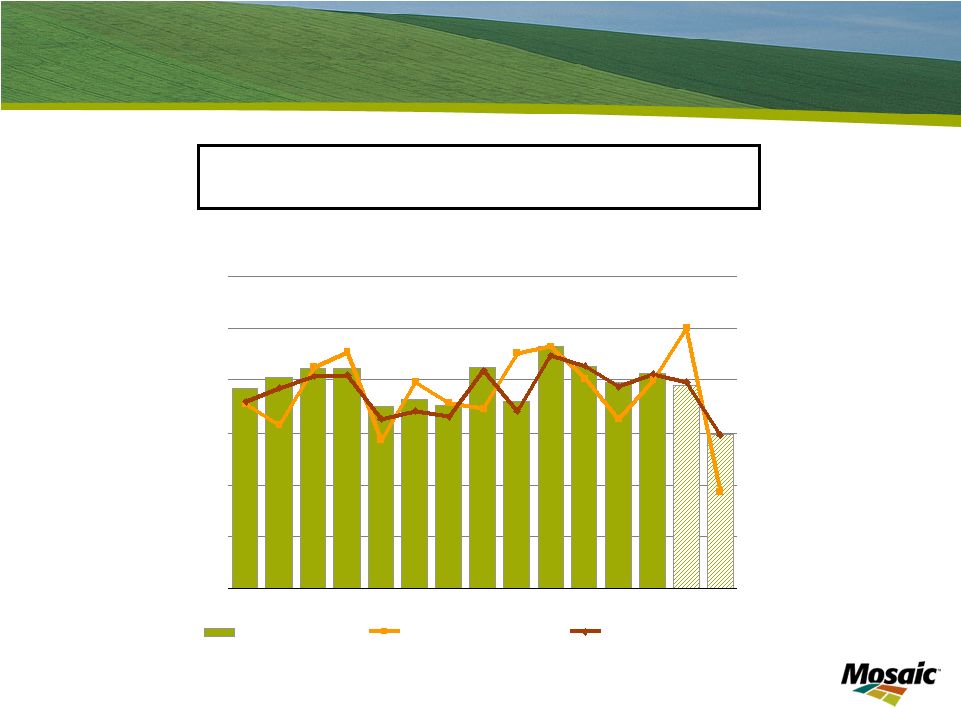
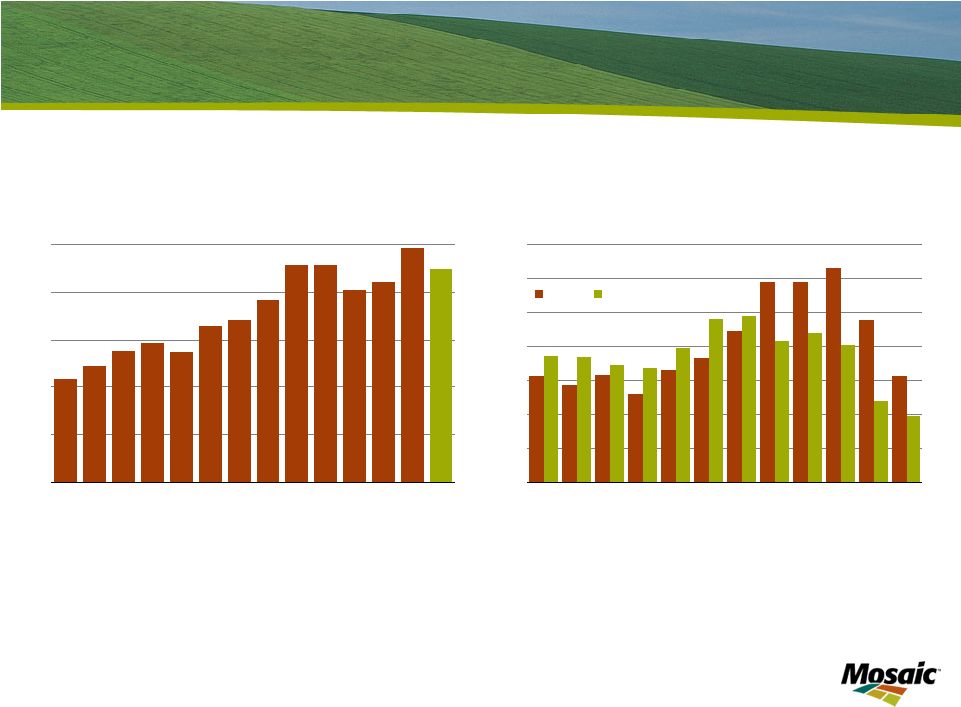 Slide 30 Brazilian demand outlook remains an issue Brazil Fertilizer Shipments 0 5 10 15 20 25 95 96 97 98 99 00 01 02 03 04 05 06 07 08 Mil Tonnes Source: ANDA and Mosaic Brazil Monthly Fertilizer Shipments 0.0 0.5 1.0 1.5 2.0 2.5 3.0 3.5 Jan Feb Mar Apr May Jun Jul Aug Sep Oct Nov Dec Mil Tonnes 2007 2008 Source: ANDA |
 Brazilian fertilizer shipments are estimated to have declined 9% to 22.3 million tonnes in 2008. That still would rank as the fourth highest usage on record. No recovery is expected at this point in 2009. In fact, use is forecast to decline to about 20 million tonnes in 2009 based on current crop prices, input costs and financial/credit conditions. However, continued improvement in crop prices, further adjustments in crop input costs and a loosening of credit later this year could improve demand prospects. |
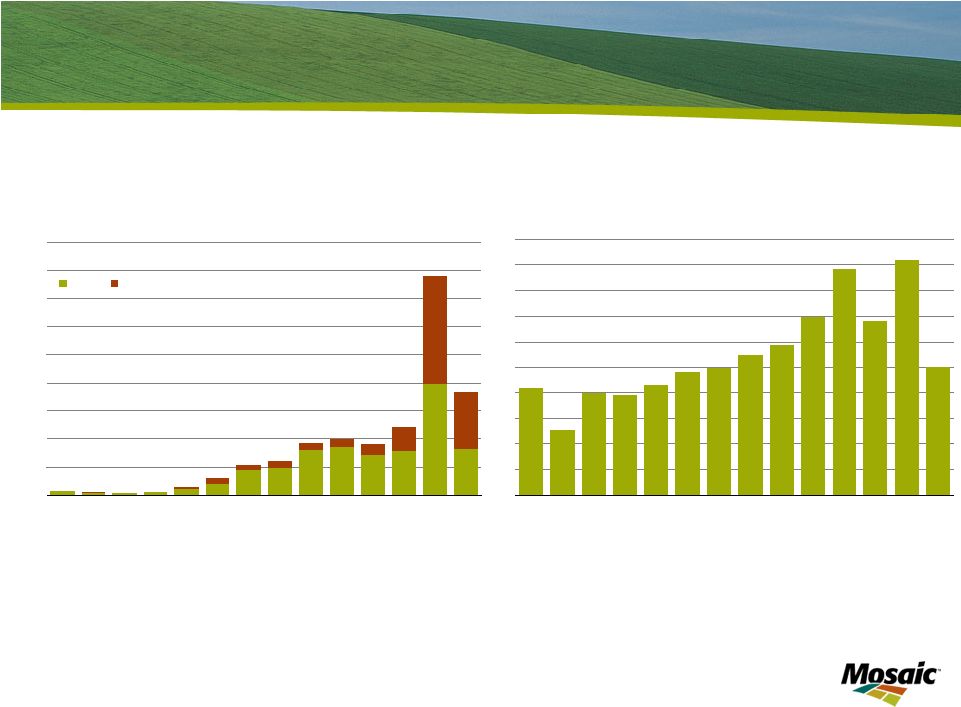 Slide 31 China remains the wild card Chinese export taxes and procurement strategies cause uncertainty China DAP and MAP Export Supply 0.0 0.5 1.0 1.5 2.0 2.5 3.0 3.5 4.0 4.5 95 96 97 98 99 00 01 02 03 04 05 06 07 08 Mil Tonnes DAP MAP Source: Fertecon, IFA, China Customs and Mosaic China MOP Import Demand 0 1 2 3 4 5 6 7 8 9 10 95 96 97 98 99 00 01 02 03 04 05 06 07 08 Mil Tonnes Source: Fertecon and Mosaic |
 Slide 32 Long Term Outlook • Solid long term nutrient demand outlook • Strong traditional demand drivers • Biofuels: a viable component of comprehensive energy policy • Demand growth requires significant supply increases • Limited capacity additions during the next few years • Relatively high prices required to attract capital/justify new projects • Escalating capital and operating costs • Significant economic and political risk in many regions • Key factors to watch • Stabilization and recovery of world financial markets • Global economic growth and the food demand story • Government policies • Commitments to biofuels initiatives • Chinese industrial and trade policies • Indian fertilizer subsidy • Economic development policies elsewhere |
 While near term prospects are beginning to improve, long term fundamentals remain intact and positive. First, the long term nutrient demand outlook remains rock solid due to strong traditional drivers as well as the growing demand for biofuels. Second, projected demand growth requires significant supply increases. Limited new phosphate and potash capacity will come on line during the next few years and relatively high prices are required to attract capital to the industry and justify new greenfield projects. Finally, crystal balls don’t work very well in predicting long term developments and there are a number of key factors to watch to assess the long term direction of crop nutrient markets. These include the stabilization and recovery of world financial markets, global economic growth and the food demand story as well as a host of government policies such as the commitment to biofuels initiatives and industrial, trade and subsidy policies in key countries. Let me conclude with a few comments about some of these long term drivers. |
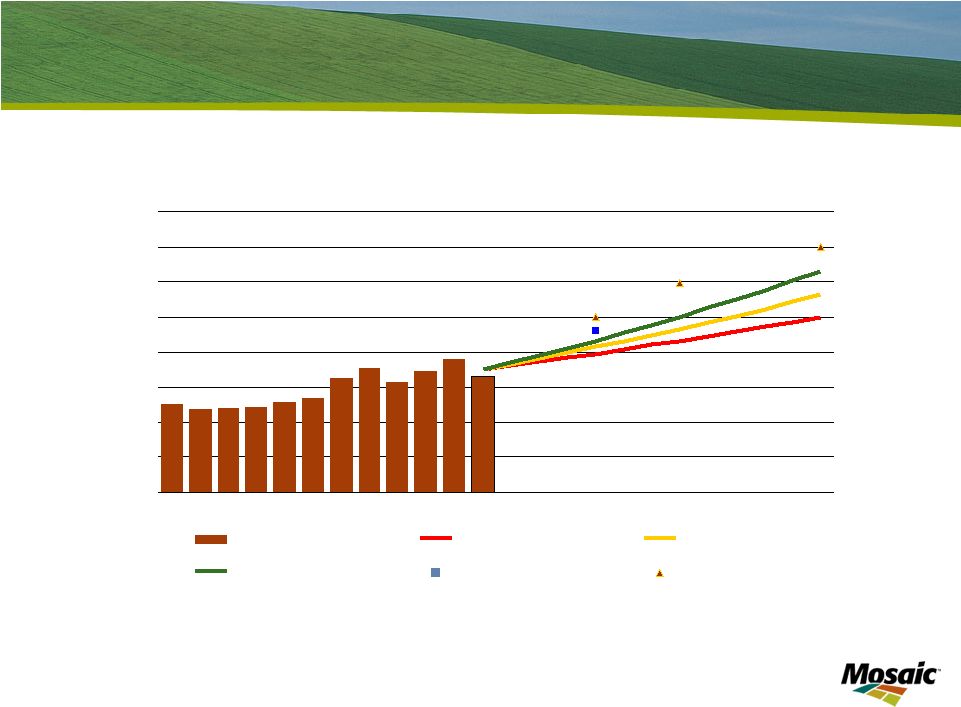
 Slide 33 The 500 million tonne challenge World Grain and Oilseed Use 1,000 1,250 1,500 1,750 2,000 2,250 2,500 2,750 3,000 3,250 80 85 90 95 00 05 10 15 20 Source: USDA and Mosaic Mil Tonnes Actual Actual for US Ethanol Forecast Forecast for U.S. Ethanol |
 We forecast that world grain and oilseed use will continue to increase at a faster pace than historical trends due to steady population growth, higher per capita incomes and further increases in biofuels production. We project that global grain and oilseed production will increase about 20% or more than 500 million tonnes between now and 2020. This chart also sheds some light on the impact of the current financial crisis on grain and oilseed demand. If you look closely at the graph, you will note that global grain and oilseed use has declined in only two years since 1980. And the decline in each of those years – namely the 1988/89 and the 1995/96 crop years – was largely the result of a poor harvest and a rise in prices needed to allocate short supplies to their highest valued uses. You will also notice that grain and oilseed use continued to increase during the severe global recession of the early 1980s. Real GDP per capita declined 0.7% in 1981 and another 1.4% in 1982, but global grain and oilseed use still registered steady increases during the most serious downturn of the global economy since the Great Depression |
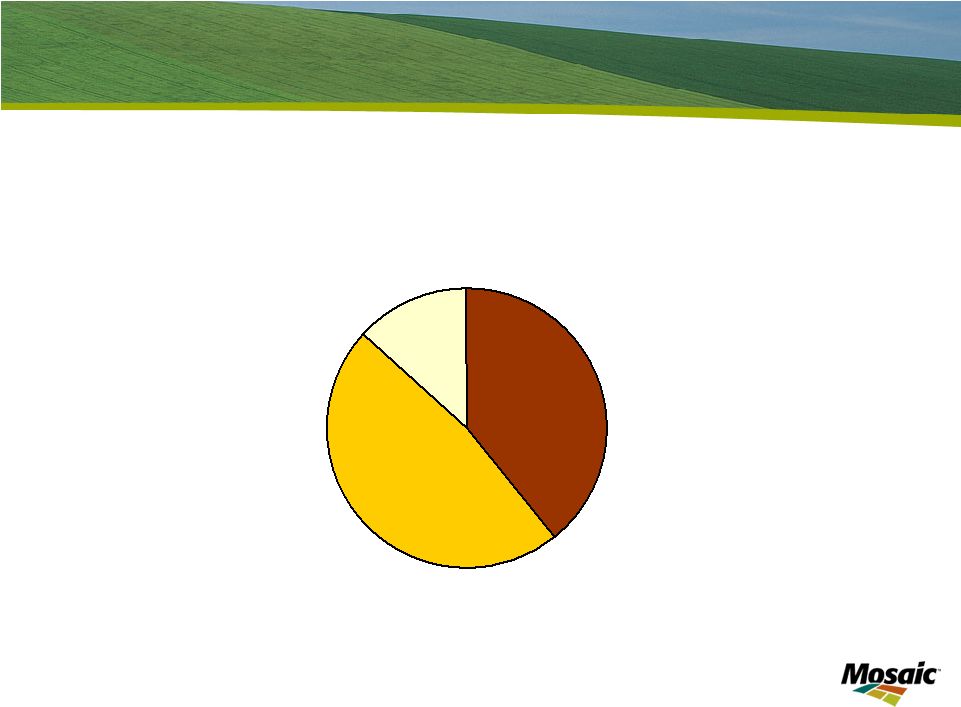 Slide 34 Grain and oilseed demand drivers Projected Sources of Grain and Oilseed Demand Growth 2008-2020 Income Growth 48% Biofuels 13% Population Growth 39% |
 These long term demand forecasts were derived from a model that predicts use based on population and real GDP per capita. The amount of corn ground into ethanol in the United States was excluded from the statistical analysis and then added back based on actual and future mandated use. This chart shows the drivers of grain and oilseed demand between 2008 and 2020. Our model projects that increases in population will account for about 39% of projected growth while increases in per capita GDP will account for 48% of the 500 million tonne increase in global grain and oilseed use between now and 2020. Biofuels is projected to account for the remaining 13% with most of that coming during the next few years. |
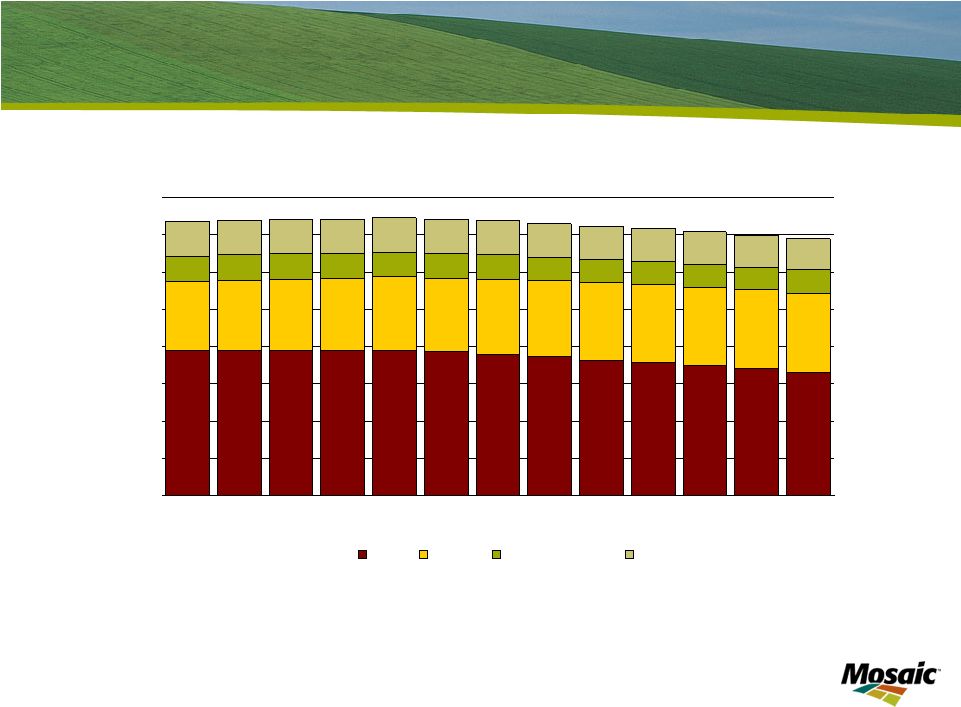 Slide 35 The world adds the equivalent of another Thailand and Laos to global population each year World Population Growth By Region 0 10 20 30 40 50 60 70 80 2008 2009 2010 2011 2012 2013 2014 2015 2016 2017 2018 2019 2020 Source: Global Insight Million Asia Africa Latin America Other |
 Let’s look at each of these drivers in more detail. Increases in population are steady and predictable. Global population is projected to increase from 6.6 billion today to 7.5 billion in 2020. The world sets the dinner table for 73 million more people each year. That is the equivalent of adding another Thailand and Laos to global population year after year. The increase in population alone boosts expected grain and oilseed demand about 18 million tonnes per year. Most models predict that population growth rates will slow due to economic and demographic factors. In fact, annual growth rates are projected to slow modestly from about 1.1% today to 0.9% in 2020, but that means the world still will add about 69 million people each year by the end of the forecast period. |
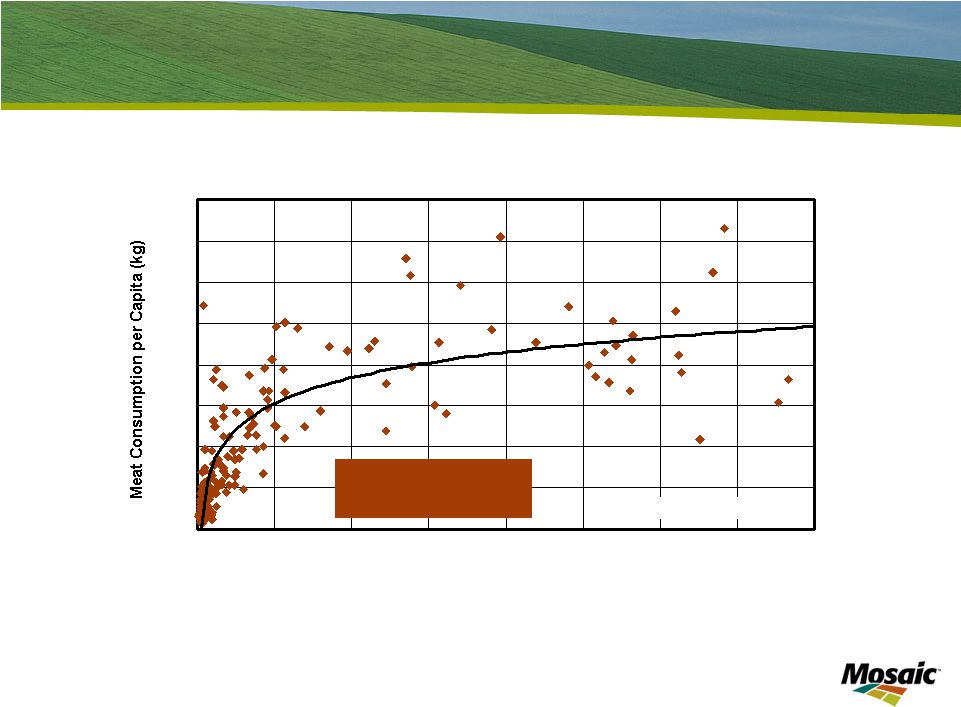 Slide 36 Driven by population and income growth Meat Consumption vs GDP (per capita in 2002) y = 17.913Ln(x) - 91.411 R² = 0.6745 0 20 40 60 80 100 120 140 160 0 5000 10000 15000 20000 25000 30000 35000 40000 Income per Capita (1997 US$) Source: FAO, Global Insight |
 You no doubt have seen a chart like this in most outlook presentations, but it illustrates a basic fact that people upgrade diets to more protein-rich and grain intensive foods as incomes increase. |
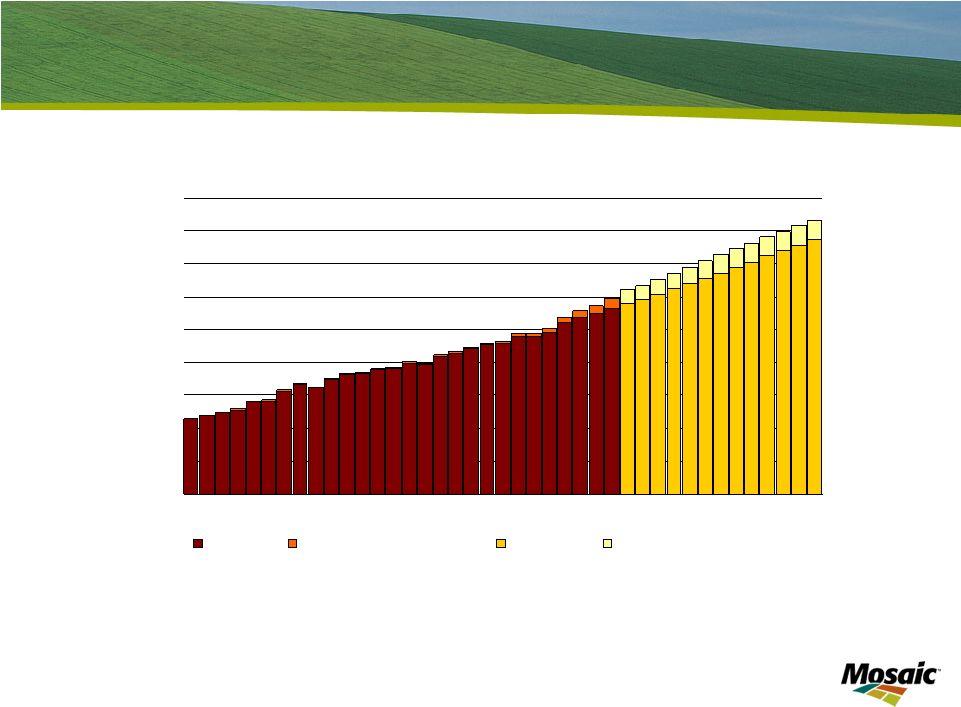
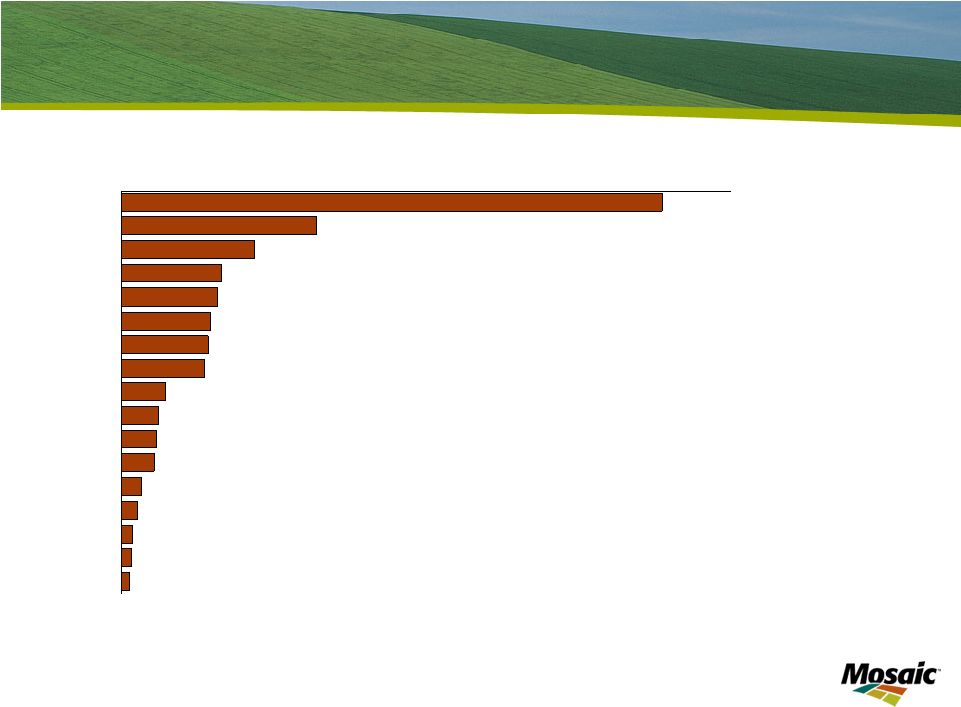 Slide 37 Driven by population and income growth UAE 44.4 Brazil 16.1 Mexico 10.9 Russia 8.3 Australia 7.9 USA 7.4 Argentina 7.2 S Korea 3.7 EU27 3.1 Vietnam 2.9 China 2.7 Japan 1.6 India 1.4 Indonesia 0.9 Philippines 0.9 Thailand 0.6 Malaysia 6.9 0 10 20 30 40 50 kg per capita Change in Per Capita Broiler Consumption 1997 - 2007 Source: USDA and Global Insight |
 A specific example may drive home this point. This chart shows the change in per capita broiler consumption in 17 countries during the last 10 years. Many developing countries such as the big three Latin American countries registered impressive gains. Other gains may look modest, but the impact of the three most populous developing countries in the world – namely China, India and Indonesia – increasing broiler consumption 2.7, 1.4 and 0.9 kilograms per person during the last 10 years is significant. Annual broiler consumption in these three countries today is 70% or almost 6.0 million tonnes greater today than 10 years ago. |
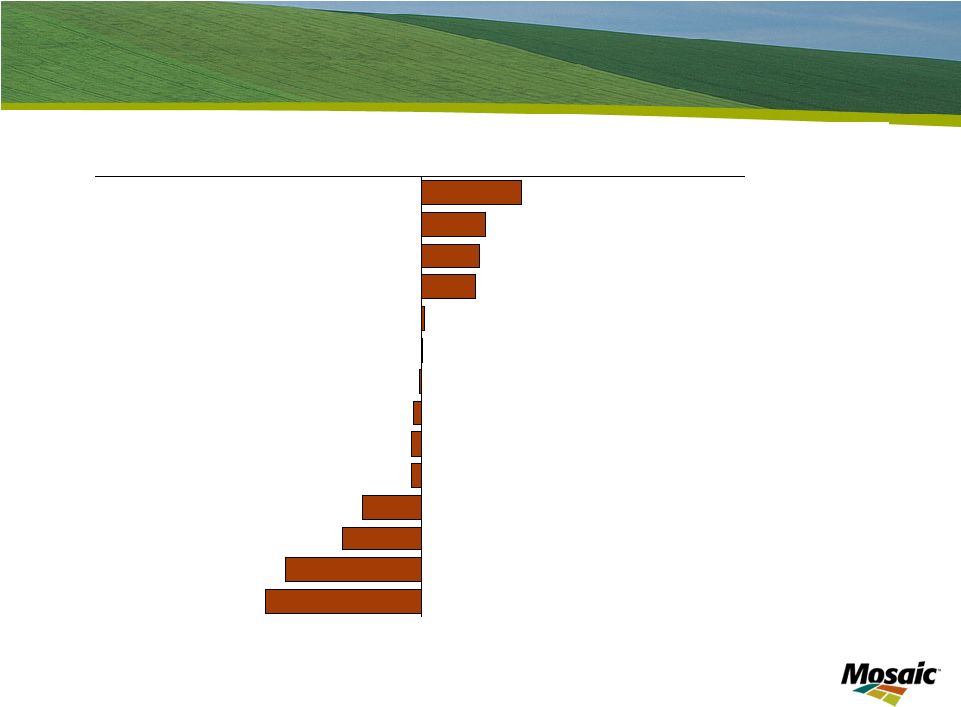 Slide 38 Large gains have occurred during the last 10 years in many large developing countries China 9.3 Brazil 6.1 Mexico 5.4 India 5.1 Indonesia 0.4 USA 0.2 Australia -0.8 Malaysia -0.9 Japan -5.3 EU27 -7.2 Russia -12.5 Argentina -14.3 Philippines -0.1 Thailand -0.6 -30 -20 -10 0 10 20 30 kg per capita Change in Per Capita Dairy Consumption 1997 - 2007 Source: USDA and Global Insight |
 Meat obviously is not the only way to upgrade one’s diet. People also consume more fish, eggs and dairy products as incomes increase. This chart shows the change in per capita consumption of dairy products for 14 countries during the last 10 years. Consumption of dairy products is on the rise in many of the large and rapidly developing countries around the world. Consumption of dairy products has increased more than 9 kilograms per person in China and more than 5 kilograms per person in India during the last 10 years. That is impressive. |
 Slide 39 Biofuels – a viable component of energy policy • Long term viability • Bullish oil fundamentals • Strong demand outlook (same as food story) • Uncertainties about new supplies • Continued or faster agricultural productivity gains from biotechnology • U.S. Energy Independence and Security Act of 2007 • Biofuels mandates (RFS) • Conventional biofuels (ethanol from corn) • 2009: 10.5 billion gallons • 2015: 15.0 billion gallons • Advanced biofuels (all other forms) • 2009: 600 million gallons (500 million biodiesel, 100 million UAB) • 2022: 21.0 billion gallons (16 billion cellulosic, 5 billion UAD) |
 Biofuels also is an important demand driver. Biofuels has passionate proponents and opponents and likely will remain a controversial issue. Our view is that biofuels is a viable component of energy policy. That assessment is based on a combination of bullish oil fundamentals and expectations of large yield increases for major grain and oilseed crops as a result of biotech varieties in the R&D pipeline. Our assessment is that long term oil fundamentals remain bullish due to a strong demand outlook (that is the same story as the food story) as well as uncertainties about new petroleum supplies. We also expect large gains in agricultural productivity from biotech developments. The leading seed corn company is on a mission to double corn yields by 2030 and the second largest company indicates that they expect to increase corn yields 40% by 2018 with products in their R&D pipeline. The U.S. Energy Independence and Security Act of 2007 mandates the use of 10.5 billion gallons of corn based ethanol this year and that mandate increases to 15 billion by 2015. Our assessment is the industry will meet those mandates. |
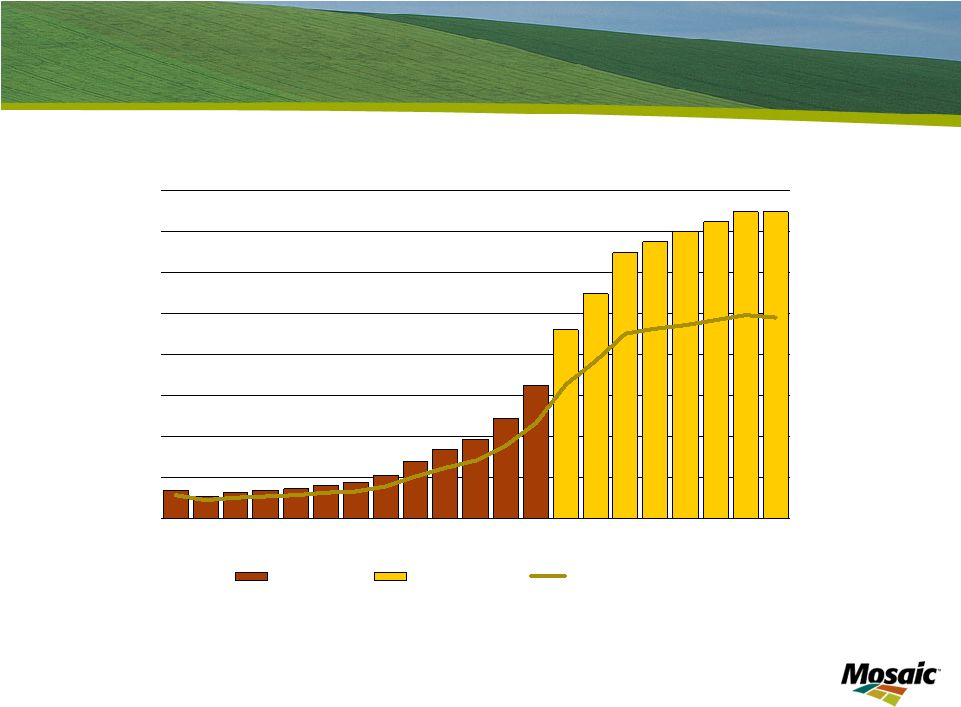 Slide 40 U.S. ethanol – significant part of gas supply U.S. Ethanol Production 0 2 4 6 8 10 12 14 16 95 96 97 98 99 00 01 02 03 04 05 06 07 08 09 10 11 12 13 14 15 Source: EIA and Mosaic Bil Gal 0% 2% 4% 6% 8% 10% 12% 14% 16% Percent Actual Forecast Percent of Gasoline Use |
 We estimate that U.S. ethanol production totaled about 9.2 billion gallons in 2008. Ethanol currently accounts for 6% of U.S. gasoline supplies and is projected to account for about 10% of supplies by 2015. Ethanol is a significant part of U.S. gasoline supplies. By comparison, electricity generated from wind turbines accounted for 0.8% of U.S. electricity supplies in 2007. |
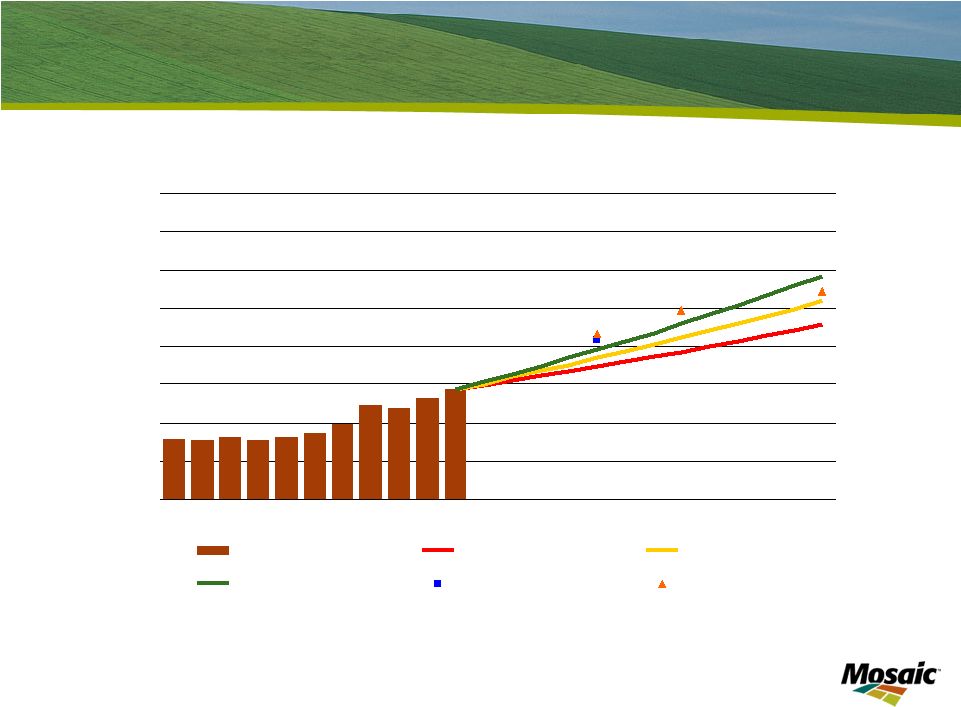 Slide 41 Solid long term phosphate demand prospects 2.5% CAGR 1.5% CAGR 2.0% CAGR World Phosphate Demand Forecast 25 30 35 40 45 50 55 60 65 97 98 99 00 01 02 03 04 05 06 07 08 09 10 11 12 13 14 15 16 17 18 19 20 Mil Tonnes P 2 O 5 Actual Low Growth Medium Growth High Growth IFA Fertecon Source: IFA , Fertecon and Mosaic |
 Based on these drivers, we see solid long term demand growth for both phosphate and potash. Global phosphate use totaled 39.3 million tonnes P2O5 in 2007, according to the latest estimates from the International Fertilizer Industry Association. The lines show potential demand for 1.5%, 2.0% and 2.5% compound annual growth rates. Forecasts from IFA for 2012 and from Fertecon for 2012, 2015 and 2020 also are plotted on the chart. Our assessment is that global phosphate demand will grow in the 2.0% to 2.5% range during this period. |
 Slide 42 Significant additional supply is required to meet projected phosphate demand Rock Required to Meet Phosphate Demand Growth 2008-20 Actual 2008-20 Growth Scenario Million Tonnes 97-07 97-02 02-07 Low Medium High Crop Nutrient Demand Growth (P O ) 6.0 0.4 5.6 7.5 10.3 13.2 Crop Nutrient Demand Growth (CAGR) 1.7% 0.3% 3.1% 1.5% 2.0% 2.5% Other Demand Growth (P 2 O 5 ) 0.65 0.32 0.33 0.7 0.8 0.9 Additional Rock Requirement 24.6 2.8 21.8 30.2 40.8 52.0 Actual Change in Rock Production 34.9 13.3 21.6 na na na Assumes 66% BPL rock and 90% recovery rates Source: IFA, Fertecon and Mosaic 2 5 |
 This chart shows that global phosphate demand increased 1.7% per year from 1997 to 2007. However, growth differed significant between the first five years and the second five years of this period. Based on a medium demand growth scenario, 41 million tonnes of additional rock production are required to meet projected demand. That increases to 52 million in the high demand growth scenario. |
 Slide 43 Solid long term potash demand prospects 3.50% CAGR 2.00% CAGR 2.75% CAGR World Potash Demand Forecast 10 15 20 25 30 35 40 45 50 97 98 99 00 01 02 03 04 05 06 07 08 09 10 11 12 13 14 15 16 17 18 19 20 Mil Tonnes K 2 O Actual Low Growth Medium Growth High Growth IFA Fertecon Source: IFA, Fertecon and Mosaic |
 Global potash use totaled 28.9 million tonnes K2O in 2007, according to the latest IFA estimates. The lines show potential demand for 2.0%, 2.5% and 3.0% compound annual growth rates. Forecasts from IFA for 2012 and from Fertecon for 2012, 2015 and 2020 also are plotted on the chart. Again, our assessment is that global potash use will increase 2.5% to 3.0% during this period. |
 Slide 44 Significant additional supply required to meet projected potash demand MOP Required to Meet Potash Demand Growth 2008-20 Actual 2008-20 Growth Scenario Million Tonnes 97-07 97-02 02-07 Low Medium High Crop Nutrient Demand Growth (K2O) 6.5 0.9 5.5 8.4 10.6 14.1 Crop Nutrient Demand Growth (CAGR) 2.6% 0.8% 4.3% 2.0% 2.8% 3.5% Other Demand Growth (K2O) 0.8 0.4 0.4 0.7 0.8 0.9 Additional MOP Requirement (KCL) 11.8 2.2 9.7 14.7 18.4 24.2 Actual Change in MOP Production (KCL) 14.2 2.3 11.9 na na na Assumes MOP supplies 97% of potash demand growth Source: IFA, Fertecon and Mosaic |
 This chart shows that global potash use increased 2.6% per year from 1997 to 2007. Growth rates again differed significant between the first five years and the second five years of this period. Based on a medium demand growth scenario, more than 18 million tonnes of additional MOP production is required to meet projected demand in 2020. That increases to 24 million tonnes in the high demand growth scenario. |
 Slide 45 Take-Aways • Current Situation • Crop nutrient markets recalibrate based on lower energy, raw materials and crop prices • Inventory valuation risk along the entire supply chain • Near Term Outlook • Another record crop is required in 2009 • Improving demand prospects: deferral vs. destruction? • Significant declines in production worldwide • Long Term Outlook • Solid demand fundamentals • Significant new supplies required to meet projected demand |
 Dr. Michael Rahm Vice President Market Analysis and Strategic Planning BofA-Merrill Lynch Investor Visit Plymouth, MN March 5, 2009 Thank You! Phosphate and Potash Outlook |