 Credit Suisse 14th Annual Global Ag Productivity Conference Jim Prokopanko, President and Chief Executive Officer March 10, 2009 Exhibit 99.1 |
Good afternoon, everyone. Thank you all for attending. I’d like to thank Elaine Yip at Credit Suisse for giving me this opportunity to meet with you. I’ll be sharing the Mosaic story and perspective about what is ahead for crop nutrition and agriculture. |
 Slide 2 Safe Harbor Statement This presentation contains forward-looking statements within the meaning of the Private Securities Litigation Reform Act of 1995. Such statements include, but are not limited to, statements about future financial and operating results. Such statements are based upon the current beliefs and expectations of The Mosaic Company’s management and are subject to significant risks and uncertainties. These risks and uncertainties include but are not limited to the predictability and volatility of, and customer expectations about, agriculture, fertilizer, raw material, energy and transportation markets that are subject to competitive and other pressures and the effects of the current economic and financial turmoil; the build-up of inventories in the distribution channels for crop nutrients; changes in foreign currency and exchange rates; international trade risks; changes in government policy; changes in environmental and other governmental regulation; adverse weather conditions affecting operations in Central Florida or the Gulf Coast of the United States, including potential hurricanes or excess rainfall; actual costs of asset retirement, environmental remediation, reclamation or other environmental regulation differing from management’s current estimates; accidents and other disruptions involving Mosaic’s operations, including brine inflows at its Esterhazy, Saskatchewan potash mine and other potential mine fires, floods, explosions, seismic events or releases of hazardous or volatile chemicals, as well as other risks and uncertainties reported from time to time in The Mosaic Company’s reports filed with the Securities and Exchange Commission. Actual results may differ from those set forth in the forward-looking statements. |
Before I proceed, I need to remind you that our presentation contains forward-looking statements. The remarks I make are based on information and understandings we believe to be accurate as of today’s date – March 10, 2009. Actual results are likely to differ from those set forth in the forward- looking statements. |
 Slide 3 Strategic Focus Deliver value for shareholders Focus on Potash and Phosphate •Grow Potash •Strengthen Phosphate Optimize Offshore distribution Maintain a strong balance sheet |
We are confident in Mosaic’s long-term outlook, despite the market disruptions we’ve all been experiencing. Agriculture fundamentals remain solid because of the continued global demand for food, fuel and feed. Mosaic is well-positioned to capitalize on these conditions with our vertically integrated operations and our strong balance sheet and global presence. Our company serves a vital role in helping the world grow the food it needs. Today I will review Mosaic’s performance drivers, provide an update by business segment, and share our outlook on the crop nutrition industry. By focusing on key strategic priorities in our potash and phosphates businesses we will produce outstanding results for shareholders. Our goals are focused on growth strategies. We will grow our potash business through previously announced expansions, and plan to grow opportunistically in phosphates. In Mosaic’s Offshore segment, we are exploring initiatives that will enhance the company’s presence in key growth regions around the world. These strategies are well underway -- supported by a strong balance sheet. |
 Slide 4 Positioned for Significant Growth Capitalizing on improved long-term fundamentals Generated strong cash flow, reduced debt & achieved investment grade status Executing on Mosaic strategy An Industry Leader Emerges – An Industry Leader Emerges – Prepared for Long-Term Growth… Prepared for Long-Term Growth… As Well as the Near-Term Downturn As Well as the Near-Term Downturn |
Mosaic is taking the steps necessary to capitalize on attractive long-term agriculture fundamentals. We take pride in our strong cash generation which allowed us to pay down a significant amount of debt – and achieve investment grade status -- long before many thought possible. We’ve developed a robust, value-creating strategic plan and are executing against it. Mosaic has emerged as an industry leader with the goal of becoming the very best company in the crop nutrition industry. This means focusing on generating top-tier shareholder value. |
 Slide 5 Maintain balance sheet strength Focus on phosphate margins – not prices Reduce production to avoid excessive inventory build-up Focus on operational discipline and risk management Fiscal 2009 – A Challenging Year |
Although market conditions remain soft, we’re committed to maintaining a highly disciplined approach to managing our business. The benefits of a strengthened balance sheet and a large cash position are obvious -- providing us with significant financial flexibility. In the phosphate business, we will maximize margins – and I want to remind investors that while DAP prices have fallen, raw material costs have also plummeted – setting up a win-win situation for buyers and producers. We’ve also reduced Mosaic’s production levels to limit the build-up of excessive inventories. Finally, our ongoing focus on operational discipline and risk management is being enhanced as we limit excessive inventories and manage other risks in a time of historic volatility. |
 Slide 6 Value Creation – Cash Flow Drivers Sales: volume, price, business mix Operating margin: costs & expenses Working capital: receivables, inventory & payables Cash taxes Capital expenditures Capital structure Supported By Supported By Strong Governance & Controls Strong Governance & Controls |
Mosaic is positioned financially, strategically and operationally to serve customers worldwide and execute on the strong, long-term fundamentals of the agricultural sector. We are well positioned to create value for you, our shareholders. Ultimately that means cash, and listed here are the levers we can pull to generate cash in years to come. It starts with revenue, which is a function of price, volume, and product mix, and continues with operating margin. Efficient use of working capital is another cash flow driver, as are the taxes we pay. Operating cash flow is used to fund capital expenditures, with remaining cash used for liquidity and strategic purposes, as well as funding shareholder distributions. We support these cash flow dynamics with an appropriate capital structure, and ensure we have strong governance practices and controls in place. |
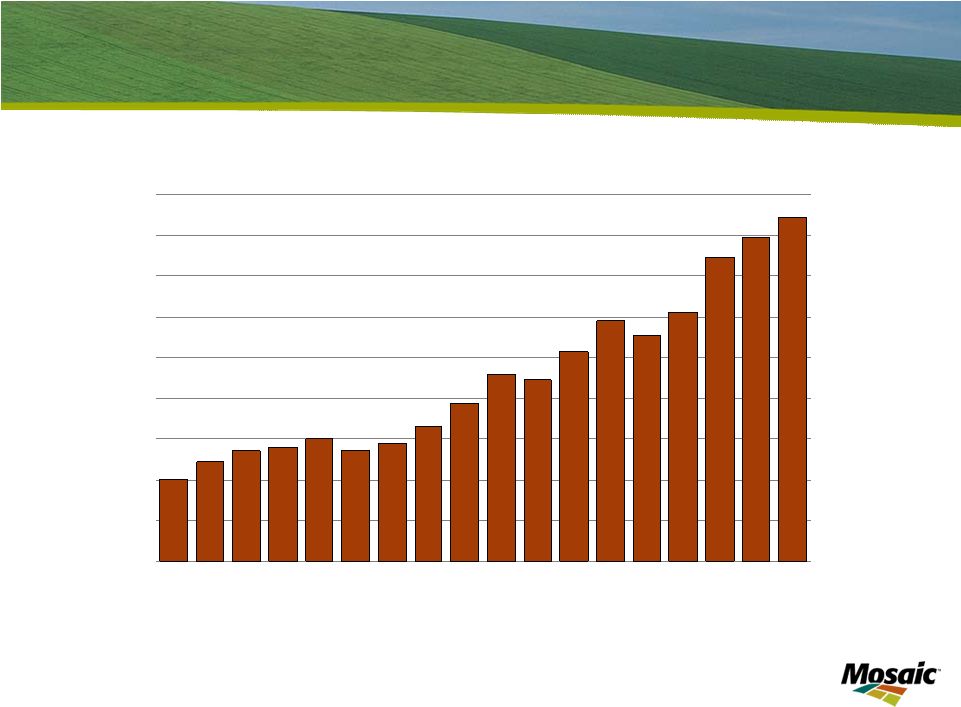
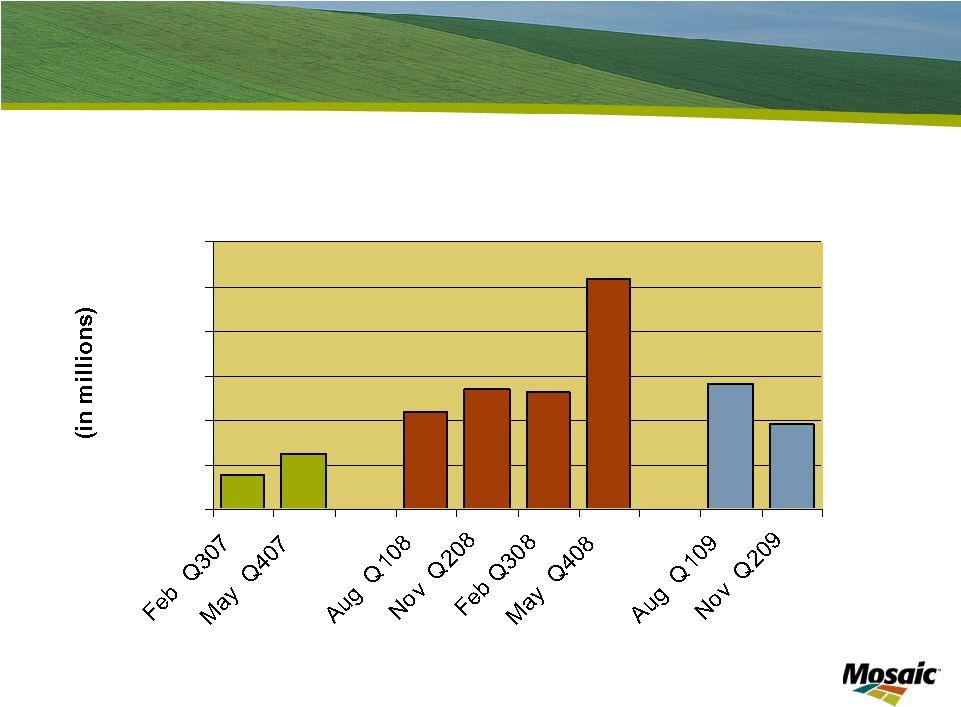 Cash Flow from Operations Cash Provided by Operating Activities $0 $200 $400 $600 $800 $1,000 $1,200 |
These value drivers work together to produce operating cash flow. Our track record on this front has been excellent, though results have been less robust this fiscal year, especially in the second half. Longer term, however, cash generation potential is substantial. We’ve built a large cash balance even as we paid off more than a billion dollars of debt. This de-leveraging has been a critical part of our financial strategy, giving us greater financial flexibility and strengthening our ability to weather the current downturn . |
 Slide 8 Cash Allocation Priorities Invest to maintain/grow existing business • Growing proportion of growth/opportunity projects • Disciplined capital allocation process Maintain liquidity buffer • To protect against cyclical downturn • To allow pursuit of strategic opportunities Shareholder distributions • Modest annual dividend • Potential additional distributions of excess cash longer-term |
We’ll use the operating cash flow we generate to grow the business through internal investments, following a highly disciplined review and approval process for making these investments. We maintain a large liquidity buffer, which may be used in part to fund strategic opportunities that arise. Mosaic distributes cash to shareholders through our annual regular dividend and, potentially, through additional distributions longer-term – in amounts, forms, and at a time yet to be determined. |
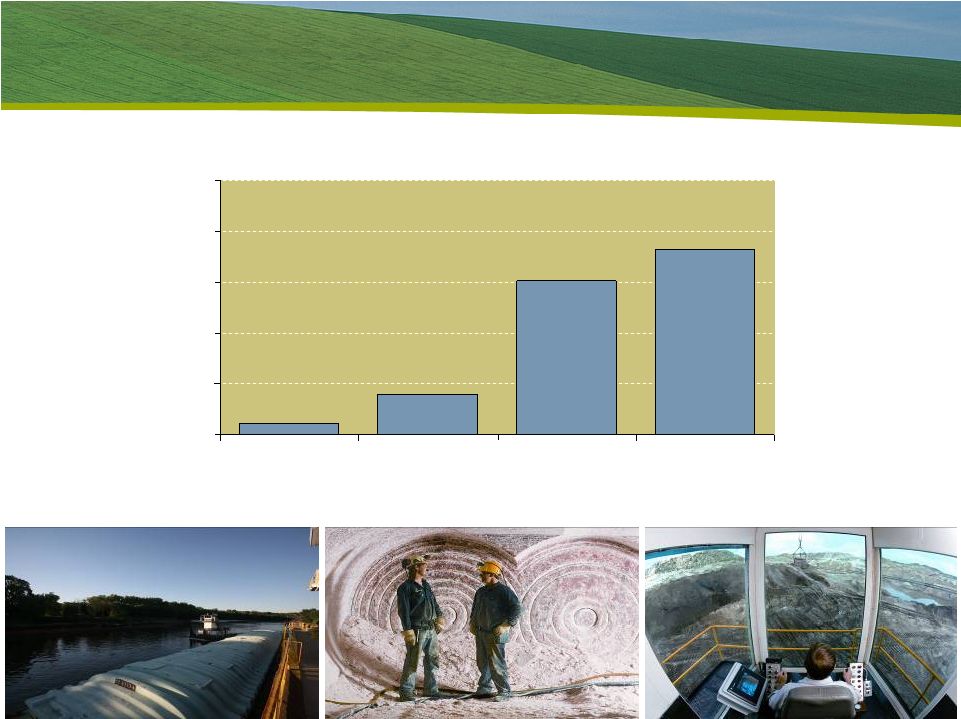 2.3% 8.0% 30.2% 36.5% 0.0% 10.0% 20.0% 30.0% 40.0% 50.0% FY06 FY07 FY08 12 Mos Nov08 Return on Invested Capital |
We drive a strong return on capital when we maximize the cash flow drivers I described a few minutes ago. Here you see the strong results we have achieved with invested capital. Next I’ll spend a few moments reviewing each of our business segments. |
 Value Driver: Potash Revenue Potash Sales Volume - 2.0 4.0 6.0 8.0 FY2006 FY2007 FY2008 MOP Price $0 $100 $200 $300 $400 $500 $600 FY2006 FY2007 FY2008 Q1 FY09 Q2 FY09 Annual Quarterly |
This slide highlights the price and volume trends for our potash business -- over the past few years as well as the last two quarters. The price momentum in this business has been very strong until recent months, when sales demand came to a halt. Until this fiscal year, we’ve captured steady growth in potash volume. We expect volume to decline this fiscal year due to weak demand. Longer term, we expect steady growth in potash volume due to expansion plans and the increasing demand for potash globally. |
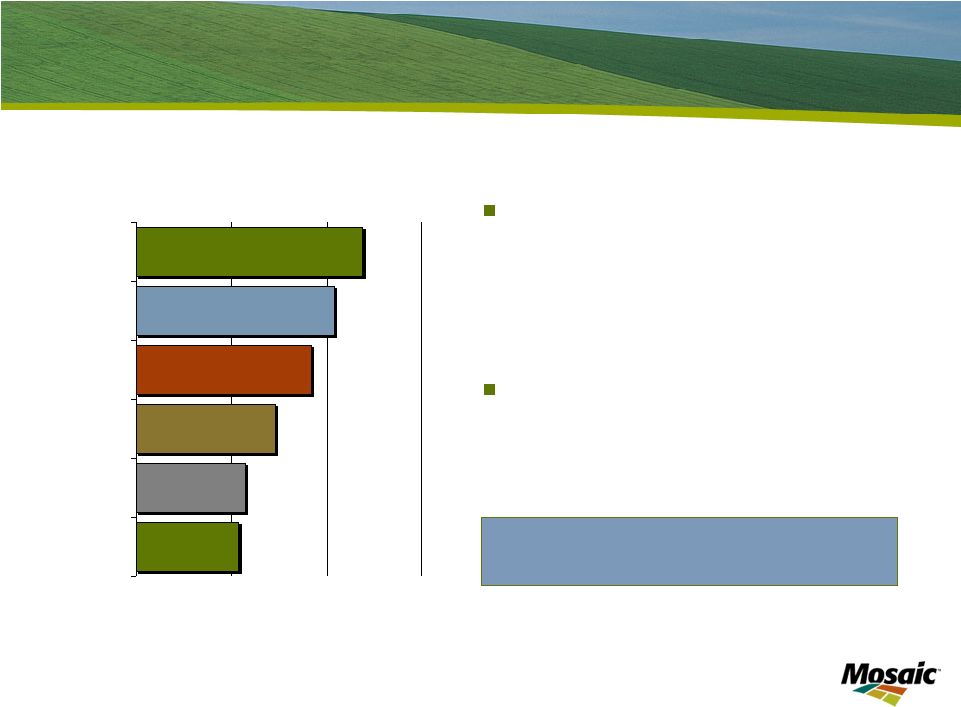 Slide 11 Leading Global Potash Producer Mosaic potash production • 14% Global • 38% U.S. • Five mines Low-cost & competitive industry position World capacity approximates 73 million tonnes (all potash products) 0 5 10 15 PotashCorp Mosaic Belaruskali Kali & Salz Silvinit Uralkali Million tonnes product •Potash Fertilizer Capacity Source: Fertecon / Mosaic |
Mosaic is one of the world’s top producers of potash with an estimated 14% of global market share. This is significant because potash is produced in only 12 countries in the world, with agricultural giants such as China, India and Brazil all dependent on imports. |
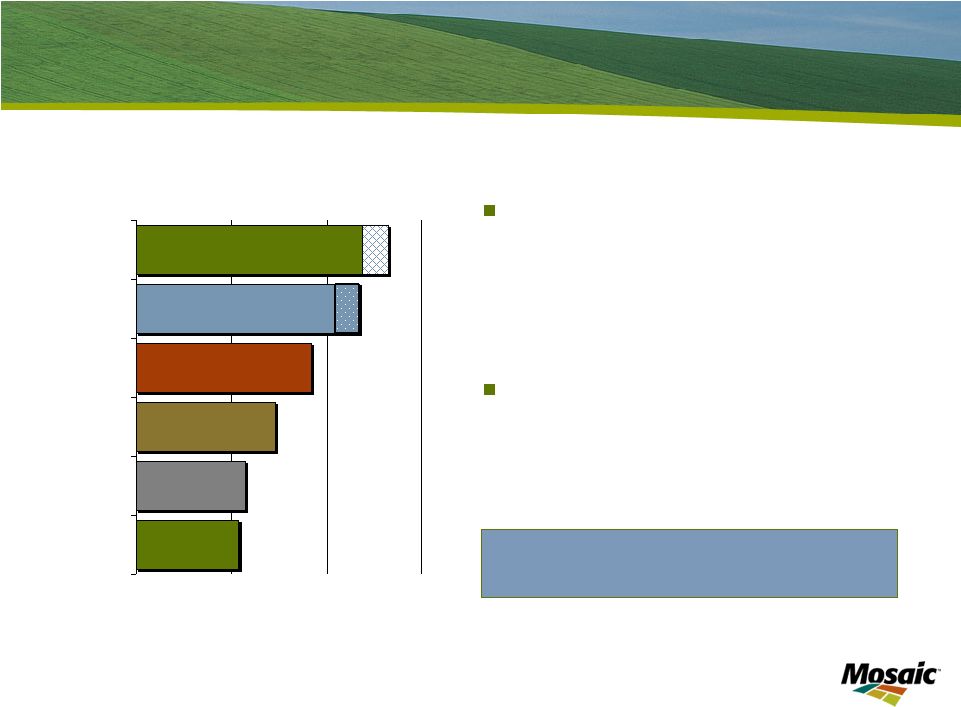 Slide 12 Leading Global Potash Producer Mosaic potash production • 14% Global • 38% U.S. • Five mines Low-cost & competitive industry position World capacity approximates 73 million tonnes (all potash products) 0 5 10 15 PotashCorp Mosaic Belaruskali Kali & Salz Silvinit Uralkali Million tonnes product Source: Fertecon / Mosaic •Potash Fertilizer Capacity |
And with the imminent reversion to us of 1.3 million tonnes – currently produced for a competitor under a tolling agreement -- our capacity improves both in size and in scale. We estimate this tonnage will revert to us in the fourth quarter of fiscal 2010. Because of historically low application rates in developing countries, potash has been enjoying strong demand in key growth regions -- where its nutritional value is more critical than ever in optimizing crop yields and increasing food production. With these dynamics, it’s not surprising that the Mosaic Potash business is an exceptional performer, contributing strong margins and cash flow. |
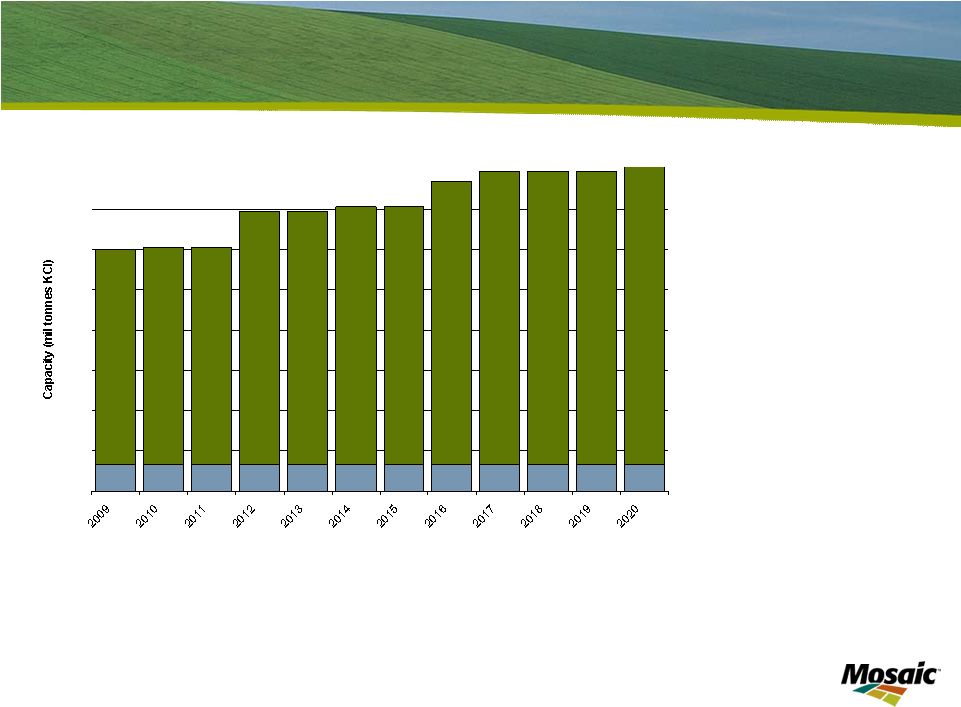 Slide 13 Growth Opportunities - Our Potash Expansions - 2 4 6 8 10 12 14 16 * The projected annual capacity includes approximately 1.3 million tonnes (as shaded in blue) that we currently produce under a third party tolling agreement at Esterhazy. We estimate this capacity will revert to Mosaic in the fourth quarter of fiscal 2010, based upon our calculations and assumptions. Growth from 10.4 to 16.8* million tonnes |
One of the value drivers for potash is the capacity expansions at existing Saskatchewan mines. These expansions are expected to increase Mosaic's annual capacity by over five million tonnes, ensuring we maintain the position as one of the premier potash companies in the world. Equally important, we’re making these investments at an estimated average capital cost significantly lower than for greenfield projects. The recent collapse in the capital markets makes it ever more challenging to build and finance cost-effective greenfield projects. Our plans for multi-staged projects allow us to adjust spending and timing to meet market demand and to optimize the use of cash. This is a valuable attribute in a cyclical industry like ours. |
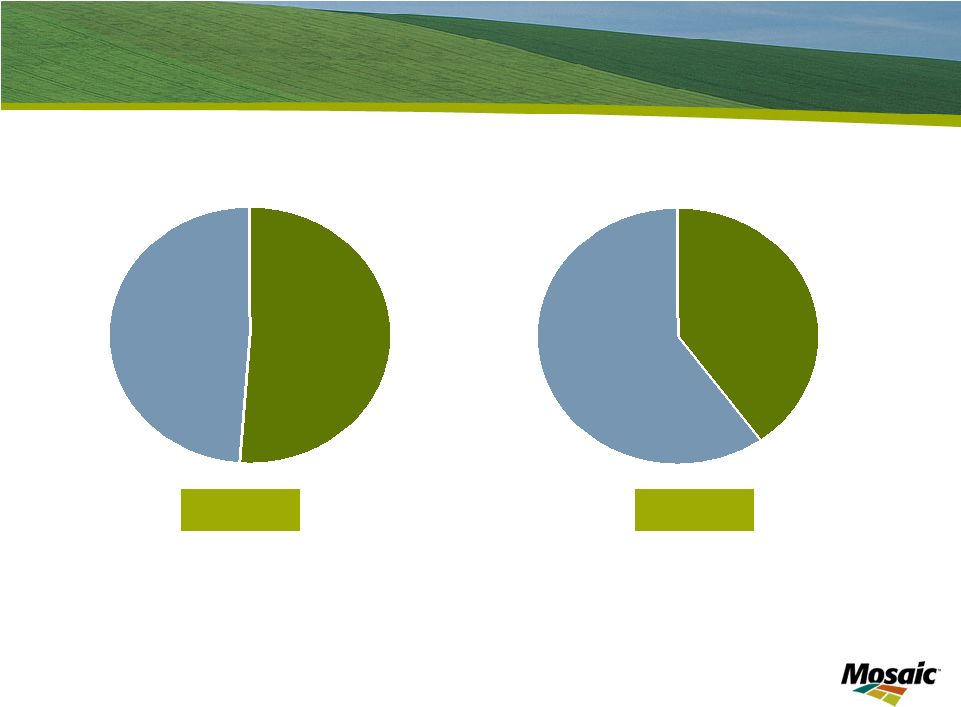 Slide 14 Shift in Business Mix (sales tonnes) Present Future Potash 49% Phosphates 51% Potash 60% Phosphates 40% |
Mosaic’s business mix will shift in coming years in favor of potash. We’re already a bigger potash player than most people realize, and intend to drive this business to a greater share of our total volume in years to come. This will start happening soon, and should have favorable valuation consequences. |
 Value Driver: Phosphates Revenue Phosphate Sales Volume - 2.0 4.0 6.0 8.0 10.0 FY2006 FY2007 FY2008 DAP Price $0 $200 $400 $600 $800 $1,000 $1,200 FY2006 FY2007 FY2008 Q1 FY09 Q2 FY09 Annual Quarterly |
Turning to our Phosphate business, price momentum had been strong here as well – until it came to an abrupt halt and then -- reversal in the past few months. The supply and demand factors that I’ll speak about shortly will establish where prices settle and how they move from there. Volume will be down sharply this year due to slow demand and substantially reduced production. Longer term, we are looking to sustain annual sales volumes in the 9 to 9.5 million tonne range. |
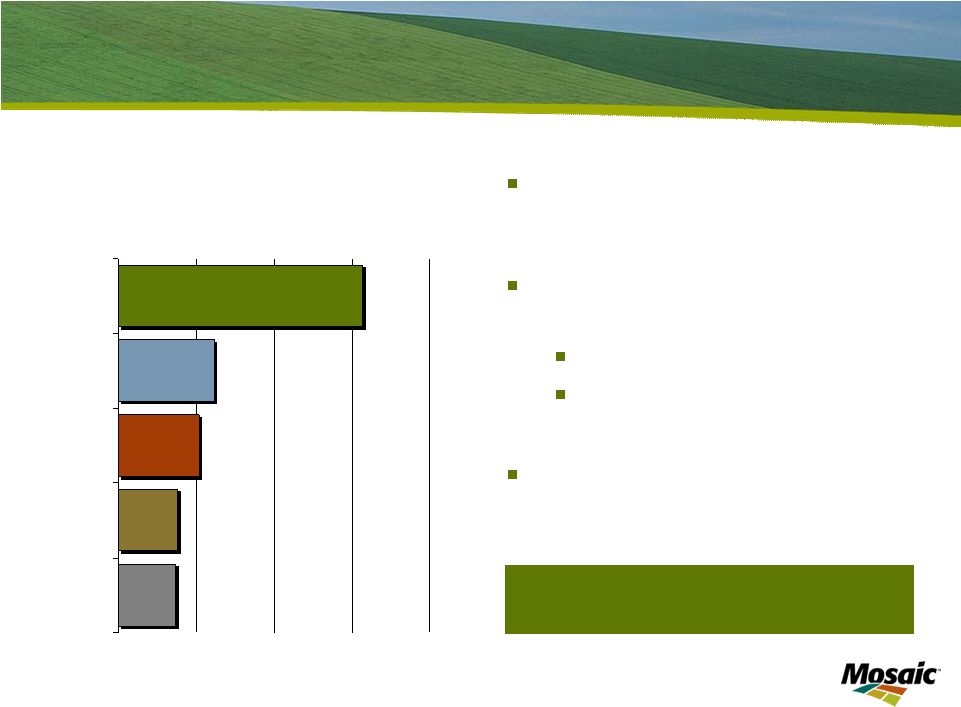 Slide 16 World’s Largest Integrated Phosphate Producer World’s largest capacity of finished phosphate fertilizer Mosaic phosphate production market share 15% Globally 59% North America World scale & efficient operations World capacity approximates 71 million tonnes (DAP/MAP/TSP) 0 3 6 9 12 Mosaic OCP PhosAgro GCT CF •Phosphate Fertilizer Capacity Million tonnes product |
The Phosphate business possesses its own attractive set of attributes due to its sheer size and the benefits of vertical integration – company-owned rock reserves -- granulation capacity – and a worldwide supply chain and distribution network. We have the largest global capacity of finished phosphate fertilizer – by far. Mosaic’s rock reserves provide a significant competitive advantage over non-integrated producers. As a result, their rock input costs are significantly higher than those of Mosaic. A strategic priority for phosphates is to secure additional rock sources outside of North America. |
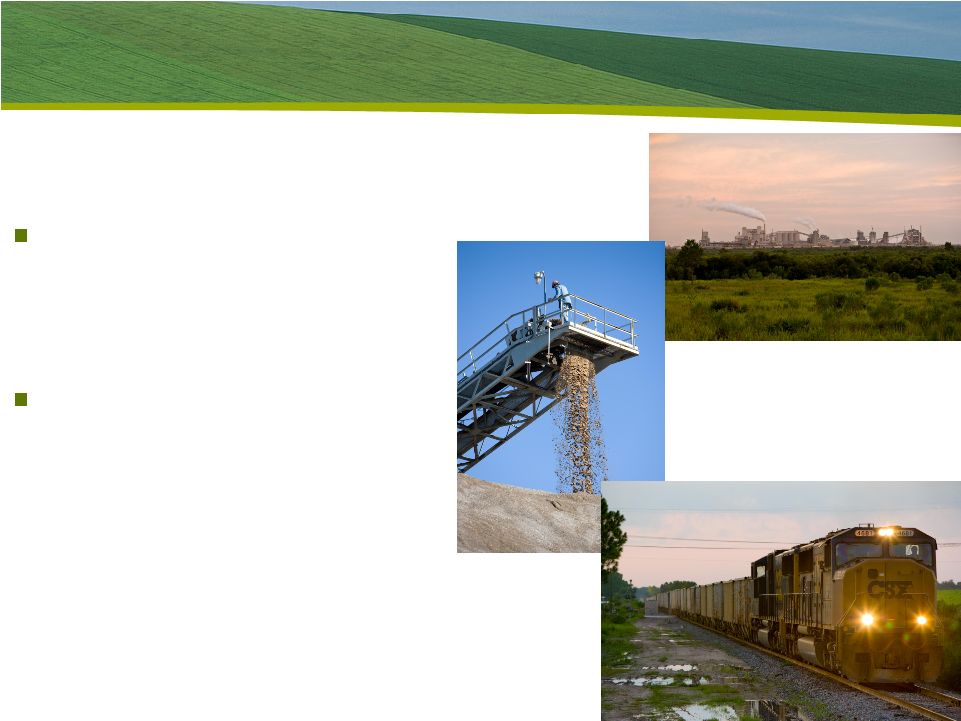 Slide 17 Phosphates – Operational Cost Savings Energy – capture and convert Logistics and transportation network |
The size and scale of our phosphate business produces significant cost efficiencies. We are always working to enhance these efficiencies, and in turn, lower costs. For example, we spend roughly $120 million per year purchasing electricity to operate our plants and mines. We will continue to invest in waste heat recovery systems which will deliver significant energy savings, and we expect to be a net generator of electricity by 2015. We also have a distribution network without peer in our industry. This includes ports, barges and vessels and investments in unit train loading capabilities. Approximately 70% of annual North American sales volume is shipped via unit train, while many competitors ship both fewer and shorter trains. This provides significant cost savings for us and our customers. |
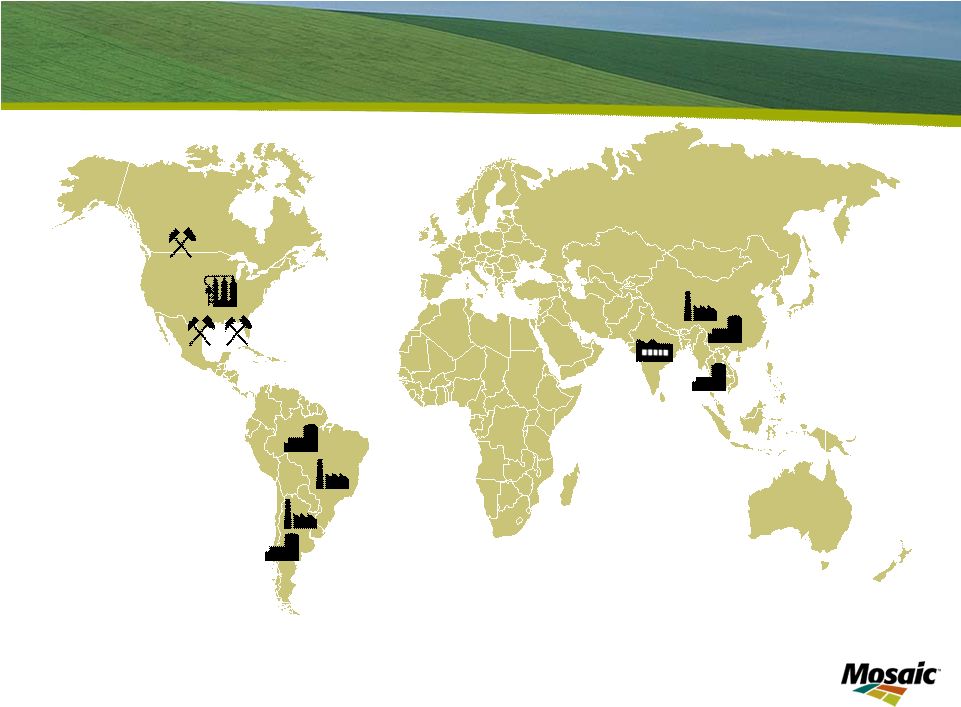 Slide 18 Offshore Assets Aligned with Global Demand Canada 4 Mines United States 7 Mines 4 Phosphate Plants Argentina 1 Warehouse & Blender 1 Production/Warehouse Brazil 7 Warehouse & Blender 2 Production/Warehouse China 2 Warehouse & Blender 2 Production/Warehouse Thailand 1 Warehouse & Blender India 1 Warehouse |
Mosaic’s North American-based Phosphate and Potash businesses are bolstered by production assets and distribution networks in prime growth regions, such as Asia and Latin America. We have agronomists, sales teams, and other staff with the operational expertise and industry knowledge to serve customers and run supply chains and plants. These Offshore enterprises enable us to see the changes and trends in the global market first hand. |
 Market Outlook |
| Now let me shift to the business outlook. |
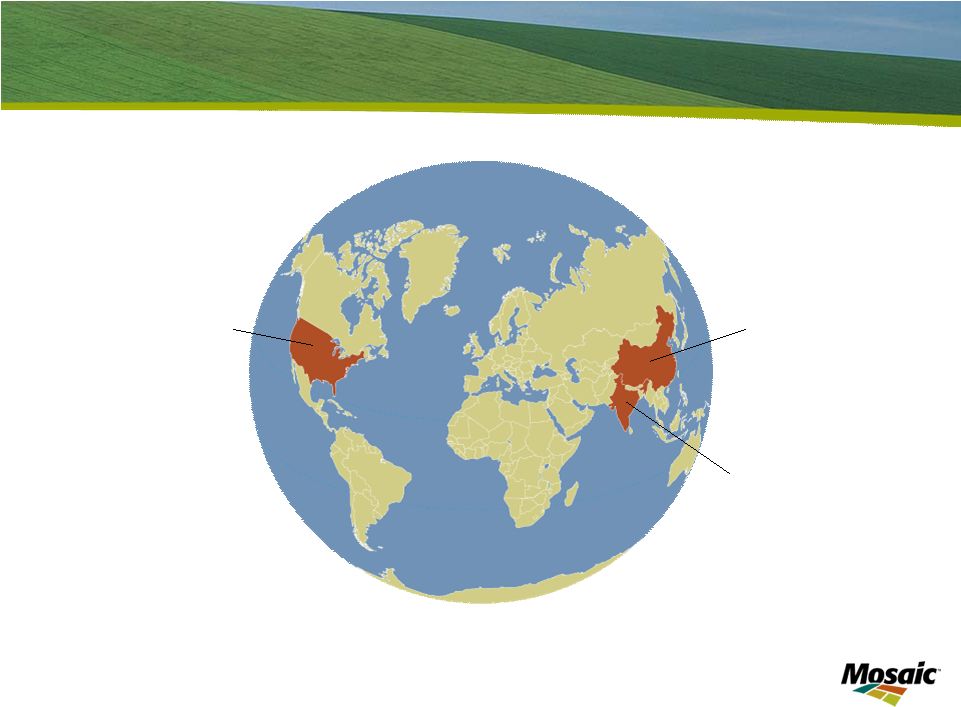 Slide 20 Growing Global Affluence + Fuel China: Middle class growth from 130 million to 690 million by 2025 India: Middle class growth from 50 million in 2008 to 580 million by 2025 USA: Ethanol growth to 15 billion gallons by 2015 The 2009 mandate for ethanol is 10.5 billion gallons Source: McKinsey |
The fundamental demand driver of this business is population growth, especially the growth of the middle class in developing countries. Strong economic growth in a number of rapidly developing countries is creating a large, and increasingly affluent, middle class who demand better diets -- protein-rich and grain-intensive diets that include meat and dairy products. GDP growth in key countries such as China and India is still robust. The economies of both these countries are expected to grow at about 6% and 4%, respectively, in 2009. The middle class in China and India is projected to grow by 1.1 billion people between 2005 and 2025. This will result in a systemic and lasting change in grain and oilseed demand that we have never before experienced. The growing use of biofuels is also contributing to the increase in grain and oilseed demand. We estimate that the net amount of corn used for ethanol production in the United States accounted for about 3% of world grain and oilseed use last year and is projected to account for roughly 5% of world grain and oilseed use by 2015 under current ethanol mandates. |
 Slide 21 Growing Grain & Oilseed Use World Grain and Oilseed Use 1.00 1.25 1.50 1.75 2.00 2.25 2.50 2.75 70 72 74 76 78 80 82 84 86 88 90 92 94 96 98 00 02 04 06 08E Source: USDA and Mosaic Bil Tonnes Actual Actual for US Ethanol Forecast Forecast for U.S. Ethanol |
Combine the boost from biofuels with the growth in the global middle class, and you get increasing global demand for grain and oilseeds. According to USDA estimates, global grain and oilseed demand has recently been increasing 2.5 percent per year – twice the historical rate. Note that there have only been 3 years since the 1970s when global grain and oilseed use decreased - - in 1974, 1988 and 1995. In each of these years, this resulted from low production due to poor weather. Note also that grain and oilseed demand increased in the recession years of 1981, 1982 and 1991. This point is compelling and indicates that people do not get less hungry, even in economic downturns. Additionally, biofuel mandates only add pressure to produce still more grain and oilseeds. |
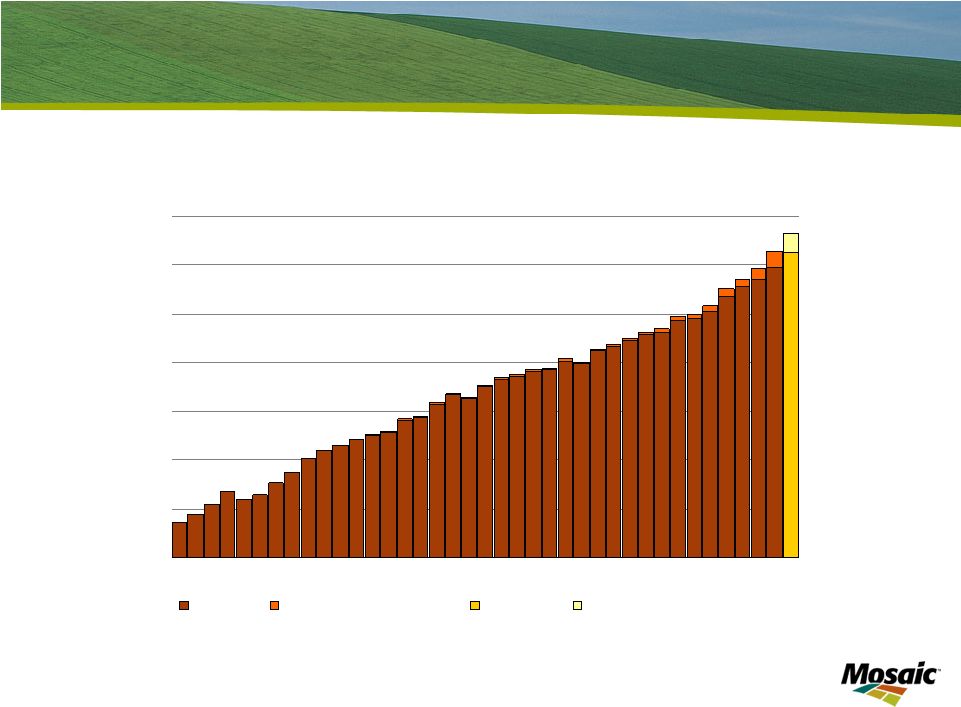
 Slide 22 Record Crop Needed in 2009 World Grain and Oilseed Stocks 250 300 350 400 450 500 550 600 650 99/00 00/01 01/02 02/03 03/04 04/05 05/06 06/07 07/08 08/09 09/10 L 09/10 M 09/10 H Mil Tonnes 10% 13% 16% 19% 22% 25% 28% 31% 34% Percent Stocks Percent of Use Source: USDA and Mosaic (for 09/10 estimates) |
Farmers have responded to this demand by growing bin-busting crops during the last two years. Yet, this has not built stocks to secure levels. You can see from the cross hatched bar that inventories are projected to increase this year but stocks as a percentage of use – noted by the yellow line -- are forecasted to increase modestly and remain at historically low levels. Another bumper crop is required this year to meet the demands for food and fuel, as well as to build stocks to more secure levels. That means farmers will need to plant more area and intensify cropping practices in order to increase yields. The three bars on the right side of this chart illustrate the potential outcomes for low, medium and high production-and-use scenarios in 2009. The trend-line yields we’re showing next year are not good enough to meet projected demand, let alone build stocks to secure levels. In fact, under the medium yield scenario, global grain and oilseed stocks decline about 12 million tonnes. A serious weather problem in 2009 would result in an 85 million tonne drawdown in stocks. |
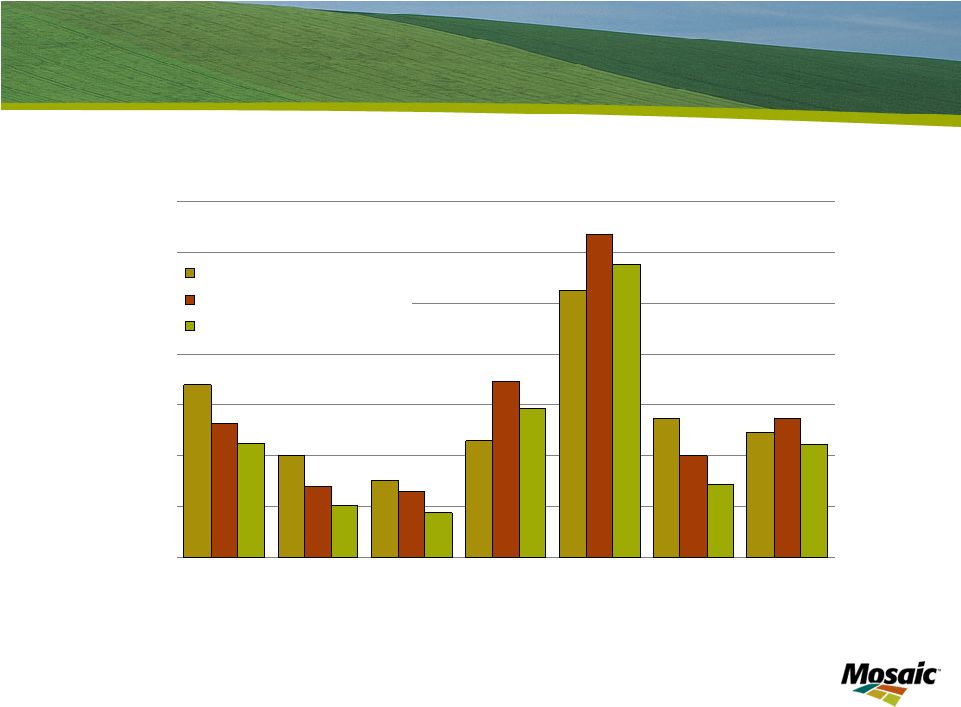 Slide 23 Farm Economics Remain Strong RAVC - Return after Variable Cost Return on Variable Cost for a U.S. Midwest High Yield Farm Operation $0 $100 $200 $300 $400 $500 $600 $700 2003 2004 2005 2006 2007 2008 2009E Source: Iowa State University and Mosaic $ Acre Soybeans Corn Following Soybeans Corn Following Corn |
Despite the volatile environment, farm economics remain strong – especially in North America. Recently farmers have been reluctant buyers of crop nutrients, due to unprecedented commodity price swings. With the spring season upon us, many farmers should be ready to restock crop nutrients, which they need for high yields. Equally important, most farmers around the world are well capitalized to fund input purchases. Underscoring their financial strength -- as you see in this chart -- estimated farm returns in 2009 remain healthy. |
 Slide 24 Crop Nutrient Markets Re-Calibrate Factors Affecting Current Market Broad and sharp commodity sell-off Global economic slowdown Global credit constraints High fertilizer inventory levels Leading to Change in buyer sentiment Weak volume and softening prices Inventory valuation risk in supply chain Production reductions |
Though we believe the long-term fundamentals in our business are intact and compelling, the current market environment continues to be soft, and the crop nutrient market is re-calibrating. A confluence of factors in the past several months have caused demand – especially for phosphates – to weaken. We’ve experienced a broad and sharp commodity sell-off, a global economic downturn and significant credit constraints, and a pipeline build of high cost inventories. This has resulted in a lack of buyer interest, weak volume and declining prices, and heightened inventory valuation risk across the supply chain. In response to slower demand and rising inventory levels, numerous producers – including Mosaic – have reduced production. |
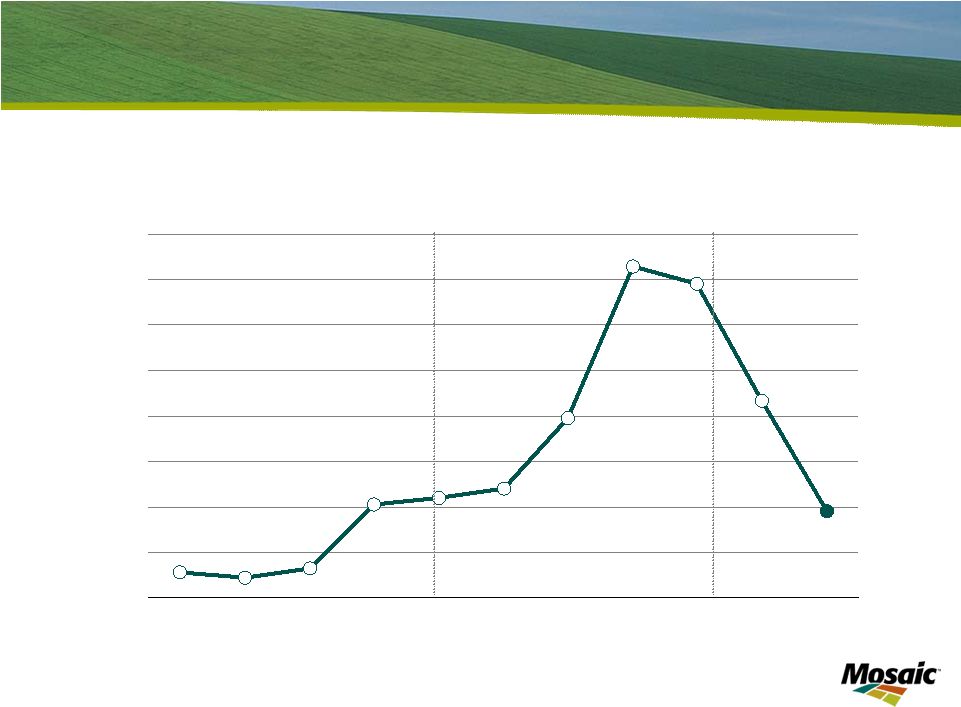
 Slide 25 Key Drivers for DAP Pricing DAP Prices Quarterly Averages of Weekly Published Spot DAP fob Tampa 200 400 600 800 1,000 1,200 Q1 07 Q2 Q3 Q4 Q1 08 Q2 Q3 Q4 Q1 09 Q2 Q3 $ Tonne Source: Fertecon Near-Term Drivers: Pipeline inventory Raw materials China exports Global demand |
These factors have impacted the phosphates business in particular. DAP prices shown here have taken a sharp dive from historically high levels due to the reasons just noted and the sharp decline in raw material costs. This chart shows the average DAP price by quarter – note that recent spot prices are closer to $375, compared with $850 a year ago. These factors have impacted phosphate sales volumes. Volume will be down significantly this fiscal year due to slow demand and substantial production cuts. The outlook for DAP selling prices and volume hinges on several factors, including -- the timely drawdown of pipeline inventory this spring -- raw material cost trends -- Chinese export trends and -- overall global demand. Buyer sentiment will play a key role, with the focus on overall grain prices and farmer economics. A recent positive development was PhosChem signing a 1.2 million tonne DAP contract with some of our Indian customers. Also, in recent weeks, we have seen a modest, but broad-based pickup in phosphate sales activity. |
 Slide 26 Attractive Phosphate Market Margins *Spot DAP price less spot sulfur and ammonia price DAP Market Margin Quarterly Averages Calculated from Weekly Published Spot Prices for a Central Florida Plant 100 200 300 400 500 600 700 800 900 Q1 07 Q2 Q3 Q4 Q1 08 Q2 Q3 Q4 Q1 09 Q2 Q3 $ Tonne Source: Fertecon, Green Markets, Mosaic |
It’s important to note that price tells only half the story in phosphates. Equally important are raw material costs, primarily sulfur and ammonia, as well as phosphate rock. Recently, sulfur and ammonia costs have declined sharply, leading to reduced phosphate selling prices. Note, however, that we can produce excellent margins, even as the price of DAP declines. The one caveat is that phosphate margins -- at least through the third quarter -- have been and will continue to be pressured by the high sulfur and ammonia costs inventoried in the product we are currently shipping. |
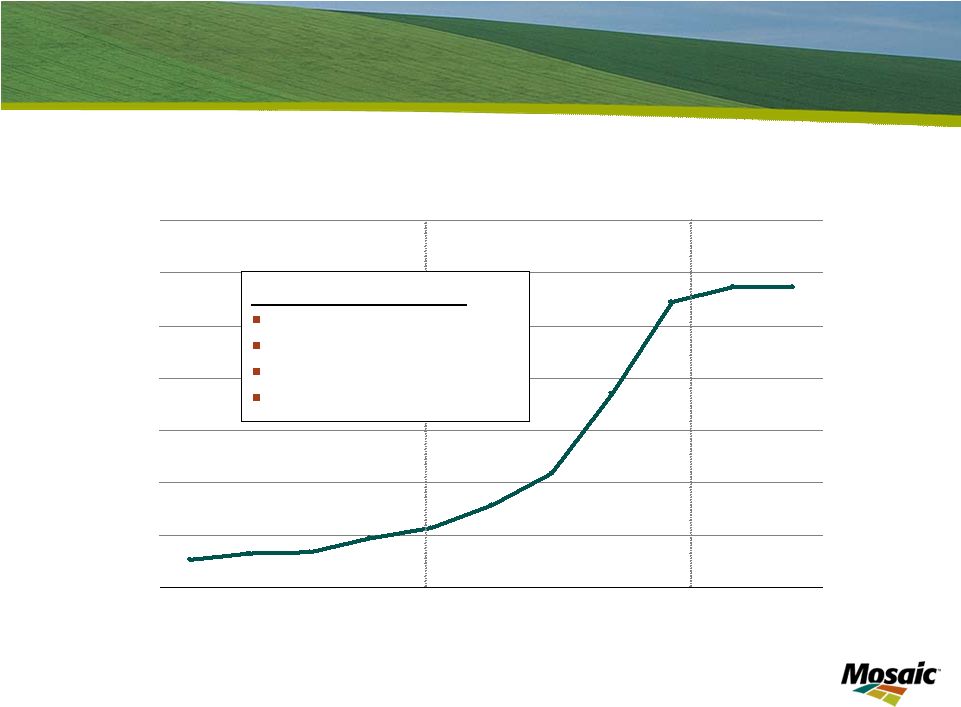 Slide 27 Key Drivers for MOP Pricing MOP Prices Quarterly Averages of Weekly Published Spot MOP c&f Brazil 100 250 400 550 700 850 1,000 1,150 Q1 07 Q2 Q3 Q4 Q1 08 Q2 Q3 Q4 Q1 09 Q2 Q3 $ Tonne Source: ICIS Near-Term Drivers: China contract India demand FX impact Buyer sentiment |
In the Potash business, the dramatic price increases of the past 12-15 months were the result of surging demand. Upward price momentum and sales volume have slowed in the past few months and we have reduced potash production in response to this slower demand and rising inventory levels. We expect third quarter potash sales volumes to be down -- with our product mix including a greater percentage of lower-priced industrial sales. Future sales volume and price movements in potash will be determined by several factors, including: The timing and terms of the annual Chinese potash contracts India demand Foreign currency exchange impact And, changes in overall buyer sentiment While any of these factors could swing one way or the other, potash fundamentals remain excellent. |
 Slide 28 Growth Expected to Resume in ’09 World Nutrient Use 110 120 130 140 150 160 170 180 190 200 95 96 97 98 99 00 01 02 03 04 05 06 07 08E 09F 10F 11F 12F Source: IFA May and November 2008 Mil Tonnes |
There are many reasons for optimism. World grain and oilseed stocks remain perilously low – while at the same time, the world population grows by 73 million people each year. And while the media may have forgotten about global food security, it still remains a serious threat. One of the most immediate ways to grow more food is to increase yields through crop nutrition products. And frankly, for both the Phosphates and Potash businesses, there are limited capacity additions coming on line in the next few years. It will require higher prices to attract the capital necessary to justify greenfield projects. |
 Slide 29 Key Takeaways Crop nutrient outlook remains positive Global demand for food, feed and fuel Mosaic well positioned to deliver value |
In closing, I would like to emphasize three key points. First -- we have a great deal of confidence in the long-term outlook for our business and the necessity for the world to build its capacity to produce food. Second -- we believe agricultural fundamentals remain solid because of continued global demand for food, fuel and feed. And third -- Mosaic is well-positioned in this industry with our vertically integrated operations and an impressive global footprint and balance sheet. We are actively managing all value drivers – we understand how to produce cash flow and generate returns for shareholders and we are committed to doing so. |
 Thank you |
I appreciate you listening to Mosaic’s story and our outlook for the future. Now I’d be happy to take questions. |
 31 Appendix: Non-GAAP Financial Measure Reconciliation Return on Invested Capital Our return on invested capital (“ROIC”) is a measure of value creation and how effectively we allocate capital in our core operations. We believe ROIC is a metric that is most closely correlated with stockholder value. We also use ROIC as part of our initial capital spending and potential acquisition review processes to ensure that each capital dollar spent achieves a certain hurdle rate of return. There are limitations in the use of ROIC due to the subjective nature of items excluded by management in calculating ROIC. This non-GAAP measure is provided as supplemental information and should not be considered in lieu of the GAAP measures. Management uses ROIC to measure how effectively we are allocating capital, and therefore, management believes this information is useful to investors. We define ROIC as follows: • Numerator (net operating profit after taxes): + Operating earnings - Taxes at effective tax rate on operating earnings + Equity in net earnings of nonconsolidated companies - Minority interest in consolidated companies = Net operating profit after taxes • Denominator (average invested capital, trailing five point average): + Total Assets Less Non-interest bearing liabilities: Accounts payable Trade accounts payable due to Cargill, Inc. and affiliates Cargill prepayments and accrued liabilities Accrued liabilities Deferred income tax liabilities - current Deferred income tax liabilities – noncurrent Other noncurrent liabilities Total non-interest bearing liabilities - Minority interest in consolidated companies = Invested capital ROIC: Net operating profit after taxes / Average invested capital We had ROIC of 2.3%, 8.0%, 30.2% and 36.5% for fiscal 2006, 2007 and 2008 and the twelve months ended November 30, 2008, respectively. The reconciliations to the most comparable U.S. GAAP measurements for the numerator and denominator are as follows (in millions and unaudited): |
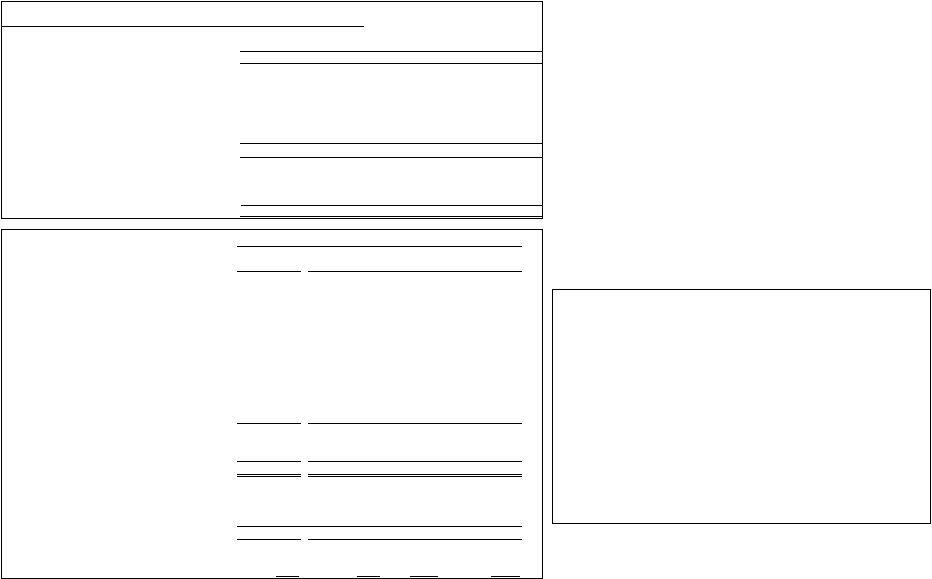 32 Appendix: Non-GAAP Financial Measure Reconciliation May 31 May 31 May 31 November 30 ($ in millions) 2006 2007 2008 2008 Total assets 8,628.4 $ 8,801.7 $ 10,118.2 $ 11,510.5 $ Less non-interest bearing liabilities: Accounts payable 401.7 554.3 569.2 812.8 Trade accounts payable due to Cargill, Inc. and affiliates 28.6 29.4 12.6 12.0 Cargill prepayments and accrued liabilities - 4.5 41.6 36.2 Accrued liabilities 362.0 265.9 610.3 721.7 Accrued income taxes 88.1 112.9 87.6 133.3 Deferred income tax liabilities - current 2.5 7.1 33.2 31.0 Deferred income tax liabilities - noncurrent 715.6 629.1 551.0 545.2 Other noncurrent liabilities 884.7 923.6 1,001.8 978.6 Total non-interest bearing liabilities 2,483.3 2,526.8 �� 2,907.2 3,270.8 Less: Minority interest in consolidated subsidiaries 23.7 22.7 24.7 25.0 Invested capital 6,121.4 $ 6,252.2 $ 7,186.4 $ 8,214.6 $ Trailing 12 months @ November 30 2006 2007 2008 2008 142.5 503.3 2,172.6 2,996.7 ROIC 2.3% 8.0% 30.2% 36.5% May 31 Years ended Average invested capital as of Net Operating Profit After Tax Return On Invested Capital (ROIC) Calculation Trailing 12 months ended November 30 2006 2007 2008 2007 Operating earnings 101.9 $ 616.3 $ 2,806.7 $ 4,058.4 $ - Taxes at effective tax rate on operating earnings (a) 3.4 150.4 749.4 1,208.0 + Equity in net earnings of nonconsolidated companies 48.4 41.3 124.0 155.2 - Minority interest in consolidated subsidiaries 4.4 3.9 8.7 8.9 Net operating profit after taxes 142.5 $ 503.3 $ 2,172.6 $ 2,996.7 $ (a) Operating earnings 101.9 $ 616.3 $ 2,806.7 $ 4,058.4 $ Tax rate 3.3% 24.4% 26.7% 29.8% Tax effect on operating earnings 3.4 $ 150.4 $ 749.4 $ 1,208.0 $ Fiscal Years ended May 31 We have presented above ROIC, which is a non-GAAP financial measure. Generally, non-GAAP financial measures are supplemental numerical measures of a company's performance, financial position or cash flows that either exclude or include amounts that are not normally excluded or included in the most directly comparable measure calculated and presented in accordance with U.S. generally accepted accounting principles ("GAAP"). ROIC is not a measure of financial performance under GAAP. Because not all companies use identical calculations, our calculation of ROIC may not be comparable to other similarly titled measures presented by other companies. In evaluating this measure, investors should consider that our methodology in calculating such measures may differ from that used by other companies. |