 The Mosaic Company Jim Prokopanko, President and Chief Executive Officer Larry Stranghoener, Executive VP and Chief Financial Officer Mike Rahm, Vice President Market and Strategic Analysis Christine Battist, Director - Investor Relations Earnings Conference Call - 1 st Quarter Fiscal 2011 Tuesday, October 5, 2010 Exhibit 99.2 |
 This presentation contains forward-looking statements within the meaning of the Private Securities Litigation Reform Act of 1995. Such statements include, but are not limited to, statements about future financial and operating results. Such statements are based upon the current beliefs and expectations of The Mosaic Company’s management and are subject to significant risks and uncertainties. These risks and uncertainties include but are not limited to the predictability and volatility of, and customer expectations about, agriculture, fertilizer, raw material, energy and transportation markets that are subject to competitive and other pressures and economic and credit market conditions; the level of inventories in the distribution channels for crop nutrients; changes in foreign currency and exchange rates; international trade risks; changes in government policy; changes in environmental and other governmental regulation, including greenhouse gas regulation; further developments in the lawsuit involving the federal wetlands permit for the extension of the Company’s South Fort Meade, Florida, mine into Hardee County, including orders, rulings, injunctions or other actions by the court or actions by the plaintiffs, the Army Corps of Engineers or others in relation to the lawsuit, or any actions the Company may identify and implement in an effort to mitigate the effects of the lawsuit; other difficulties or delays in receiving, or increased costs of, or revocation of, necessary governmental permits or approvals; the effectiveness of the Company’s processes for managing its strategic priorities; adverse weather conditions affecting operations in Central Florida or the Gulf Coast of the United States, including potential hurricanes or excess rainfall; actual costs of asset retirement, environmental remediation, reclamation or other environmental regulation differing from management’s current estimates; accidents and other disruptions involving Mosaic’s operations, including brine inflows at its Esterhazy, Saskatchewan potash mine and other potential mine fires, floods, explosions, seismic events or releases of hazardous or volatile chemicals, as well as other risks and uncertainties reported from time to time in The Mosaic Company’s reports filed with the Securities and Exchange Commission. Actual results may differ from those set forth in the forward-looking statements. Safe Harbor Statement Slide 2 |
 Leader in Potash and Phosphate Slide 3 SOURCE: IFA, COMPANY REPORTS AND MOSAIC ESTIMATE |
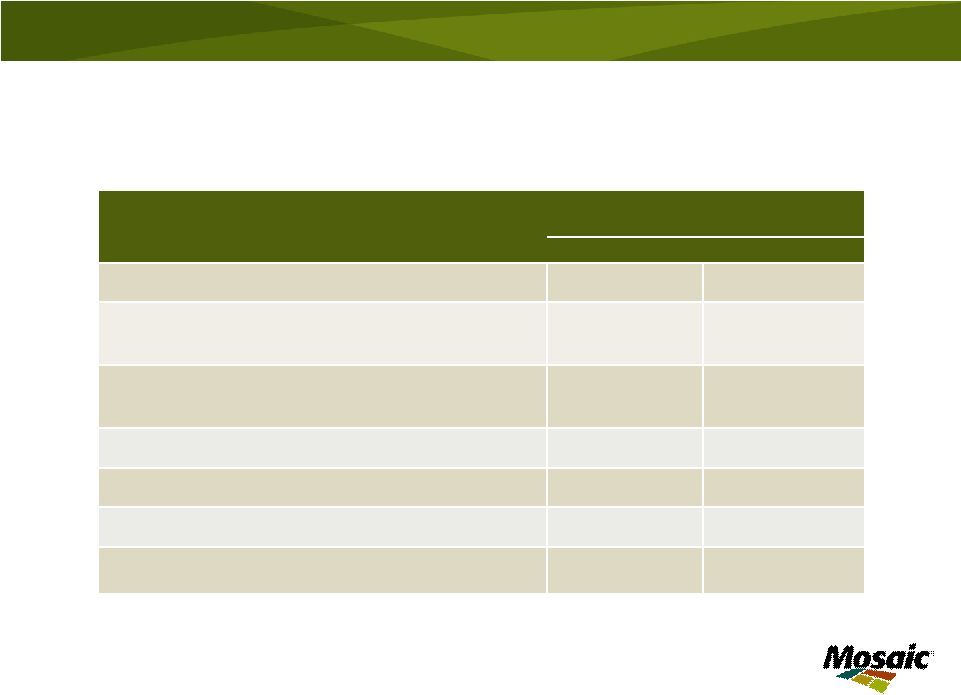 In millions, except per share amounts Three Months Ended August 31, 2010 2009 Net Sales $2,188.3 $1,457.2 Gross Margin $504.7 $222.2 % of net sales 23% 15% Net Earnings $297.7 $100.6 % of net sales 14% 7% Diluted EPS $0.67 $0.23 Effective Tax Rate 27% 25% Cash Flow Provided by Operations $556.2 $172.4 Cash and Cash Equivalents as of August 31, 2010 & 2009 $2,362.7 $2,598.7 Financial Results Slide 4 |
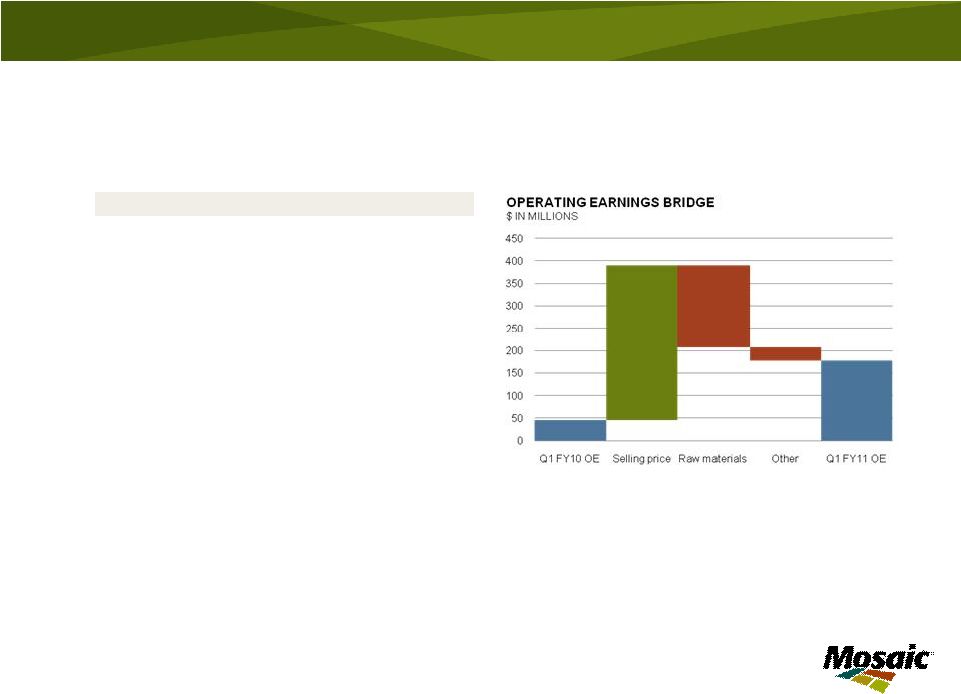 Phosphates Segment Highlights Slide 5 Q1 FY11 Q4 FY10 Q1 FY10 IN MILLIONS, EXCEPT DAP PRICE Net sales $1,581.1 $1,187.9 $1,194.5 Gross Margin $245.0 $306.6 $114.5 % of net sales 15% 26% 10% Operating earnings $178.0 $221.1 $46.5 Sales volumes 3.1 2.3 2.9 NA production volume 2.2 1.9 2.0 Ave DAP selling price $431 $438 $278 First quarter year over year highlights: • Higher selling prices • Finished product operating rate 89%; however, reduced rock production at South Fort Meade • Strong sales volumes in North America & Brazil • Lean producer inventories |
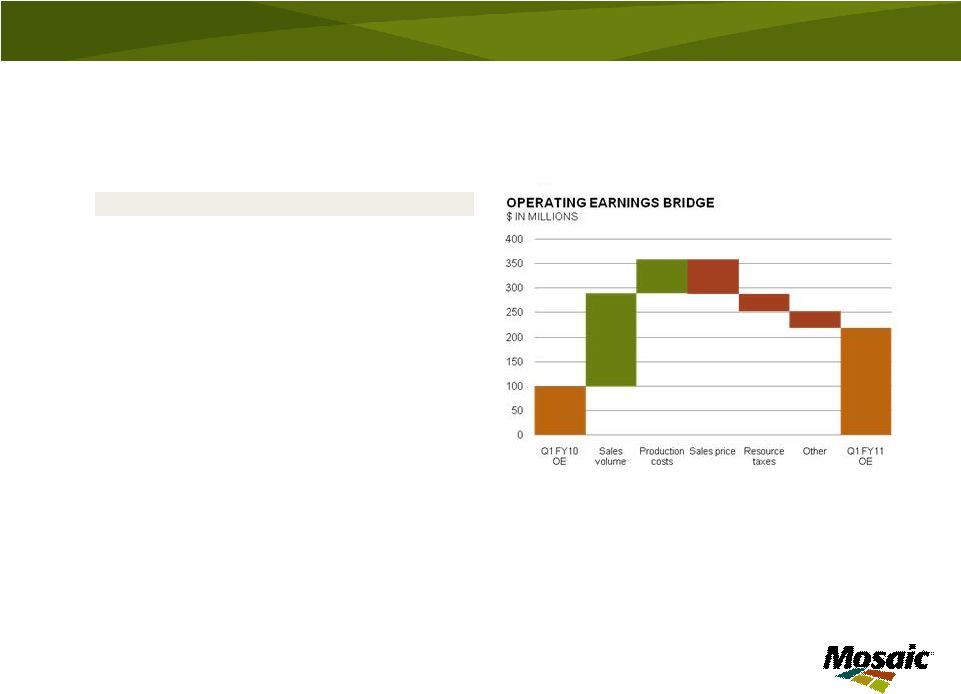 Potash Segment Highlights Slide 6 Q1 FY11 Q4 FY10 Q1 FY10 IN MILLIONS, EXCEPT MOP PRICE Net sales $621.9 $696.5 $333.3 Gross Margin $256.7 $378.1 $124.6 % of net sales 41% 54% 37% Operating earnings $218.0 $346.9 $99.3 Sales volumes 1.7 1.8 0.8 Production volume 1.4 1.9 0.8 Ave MOP selling price $331 $336 $354 First quarter year over year highlights: • Sales volume double last year • First quarter volumes in both years affected by seasonal turnarounds • Improved cost leverage due to increased production |
 Execution of Strategic Priorities • Investment in Miski Mayo • Closed Fosfertil sale • Grow value in Phosphates – Align distribution with production – Optimize production rates – Grow MicroEssentials® • Potash expansions continue on plan – New shaft at Esterhazy Slide 7 |
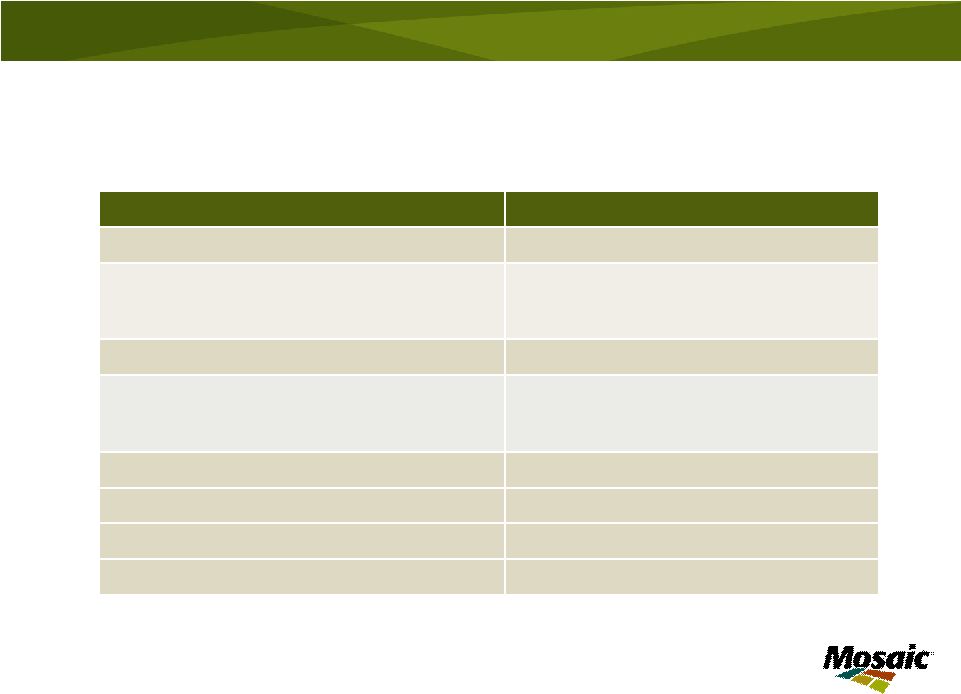 Category Guidance Phosphates Market Phosphates Segment Extremely tight near term Large domestic and international shipments U.S. producer inventories extremely low Q2 Sales volume 3.3 – 3.6 million tonnes Q2 DAP selling price $430 - $460 per tonne Operating rate of 85 – 90% Potash Market Potash Segment Surging shipments North American producer inventories declined, expected to stay low Q2 Sales volume 1.6 – 1.9 million tonnes Q2 MOP selling price $310 - $340 per tonne Operating rate of 80 – 85% Canadian Resource Taxes and Royalties $150 - $200 million SG&A $360 – $380 million Capital Expenditures $1.4 - $1.6 billion Effective Tax Rate* Mid to upper 20 percent range Financial Guidance – Fiscal 2011 Slide 8 * Effective tax rate excludes items related to the Fosfertil sale. While the effect of the gain on the sale on the Company’s provision for income taxes has not yet been finalized, it is expected to increase income tax expense for the second quarter of fiscal 2011 but is expected to lower the effective tax rate. |
 South Fort Meade Update Litigation status: • Awaiting decision from federal district court and Eleventh Circuit on requested motions for partial stay • Granted an expedited appeal of the preliminary injunction by the Eleventh Circuit Factors mitigating operational impact: • Utilizing phosphate rock on hand • Sourcing third party rock, including Miski Mayo • Maximizing existing mine production • Drawing down finished goods inventories Slide 9 |
 Market Outlook |
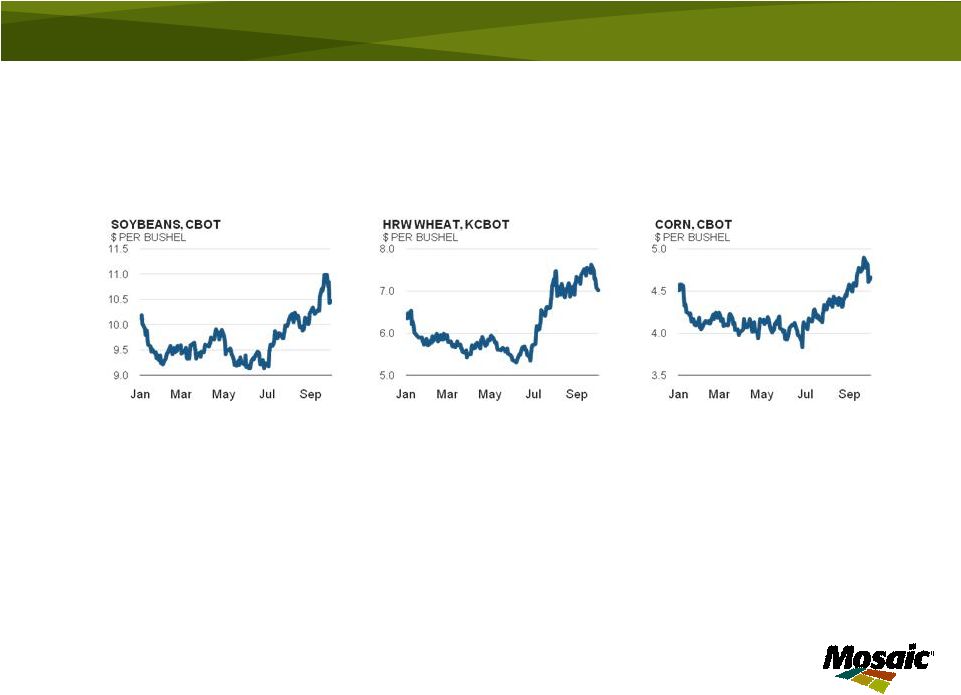 Developments in Ag Commodity Markets Slide 11 Highlights: • Severe weather events: Russia, Saskatchewan, Europe, Pakistan, China, Western Australia • U.S corn crop conditions • Other crop prices rally: cocoa, coffee, cotton, palm oil, and sugar |
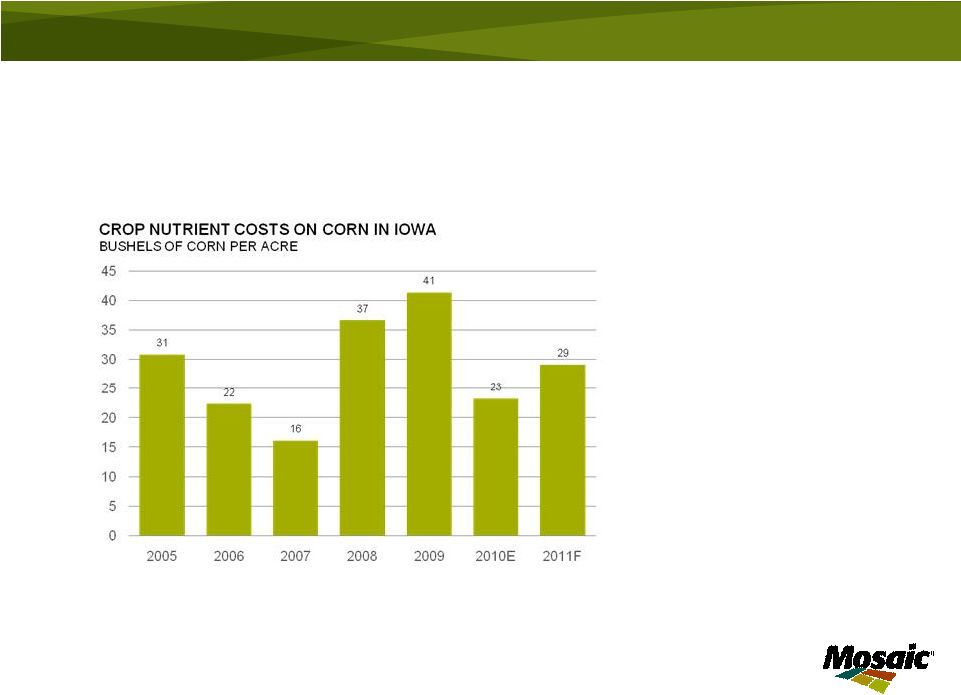 Healthy Farm Economics Slide 12 • Nutrient cost well within historic norms • Record net farm income in U.S. • Farm profitability at or near records in key markets around the world IOWA HIGH YIELD FARM SOURCE: IOWA STATE UNIVERSITY, USDA AND MOSAIC |
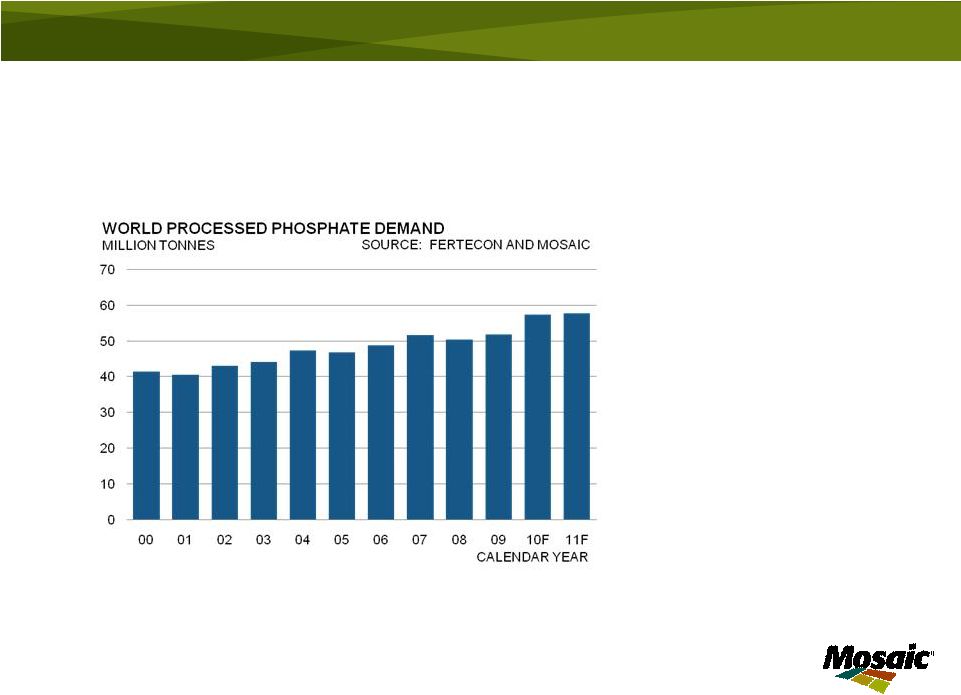 Phosphate Demand at Record Levels Import demand in growth regions (million tonnes): Brazil: •2009 2.1 •2010F 2.5 •2011F 2.7 – 2.9 India: •2009 6.6 •2010F 8.0 •2011F 7.5 – 8.0 13 |
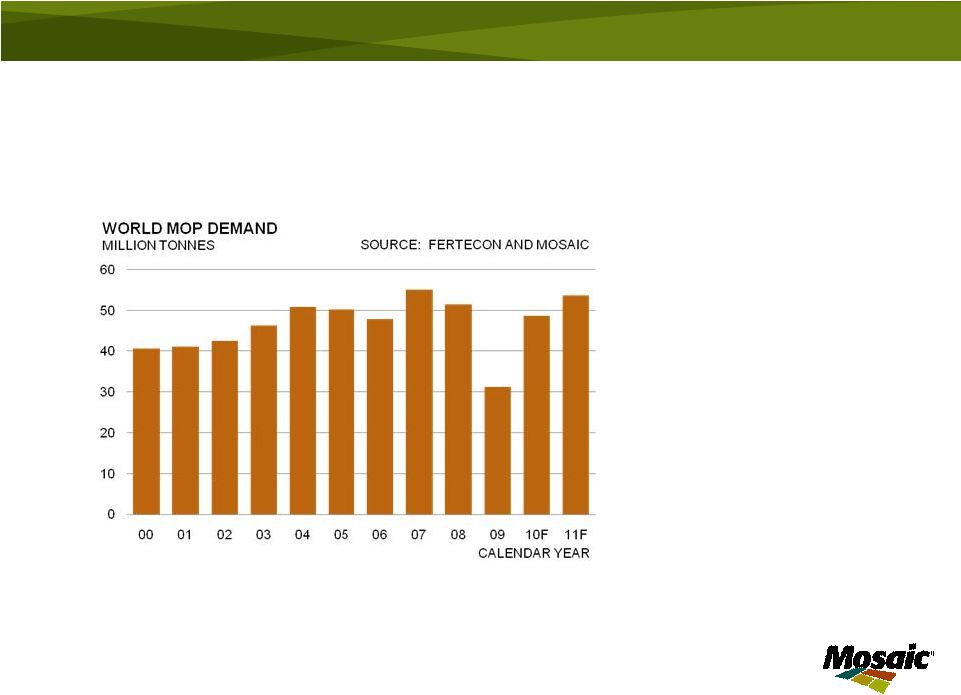 Rebounding Potash Demand 14 Import demand in growth regions (million tonnes): Brazil: •2009 3.4 •2010F 5.9 •2011F 6.2 – 6.5 China: •2009 1.6 •2010F 5.0 •2011F 6.0 – 8.0 India •2009 6.0 •2010F 6.0 •2011F 6.3 – 6.5 |
 Supply Issues • Phosphate: – How much will Ma’aden produce in 2011? – Loss of Agrifos production – Raw material availability – Chinese exports – South Fort Meade resolution • Potash – Brownfield expansions required to keep up with demand Slide 15 |
 Key Points • Strong quarterly results • Balanced nutrient portfolio paying off • Positive market outlook • Executing our strategic priorities Slide 16 |
 The Mosaic Company |