 Near Term Potash Outlook Demand Pull Pressure (Again) Fertilizer Outlook and Technology Conference Savannah, GA November 17, 2010 Dr. Michael R. Rahm Vice President, Market and Strategic Analysis The Mosaic Company Exhibit 99.1 |
 Safe Harbor Statement This presentation contains forward-looking statements within the meaning of the Private Securities Litigation Reform Act of 1995. Such statements include, but are not limited to, statements about future financial and operating results. Such statements are based upon the current beliefs and expectations of The Mosaic Company’s management and are subject to significant risks and uncertainties. These risks and uncertainties include but are not limited to the predictability and volatility of, and customer expectations about, agriculture, fertilizer, raw material, energy and transportation markets that are subject to competitive and other pressures and economic and credit market conditions; the build-up of inventories in the distribution channels for crop nutrients; changes in foreign currency and exchange rates; international trade risks; changes in government policy; changes in environmental and other governmental regulation, including greenhouse gas regulation; further developments in the lawsuit involving the federal wetlands permit for the extension of the Company’s South Fort Meade, Florida, mine into Hardee County, including orders, rulings, injunctions or other actions by the court or actions by the plaintiffs, the Army Corps of Engineers or others in relation to the lawsuit, or any actions the Company may identify and implement in an effort to mitigate the effects of the lawsuit; other difficulties or delays in receiving, or increased costs, or revocation, of, necessary governmental permits or approvals; the effectiveness of our processes for managing our strategic priorities; adverse weather conditions affecting operations in Central Florida or the Gulf Coast of the United States, including potential hurricanes or excess rainfall; actual costs of asset retirement, environmental remediation, reclamation or other environmental regulation differing from management’s current estimates; accidents and other disruptions involving Mosaic’s operations, including brine inflows at its Esterhazy, Saskatchewan potash mine and other potential mine fires, floods, explosions, seismic events or releases of hazardous or volatile chemicals, as well as other risks and uncertainties reported from time to time in The Mosaic Company’s reports filed with the Securities and Exchange Commission. Actual results may differ from those set forth in the forward-looking statements. 2 |
 Topics • Powerful Demand Drivers – Agricultural Commodity Prices – Speculative Exuberance or Fundamental Strength? • Increasingly Tight Potash Fundamentals – Global Shipments – North American Demand – “Perfect Storm” Domestic Fall Season – Global and North American Production – North American Offshore Imports – The Bottom Line 3 |
 4 Strong price signals – an acreage donnybrook shaping up next spring Daily Close of New Crop Options January 1 to November 12, 2010 3.75 4.00 4.25 4.50 4.75 5.00 5.25 5.50 5.75 Jan Apr Jul Oct $ BU New Crop Corn Prices Dec 2011 Dec 2012 Source: CBOT 9.00 9.50 10.00 10.50 11.00 11.50 12.00 12.50 13.00 Jan Apr Jul Oct $ BU New Crop Soybean Prices Nov 2011 Nov 2012 Source: CBOT 5.20 5.60 6.00 6.40 6.80 7.20 7.60 8.00 8.40 Jan Apr Jul Oct $ BU New Crop HRW Wheat Prices July 2011 July 2012 Source: KCBOT |
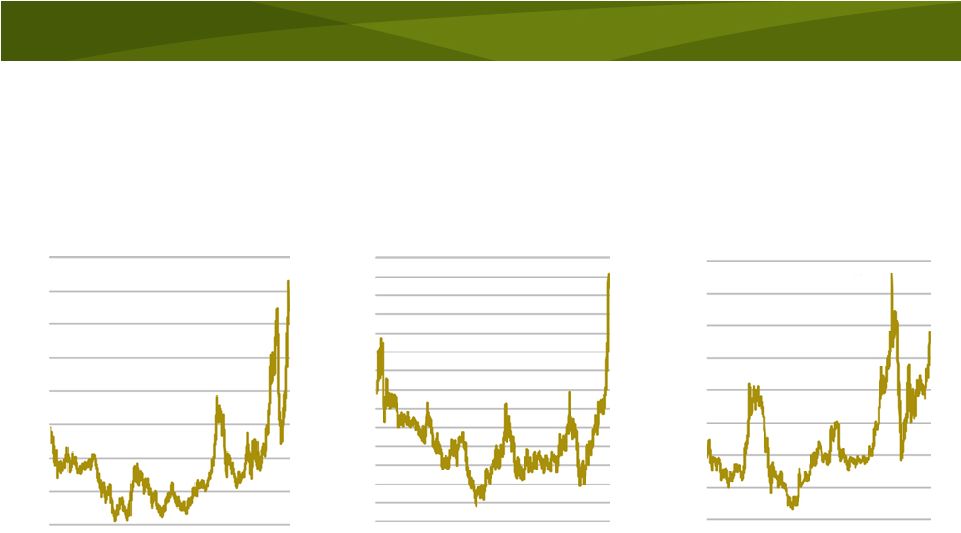 5 And not just corn Daily Close of Nearby Futures Contract 4 8 12 16 20 24 28 32 36 95 98 01 04 07 10 CTS/LB Sugar (#11) Price Source: ICE 20 30 40 50 60 70 80 90 100 110 120 130 140 150 160 95 98 01 04 07 10 CTS/LB Cotton Price Source: ICE 500 1000 1500 2000 2500 3000 3500 4000 4500 95 98 01 04 07 10 RM/ Tonne Palm Oil Price Source: Kuala Lumpur Exchange |
 Speculative exuberance? 6 -900,000 -800,000 -700,000 -600,000 -500,000 -400,000 -300,000 -200,000 -100,000 0 100,000 200,000 300,000 400,000 500,000 600,000 1/3/2006 7/3/2006 1/3/2007 7/3/2007 1/3/2008 7/3/2008 1/3/2009 7/3/2009 1/3/2010 7/3/2010 Contracts Source: CFTC Commitments of Traders Weekly Report Corn Net Position by Futures Market Participants Data thru November 2, 2010 Large Commercial Hedgers Large Speculative Traders Commodity Index Traders Small Non-Reportable Positions |
 Fundamental strength? 7 0 25 50 75 100 125 150 175 200 225 70 72 74 76 78 80 82 84 86 88 90 92 94 96 98 00 02 04 06 08 10 Mil Tonnes World Corn Stocks China Rest of World Source: USDA |
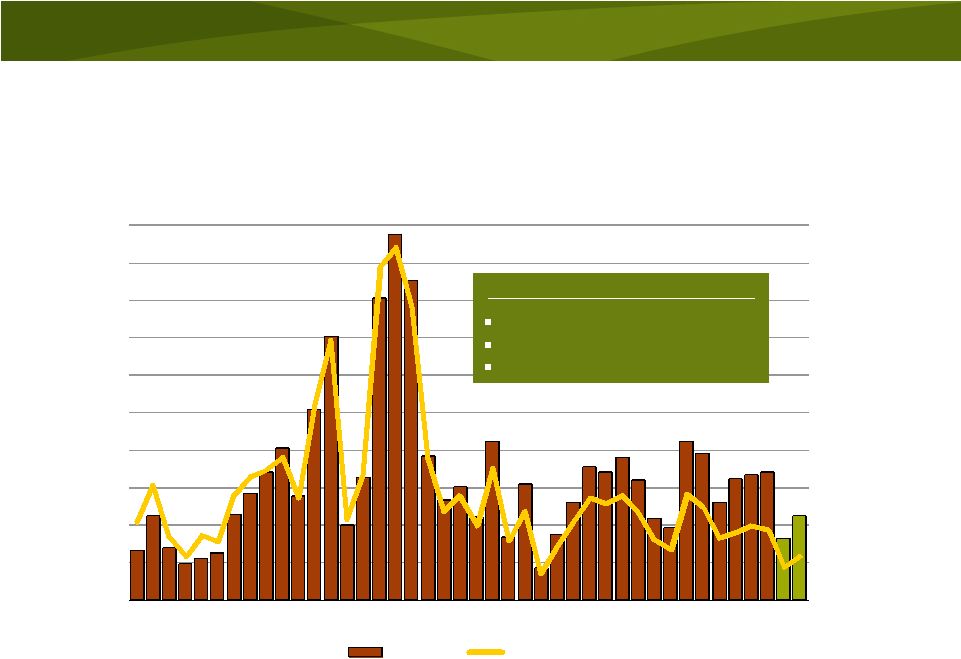 Fundamental strength? 8 0 7 14 21 28 35 42 49 56 63 70 0.0 0.5 1.0 1.5 2.0 2.5 3.0 3.5 4.0 4.5 5.0 70 72 74 76 78 80 82 84 86 88 90 92 94 96 98 00 02 04 06 08 10 Pct of Use Bil Bu U.S. Corn Stocks Stocks Pct of Use Source: USDA and Mosaic Key Assumptions for 2011/12 Planted acreage: 92.5 million Trend Yield: 163.2 bu acre Total use: 13.55 bil bu |
 Fundamental strength? 9 0 25 50 75 100 125 150 175 200 225 70 72 74 76 78 80 82 84 86 88 90 92 94 96 98 00 02 04 06 08 10 MilTonnes World Wheat Stocks China+India Rest of World Source: USDA |
 Increasingly Tight Potash Fundamentals |
 11 Global shipments are back on track Source: Fertecon and Mosaic (Forecast Range for 2010 and 2011) 25 30 35 40 45 50 55 60 95 96 97 98 99 00 01 02 03 04 05 06 07 08 09 10F 11F Mil Tonnes KCL World MOP Shipments |
 12 Recovery in most major import markets 0 1 2 3 4 5 6 7 8 9 10 00 01 02 03 04 05 06 07 08 09 10F 11F Mil Tonnes KCL China Net MOP Import Demand 0.0 1.0 2.0 3.0 4.0 5.0 6.0 7.0 00 01 02 03 04 05 06 07 08 09 10F 11F Mil Tonnes KCL India MOP Import Demand 0.0 1.0 2.0 3.0 4.0 5.0 6.0 7.0 8.0 00 01 02 03 04 05 06 07 08 09 10F 11F Mil Tonnes KCL Other Asia MOP Import Demand 0.0 1.0 2.0 3.0 4.0 5.0 6.0 7.0 00 01 02 03 04 05 06 07 08 09 10F 11F Mil Tonnes KCL Brazil MOP Import Demand Source: Fertecon and Mosaic (Forecast Range for 2011) |
 NA exports projected to increase 34% 13 0 2 4 6 8 10 12 14 95 96 97 98 99 00 01 02 03 04 05 06 07 08 09 10 11F Mil Tons KCL North American MOP Exports U.S. Canada Source: IPNI and Mosaic Fertilizer Year Ending June 30 |
 NA exports up 83% FY 2010/11 YTD 14 0.0 0.2 0.4 0.6 0.8 1.0 1.2 1.4 Jul 07/08 Oct Jan Apr Jul 08/09 Oct Jan Apr Jul 09/10 Oct Jan Apr Jul 10/11 Mil Tons KCL North American MOP Exports Source: IPNI |
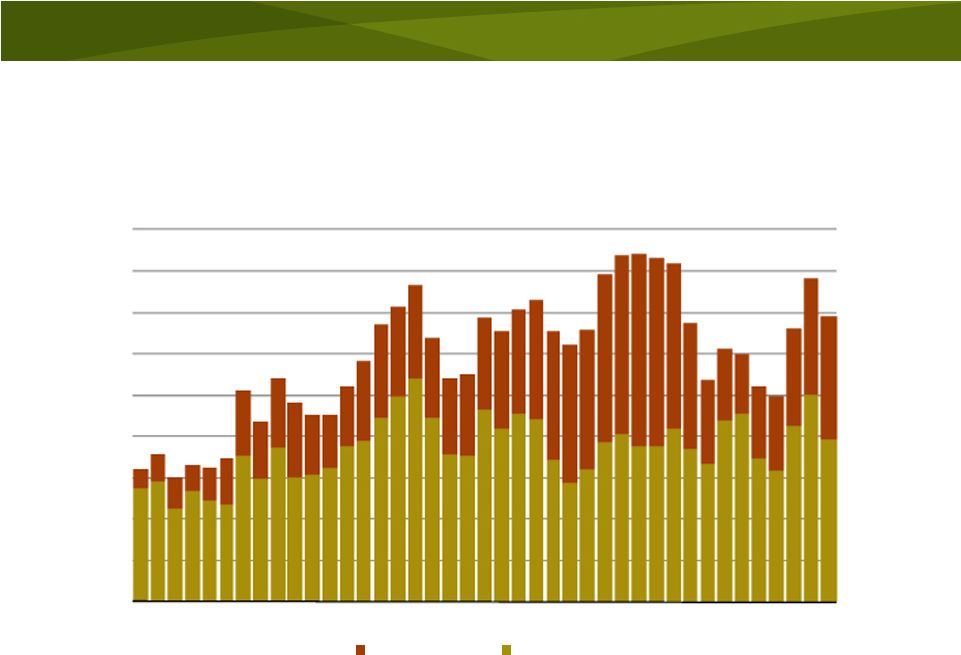
 15 NA shipments forecast to climb another 24% 5 6 7 8 9 10 11 12 13 0.0 1.0 2.0 3.0 4.0 5.0 6.0 7.0 8.0 95 96 97 98 99 00 01 02 03 04 05 06 07 08 09 10 11F Mil Tons KCL Mil Tons K 2 O North American Potash Use and MOP Shipments Ag Use Total Shipments Source: IPNI and Mosaic Fertilizer Year Ending June 30 |
 16 NA shipments up 125% FY 2010/11 YTD 0.0 0.2 0.4 0.6 0.8 1.0 1.2 1.4 1.6 Jul 07/08 Oct Jan Apr Jul 08/09 Oct Jan Apr Jul 09/10 Oct Jan Apr Jul 10/11 Mil Tons KCL North American MOP Domestic Shipments Source: IPNI |
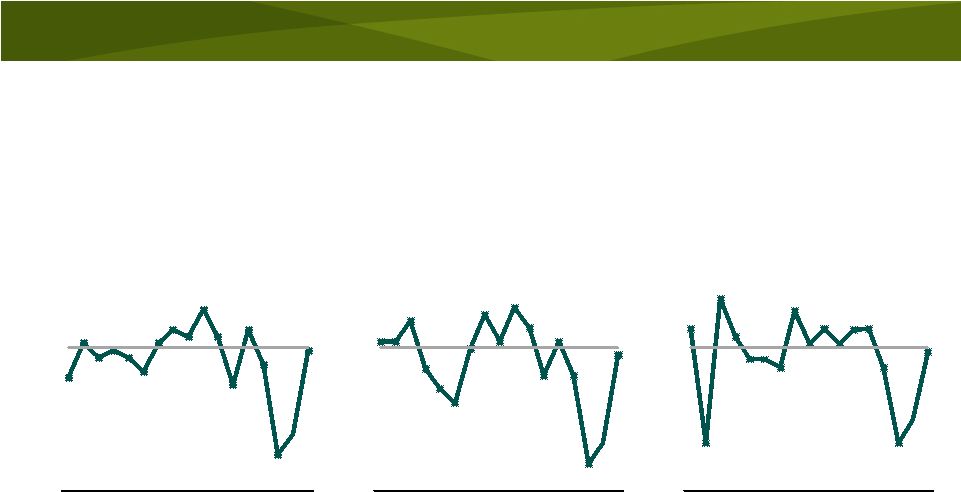 17 U.S. rates expected to return to normal 75 80 85 90 95 100 105 110 115 95 97 99 01 03 05 07 09 11 Index K Application Rate on Corn 75 80 85 90 95 100 105 110 115 95 97 99 01 03 05 07 09 11 Index K Application Rate on Soybean 50 60 70 80 90 100 110 120 130 95 97 99 01 03 05 07 09 11 Index K Application Rate on Wheat Estimated national average application rates Source: USDA and Mosaic Index: 10-year average 1995-2004 = 100 |
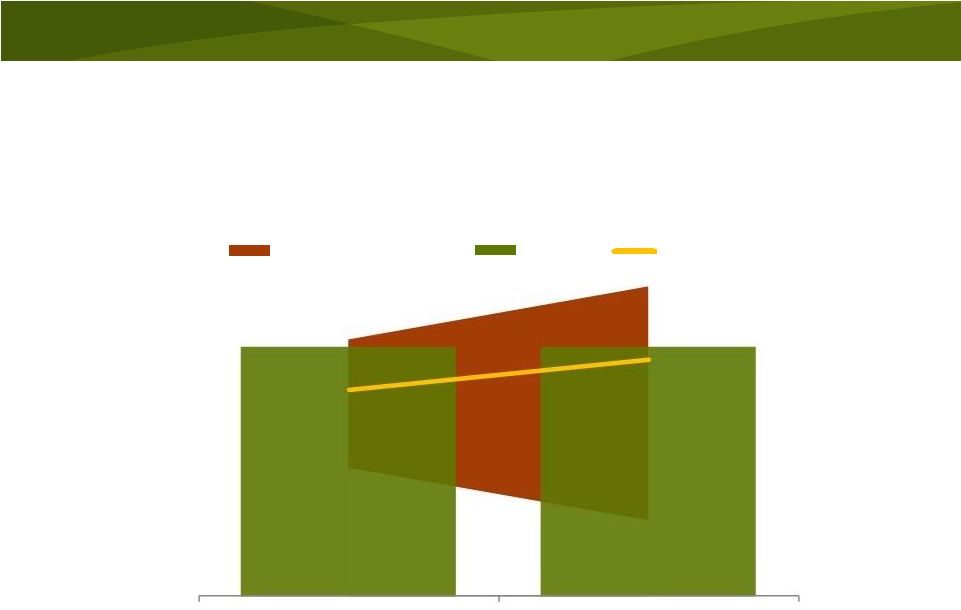 “Perfect storm” fall application season in NA 18 Source: IPNI, US Department of Commerce and Mosaic 0.0 1.0 2.0 3.0 4.0 5.0 6.0 7.0 Jul-Dec Jan-Jun Mil Tons KCL Implied North American MOP Shipments 5-Yr Min-Max Range 2010/11 5-Yr Average |
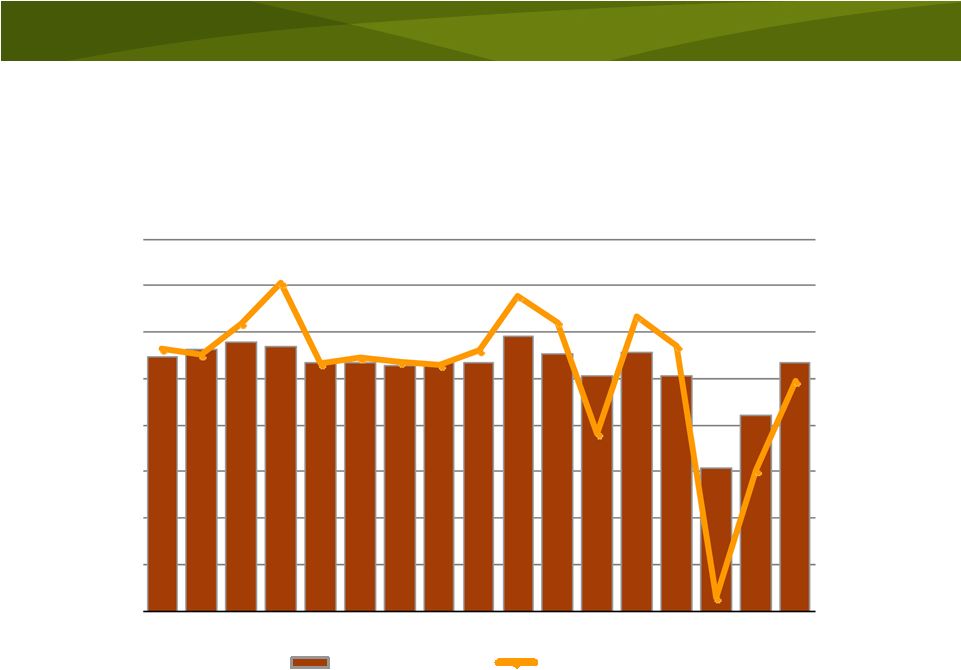
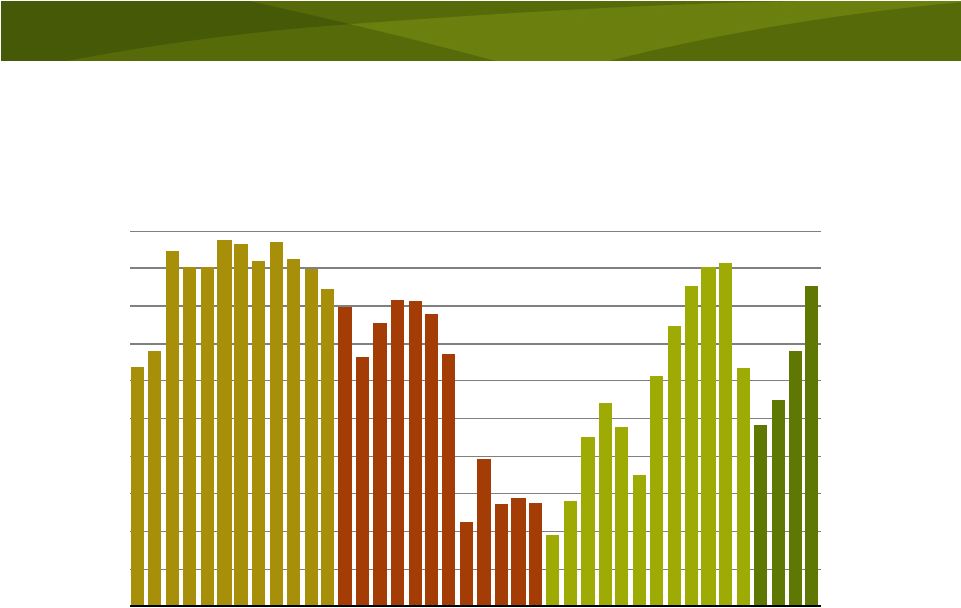
 Global production climbs in 2010 19 0 3 6 9 12 15 Q1 Q2 Q3 Q4 Q1 Q2 Q3 Q4 Q1 Q2 2008 2009 2010 Mil Tonnes KCL Global MOP Estimated Production Source: Fertecon, Company reports and Mosaic |
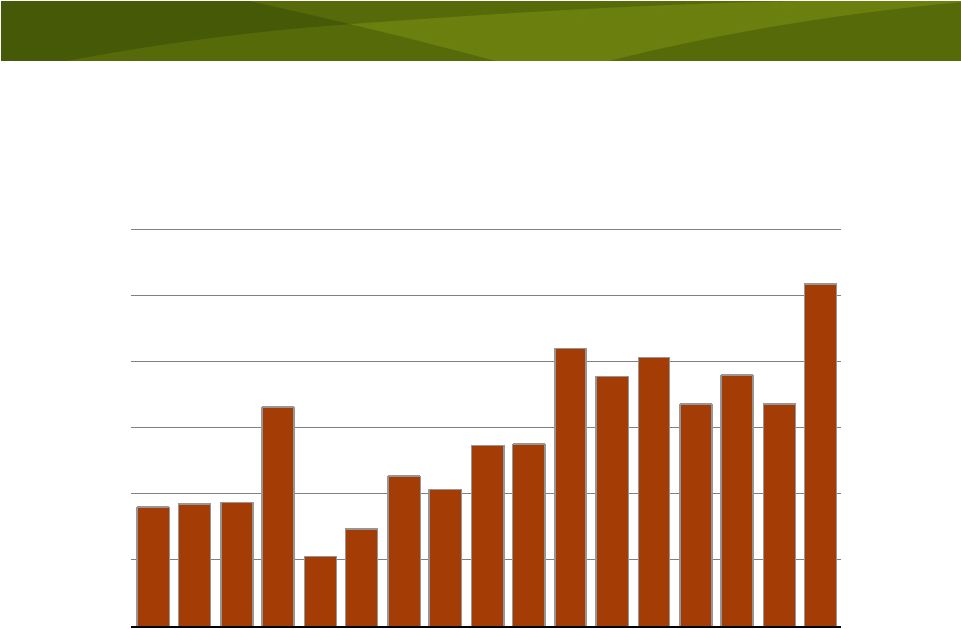
 NA production up 76% FY 2010/11 YTD 20 0.0 0.2 0.4 0.6 0.8 1.0 1.2 1.4 1.6 1.8 2.0 Jul 07/08 Oct Jan Apr Jul 08/09 Oct Jan Apr Jul 09/10 Oct Jan Apr Jul 10/11 Mil Tons KCL North American MOP Production Source: IPNI |
 Record NA imports expected in 2010/11 21 0.0 0.2 0.4 0.6 0.8 1.0 1.2 95 96 97 98 99 00 01 02 03 04 05 06 07 08 09 10 11F Mil Tons KCL North American MOP Imports Source: IPNI, USDOC, and Mosaic Fertilizer Year Ending June 30 |
 Demand pulls down NA producer inventories 22 0.0 0.5 1.0 1.5 2.0 2.5 3.0 3.5 4.0 4.5 Jul 07/08 Oct Jan Apr Jul 08/09 Oct Jan Apr Jul 09/10 Oct Jan Apr Jul 10/11 Mil Tons KCL North American MOP Producer Stocks Source: IPNI |
 Bottom Line • Potash demand drivers are strong – High agricultural commodity prices – Strong speculative interest – But solid underlying agricultural fundamentals – Positive farm economics/income worldwide – Lean K distribution pipeline – Low K levels in soils • Potash shipments are back on track – Global shipments forecast to increase to 48-49 MMT in 2010 and to 52-55 MMT in 2011 – Broad-based demand recovery – NA shipments forecast to climb to 10 MST in 2010/11 based on higher acreage and rate recovery – “Perfect Storm” fall season in NA but half of projected demand still ahead next spring • Producers struggled to keep up with peak shipments this fall • Market is expected to remain tight until new capacity comes online later this decade 23 |
 Near Term Potash Outlook Demand Pull Pressure (Again) Fertilizer Outlook and Technology Conference Savannah, GA November 17, 2010 Dr. Michael R. Rahm Vice President, Market and Strategic Analysis The Mosaic Company Thank You! |