 The Mosaic Company Jim Prokopanko, President and Chief Executive Officer Larry Stranghoener, Executive Vice President and Chief Financial Officer Mike Rahm, Vice President Market and Strategic Analysis Laura Gagnon, Vice President Investor Relations Earnings Conference Call – 1 st Quarter Fiscal 2012 Thursday, September 29, 2011 Exhibit 99.2 |
 Safe Harbor Statement 2 This presentation contains forward-looking statements within the meaning of the Private Securities Litigation Reform Act of 1995. Such statements include, but are not limited to, statements about future financial and operating results. Such statements are based upon the current beliefs and expectations of The Mosaic Company’s management and are subject to significant risks and uncertainties. These risks and uncertainties include but are not limited to the predictability and volatility of, and customer expectations about, agriculture, fertilizer, raw material, energy and transportation markets that are subject to competitive and other pressures and economic and credit market conditions; the level of inventories in the distribution channels for crop nutrients; changes in foreign currency and exchange rates; international trade risks; changes in government policy; changes in environmental and other governmental regulation, including greenhouse gas regulation and implementation of the U.S. Environmental Protection Agency’s numeric water quality standards for the discharge of nutrients into Florida lakes and streams; further developments in the lawsuit involving the federal wetlands permit for the extension of the Company’s South Fort Meade, Florida, mine into Hardee County, including orders, rulings, injunctions or other actions by the court or actions by the plaintiffs, the Army Corps of Engineers or others in relation to the lawsuit, or any actions the Company may identify and implement in an effort to mitigate the effects of the lawsuit; other difficulties or delays in receiving, or increased costs of, necessary governmental permits or approvals; further developments in the lawsuit involving the tolling agreement at the Company's Esterhazy, Saskatchewan, potash mine, including settlement or orders, rulings, injunctions or other actions by the court, the plaintiff or others in relation to the lawsuit; the effectiveness of our processes for managing our strategic priorities; adverse weather conditions affecting operations in Central Florida or the Gulf Coast of the United States, including potential hurricanes or excess rainfall; actual costs of various items differing from management’s current estimates, including among others asset retirement, environmental remediation, reclamation or other environmental regulation, or Canadian resource taxes and royalties; accidents and other disruptions involving Mosaic’s operations, including brine inflows at its Esterhazy, Saskatchewan potash mine and other potential mine fires, floods, explosions, seismic events or releases of hazardous or volatile chemicals, as well as other risks and uncertainties reported from time to time in The Mosaic Company’s reports filed with the Securities and Exchange Commission. Actual results may differ from those set forth in the forward-looking statements. |
 Outstanding Results Revenue $3.1 billion +41% Net income $526 million +77% EPS $1.17 +75% 3 |
 Quarterly Highlights • Best in class customer relationships • Potash – grow cash flow by increasing volume – Over $200 million cap ex in Q1 – Esterhazy K2 mill construction nearing completion • Phosphates – grow cash flow by optimizing return on invested capital – Operational excellence: 20% increase in mine production and higher shipments from Miski Mayo – High value products: MicroEssentials® volumes hit a new record, introduced Nexfos™, an innovative new feed product 4 |
 5 Mosaic included in the S&P 500 |
 The Mosaic Company Earnings Conference Call – 1 st Quarter Fiscal 2012 Thursday, September 29, 2011 |
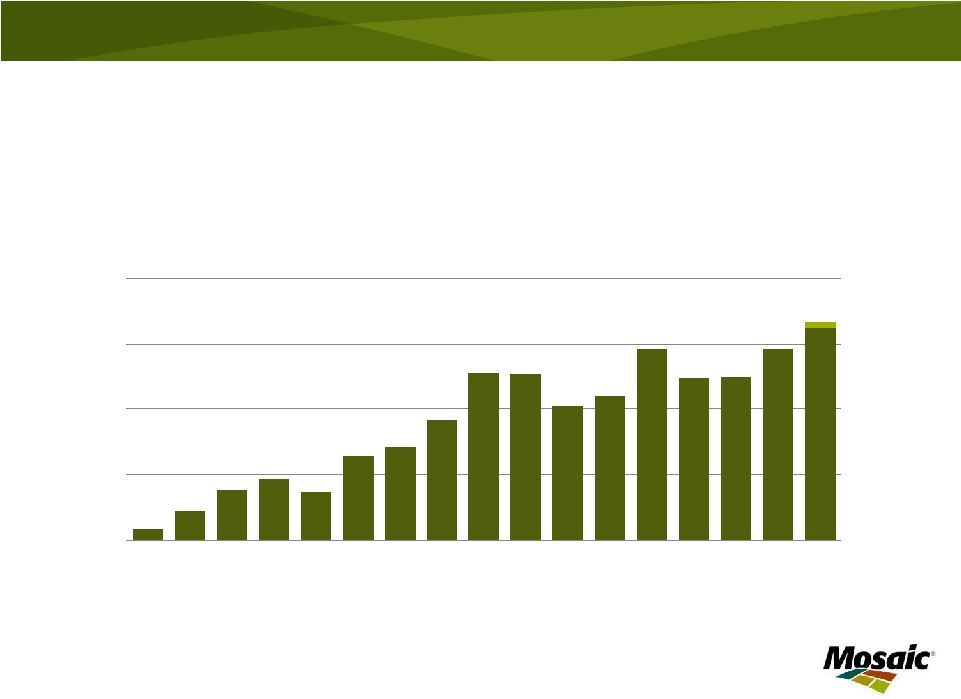
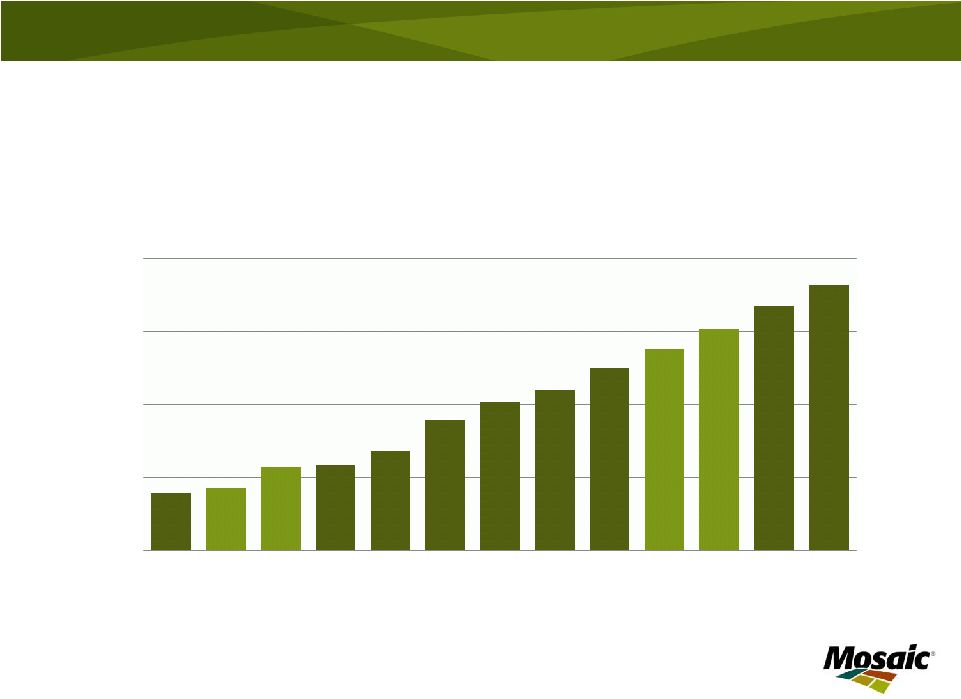 Accelerating Grain and Oilseed Use Source: USDA, lighter bars indicate recession years 7 0.7% 2.7% 0.2% 1.7% 3.7% 2.1% 1.4% 2.5% 2.1% 2.2% 2.4% 2.2% 2.0 2.2 2.4 2.6 2.8 99/00 00/01 01/02 02/03 03/04 04/05 05/06 06/07 07/08 08/09 09/10 10/11E 11/12F CROP YEAR WORLD GRAIN AND OILSEED USE BILLION TONNES |
 Stocks Remain at Low Levels Source: USDA 8 15% 20% 25% 30% 350 450 550 650 99/00 00/01 01/02 02/03 03/04 04/05 05/06 06/07 07/08 08/09 09/10 10/11E 11/12F CROP YEAR WORLD GRAIN AND OILSEED STOCKS MILLION TONNES Stocks Percent of Use PERCENT OF USE |
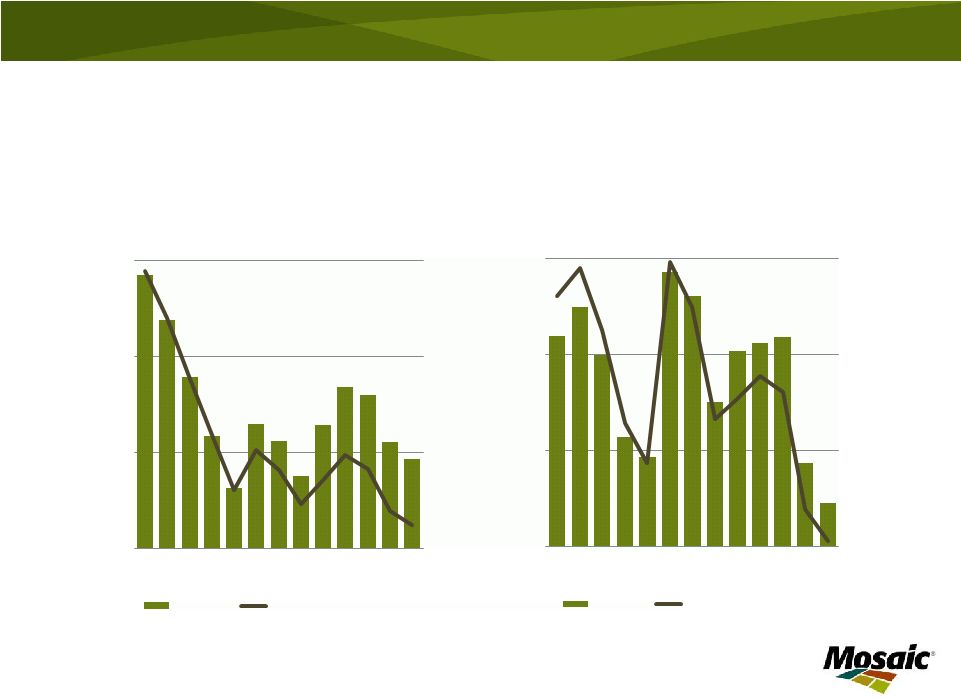 Second Lowest Corn Stock/Use Ratio Source: USDA 9 12% 19% 26% 33% 80 120 160 200 99/00 02/03 05/06 08/09 11/12F CROP YEAR WORLD CORN STOCKS MILLION TONNES Stocks Percent of Use PERCENT OF USE 5% 10% 15% 20% 0.4 1.0 1.6 2.2 99/00 02/03 05/06 08/09 11/12F CROP YEAR U.S. CORN STOCKS BILLION BUSHELS Stocks Percent of Use PERCENT OF USE |
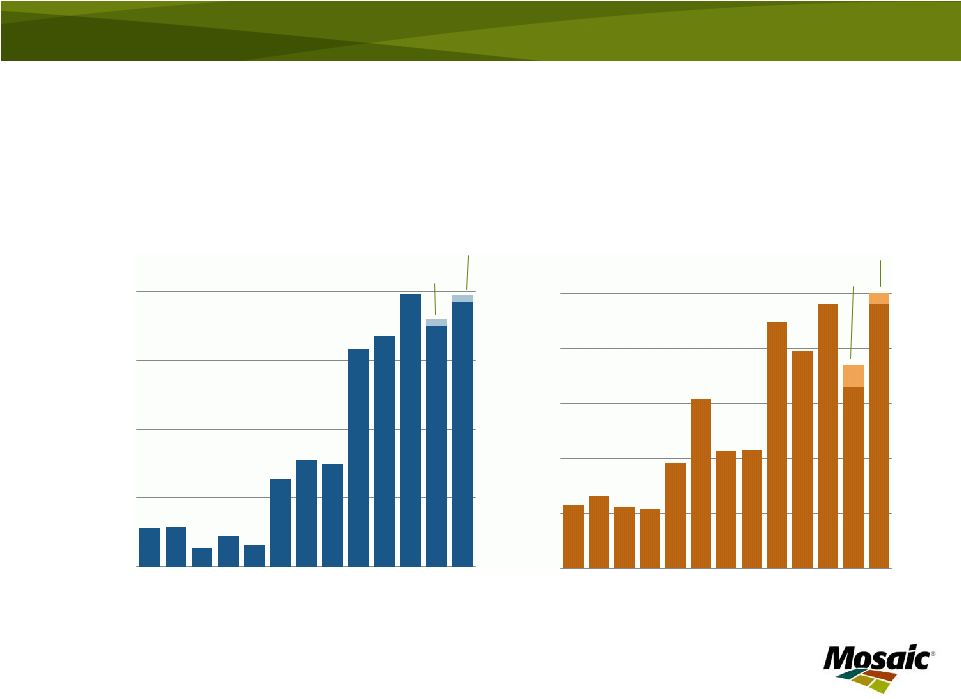
 Record Phosphate and Potash Demand 10 Source: Fertecon, IFA and Mosaic 52 47 58 60-61 62- 64 30 40 50 60 70 00 01 02 03 04 05 06 07 08 09 10 11F 12F CALENDAR YEAR WORLD PHOSPHATE SHIPMENTS MILLION TONNES DAP/MAP/TSP 51 31 53 56- 57 58- 60 25 35 45 55 65 00 01 02 03 04 05 06 07 08 09 10 11F 12F CALENDAR YEAR WORLD POTASH SHIPMENTS MILLION TONNES KCl |
 Record U.S. Net Cash Farm Income Source: USDA 11 0 20 40 60 80 100 120 95 96 97 98 99 00 01 02 03 04 05 06 07 08 09 10 11F CALENDAR YEAR U.S. NET CASH FARM INCOME BILLION $ |
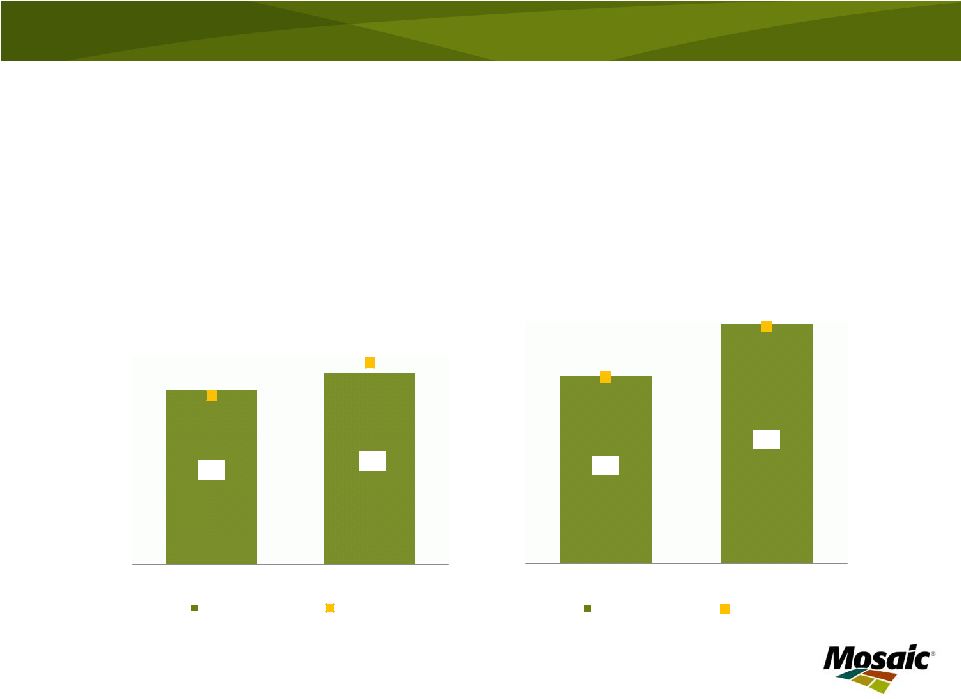 NA Phosphate and Potash Shipments 12 Source: TFI , USDOC, and Mosaic 4.5 4.9 0.0 1.0 2.0 3.0 4.0 5.0 6.0 7.0 Jun-Nov Dec-May IMPLIED NORTH AMERICAN PHOSPHATE SHIPMENTS MILLION TONS DAP/MAP/MES/TSP 2011/12 2010/11 4.7 6.1 0.0 1.0 2.0 3.0 4.0 5.0 6.0 7.0 Jun-Nov Dec-May IMPLIED NORTH AMERICAN POTASH SHIPMENTS MILLION TONS KCl 2011/12 2010/11 |
 Brazil Crop Nutrient Shipments Source: ANDA and Mosaic 13 24.6 22.4 22.5 24.6 26.2-26.7 10 15 20 25 30 95 96 97 98 99 00 01 02 03 04 05 06 07 08 09 10 11F CALENDAR YEAR BRAZIL CROP NUTRIENT SHIPMENTS MILLION TONNES PRODUCTS |
 Brazil Phosphate and Potash Imports Source: Fertecon and Mosaic 14 2.7 2.1 2.8 3.6-3.7 1.5 2.0 2.5 3.0 3.5 4.0 00 01 02 03 04 05 06 07 08 09 10 11F 12F CALENDAR YEAR BRAZIL PHOSPHATE IMPORTS MILLION TONNES DAP/MAP/TSP 6.5 3.4 6.0 6.8-7.0 7.0-7.2 2.5 3.5 4.5 5.5 6.5 7.5 00 01 02 03 04 05 06 07 08 09 10 11F 12F CALENDAR YEAR BRAZIL POTASH IMPORTS MILLION TONNES KCl |
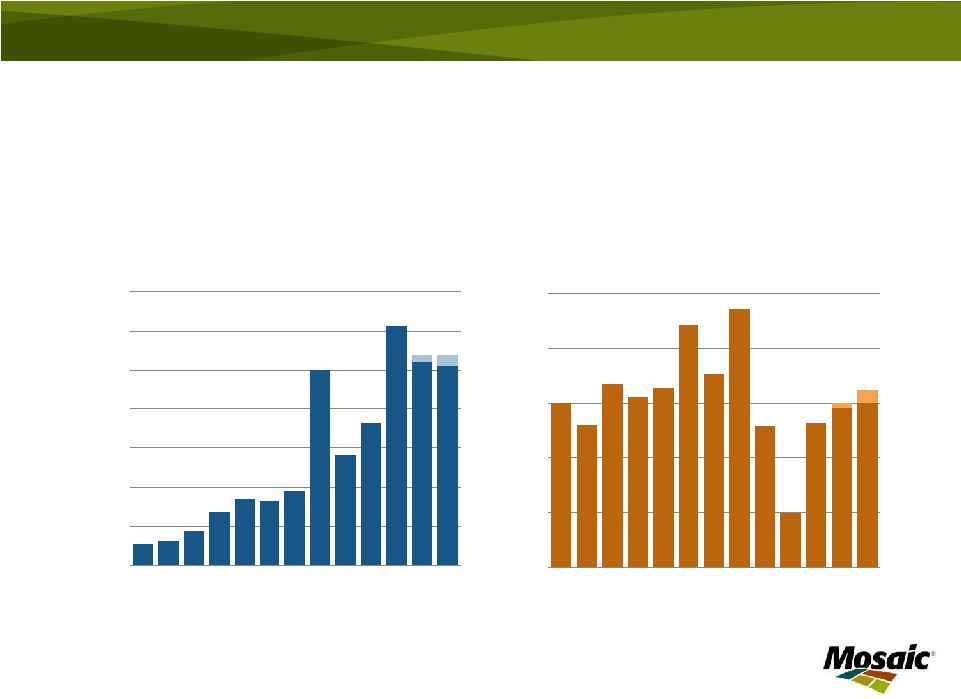
 India Phosphate and Potash Imports Source: Fertecon and Mosaic 15 6.3 6.7 7.9 7.0 -7.2 7.7-7.9 0.0 2.0 4.0 6.0 8.0 00 01 02 03 04 05 06 07 08 09 10 11F 12F CALENDAR YEAR INDIA PHOSPHATE IMPORTS MILLION TONNES DAP/MAP 6.0 5.4 6.3 4.8-5.2 6.3 - 6.5 1.5 2.5 3.5 4.5 5.5 6.5 00 01 02 03 04 05 06 07 08 09 10 11F 12F CALENDAR YEAR INDIA POTASH IMPORTS MILLION TONNES KCl |
 China Phosphate Exports / Potash Imports Source: Fertecon and Mosaic 16 2.8 3.6 6.1 5.2-5.4 5.1-5.4 0.0 1.0 2.0 3.0 4.0 5.0 6.0 7.0 00 01 02 03 04 05 06 07 08 09 10 11F 12F CALENDAR YEAR CHINA PHOSPHATE EXPORTS MILLION TONNES DAP/MAP/TSP 5.1 2.0 5.3 5.8-6.0 6.0-6.5 0.0 2.0 4.0 6.0 8.0 10.0 00 01 02 03 04 05 06 07 08 09 10 11F 12F CALENDAR YEAR CHINA POTASH IMPORTS MILLION TONNES KCl |
 The Mosaic Company Earnings Conference Call – 1 st Quarter Fiscal 2012 Thursday, September 29, 2011 |
 Net sales $3,083 $2,188 Gross margin $848 $505 % of net sales 28% 23% Net earnings attributable to Mosaic $526 $298 % of net sales 17% 14% Diluted EPS $1.17 $.67 Effective tax rate 28% 27% Net cash provided by operating activities $554 $556 Cash and cash equivalents as of August 31, 2011 & 2010 $4,038 $2,363 Financial Results 18 In millions, except per share amounts Three Months Ended 8/31/2011 8/31/2010 |
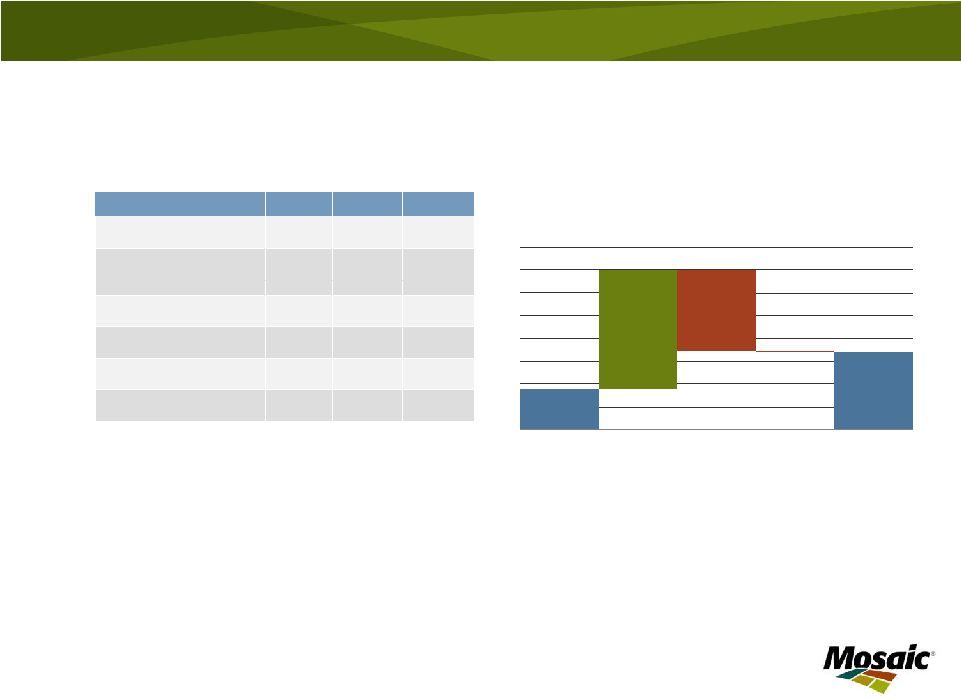
 Potash Segment Highlights 19 In millions, except MOP price Q1 FY12 Q4 FY11 Q1 FY11 Net sales $873 $982 $622 Gross Margin $444 $515 $257 % of net sales 51% 52% 41% Operating earnings $402 $469 $218 Sales volumes 1.8 2.2 1.7 Production volume 1.9 2.2 1.4 Avg MOP selling price $446 $404 $331 First quarter year over year highlights: • Operating earnings improvement due to increased selling prices and higher operating rates • Operating rate 81% vs. 62% a year ago • Continued progress with potash expansion program with first projects on-line. Esterhazy K3 site excavation underway, ground freezing set to begin later this year, K2 mill construction largely complete next quarter 0 50 100 150 200 250 300 350 400 450 500 Q1 FY11 OE Sales price Sales volumes Resource taxes Other Q1 FY12 OE OPERATING EARNINGS BRIDGE $ IN MILLIONS |
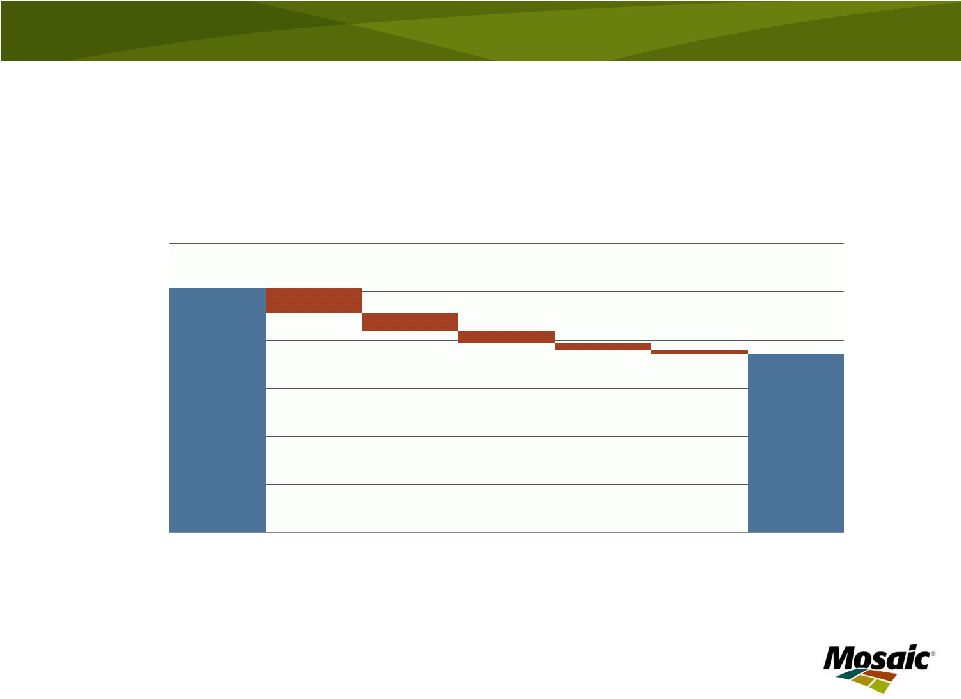
 Phosphates Segment Highlights 20 In millions, except DAP price Q1 FY12 Q4 FY11 Q1 FY11 Net sales $2,220 $1,882 $1,581 Gross Margin $410 $479 $245 % of net sales 18% 25% 15% Operating earnings $333 $370 $178 Sales volumes 3.2 2.8 3.1 NA production volume (a) 2.2 2.1 2.2 Avg DAP selling price $576 $574 $431 First quarter year over year highlights: • Increase in operating earnings due to higher selling prices, partially offset by higher raw material costs • Finished product operating rate of 89% comparable to a year ago • Phosphate rock production up 20 percent compared to a year ago (a) Includes crop nutrient dry concentrates and animal feed ingredients OPERATING EARNINGS BRIDGE $ IN MILLIONS 0 100 200 300 400 500 600 700 800 Q1 FY11 OE Sales Raw materials Other Q1 FY12 OE price |
 Phosphates Segment Gross Margin 21 (a): Sales mix impact a result of increased international sales 0% 5% 10% 15% 20% 25% 30% Q4 FY11 Sulfur and ammonia Sales mix (a) Operating costs Purchased phosphate rock Other Q1 FY12 GROSS MARGIN PERCENT BRIDGE PERCENT |
 Category Guidance Potash Q2 Sales volume 1.7 – 2.1 million tonnes Q2 MOP selling price $440 - $465 per tonne Q2 Operating rate between 80% and 90% Phosphates Q2 Sales volume 3.1 – 3.5 million tonnes Q2 DAP selling price $600 - $625 per tonne Q2 Operating rate above 85% Capital Expenditures $1.6 - $1.9 billion Canadian Resource Taxes and Royalties $420 – $470 million SG&A $400 – $430 million Effective Tax Rate Upper 20 percent range Financial Guidance – Fiscal 2012 22 |
 The Mosaic Company Thank you |
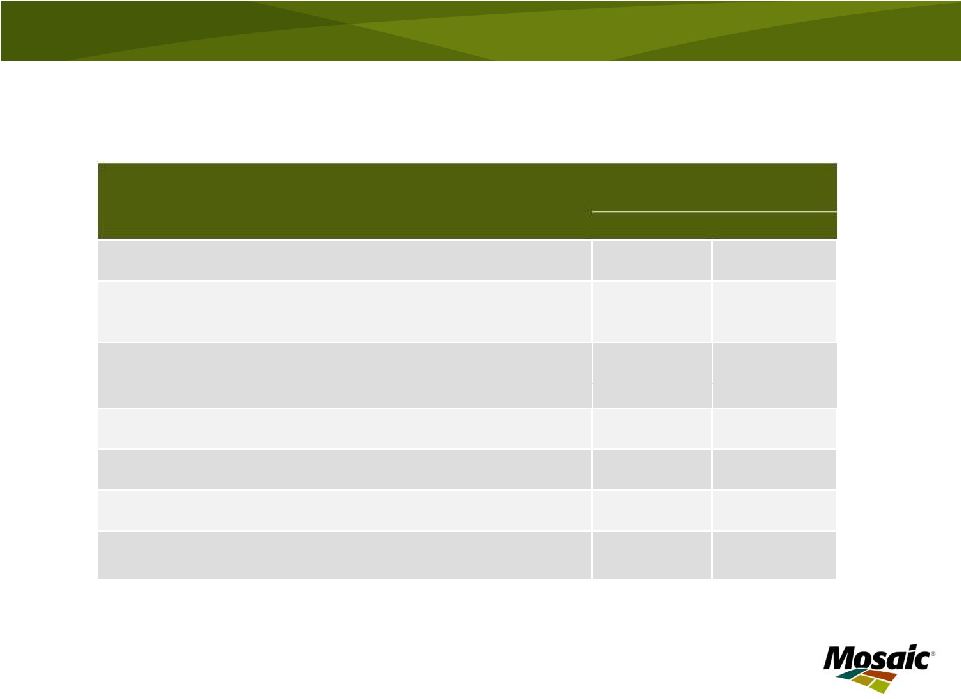
 Earnings Sensitivity to Key Drivers Change Estimated Change in Pre-Tax Earnings ($ in millions) Estimated Change in Annual EPS MOP Price ($/tonne) $50 $368 $0.59 Potash Volume (000 tonnes) 500 $157 $0.25 DAP Price ($/tonne) $50 $412 $0.66 Phosphates Volume (000 tonnes) 500 $92 $0.15 Sulfur ($/lt) $25 $173 $0.28 Ammonia ($/tonne) $25 $77 $0.12 Natural Gas ($/mmbtu) $1.00 $36 $0.06 (a) These factors do not change in isolation; actual results could vary from the above estimates 24 (a) |
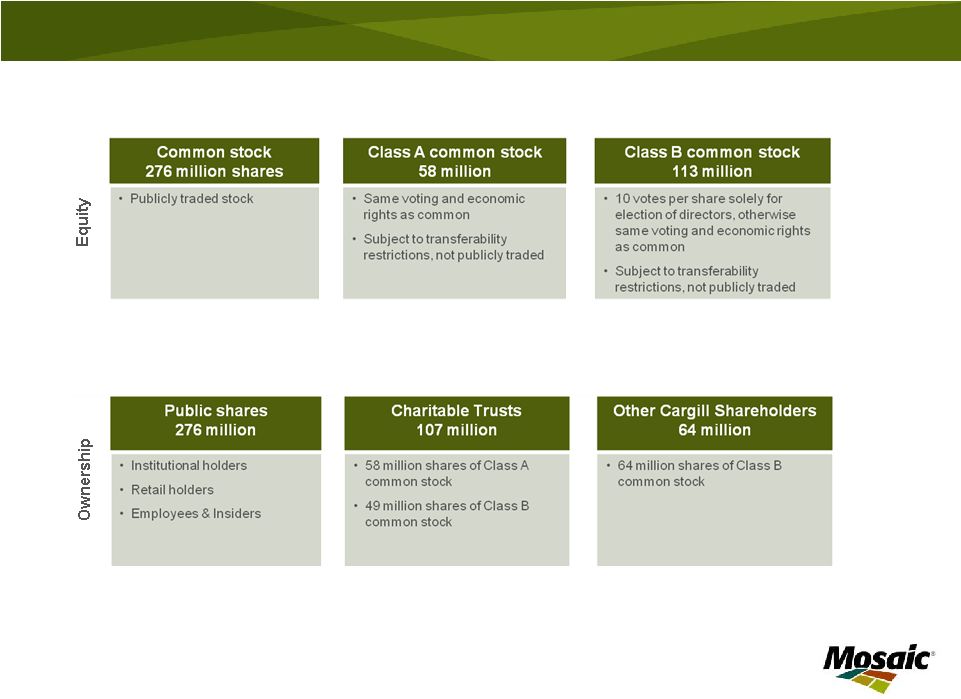 Share Ownership – Fiscal Year End 2011 The company’s proxy for the shareholder meeting October 6, 2011 contains a proposal to collapse the Class B shares into Class A shares Cargill, Incorporated does not own any Mosaic shares. Mosaic is facilitating an additional secondary offering for the trusts on September 23, 2011 for 20.7 million shares, which will then be held by the public 25 |
 Canadian Resource Taxes and Royalties • Saskatchewan imposes profit taxes, royalties and a resource surcharge on all potash producers. The calculation of these taxes is complex and subject to extensive tax regulations • Canadian resource taxes and royalties (CRT) make up a meaningful portion of Potash segment cost of goods sold. Due to the complexity of the calculations, we have historically provided total expense guidance for the current fiscal year • We have developed a model using publicly available data due to requests from investors to help them understand potential long-term implications. This model makes a number of simplifying assumptions • There will be considerable volatility in actual results as compared to estimates. Taxes are paid on a calendar year basis while we report results on a fiscal year basis. Quarterly volatility is driven by the use of full year estimates in the accrual process • The example on the following slide uses fiscal year 2011 actual results to illustrate 26 |
 CRT Model 27 • Model using actual FY 2011 year end results to illustrate: $ in millions FY 2011 Actual Potash segment gross margin , excluding CRT $ 1,763 Add back depreciation 189 Capital expenditures 907 Subtract 120% of capex Estimated taxable profit $ Estimate CRT between 30% and 35% of taxable profit @ 30% @ 35% Compare to actual CRT of $294 Note: Totals may not add due to rounding 1,952 (1,088) 864 259 302 $ |
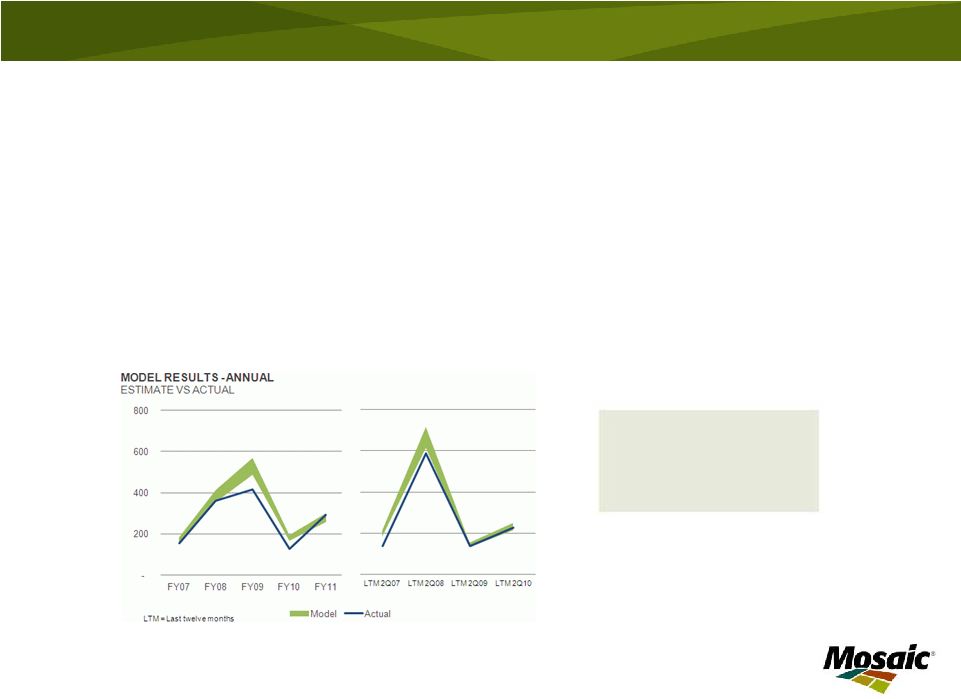 Backtesting • We tested the model against two time periods: 1) fiscal year end, and 2) last twelve months ended November 30 • The model using period end November 30 results in less estimate error, as the period more closely matches the Canadian tax period of calendar year • Note that FY09 and FY10 model results skewed by effect of accrual process under volatile market conditions • The model was developed to work better with high levels of capital spending 28 Average of reported CRT 271 Average model estimate @30% rate 286 @35% rate 333 |
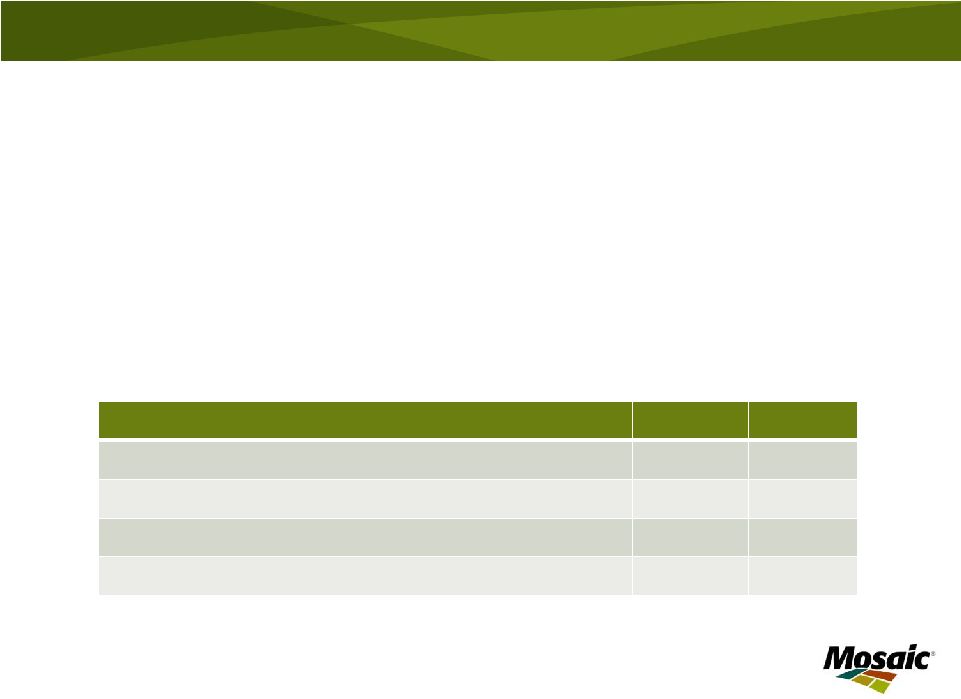 Accruals and Quarterly Estimations • Quarterly CRT can be volatile if the estimate of full year gross profits changes. An approximation of the quarterly accrual can be made by recognizing the following: – The company strives to have accurate year-to-date accruals – The impact of changes in gross profit assumptions for the full year, will be reflected in the current quarter • The chart below shows the impact of changing your estimated gross profit for the full year, if that change were to occur after the first quarter accrual, but before the second quarter accrual 29 Impact of changing estimates Quarter 1 Quarter 2 End of period estimated annual tax liability $100 $120 Beginning of period accruals $0 $25 Updated YTD accruals $25 $60 Accrual in the quarter $25 $35 Simplified example to show the effect of changing full year profit on accruals |