Exhibit 99.1


Market Mosaic is a newsletter published for our customers, suppliers and stakeholders by the Market and Strategic Analysis group
of The Mosaic Company. This issue recaps our assessment of the near term outlook for agricultural commodity and plant nutrient markets.
Michael R. Rahm
Vice President Market and Strategic Analysis
Luis F. Dowling
Sr. Market Analyst
Josh Paula
Sr. Market Analyst
Mathew Philippi
Market Analyst
Yogi Berra managed the New York Yankees to their 29th American League pennant in 1964 (they would not win another until 1976). During one of the games that season, Yogi reportedly looked down the bench at a group of restless reserves and ordered them to pay attention, noting that “you can observe a lot by watching”!
Well, after watching recent developments in agricultural commodity and plant nutrient markets, we make several observations about the current situation and near term outlook.
Observation #1 - $7.15 Corn Did the Job
A key question following the devastating drought last summer was how high corn prices would need to increase in order to allocate the short crop to its highest valued uses. We noted in the Summer 2012 issue of Market Mosaic that the market clearing price would hinge largely on the final estimates of the 2012 U.S. and Russian crops, oil and gasoline prices, livestock prices and the size of the 2012/13 Southern Hemisphere harvest.
Several savvy traders and experienced analysts had predicted that $10 corn was needed. That certainly was one of many plausible scenarios. However, it looks like $7.15 corn did the job — that is the average of the daily closing price of the front month corn contract from October 1, 2012 through April 30, 2013. This price ranged from a high of $7.73 per bushel on October 11, 2012 to a low of $6.29 per bushel on April 5, 2013.
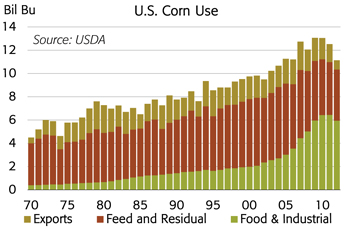
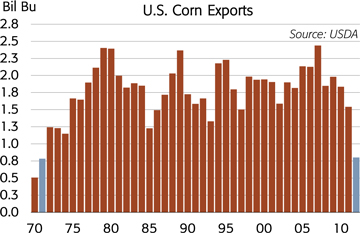
Elevated corn prices are destroying demand this crop year. The latest USDA estimates indicate that U.S. corn use will total 11.14 billion bushels in 2012/13, 1.55 billion less than the five year average and 1.93 billion less than the peak of 13.07 billion in 2009/10. All categories of use are down from last year, but the plunge in U.S. corn exports is noteworthy. The latest USDA estimates show that U.S. exports are projected to drop to just 800 million bushels during the crop year ending August 31, down 48% or more than 740 million bushels from 2011/12 and off an incredible 67% or 1.64 billion bushels from the 2007/08 record. If the current USDA projection is on target, U.S. corn exports this year would rank as the lowest since 1971/72, depicted by the two blue bars on the chart. Furthermore, based on export sales so far this year and given prospects of a record second crop in Brazil, it looks increasingly unlikely that U.S. corn exports will hit even this low forecast.
– continued inside
| | | | | | | | | | | | | | | | | | | | | | | | | | | | | | | | |
| | | U.S. Corn Supply/Demand Balance Sheet | |
| | | | | | | | |
Mil Bu unless noted | | 05/06 | | | 06/07 | | | 07/08 | | | 08/09 | | | 09/10 | | | 10/11 | | | 11/12 | | | 12/13 | |
Acreage and Yield | | | | | | | | | | | | | | | | | | | | | | | | | | | | | | | | |
Planted (mil acres) | | | 81.8 | | | | 78.3 | | | | 93.5 | | | | 86.0 | | | | 86.4 | | | | 88.2 | | | | 91.9 | | | | 97.2 | |
Harvested (mil acres) | | | 75.1 | | | | 70.6 | | | | 86.5 | | | | 78.6 | | | | 79.5 | | | | 81.4 | | | | 84.0 | | | | 87.4 | |
Yield (bu/acre) | | | 147.9 | | | | 149.1 | | | | 150.7 | | | | 153.9 | | | | 164.7 | | | | 152.8 | | | | 147.2 | | | | 123.4 | |
Harvested Ratio (%) | | | 91.9 | % | | | 90.2 | % | | | 92.5 | % | | | 91.4 | % | | | 92.0 | % | | | 92.4 | % | | | 91.4 | % | | | 89.9 | % |
| | | | | | | | |
Supply | | | | | | | | | | | | | | | | | | | | | | | | | | | | | | | | |
Beginning Stocks | | | 2,114 | | | | 1,967 | | | | 1,304 | | | | 1,624 | | | | 1,673 | | | | 1,708 | | | | 1,128 | | | | 989 | |
Production | | | 11,112 | | | | 10,531 | | | | 13,038 | | | | 12,092 | | | | 13,092 | | | | 12,447 | | | | 12,360 | | | | 10,780 | |
Imports | | | 9 | | | | 12 | | | | 20 | | | | 14 | | | | 8 | | | | 28 | | | | 29 | | | | 125 | |
Total | | | 13,235 | | | | 12,510 | | | | 14,361 | | | | 13,729 | | | | 14,773 | | | | 14,182 | | | | 13,516 | | | | 11,894 | |
| | | | | | | | |
Use | | | | | | | | | | | | | | | | | | | | | | | | | | | | | | | | |
Feed & Residual | | | 6,115 | | | | 5,540 | | | | 5,858 | | | | 5,182 | | | | 5,125 | | | | 4,795 | | | | 4,545 | | | | 4,400 | |
FIS | | | 3,019 | | | | 3,541 | | | | 4,442 | | | | 5,025 | | | | 5,961 | | | | 6,425 | | | | 6,439 | | | | 5,937 | |
Ethanol for Fuel | | | 1,603 | | | | 2,119 | | | | 3,026 | | | | 3,709 | | | | 4,591 | | | | 5,019 | | | | 5,011 | | | | 4,550 | |
Exports | | | 2,134 | | | | 2,125 | | | | 2,437 | | | | 1,849 | | | | 1,980 | | | | 1,834 | | | | 1,543 | | | | 800 | |
Total | | | 11,268 | | | | 11,207 | | | | 12,737 | | | | 12,056 | | | | 13,066 | | | | 13,055 | | | | 12,527 | | | | 11,137 | |
| | | | | | | | |
Ending Stocks | | | 1,967 | | | | 1,304 | | | | 1,624 | | | | 1,673 | | | | 1,708 | | | | 1,128 | | | | 989 | | | | 757 | |
Stocks as % of Use | | | 17.5 | % | | | 11.6 | % | | | 12.8 | % | | | 13.9 | % | | | 13.1 | % | | | 8.6 | % | | | 7.9 | % | | | 6.8 | % |
Source: USDA
Observation #2 – But Demand is Pent-Up
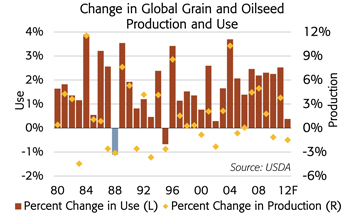
Short supplies and higher agricultural commodity prices clearly are constraining demand growth this year. For example, global grain and oilseed use increased at a compound annual growth rate of 2.3% or about 60 million tonnes per year during the last five crop years, but growth is projected to grind nearly to a halt this year. The latest USDA statistics indicate that global demand will increase just 0.4% or only 10 million tonnes in 2012/13.
We noted at the time of the Great Global Recession that world grain and oilseed demand growth slowednot during economic downturns but rather only when constrained by a short crop and low inventories. History also demonstrates that customers typically unleash this pent-up demand during the following crop year as long as supplies rebound and agricultural commodity prices moderate.


The 1988/89 crop year is a good analog, but the chart below shows that there are several others. Global grain and oilseed production declined 3.1% and use dropped 1.1% in 1988/89. Grain and oilseed use surged 3.5% the following year fueled by a 7.6% rebound in production and a moderation in agricultural commodity prices in 1989/90. In the case of corn, the average of the daily closing price of the front month contract jumped 23% to $2.68 per bushel in 1988/89 due to the short crop but then moderated 5% to $2.54 per bushel in 1989/90.
If supplies recover and agricultural commodity prices moderate in 2013/14, we expect a large rebound in global grain and oilseed demand. The key question this crop year was how high would prices have to increase to destroy significant demand. The key question next year likely will be how low will prices have to drop in order to unleash large pent-up demand.
Observation #3 – Summer Weather Matters the Most
Analysts continue to assess and re-assess the impact of recent weather events such as the lingering drought in some regions and the prospect of a very late spring in other areas on North American yields this year. However, the overwhelming conclusion from a close look at the data is that summer weather matters the most in terms of determining yields.
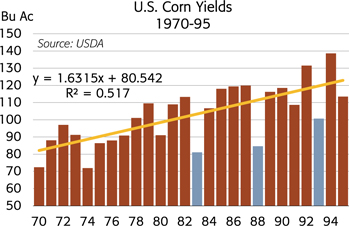
In the case of corn, there simply is no empirical evidence to support the hypothesis that a severe drought negatively impacts the average yield during the following year. The best analog years in the United States are 1983, 1988 and 1993 and the chart shows that the average yield rebounded back to trend or higher in each year following these devastating droughts.
In addition, there is no empirical evidence to support the hypothesis that planting date has a significant impact on yields. In the case of corn, the rule of thumb that U.S. yields decline about one bushel per acre for each day that planting is delayed after mid-May no doubt holds true,ceteris paribus or other things equal, but everyone (especially an economist) knows that other things rarely remain equal. Data for both the United States and Illinois show there is no correlation between the percentage of corn planted by the second week of May (Crop Progress report week 19) and the percentage deviation from trend yield since 1980.
Two recent years are prime examples of “exceptions that disprove the rule”. The 2009 planting season was extremely late. In fact, I visited one of our biggest customers in central Illinois on May 13, 2009. Central Illinois looked like Lake Michigan as I drove in torrential rain to the Peoria airport. According to USDA statistics, just 10% of the Illinois corn crop was planted at the time. However, it stopped raining, farmers eventually completed planting by the second week of June, the summer growing season was ideal, and Illinois farmers harvested a bumper corn crop that averaged a near record 174 bushels per acre or 10% greater than the 2009 trend yield.
By contrast, Illinois farmers completed planting 95% of their corn by mid-May in 2012. In fact, almost 80% of the corn was planted by the end of April last year. However, the severe drought last summer ravaged the Illinois corn crop and the state average yield was just 105 bushels per acre or 36% less than the 2012 trend yield.
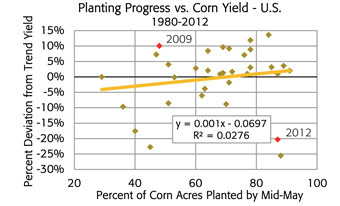
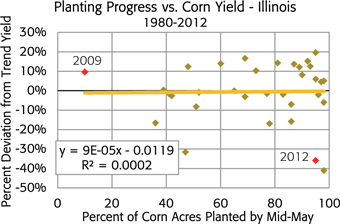


So, our observation is that summer weather – including rainfall, growing degree days and average nighttime temperatures — will remain the key determinant of yields this year. Unfortunately for grain traders that means another summer of whiskey and The Weather Channel!
Observation #4 – No Drought Impact on Domestic P&K Shipments . . .
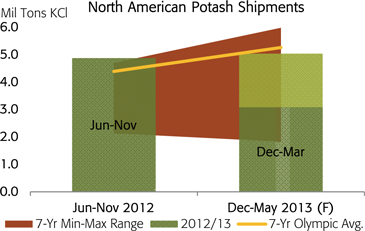
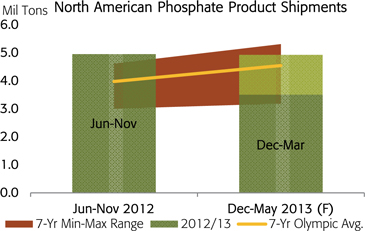
Industry statistics so far this fiscal year leave no doubt that North American P&K shipments will rebound sharply in 2012/13, despite concerns by some analysts that last summer’s severe drought would cause a large drop in shipments this year. Combined shipments of the main phosphate products (DAP, MAP, MES and TSP) and muriate of potash (MOP) totaled 16.4 million tons during the first 10 months of our fiscal year (Jun-Mar), up 15% or 2.1 million tons from the same period a year earlier.
Shipments during the fall application season (Jun-Nov) jumped to 9.8 million tons, the largest by a long shot since the formation of Mosaic in 2004. Both phosphate and potash shipments last fall exceeded the top end of the seven-year range due to the long application window, a highly favorable ratio of P&K prices to crop prices, and record farm income (including large crop insurance proceeds).
North American Domestic Potash Shipments
1,000 Tons KCl
| | | | | | | | | | | | | | | | | | | | | | | | | | | | | | | | | | | |
| | | | | Act. | | | | Act. | | | | Proj. | | |
| Fiscal | | Shpmts | | Shpmts | | 12/13 | | Shpmts | | 12/13 | | Shpmts | | 12/13 |
Year | | Jun-May | | Jun-Nov | | % Chg | | Dec-Mar | | % Chg. | | Apr-May | | % Chg. |
05/06 | | | | 9,050 | | | | | 4,355 | | | | | 12 | % | | | | 2,849 | | | | | 8 | % | | | | 1,846 | | | | | 6 | % |
06/07 | | | | 11,205 | | | | | 4,376 | | | | | 11 | % | | | | 4,080 | | | | | -24 | % | | | | 2,749 | | | | | -29 | % |
07/08 | | | | 10,653 | | | | | 4,698 | | | | | 4 | % | | | | 3,596 | | | | | -14 | % | | | | 2,359 | | | | | -17 | % |
08/09 | | | | 5,764 | | | | | 3,953 | | | | | 23 | % | | | | 1,236 | | | | | 150 | % | | | | 574 | | | | | 240 | % |
09/10 | | | | 7,671 | | | | | 2,112 | | | | | 131 | % | | | | 3,920 | | | | | -21 | % | | | | 1,639 | | | | | 19 | % |
10/11 | | | | 10,681 | | | | | 4,701 | | | | | 4 | % | | | | 3,773 | | | | | -18 | % | | | | 2,207 | | | | | -12 | % |
11/12 | | | | 8,708 | | | | | 4,577 | | | | | 7 | % | | | | 2,397 | | | | | 29 | % | | | | 1,734 | | | | | 12 | % |
12/13 | | | | 9,912 | | | | | 4,876 | | | | | na | | | | | 3,087 | | | | | na | | | | | 1,950 | | | | | na | |
| | | | | | | | | | | | | | | | | | | | | | | | | | | | | | | | | | | |
7-yr Oly Avg. | | | | 9,353 | | | | | 4,392 | | | | | 11 | % | | | | 3,307 | | | | | -7 | % | | | | 1,957 | | | | | 0 | % |
Source: IPNI, Dept. of Commerce, and Mosaic
North American Domestic Phosphate Shipments
1,000 Tons DAP/MAP/MES/TSP
| | | | | | | | | | | | | | | | | | | | | | | | | | | | | | | | | | | |
| | | | | Act. | | | | Act. | | | | Proj. | | |
| Fiscal | | Shpmts | | Shpmts | | 12/13 | | Shpmts | | 12/13 | | Shpmts | | 12/13 |
Year | | Jun-May | | Jun-Nov | | % Chg | | Dec-Mar | | %Chg. | | Apr-May | | % Chg. |
05/06 | | 8,189 | | | | 3,778 | | | | | 31 | % | | | | 2,730 | | | | | 28 | % | | | | 1,682 | | | | | -15 | % |
06/07 | | 8,472 | | | | 3,628 | | | | | 37 | % | | | | 3,307 | | | | | 6 | % | | | | 1,537 | | | | | -7 | % |
07/08 | | 9,489 | | | | 4,615 | | | | | 7 | % | | | | 3,161 | | | | | 11 | % | | | | 1,712 | | | | | -17 | % |
08/09 | | 6,157 | | | | 2,988 | | | | | 66 | % | | | | 2,123 | | | | | 65 | % | | | | 1,047 | | | | | 36 | % |
09/10 | | 8,121 | | | | 3,585 | | | | | 38 | % | | | | 3,077 | | | | | 14 | % | | | | 1,459 | | | | | -2 | % |
10/11 | | 9,661 | | | | 4,343 | | | | | 14 | % | | | | 3,990 | | | | | -12 | % | | | | 1,328 | | | | | 7 | % |
11/12 | | 9,027 | | | | 4,552 | | | | | 9 | % | | | | 2,803 | | | | | 25 | % | | | | 1,672 | | | | | -15 | % |
12/13 | | 9,890 | | | | 4,961 | | | | | na | | | | | 3,505 | | | | | na | | | | | 1,424 | | | | | na | |
7-yr Oly Avg. | | 8,660 | | | | 3,977 | | | | | 25 | % | | | | 3,015 | | | | | 16 | % | | | | 1,536 | | | | | -7 | % |
Source: TFI, Dept. of Commerce, and Mosaic
Observation #5 – . . . But the Pace Has Differed Since Last Fall
The pace of shipments has differed by nutrient since last fall (Dec-Mar). As a result, the volumes left to ship during the last two months of our fiscal year (Apr-May), assuming our demand forecasts are on target, also differ by nutrient.
For the entire fiscal year, we project that P&K shipments will reach 19.8 million tons in 2012/13, up 12% or almost 2.1 million tons from last year. Given that 16.4 million tons have shipped during the first 10 months of the year, 3.4 million tons need to ship in April and May to meet projected demand. That is roughly the same as last year and about 100,000 tons less than the average for these two months, but volumes differ for P and K.
In the case of phosphate, the latest industry statistics indicate that momentum from last fall carried through the long North American winter. In fact, shipments from December through March totaled 3.50 million tons, up 25% from the same period last year and up 16% from the average for this period.
Statistics for the first 10 months of our fiscal year indicate that the mother lode of phosphate shipments has occurred and, if our forecast for the year is on target, 1.42 million tons need to ship during the last two months of our fiscal year to meet projected demand. That still is respectable volume but it would be down 15% from last year and off 7% from the average for these two months.
The numbers indicate that producers and distributors loaded the channel early for several reasons including fears of navigation restrictions on the Mississippi River due to extremely low water levels. Those fears still look justified today, but now due to flooding and high water levels!
In the case of potash, domestic shipments this winter were up from the low levels a year earlier but movement was less than average. In particular, shipments from December through March totaled 3.09 million tons, up 29% from the same period last year but down 7% from the average for this period. As a result, if our forecast for the year is on target, 1.95 million tons need to ship during the last two months of our fiscal year in order to meet projected demand (and shipments in April were not spectacular). That would be up 12% from last year and in line with the average for these two months. The implication, if our demand forecasts are on target, is that domestic potash shipments will end the year fast and furious, especially if remaining shipments are compressed into the first half of May.
Our demand and shipment forecasts for 2012/13 assume that U.S. farmers will plant 96.8 million acres of corn, 77.6 million acres of soybeans and 56.4 million acres of wheat this year and will apply P&K at rates in line or slightly lower than estimates for last year. We assume a late spring will cause farmers to plant slightly less corn and more soybeans than indicated in the Prospective Plantings survey that was conducted during the first half of March.
Observation #6 – The Rebound in Global Potash Shipments is Underway
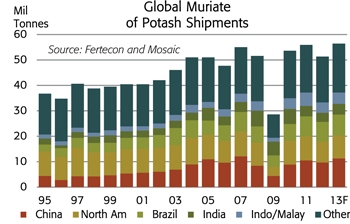
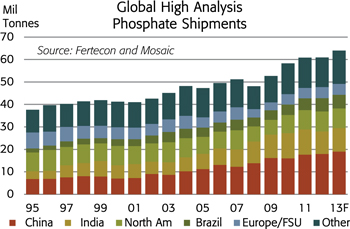
We maintain our forecasts of record global phosphate and potash shipments in 2013. Shipments of the main phosphate products are projected to increase to 63 to 65 million tonnes and muriate of potash shipments are projected to rebound to 55 to 57 million tonnes this year. The tables detail our most recent forecasts by region and key country.
The projected rebound in global potash shipments is well underway. In fact, our current point estimate is in the upper one-half of this range as a result of larger than expected base load contracts with Chinese and Indian customers as well as strong demand prospects in most of the other key consuming countries.
High Analysis Phosphate Shipment Forecasts
| | | | | | | | | | | | | | | | | | | | |
| | | 2012 | | | 2013 | |
| DAP/MAP/MES/TSP | | Act. | | | Jan. Forecast | | | Apr. Forecast | |
Mil Tonnes | | | Low | | | High | | | Low | | | High | |
Asia and Oceania | | | 34.8 | | | | 36.1 | | | | 37.2 | | | | 36.4 | | | | 37.4 | |
China | | | 18.0 | | | | 18.8 | | | | 19.0 | | | | 18.9 | | | | 19.1 | |
India | | | 10.0 | | | | 9.8 | | | | 10.3 | | | | 10.2 | | | | 10.6 | |
Pakistan | | | 1.3 | | | | 1.4 | | | | 1.5 | | | | 1.4 | | | | 1.5 | |
Australia | | | 1.3 | | | | 1.4 | | | | 1.5 | | | | 1.3 | | | | 1.4 | |
Other Asia and Oceania | | | 4.2 | | | | 4.9 | | | | 5.1 | | | | 4.7 | | | | 4.9 | |
Europe and FSU | | | 5.0 | | | | 4.8 | | | | 5.0 | | | | 4.8 | | | | 5.0 | |
Latin America | | | 8.7 | | | | 9.3 | | | | 9.9 | | | | 9.1 | | | | 9.5 | |
Brazil | | | 5.9 | | | | 5.9 | | | | 6.1 | | | | 6.0 | | | | 6.2 | |
Argentina | | | 1.0 | | | | 1.2 | | | | 1.3 | | | | 1.1 | | | | 1.2 | |
Chile | | | 0.3 | | | | 0.3 | | | | 0.4 | | | | 0.3 | | | | 0.4 | |
Other Latin America | | | 1.5 | | | | 1.9 | | | | 2.1 | | | | 1.7 | | | | 1.8 | |
North America | | | 8.9 | | | | 8.6 | | | | 8.8 | | | | 8.7 | | | | 8.9 | |
Other | | | 3.5 | | | | 4.2 | | | | 4.3 | | | | 4.2 | | | | 4.2 | |
| | | | | | | | | | | | | | | | | | | | |
World Total | | | 60.9 | | | | 62.9 | | | | 65.1 | | | | 63.1 | | | | 65.0 | |
Source: CRU/Fertecon and Mosaic
Muriate of Potash Shipment Forecasts
| | | | | | | | | | | | | | | | | | | | |
| | | 2012 | | | 2013 | |
| KCl | | Act. | | | Jan. Forecast | | | Apr. Forecast | |
Mil Tonnes | | | Low | | | High | | | Low | | | High | |
Asia/Oceania | | | 21.2 | | | | 22.8 | | | | 23.9 | | | | 23.8 | | | | 24.9 | |
China | | | 9.7 | | | | 10.7 | | | | 10.9 | | | | 11.2 | | | | 11.4 | |
India (CY) | | | 3.6 | | | | 3.2 | | | | 3.7 | | | | 4.0 | | | | 4.5 | |
India FY Beginning April 1 | | | 2.6 | | | | 3.6 | | | | 4.1 | | | | 3.7 | | | | 4.2 | |
Indonesia/Malaysia | | | 4.1 | | | | 4.5 | | | | 4.7 | | | | 4.3 | | | | 4.5 | |
Other Asia/Oceania | | | 3.9 | | | | 4.4 | | | | 4.6 | | | | 4.3 | | | | 4.5 | |
Europe/FSU | | | 10.1 | | | | 11.2 | | | | 11.4 | | | | 10.5 | | | | 10.7 | |
Latin America | | | 10.2 | | | | 10.5 | | | | 10.9 | | | | 10.7 | | | | 11.1 | |
Brazil | | | 7.8 | | | | 8.2 | | | | 8.4 | | | | 8.2 | | | | 8.4 | |
Other Latin America | | | 2.3 | | | | 2.3 | | | | 2.5 | | | | 2.5 | | | | 2.7 | |
North America | | | 8.2 | | | | 9.1 | | | | 9.3 | | | | 8.9 | | | | 9.1 | |
Other | | | 1.7 | | | | 1.5 | | | | 1.7 | | | | 1.4 | | | | 1.6 | |
| | | | | | | | | | | | | | | | | | | | |
World Total | | | 51.4 | | | | 55.1 | | | | 57.2 | | | | 55.3 | | | | 57.4 | |
Source: CRU/Fertecon and Mosaic
Chinese buyers have contracted more than 3.1 million tonnes of potash via vessel delivery during the first half of 2013 (including optional tonnage). Assuming rail imports of 200,000 to 250,000 tonnes per month, total imports during the first half of 2013 likely will reach 4.0 to 4.5 million tonnes. China Customs statistics show that, following monster arrivals in March, imports reached 1.7 million tonnes KCl during the first quarter and the bulk of contracted tonnage is scheduled to arrive during the second quarter. Imports are projected to increase to 7.0 million tonnes in 2013, up from 6.3 million last year.

The situation in India remains problematic due to the lower subsidy and sharply higher retail potash prices. However, we estimate that India has contracted more than 4.2 million tonnes for delivery through January 2014 and some analysts expect that this total could rise to around 4.5 million tonnes. We now project that imports will top the 4.0 million tonne mark in 2013 (calendar year), up from arrivals of 3.1 million tonnes in 2012.
Prospects in most other key consuming countries remain positive. Our Sao Paulo team projects that Brazilian imports will flirt with the 8.0 million tonne mark this year, up from 7.4 million tonnes in 2012. Indonesian and Malaysian imports are expected to recover part of the sharp decline from last year and North American shipments are forecast to jump about 800,000 tonnes from the lower level in 2012.
Observation #7 – Surprise, Surprise, Surprise!
CBS introduced a new sitcom at about the same time that Yogi Berra’s New York Yankees were clinching the 1964 American League pennant. Gomer Pyle U.S.M.C was an incredibly popular sitcom that ran from September 25, 1964 to May 2, 1969. The bumbling but lovable Private Pyle, a gas station attendant from rural North Carolina played by Jim Nabors, frustrated to no end Sergeant Vince Carter, his intense drill instructor played by Frank Sutton, with his naive but often astute observations. Sergeant Carter’s eyes would bug out and neck veins pop especially when Gomer proclaimed “Surprise, Surprise, Surprise!” and then pointed out something obvious.
Well, we felt a bit like Sergeant Carter when market observers proclaimed surprise after a major mining company pulled out of a large greenfield potash project in Argentina and when a large potash producer announced a 26% increase in the latest capital cost estimate for a greenfield project in Saskatchewan.
We, along with many stock analysts and shareholders, have long maintained that no greenfield potash project is economically viable based on realistic capital costs and potash prices. It is simple math. In fact, continued capital cost escalation combined with less robust price forecasts could even jeopardize large olivefield (a combination greenfield and brownfield) projects.
One corollary of this conclusion is that it looks unlikely that any of the junior exploration companies will convince capital markets to invest or loan them billions of dollars to develop a greenfield potash project. In our view, only large diversified mining or plant nutrient companies likely will have the wherewithal to develop a multi-billion dollar project.
Another corollary is that any greenfield project that moves ahead likely will get management and board approvals based on “strategic objectives” such as geographic or business portfolio diversification rather than a realistic return on capital estimate. Some long-in-the-tooth projects may get pitched to boards based on the incremental capital required to complete the project after companies have sunk literally billions of dollars of capital into “project development costs”.


