The Mosaic Company Credit Suisse 26th Annual Chemical and Ag Science Conference Jim Prokopanko, Mosaic President and Chief Executive Officer September 2013 Exhibit 99.2 |
2 Safe Harbor Statement Safe Harbor This presentation contains forward-looking statements within the meaning of the Private Securities Litigation Reform Act of 1995. Such statements include, but are not limited to, statements about future financial and operating results. Such statements are based upon the current beliefs and expectations of The Mosaic Company’s management and are subject to significant risks and uncertainties. These risks and uncertainties include but are not limited to the predictability and volatility of, and customer expectations about, agriculture, fertilizer, raw material, energy and transportation markets that are subject to competitive and other pressures and economic and credit market conditions; the level of inventories in the distribution channels for crop nutrients; changes in foreign currency and exchange rates; international trade risks; changes in government policy; changes in environmental and other governmental regulation, including greenhouse gas regulation, implementation of the numeric water quality standards for the discharge of nutrients into Florida waterways or possible efforts to reduce the flow of excess nutrients into the Mississippi River basin or the Gulf of Mexico; further developments in judicial or administrative proceedings, or complaints that Mosaic’s operations are adversely impacting nearby farms, business operations or properties; difficulties or delays in receiving, increased costs of or challenges to necessary governmental permits or approvals or increased financial assurance requirements; resolution of global tax audit activity; the effectiveness of the Company’s processes for managing its strategic priorities; the ability of the Northern Promise joint venture among Mosaic, Ma’aden and SABIC to obtain project financing in acceptable amounts and upon acceptable terms, the future success of current plans for the joint venture and any future changes in those plans; adverse weather conditions affecting operations in Central Florida or the Mississippi River basin or the Gulf Coast of the United States, and including potential hurricanes, excess rainfall or drought; actual costs of various items differing from management’s current estimates, including, among others, asset retirement, environmental remediation, reclamation or other environmental regulation, or Canadian resources taxes and royalties; brine inflows at Mosaic’s Esterhazy, Saskatchewan, potash mine or other potash shaft mines; other accidents and disruptions involving Mosaic’s operations, including potential mine fires, floods, explosions, seismic events or releases of hazardous or volatile chemicals, as well as other risks and uncertainties reported from time to time in The Mosaic Company’s reports filed with the Securities and Exchange Commission. Actual results may differ from those set forth in the forward-looking statements. |
3 Phosphate and Potash Outlook Over-reaction to the break-up of BPC No change to our positive long-term outlook Weaker fundamentals near term |
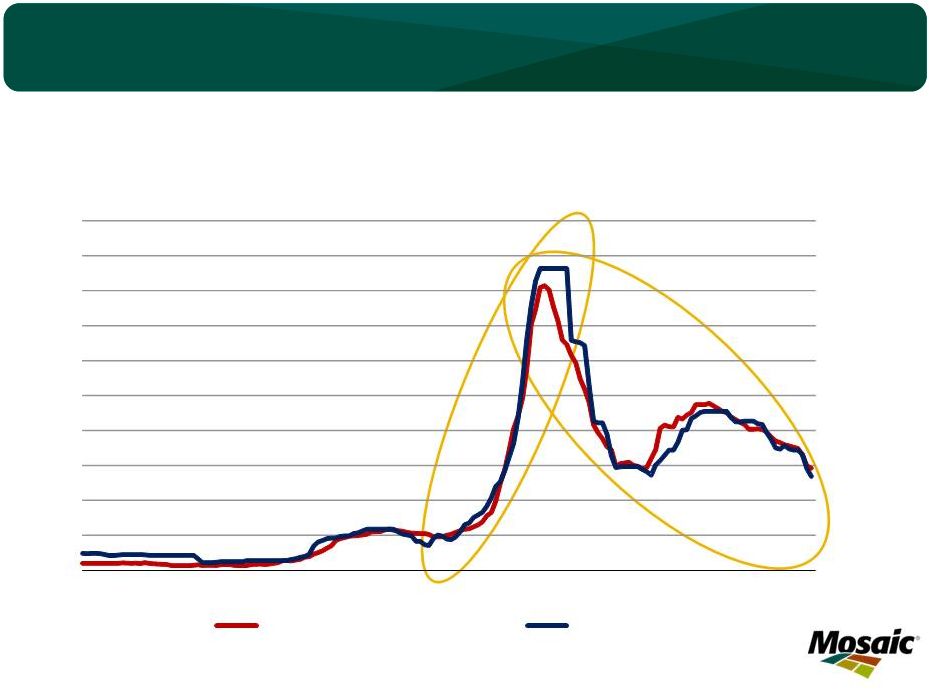
4 Weaker Fundamentals Near Term 100 200 300 400 500 600 700 05 06 07 08 09 10 11 12 13 $ MT Plant Nutrient Prices Urea - fob Yuzhny DAP - fob Tampa MOP - c&f Brazil Source: Fertecon, CRU and ICIS |
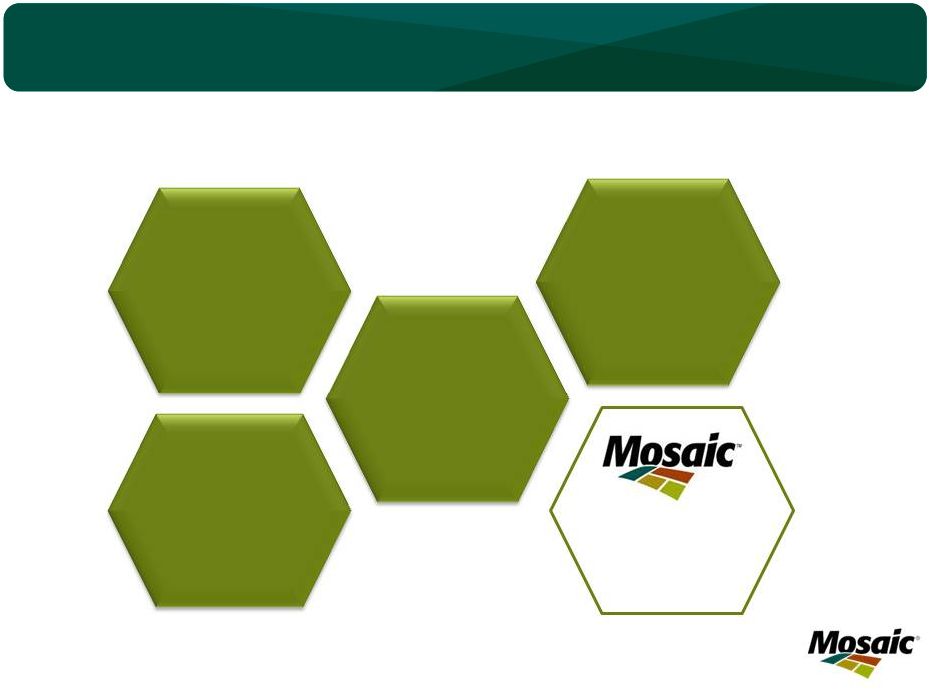
5 Several Factors Exacerbate Fundamentals Cautious Sentiment Weaker Supply and Demand Fundamentals Currency Headwinds BPC Announcement Seasonal Slowdown |
6 Guidance Update: Third Quarter 2013 Business Segment Category Previous Guidance – Calendar Year 2013 New Guidance – Calendar Year 2013 Potash Q3 Sales volume Q3 MOP selling price Q3 Gross margin rate Q3 Operating rate 1.8 – 2.1 million tonnes $330 - $360 per tonne Mid to high 30 percent Below 75 percent 1.45 – 1.65 million tonnes $330 - $340 per tonne Low to mid 30 percent Below 75 percent Phosphates Q3 Sales volume Q3 DAP selling price Q3 Gross margin rate Q3 Operating rate 2.9 - 3.3 million tonnes $430 - $465 per tonne Flat with last quarter Mid 80 percent 2.6 – 2.8 million tonnes $430 - $440 per tonne Mid teens Mid 80 percent Consolidated Effective Tax Rate Mid 20 percent range, excluding notable items Low 20 percent range, excluding notable items *All other quarterly guidance remains unchanged |
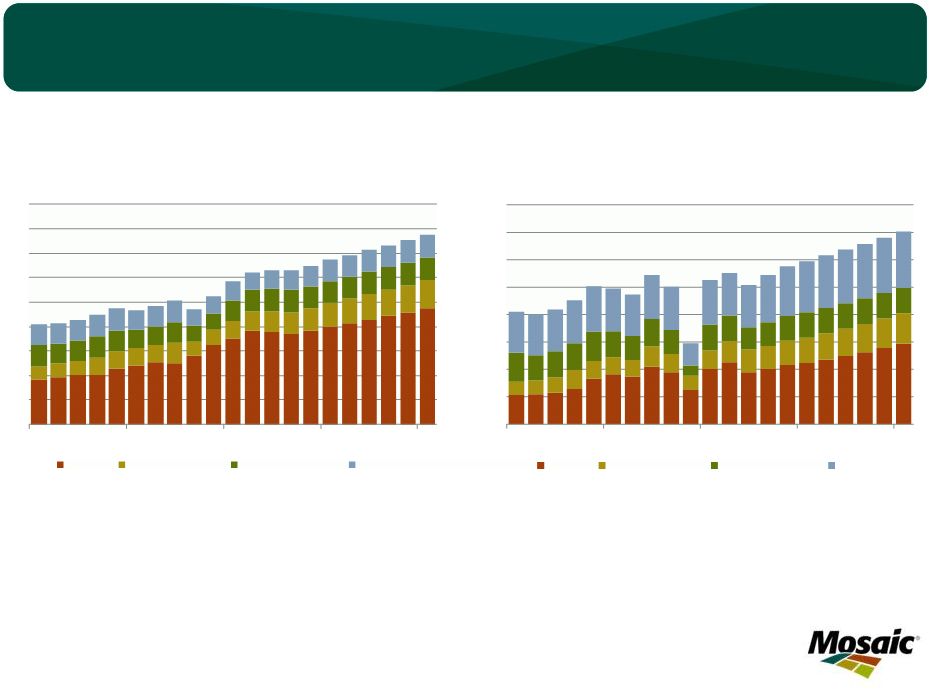
Demand Still a Tale of Two Hemispheres 0.0 1.0 2.0 3.0 4.0 5.0 6.0 7.0 8.0 9.0 10.0 95 97 99 01 03 05 07 09 11 13 FCST Mil Nutrient Tonnes Brazil Phosphate and Potash Shipments Phosphate Potash Source: ANDA, Mosaic 0 2 4 6 8 10 12 14 16 18 20 96 98 00 02 04 06 08 10 12 14 FCST Mil Tonnes India DAP and MOP Shipments DAP Shipments MOP Imports Fertilizer Year Ending March 30 Source: FAI, Mosaic 7 |
8 Affordability Underpins Demand 0.50 0.75 1.00 1.25 1.50 1.75 05 06 07 08 09 10 11 12 13 Plant Nutrient Affordability Plant Nutrient Price Index / Crop Price Index Affordability Metric Average Source: Green Markets, CME, USDA, AAPFCO, Mosaic |
9 The ABCs of the Food Story 1,000 1,500 2,000 2,500 3,000 3,500 80 85 90 95 00 05 10 20 Mil Tonnes Source: USDA and Mosaic World Grain and Oilseed Use Actual for U.S. Ethanol Actual Forecast for U.S. Ethanol Forecast |
10 Long-Term P&K Demand Forecasts Source: Mosaic 0 10 20 30 40 50 60 70 80 90 2000 2004 2008 2012 2016 2020 MMT World Phosphate Shipments Most Likely Scenario Asia Latin America North America Other 0 10 20 30 40 50 60 70 80 2000 2004 2008 2012 2016 2020 MMT KCl World Potash Shipments Most Likely Scenario Asia Latin America North America Other |
11 Balanced Outlook for Global P&K Markets Source: Mosaic Global Phosphate Capacity, Production and Opr Rate Most Likely Scenario 0 20 40 60 100 120 2000 2004 2008 2012 2016 2020 MMT 65% 70% 75% 80% 85% 90% 95% 80 Op Rate Capacity Production Op Rate 40% 50% 60% 70% 80% 90% 100% 0 10 20 30 40 50 60 70 80 90 2000 2004 2008 2012 2016 2020 MMT KCl Global Potash Capacity, Production and Operating Rate Most Likely Scenario Capacity Production Op Rate Op Rate |
12 Responses to Potash Mis-Characterizations Supply and demand determine price The economic rationale for legal export associations is efficiency. Canpotex delivers large cost savings. Mosaic is cost competitive |
13 Supply and Demand Determine Price 100 200 300 400 500 600 700 800 900 1000 1100 100 200 300 400 500 600 700 800 900 1000 1100 00 01 02 03 04 05 06 07 08 09 10 11 12 13 $ MT c&f $ ST fob Terminal Blend Grade Muriate of Potash Prices fob U.S. Midwest Warehouse c&f Brazil Source: Green Markets and ICIS Brazil Midwest |
14 Supply and Demand Determine Price 0 2,000 4,000 6,000 8,000 10,000 12,000 14,000 16,000 18,000 85 86 87 88 89 90 91 92 93 94 95 96 97 98 99 00 01 02 03 04 05 06 07 08 09 10 11 1000 Tonne KCl Source: Fertecon Data File February 2013 Former Soviet Union Potash Exports 0 2,000 4,000 6,000 8,000 10,000 12,000 14,000 85 86 87 88 89 90 91 92 93 94 95 96 97 98 99 00 01 02 03 04 05 06 07 08 09 10 11 1000 Tonne KCl Source: Fertecon Data File February 2013 Former Soviet Union Potash Domestic Shipments |
15 Supply and Demand Determine Price 100 200 300 400 500 600 700 800 900 1000 1100 100 200 300 400 500 600 700 800 900 1000 1100 00 01 02 03 04 05 06 07 08 09 10 11 12 13 $ MT c&f Brazil $ ST fob Midwest Terminal Blend Grade Muriate of Potash Prices fob U.S. Midwest Warehouse c&f Brazil Source: Green Markets and ICIS |
16 Mosaic’s Cost Position • Domestic freight is included in Mosaic’s revenue and cost of goods sold. • Prior to 2013 tolling agreement increased reported costs per tonne. • Resources Taxes are included in Mosaic’s costs of goods sold. Our Financial Reports: Brine Management Elevates Costs Mosaic Sask Source: CRU and Mosaic |
17 Putting the Pieces Together Cost Competitive Over-reaction to BPC breakup Long-term outlook unchanged Supply and demand determine price Weaker near- term fundamentals |
Our Strategic Priorities |
19 Our Balance Sheet: A Powerful Advantage *See additional detail on reconciliation at back of slides $2 Billion of Surplus Cash $3 Billion of Debt Capacity Share Repurchases ARO Escrow Strategic Investments |
20 Our Ultimate Goal: Strong TSR Our Total Shareholder Return goal: Top 3 among 10 global crop nutrient peers Execute our strategy Return capital to shareholders Deliver strong value |
22 Selected Non-GAAP Financial Measures and Reconciliations As of May 31, 2013 US$ Millions US$ Millions FY13 FY12 FY11 FY10 FY09 Net earnings 1,889 $ 1,930 $ 2,515 $ 827 $ 2,350 $ + Interest (income) expense, net (19) (19) 5 50 43 + Income tax expense 341 711 753 347 649 + Depreciation, depletion & amortization 605 508 447 445 361 EBITDA 2,816 $ 3,130 $ 3,720 $ 1,669 $ 3,403 $ EBITDA 5-Year Average 2,948 $ Short Term Debt 69 $ Long Term Debt 1,011 Unfunded Pension and Postretirement Obligations 139 Lease Obligations (Annual Rental Expense x 6) 533 Total Adjusted Debt * 1,752 $ * Estimated based on written description of rating agency methodology |
23 Selected Non-GAAP Financial Measures and Reconciliations * Other represents freight costs, KMAG production costs, impacts of Esterhazy tolling tonnes, changes in inventory levels, and other Potash Segment US$ Millions, except per tonne FY13 COGS 1,918 $ - Unrealized gain on derivatives (13) - Depreciation, depletion, and amortization 302 - Resource taxes 250 - Other * 360 Total MOP cash production costs 1,019 MOP Production volumes (thousand of metric tonnes) 7,592 MOP cash production costs per tonne 134 $ |