 Market Outlook Picking Up the Knife (and starting a fight?) Mosaic AgCollege Orlando, FL January 14, 2014 Michael R. Rahm Vice President Market and Strategic Analysis Andy Jung Director Market and Strategic Analysis Exhibit 99.1 |
 Safe Harbor Statement 2 This presentation contains forward-looking statements within the meaning of the Private Securities Litigation Reform Act of 1995. Such statements include, but are not limited to, statements about the proposed acquisition of the Florida phosphate assets and certain related liabilities of CF Industries, Inc. (“CF”) and the ammonia supply agreements with CF; the benefits of the transactions with CF; future strategic plans and other statements about future financial and operating results. Such statements are based upon the current beliefs and expectations of The Mosaic Company's management and are subject to significant risks and uncertainties. These risks and uncertainties include but are not limited to risks and uncertainties arising from the possibility that the closing of the proposed phosphate asset acquisition may be delayed or may not occur, including delays arising from any inability to obtain governmental approvals of the transaction on the proposed terms and schedule and the ability to satisfy other closing conditions; difficulties with realization of the benefits of the transactions with CF, including the risks that the acquired assets may not be integrated successfully or that the cost or capital savings from the transactions may not be fully realized or may take longer to realize than expected, regulatory agencies might not take, or might delay, actions with respect to permitting or regulatory enforcement matters that are necessary for Mosaic to fully realize the benefits of the transactions including replacement of CF’s escrowed financial assurance funds, or the price of natural gas or ammonia changes to a level at which the natural gas based pricing under one of the long term ammonia supply agreements with CF becomes disadvantageous to Mosaic; customer defaults; the effects of our decisions to exit business operations or locations; the predictability and volatility of, and customer expectations about, agriculture, fertilizer, raw material, energy and transportation markets that are subject to competitive and other pressures and economic and credit market conditions; the level of inventories in the distribution channels for crop nutrients; changes in foreign currency and exchange rates; international trade risks; changes in government policy; changes in environmental and other governmental regulation, including greenhouse gas regulation, implementation of numeric water quality standards for the discharge of nutrients into Florida waterways or possible efforts to reduce the flow of excess nutrients into the Mississippi River basin or the Gulf of Mexico; further developments in judicial or administrative proceedings, or complaints that Mosaic's operations are adversely impacting nearby farms, business operations or properties; difficulties or delays in receiving, increased costs of or challenges to necessary governmental permits or approvals or increased financial assurance requirements; resolution of global tax audit activity; the effectiveness of the Company's processes for managing its strategic priorities; the ability of the Northern Promise joint venture among Mosaic, Ma'aden and SABIC to obtain project financing in acceptable amounts and upon acceptable terms, the future success of current plans for the joint venture and any future changes in those plans; adverse weather conditions affecting operations in Central Florida or the Mississippi River basin or the Gulf Coast of the United States, and including potential hurricanes, excess rainfall or drought; actual costs of various items differing from management's current estimates, including, among others, asset retirement, environmental remediation, reclamation or other environmental regulation, Canadian resources taxes and royalties, or the liabilities Mosaic is assuming in the proposed phosphate assets acquisition; brine inflows at Mosaic's Esterhazy, Saskatchewan, potash mine or other potash shaft mines; other accidents and disruptions involving Mosaic's operations, including potential mine fires, floods, explosions, seismic events or releases of hazardous or volatile chemicals, as well as other risks and uncertainties reported from time to time in The Mosaic Company's reports filed with the Securities and Exchange Commission. Actual results may differ from those set forth in the forward-looking statements. |
 Welcome to AgCollege We value our “relationship” (a short story) We greatly appreciate your business and want to see us both succeed by delivering innovative solutions & value to our customers Introducing Andy Jung An explanation of the title of our presentation Preliminaries |
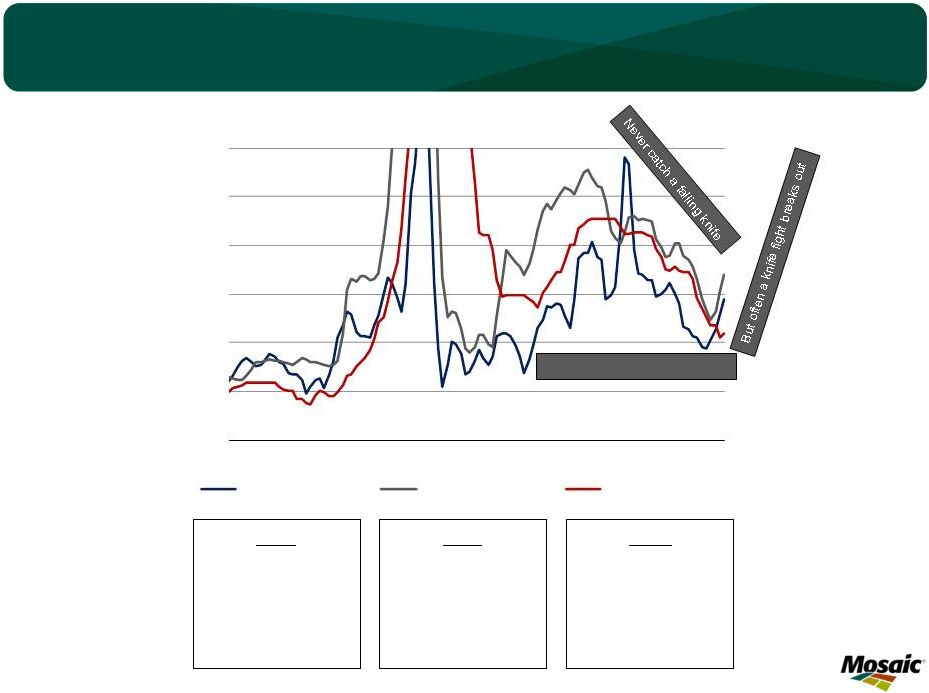 An explanation of the title of our presentation 4 MOP 2011 Peak: $560 2013 Trough: $310 Change: -45% Current: $320 Change: +3% Urea 2012 Peak: $740 2013 Trough: $280 Change: -62% Current: $390 Change: +39% DAP 2011 Peak: $660 2013 Trough: $340 Change: -48% Current: $439 Change: +29% Let it hit the floor and pick it up 100 200 300 400 500 600 700 05 06 07 08 09 10 11 12 13 14 $ Ton/ne Plant Nutrient Prices Urea - fob NOLA DAP - fob Tampa MOP - c&f Brazil Source: Fertecon, CRU, FMB and ICIS |
 Agricultural Situation and Outlook Phosphate Situation and Outlook Potash Situation and Outlook Factors to Watch and Handicap Q&A Agenda Mike Andy Mike Andy |
 Agricultural Situation and Outlook |
 Key Features and Take Aways Record-smashing global harvest and large stock build in 2013/14 – Record harvested area and yield – Significant pent-up demand – How low will prices have to fall in order to clear markets? • Need to reach the trigger point that unleashes pent-up demand and dulls supply growth • More downside but no collapse in agricultural commodity prices All eyes on the corn market – Great news from the January 10 USDA reports, but . . . – Large stock build this year and the potential for another significant build in 2014/15 – Changes in U.S. 2014 blending mandate – impact more psychological than fundamental for now – Chinese imports a bigger concern – Fewer corn acres needed in 2014, but what will farmers plant A wide range of potential outcomes in 2014/15 Food story still intact in the long run Less robust but still constructive plant nutrient demand drivers – Decent plant nutrient affordability – Lower but continued profitable farm economics – Elevated farm income and strong balance sheets 7 |
 The view from 60,000 feet (dumping all crops in the same basket) 8 The world harvested a monster crop in 2013/14 due to record harvested area and yield. Last year’s smaller than expected crop (but still the second largest!) resulted in record prices for several commodities. Record prices destroyed demand and allocated smaller supplies to their highest valued uses. Global use increased just 0.4% compared to a CAGR of 2.4% during the previous five years. Use is projected to increase 4.3% in 2013/14 due to pent-up demand. This year’s record crop is big enough to meet the rebound in demand (two year’s worth) and rebuild the all of the inventory drawn-downs during the last three years. 2.40 2.50 2.60 2.70 2.80 2.90 3.00 3.10 3.20 800 820 840 860 880 900 920 940 00 01 02 03 04 05 06 07 08 09 10 11 12 13E MT Ha Mil Ha World Grain and Oilseed Area and Yields Harvested Area Yield Trend Source: USDA 2.0 2.1 2.2 2.3 2.4 2.5 2.6 2.7 2.8 2.9 3.0 00 01 02 03 04 05 06 07 08 09 10 11 12 13E Bil Tonnes World Grain and Oilseed Production Production Use Source: USDA 607 580 494 407 470 463 427 439 515 571 550 535 515 570 15.0% 17.5% 20.0% 22.5% 25.0% 27.5% 30.0% 350 400 450 500 550 600 650 00 01 02 03 04 05 06 07 08 09 10 11 12 13E Percent Mil Tonnes World Grain & Oilseed Stocks Stocks Percent of Use Source: USDA |
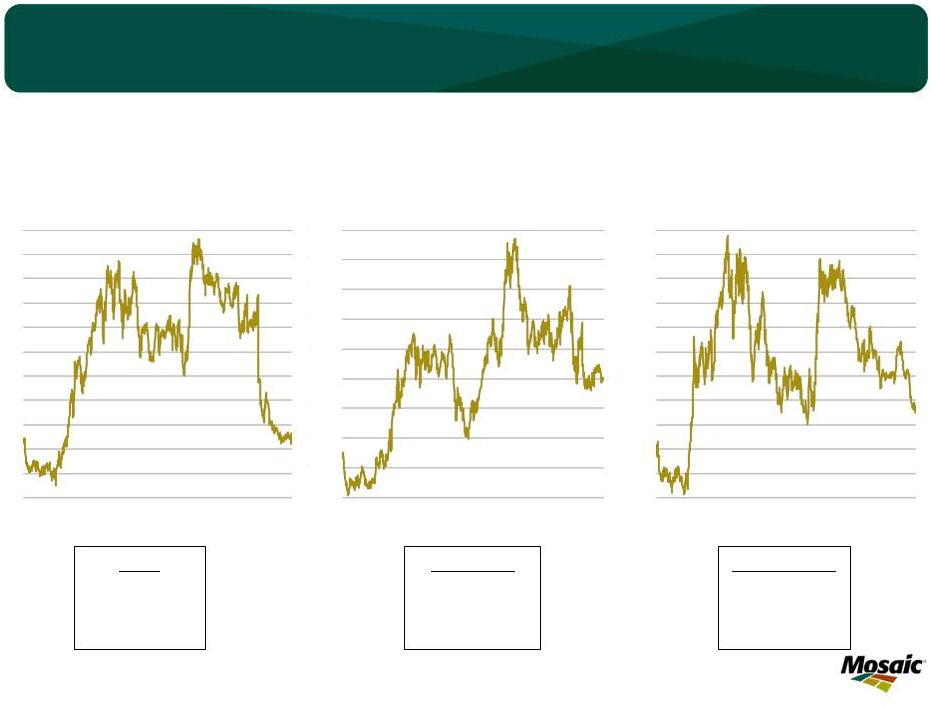 A different question this year 9 2012/13: How high to allocate the short crop to its highest valued uses? 2013/14: How low to unleash pent-up demand and dull supply growth? HRW Wheat 2012/13: $8.20 Current: $6.26 2013/14: ???? Corn 2012/13: $6.79 Current: $4.33 2013/14: ???? Soybeans 2012/13: $14.74 Current: $13.04 2013/14: ???? 3.0 3.5 4.0 4.5 5.0 5.5 6.0 6.5 7.0 7.5 8.0 8.5 Jan-10 Jan-11 Jan-12 Jan-13 Jan-14 $ BU Corn Daily Close of Nearby Futures Contract Source: CBOT 9.0 10.0 11.0 12.0 13.0 14.0 15.0 16.0 17.0 18.0 Jan-10 Jan-11 Jan-12 Jan-13 Jan-14 $ BU Soybean Price Daily Close of Nearby Futures Contract Source: CBOT 4.5 5.0 5.5 6.0 6.5 7.0 7.5 8.0 8.5 9.0 9.5 10.0 Jan-10 Jan-11 Jan-12 Jan-13 Jan-14 $ BU HRW Wheat Price Daily Close of Nearby Futures Contract Source: KCBOT |
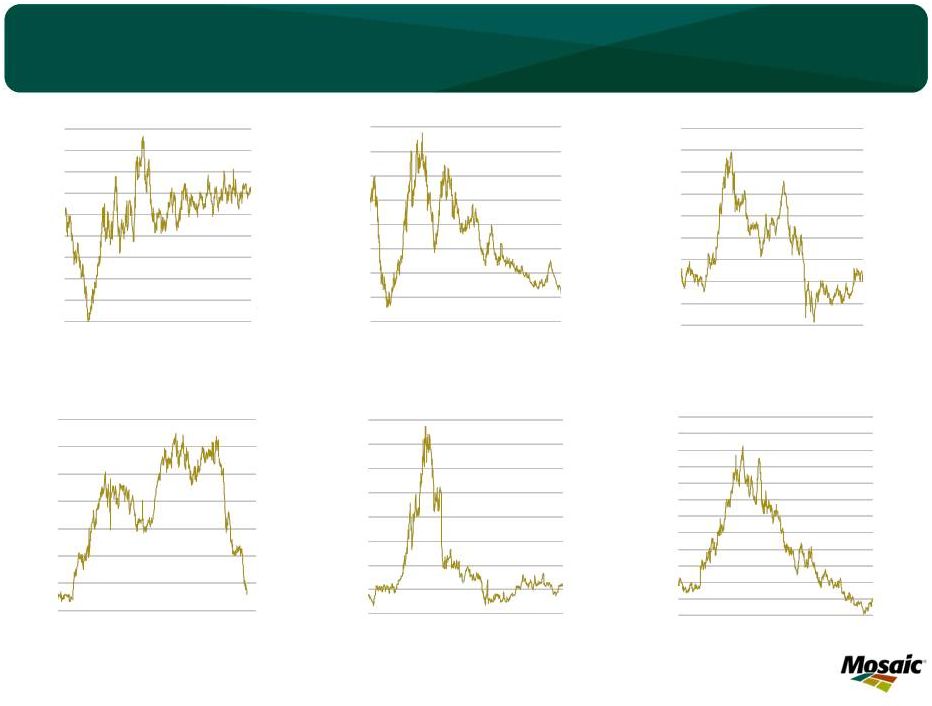 Other agricultural commodity prices also are lower 10 9.5 10.5 11.5 12.5 13.5 14.5 15.5 16.5 17.5 18.5 Jan-10 Jan-11 Jan-12 Jan-13 Jan-14 CTS/LB Rice (#2) Price Daily Close of Nearby Futures Contract 12 15 18 21 24 27 30 33 36 Jan-10 Jan-11 Jan-12 Jan-13 Jan-14 CTS/LB Sugar (#11) Price Daily Close of Nearby Futures Contract Source: ICE 2000 2250 2500 2750 3000 3250 3500 3750 4000 4250 Jan-10 Jan-11 Jan-12 Jan-13 Jan-14 RM/ Tonne Palm Oil Price Daily Close of Nearby Futures Contract Source: Kuala Lumpur Exchange 60 80 100 120 140 160 180 200 220 Jan-10 Jan-11 Jan-12 Jan-13 Jan-14 CTS/LB Cotton Price Daily Close of Nearby Futures Contract Source: ICE 100 120 140 160 180 200 220 240 260 280 300 320 340 Jan-10 Jan-11 Jan-12 Jan-13 Jan-14 CTS/LB Coffee Price Daily Close of Nearby Futures Contract Source: ICE 350 400 450 500 550 600 650 700 Jan-10 Jan-11 Jan-12 Jan-13 Jan-14 C$/MT Canola Daily Close Cash Price Source: WCE |
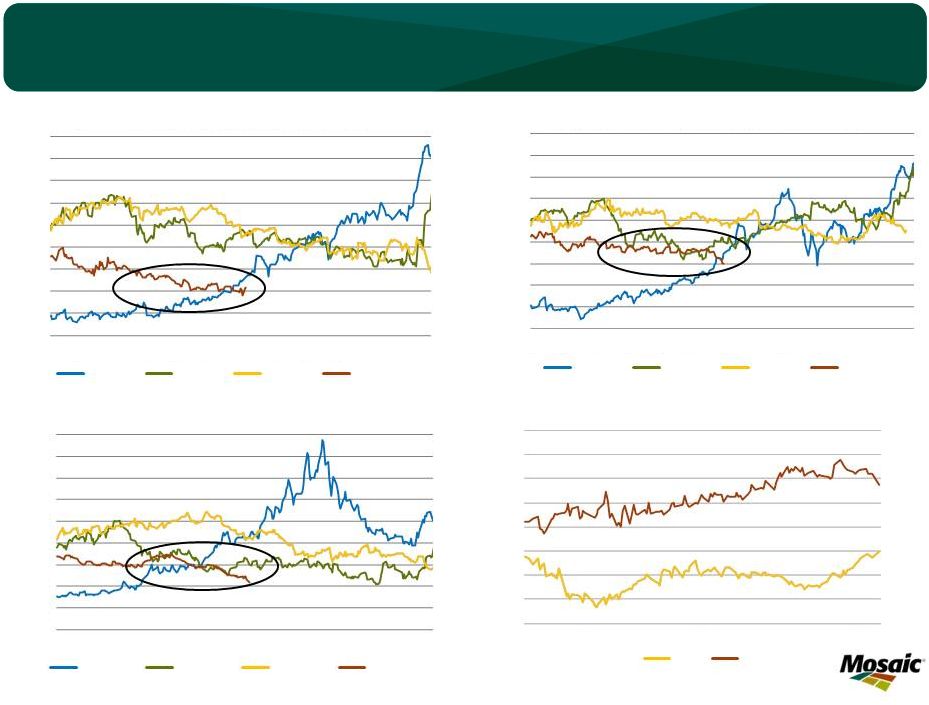 Markets sending weaker signals this year 11 3.50 4.00 4.50 5.00 5.50 6.00 6.50 7.00 7.50 8.00 J A S O N D J F M A M J US$ BU New Crop Corn Prices Daily Close of the New Crop Option Jul 1 to Jun 30 2008 2012 2013 2014 Source: CME 8.0 9.0 10.0 11.0 12.0 13.0 14.0 15.0 16.0 17.0 J A S O N D J F M A M J US$ BU New Crop Soybean Prices Daily Close of the New Crop Option Jul 1 to Jun 30 2008 2012 2013 2014 Source: CME 1.9 2.0 2.1 2.2 2.3 2.4 2.5 2.6 2.7 Jul-13 Aug-13 Sep-13 Oct-13 Nov-13 Dec-13 Jan-14 Close of New Crop Futures Soybean:Corn Ratio 2013 2014 Source: CME 4.00 5.00 6.00 7.00 8.00 9.00 10.00 11.00 12.00 13.00 J A S O N D J F M A M J US$ BU New Crop Hard Red Winter Wheat Prices Daily Close of the New Crop Option Jul 1 to Jun 30 2008 2012 2013 2014 Source: CME |
 All eyes on the corn market 12 The USDA’s January 10 reports delivered good news for the crop input supply industry. Lower projected U.S. production and inventories as well as a bump in use caused a sharp rally in corn prices and eased fears that corn could drop to less than $4 bu heading into the spring planting season. However, world and U.S. corn inventories still are projected to increase sharply due to the bumper U.S. crop as well as record crops in other parts of the world such as Brazil. Market is expected to closely watch South American crop progress, U.S. Prospective Plantings survey results and Chinese imports for future direction. 0 7 14 21 28 35 42 49 56 63 70 0.0 0.5 1.0 1.5 2.0 2.5 3.0 3.5 4.0 4.5 5.0 70 73 76 79 82 85 88 91 94 97 00 03 06 09 12 Percent Bil Bu U.S. Corn Stocks Stocks Percent of Use Source: USDA 5% 10% 15% 20% 25% 30% 35% 40% 45% 50% 0 25 50 75 100 125 150 175 200 225 70 73 76 79 82 85 88 91 94 97 00 03 06 09 12 Percent Mil Tonnes World Corn Stocks Stocks Percent of Use Source: USDA 0 2 4 6 8 10 12 14 70 74 78 82 86 90 94 98 02 06 10 Bil Bu U.S. Corn Use Exports Feed and Residual Food & Industrial Source: USDA |
 Impact of a lower ethanol RFS is more psychological than economic at this point 13 The ethanol blending mandate was scheduled to increase to 14.4 billion gallons in 2014, but the EPA has proposed to lower the RFS to 13.01 billion gallons in order to align it more closely with the E10 blend wall (current U.S. gasoline demand is about 133 billion gallons). The 1.3 billion gallon decline is equal to about 465 million bushels of corn or almost 3 million harvested acres. However, ethanol production never would have increased by this amount due to the E10 blend wall. The change likely will have a much greater psychological impact than fundamental impact on the corn market. EISA 2007 RFS2 & Proposed Adjustments EPAct Total Advanced Biofuel Conventional 2005 Renewable Total or Total Less Year RFS1 Fuel Advanced Cellulosic Advanced 2006 4.00 na na na na na 2007 4.70 na na na na na 2008 5.40 9.00 na na na 9.00 2009 6.10 11.10 0.60 na 0.33 10.50 2010 6.80 12.95 0.95 0.01 0.82 12.00 2011 7.40 13.95 1.35 0.01 0.80 12.60 2012 7.50 15.20 2.00 0.09 1.00 13.20 2013 tbd 16.55 2.75 0.14 1.28 13.80 2014F tbd 15.21 2.20 0.17 1.28 13.01 2015F tbd 20.50 5.50 3.00 tbd 15.00 2016F tbd 22.25 7.25 4.25 tbd 15.00 2017F tbd 24.00 9.00 5.50 tbd 15.00 2018F tbd 26.00 11.00 7.00 tbd 15.00 2019F tbd 28.00 13.00 8.50 tbd 15.00 2020F tbd 30.00 15.00 10.50 tbd 15.00 2021F tbd 33.00 18.00 13.50 tbd 15.00 2022F tbd 36.00 21.00 16.00 tbd 15.00 Source: Energy Policy Act of 2005 (EPACT 2005) and Energy Independence and Security Act of 2007 (EISA 2007), EPA-420-F-10-007, and Mosaic estimate. Biomass- Based Diesel |
 Fewer U.S. corn acres are needed in 2014/15 -- if yield equals trend and demand remains at high levels 14 14/15 Scenarios (mil bu) 05/06 06/07 07/08 08/09 09/10 10/11 11/12 12/13 13/14F #1 #2 #3 Acreage and Yield Planted (mil acres) 81.8 78.3 93.5 86.0 86.4 88.2 91.9 97.2 95.4 95.0 91.0 87.6 Harvested (mil acres) 75.1 70.6 86.5 78.6 79.5 81.4 84.0 87.4 87.7 86.9 83.3 80.2 Yield (bu/acre) 147.9 149.1 150.7 153.9 164.7 152.8 147.2 123.4 158.8 165.7 165.7 165.7 Harvested Ratio (%) 91.9% 90.2% 92.5% 91.4% 92.0% 92.4% 91.4% 89.9% 91.9% 91.5% 91.5% 91.5% Supply Beginning Stocks 2,114 1,967 1,304 1,624 1,673 1,708 1,128 989 821 1,631 1,631 1,631 Production 11,112 10,531 13,038 12,092 13,092 12,447 12,360 10,780 13,925 14,403 13,797 13,285 Imports 9 12 20 14 8 28 29 162 35 15 15 15 Total 13,235 12,510 14,361 13,729 14,773 14,182 13,517 11,932 14,781 16,050 15,443 14,931 Use Feed & Residual 6,115 5,540 5,858 5,182 5,126 4,799 4,557 4,335 5,300 5,300 5,300 5,300 FIS 3,019 3,541 4,442 5,025 5,961 6,425 6,428 6,044 6,400 6,300 6,300 6,300 Ethanol for Fuel 1,603 2,119 3,049 3,709 4,591 5,019 5,011 4,650 4,900 4,800 4,800 4,800 Exports 2,134 2,125 2,437 1,849 1,979 1,830 1,543 731 1,450 1,700 1,700 1,700 Total 11,268 11,207 12,737 12,056 13,066 13,055 12,528 11,110 13,150 13,300 13,300 13,300 Ending Stocks 1,967 1,304 1,624 1,673 1,708 1,128 989 821 1,631 2,750 2,143 1,631 Stocks as % of Use 17.5% 11.6% 12.8% 13.9% 13.1% 8.6% 7.9% 7.4% 12.4% 20.7% 16.1% 12.3% USDA |
 A large rebound in global soybean stocks largely due to record South American production 15 0% 5% 10% 15% 20% 25% 30% 35% 0 10 20 30 40 50 60 70 80 70 73 76 79 82 85 88 91 94 97 00 03 06 09 12 Percent Mil Tonnes World Soybean Stocks Source: USDA 0 5 10 15 20 25 30 0 100 200 300 400 500 600 70 73 76 79 82 85 88 91 94 97 00 03 06 09 12 Percent Mil Bu U.S. Soybean Stocks Source: USDA 0 20 40 60 80 100 120 140 160 70 73 76 79 82 85 88 91 94 97 00 03 06 09 12 Mil Tonnes South American Soybean Production Brazil Argentina Paraguay Source: USDA Stocks Percent of Use Mil Bu Percent of Use |
 Oh Canada! What a wheat (and canola) crop 16 12% 15% 18% 21% 24% 27% 30% 33% 36% 39% 0 25 50 75 100 125 150 175 200 225 70 73 76 79 82 85 88 91 94 97 00 03 06 09 12 Percent Mil Tonnes World Wheat Stocks Stocks Percent of Use Source: USDA 0 10 20 30 40 50 60 70 80 90 100 0.0 0.2 0.4 0.6 0.8 1.0 1.2 1.4 1.6 1.8 2.0 70 73 76 79 82 85 88 91 94 97 00 03 06 09 12 Percent Bil Bu U.S. Wheat Stocks Bil Bu Percent of Use Source: USDA 0 5 10 15 20 25 30 35 40 70 73 76 79 82 85 88 91 94 97 00 03 06 09 12 Mil Tonnes Canada Wheat Production Source: USDA 0 2 4 6 8 10 12 14 16 18 20 70 73 76 79 82 85 88 91 94 97 00 03 Mil Tonnes Canada Rapeseed Production Source: USDA 06 09 12 |
 A wide range of potential outcomes in 2014/15, but likely case illustrates the challenge of the food story 17 607 580 494 407 470 463 427 439 515 571 550 535 515 570 350 400 450 500 550 600 650 00 01 02 03 04 05 06 07 08 09 10 11 12 13E 14F Mil Tonnes World Grain & Oilseed Stocks Historical 2014/15 Range 2014/15 Medium Scenario Source: USDA and Mosaic 2014/15 Grain and Oilseed Scenario Assumptions Low Medium High Harvested Area Change -0.50% 0.00% 0.50% Yield Deviation from Trend * Largest Negative 0.00 Largest Positive Demand Growth 2.0% 2.5% 3.0% * Trend yield for 2000/01 to 2012/13 crop years. |
 Food story still intact in the long run 18 1,000 1,500 2,000 2,500 3,000 3,500 80 85 90 95 00 05 10 20F 30F Mil Tonnes Source: USDA and Mosaic World Grain and Oilseed Use Actual for Biofuels Actual Forecast for Biofuels Forecast 1.75 2.00 2.25 2.50 2.75 3.00 3.25 3.50 3.75 775 800 825 850 875 900 925 950 975 80 85 90 95 00 05 10 20F 30F MT Ha Mil Ha World Harvested Area and Average Yield Actual Area Forecast Area Actual Yield Required Yield 1980-10 Yield Trend |
 Less robust but still constructive demand drivers 19 0.50 0.75 1.00 1.25 1.50 1.75 05 06 07 08 09 10 11 12 13 14 Plant Nutrient Affordability Plant Nutrient Price Index / Crop Price Index Affordability Metric Average Source: Weekly Price Publications, CME, USDA, AAPFCO, Mosaic 0% 5% 10% 15% 20% 25% 30% 35% 0 20 40 60 80 100 120 140 80 83 86 89 92 95 98 01 04 07 10 13F Debt:Asset Ratio Bil $ U.S. Net Cash Farm Income Government Payments Debt: Asset Ratio Source: USDA $0 $200 $400 $600 $800 $1,000 05/06 06/07 07/08 08/09 09/10 10/11 11/12 12/13 13/14F 14/15F $ Acre Source: Iowa State University, USDA and Mosaic Estimated Return After Variable Cost for a U.S. Midwest High Yield Farm Operation Soybeans Corn Corn Following Corn Market |
 Phosphate Situation and Outlook |
 Key Features and Take Aways Prices have rallied ~$75-$100 tonne since the end of November Positive demand prospects – Less robust but still constructive demand drivers – Record global shipments and a rebound in trade in 2014 Lean channel inventories worldwide (China the notable exception) – Limited livin’ off the pipeline this year – The knife has hit the floor and buyers are picking it up (i.e. positioning product for the upcoming season) – India case study: a rebound in shipments and imports are expected beginning in Q2 China export policies/economics likely will set a price ceiling Still several uncertainties and caution flags – The direction of agricultural commodity prices – Indian 2014/15 phosphate subsidy – New supplies • Continued ramp-up of Ma’aden production and additional finished product and possibly acid capacity in Morocco • Indian JV acid plants in Tunisia (Tifert) and Jordan (Jifco) – Raw materials costs (sulphur has roared higher over the past couple of months) – Macroeconomic backdrop and impact on exchange rates (especially the Indian rupee) Bottom line: Tight near term with China economics likely setting the ceiling later in 2014 21 |
 Prices have rallied ~$70-$100 since the end of November 22 100 200 300 400 500 600 05 06 07 08 09 10 11 12 13 14 $ ST Weekly DAP Prices Central Florida Rail Source: Green Markets 100 200 300 400 500 600 05 06 07 08 09 10 11 12 13 14 $ ST Weekly DAP Prices NOLA Barge Source: Green Markets 200 300 400 500 600 700 05 06 07 08 09 10 11 12 13 14 $ MT Weekly DAP Prices fob Tampa Source: Fertecon |
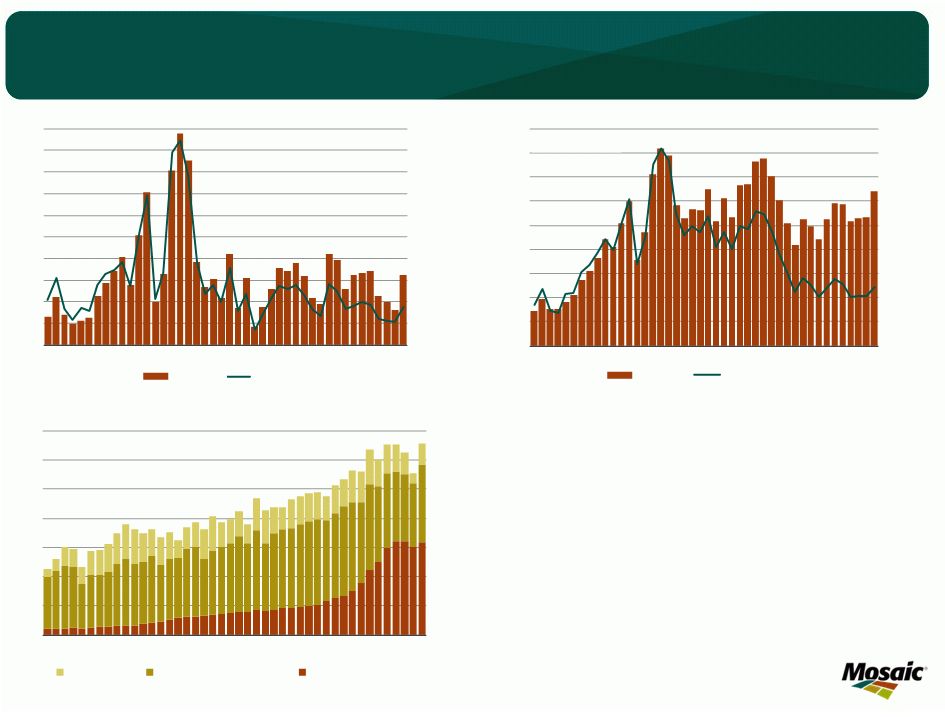
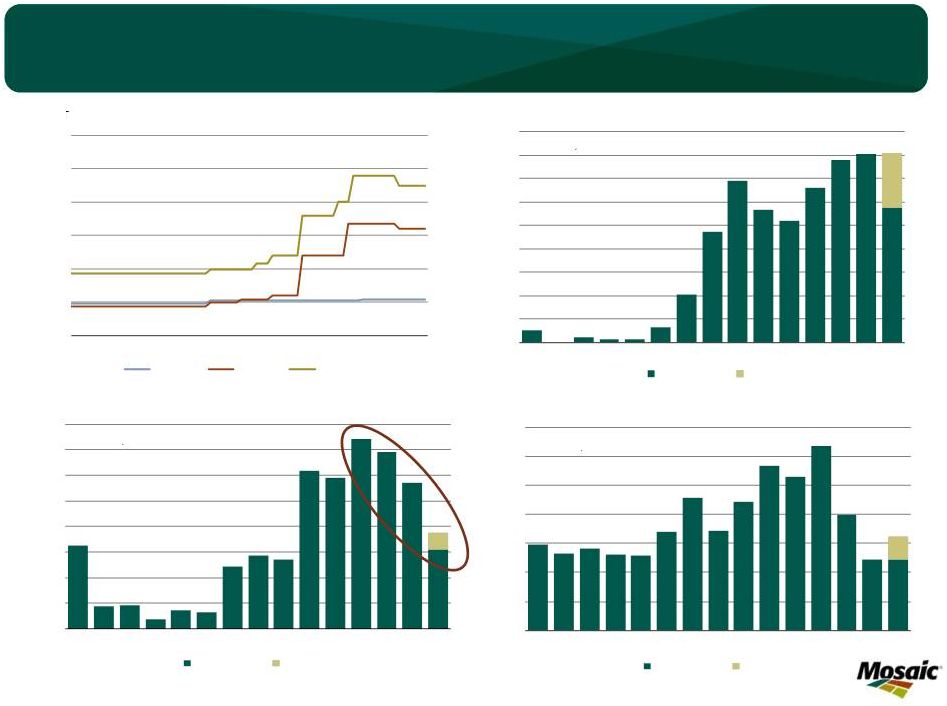 23 0 5,000 10,000 15,000 20,000 25,000 30,000 2008 2009 2010 2011 2012 2013 India Retail Plant Nutrient Prices Urea MOP DAP INR / MT Source: FAI, Mosaic 0.0 1.0 2.0 3.0 4.0 5.0 6.0 7.0 8.0 00 01 02 03 04 05 06 07 08 09 10 11 12 13 14 YTD Mil Tonnes India DAP Imports Actual Forecast Source: FAI, Mosaic Fertilizer Year Ending March 31 0.0 1.0 2.0 3.0 4.0 5.0 6.0 7.0 8.0 9.0 00 01 02 03 04 05 06 07 08 09 10 11 12 13 14 YTD Mil Tonnes India Urea Imports Actual Forecast Source: FAI, Mosaic Fertilizer Year Ending March 31 0.0 1.0 2.0 3.0 4.0 5.0 6.0 7.0 00 01 02 03 04 05 06 07 08 09 10 11 12 13 14 YTD Mil Tonnes India MOP Imports Actual Forecast Source: FAI, Mosaic Fertilizer Year Ending March 31 What drove the decline in global DAP pricing? Collapse of Indian Import Demand |
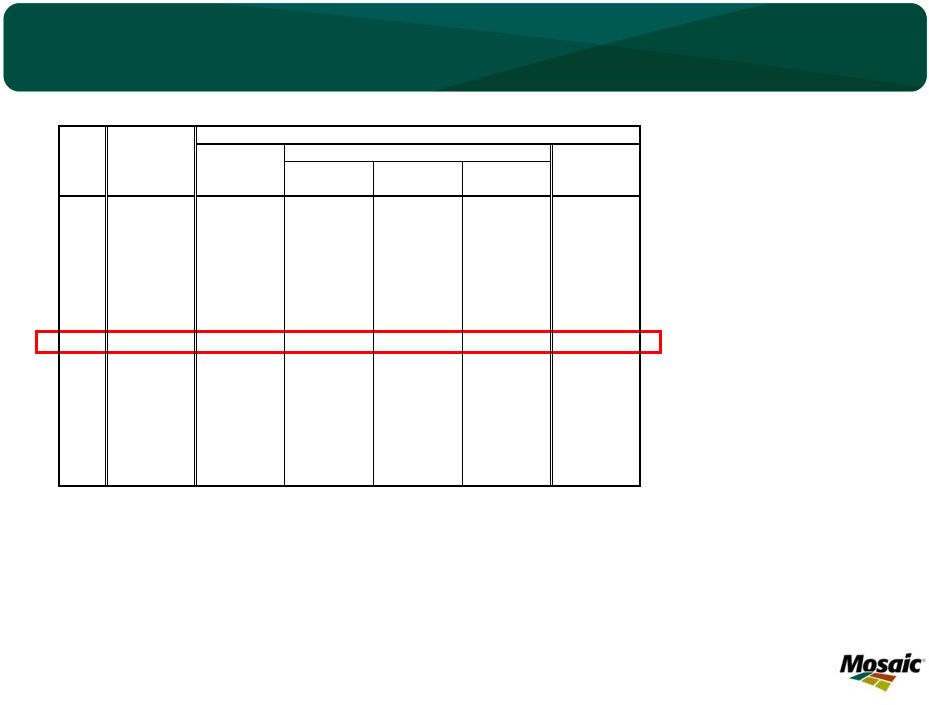
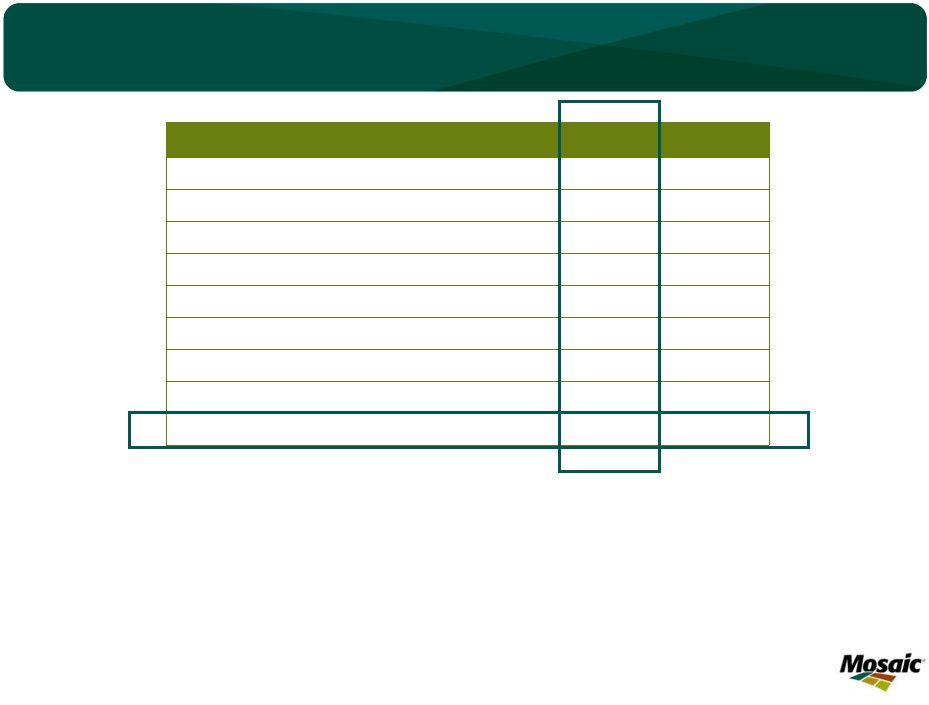 Livin’ off the Pipeline: India DAP Example 24 Million Tonnes DAP 2013/14E 2014/15 Producer/Importer Beginning Inventory 1.45 Production 3.67 Imports 3.90 Producer/Importer Sales to Retailer Dealers 7.82 Retail Dealer Sales to Farmers 9.82 Retail Inventory Change -2.00 Producer/Importer Ending Inventory 1.20 Producer/Importer Inventory Change -0.25 Total Pipeline Inventory Change -2.25 Our Delhi team estimates that DAP demand by farmers remains strong due to an outstanding monsoon and profitable farm economics. The government has raised minimum support prices for major crops, retail urea prices remain stable at the extremely low level of $80-$85 per tonne, and retail P&K prices, while up sharply from pre- reform levels, have declined modestly in 2013/14. As a result, retail dealer DAP sales to farmers are projected to total 9.8 million tonnes this fertilizer year. Producer and importer sales, however, are projected to drop to 7.8 million tonnes, implying a retail inventory decline of 2.0 million tonnes. In addition, producer/importer inventories also are projected to decline 250,000 tonnes in 2013/14. |
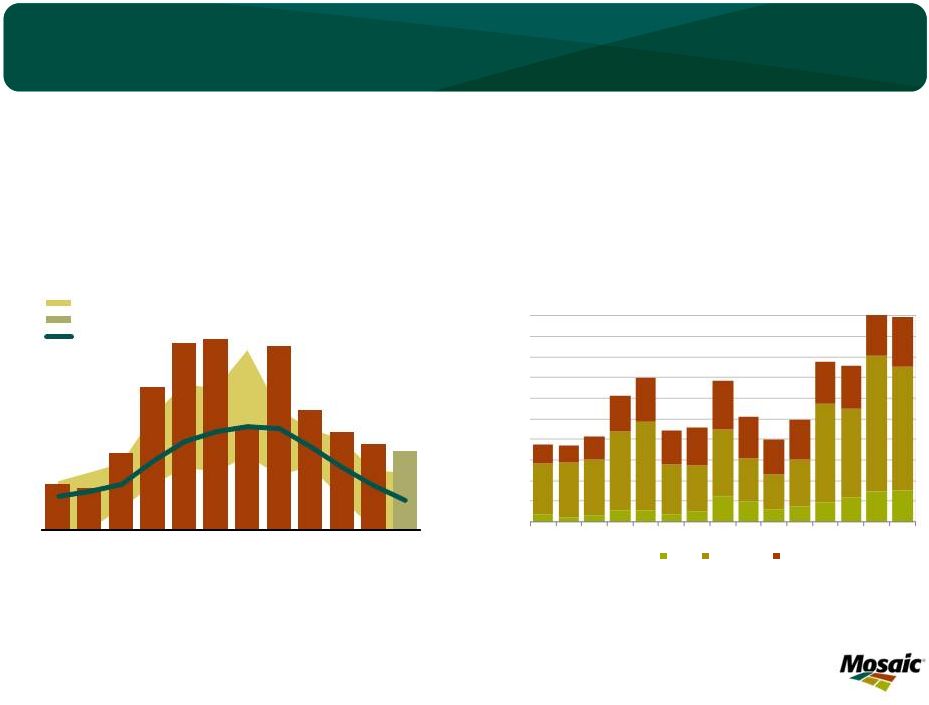
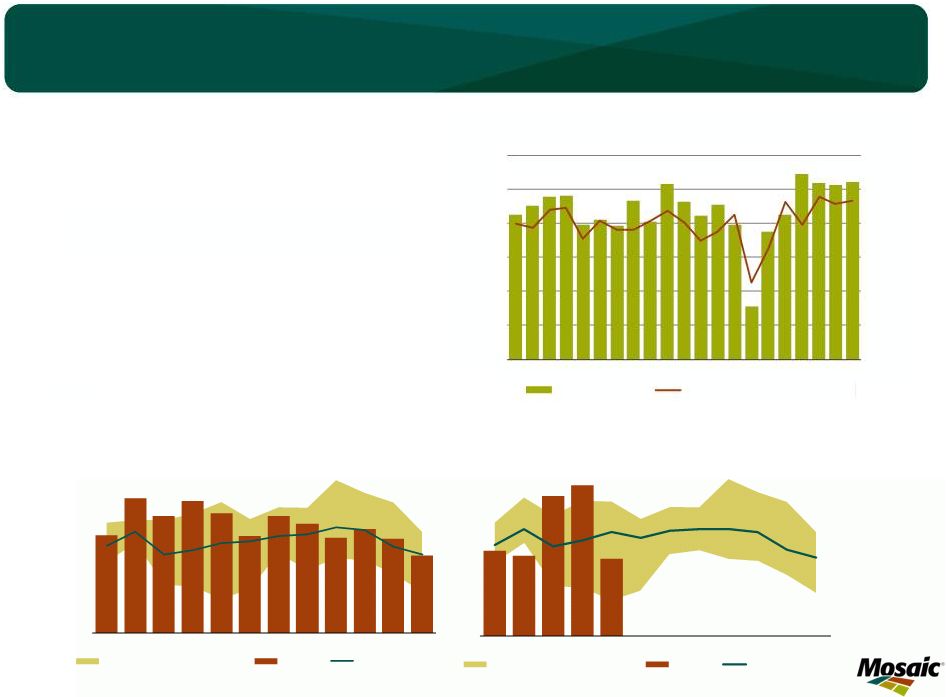 Which Led to a Tale of Two Hemispheres 25 Americas – Strong Demand in 2013 and Outstanding Prospects Remain 0.0 0.2 0.4 0.6 0.8 1.0 1.2 Jul Aug Sep Oct Nov Dec Jan Feb Mar Apr May Jun Mil Tons U.S. DAP and MAP/MES Shipments MIN MAX Range (05/06-11/12) 2012/13 7-Yr Olympic Avg Source: TFI and Mosaic 0.0 0.2 0.4 0.6 0.8 1.0 1.2 Jul Aug Sep Oct Nov Dec Jan Feb Mar Apr May Jun Mil Tons U.S. DAP and MAP/MES Shipments MIN MAX Range (06/07-12/13) 2013/14 7-Yr Olympic Avg Source: TFI and Mosaic 3.0 4.5 6.0 7.5 9.0 10.5 12.0 3.0 3.5 4.0 4.5 5.0 5.5 6.0 95 97 99 01 03 05 07 09 11 13 15F Mil Tons Product Mil Tons P 2 O 5 NA Phosphate Use and DAP/MAP/MES/TSP Shipments Phosphate Use Phosphate Product Shipments Source: AAPFCO, TFI, IFA and Mosaic Fertilizer Year Ending June 30 |
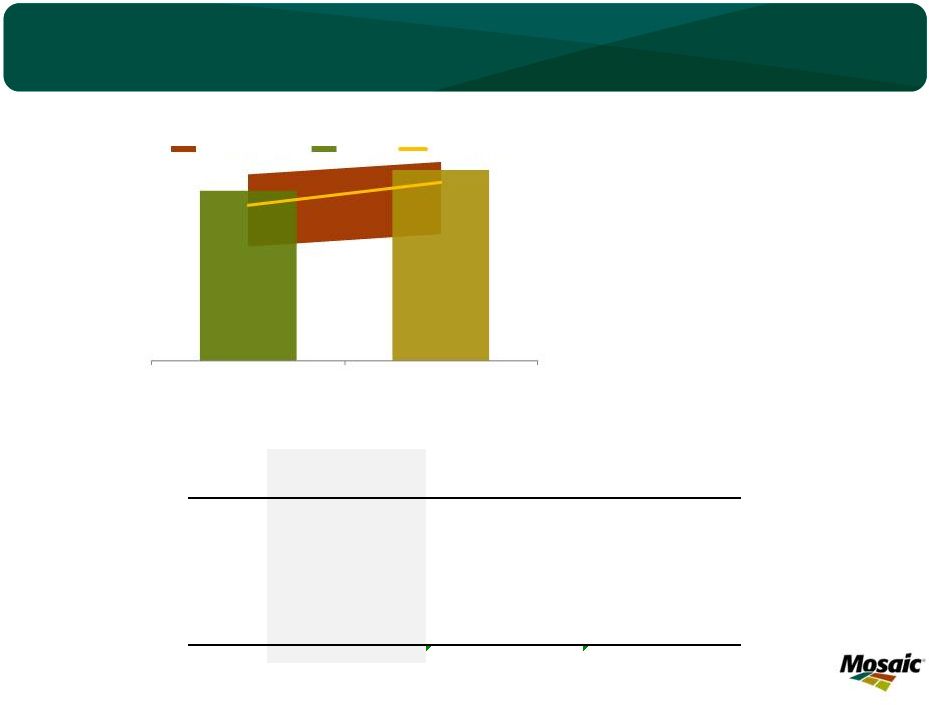 Actual Forecast Shipments 13/14 Shipments 13/14 Shipments 13/14 Jun-May % Chg Jun-Nov % Chg Dec-May % Chg. 2005/06 8,218 18% 3,726 22% 4,492 14% 2006/07 8,485 14% 3,600 27% 4,885 5% 2007/08 9,507 2% 4,639 -2% 4,868 5% 2008/09 6,415 51% 3,040 50% 3,375 51% 2009/10 8,078 20% 3,573 27% 4,505 13% 2010/11 9,673 0% 4,355 5% 5,317 -4% 2011/12 9,042 7% 4,556 0% 4,486 14% 2012/13 10,076 -4% 4,983 -9% 5,094 0% 2013/14F 9,668 n/a 4,555 n/a 5,113 n/a 7-yr Oly Avg 8,957 8% 4,145 10% 4,768 7% 1000 tons of DAP, MAP, TSP, MES North American Domestic Phosphate Shipments Which Led to a Tale of Two Hemispheres 26 Americas – Strong Demand in 2013 and Outstanding Prospects Remain 0.0 1.0 2.0 3.0 4.0 5.0 6.0 Jun-Nov 2013 Dec-May 2014 F Mil Tons North American Phosphate Product Shipments 7-Yr Min-Max Range 2013/14 7-Yr Olympic Average |
 Which Led to a Tale of Two Hemispheres 27 Americas – Strong Demand in 2013 and Outstanding Prospects Remain 0 100 200 300 400 500 600 700 800 Jan Feb Mar Apr May Jun Jul Aug Sep Oct Nov Dec 1000 Tonnes Brazil DAP/MAP/TSP Imports Min/Max Range (2008-2012) 2013 Fcst 7-Yr Olympic Average Source: Brazil Mosaic 0.0 0.5 1.0 1.5 2.0 2.5 3.0 3.5 4.0 4.5 5.0 00 01 02 03 04 05 06 07 08 09 10 11 12 13F 14F MMT Brazil DAP/MAP/TSP Imports DAP MAP/MES TSP Souce: Fertecon, ANDA, Mosaic |
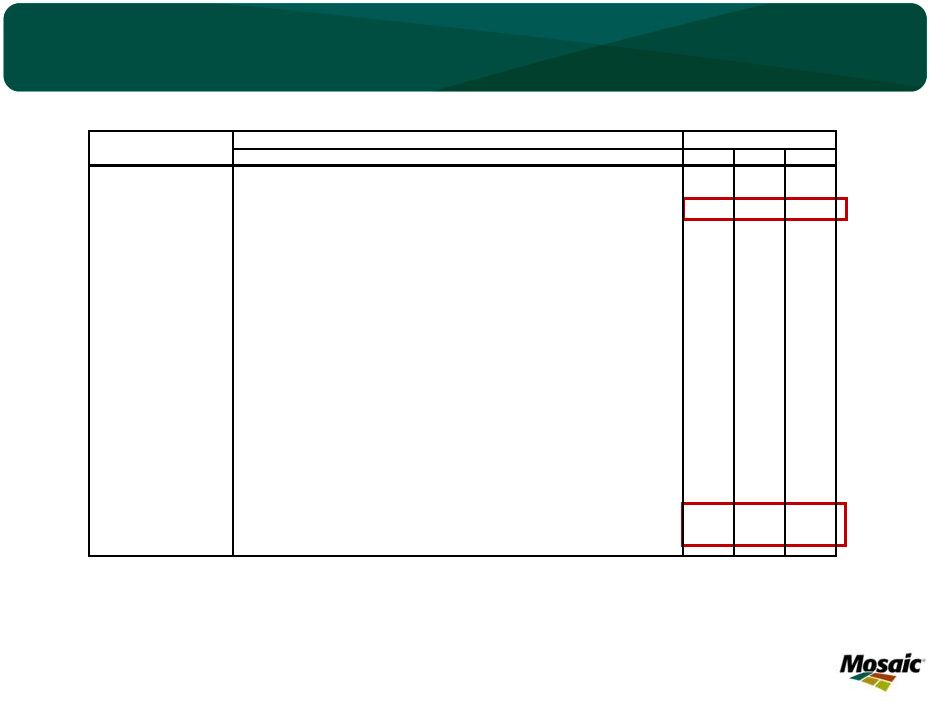
 India DAP Pipeline Example: 2014/15 28 Million Tonnes DAP 2013/14E 2014/15F Producer/Importer Beginning Inventory 1.45 1.20 Production 3.67 3.80 Imports 3.90 5.70 Producer/Importer Sales to Retailer Dealers 7.82 9.70 Retail Dealer Sales to Farmers 9.82 10.30 Retail Inventory Change -2.00 -0.60 Producer/Importer Ending Inventory 1.20 1.00 Producer/Importer Inventory Change -0.25 -0.20 Total Pipeline Inventory Change -2.25 -0.85 India will have a limited ability to further draw down pipeline inventories to meet farmer demand, and we expect marked improvement in imports even under the assumption that they can flush the pipeline further (to the tune of nearly 1 million tonnes). |
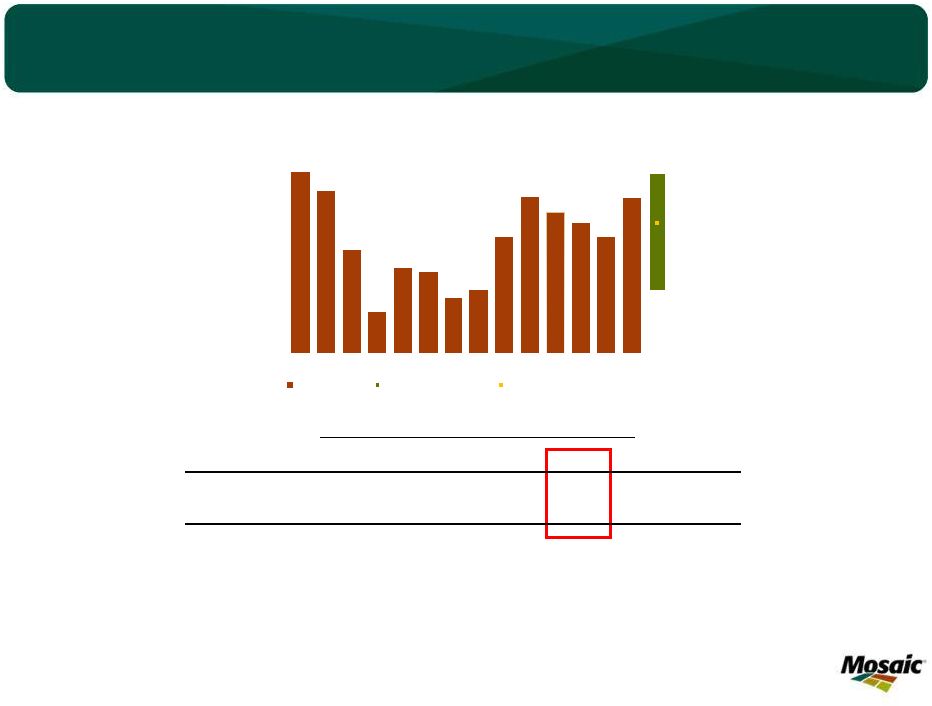
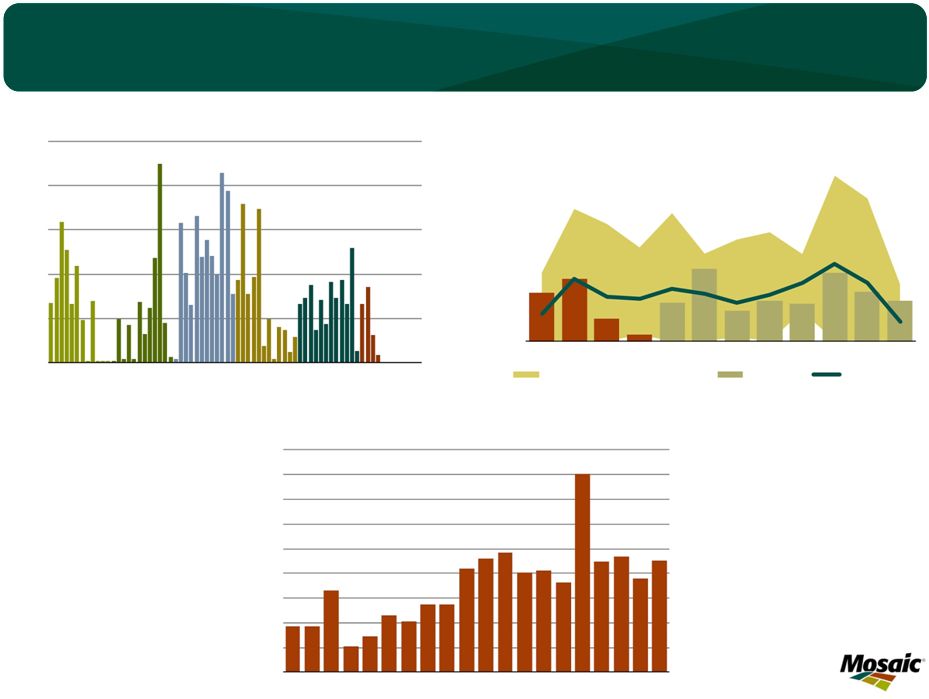
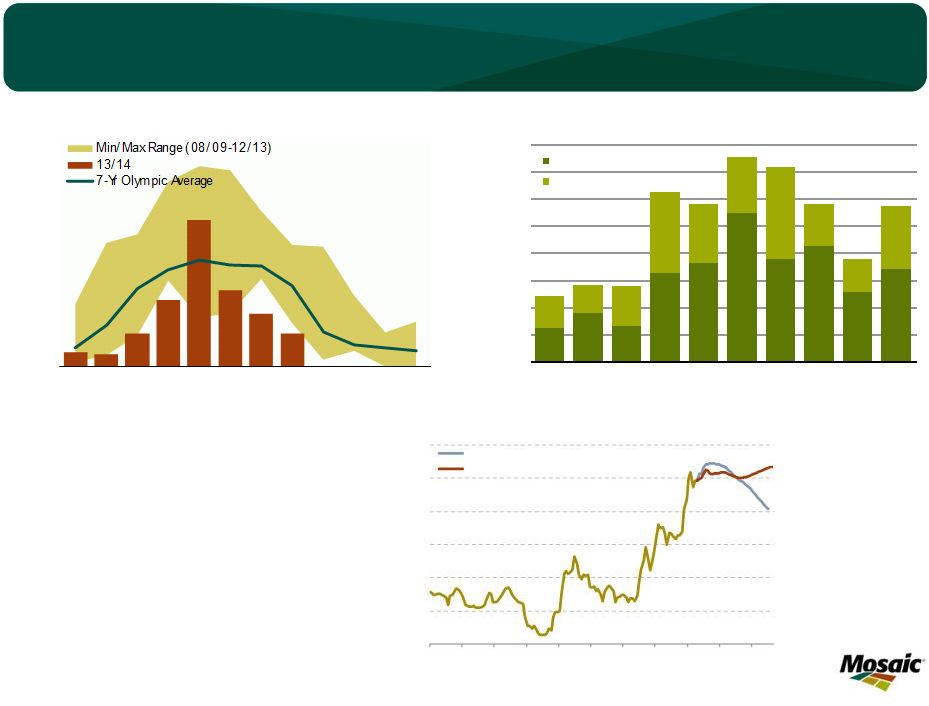 Will Likely Remain a Tale of Two Hemispheres, but the Beginning of a Recovery in India 29 The exchange rate remains a risk to the forecast, as depreciation of the Rupee was a primary driver of lower Indian imports in 2013. Changes to the subsidy regime could also play a role, with election year politics another wildcard. 1.2 1.8 1.3 3.3 3.6 5.5 3.8 4.2 2.6 3.4 1.2 1.0 1.5 3.0 2.2 2.1 3.4 1.5 1.2 2.3 0.0 1.0 2.0 3.0 4.0 5.0 6.0 7.0 8.0 06 07 08 09 10 11 12 13 14F 15F Mil Tonnes Fertilizer Year Ending March 31 India DAP Imports Kariff (Apr 1-Sep 30) Rabi (Oct 1-Mar 31) Source: FAI and Mosaic India 38 43 48 53 58 63 68 A-03 N-04 F-06 M-07 A-08 N-09 F-11 M-12 A-13 N-14 F-16 INR/US$ India Forex November Fcst December Fcst Source: IHS Global 0 200 400 600 800 1,000 1,200 1,400 1,600 Apr May Jun Jul Aug Sep Oct Nov Dec Jan Feb Mar 1000 Tonnes India DAP Imports Source: FAI |
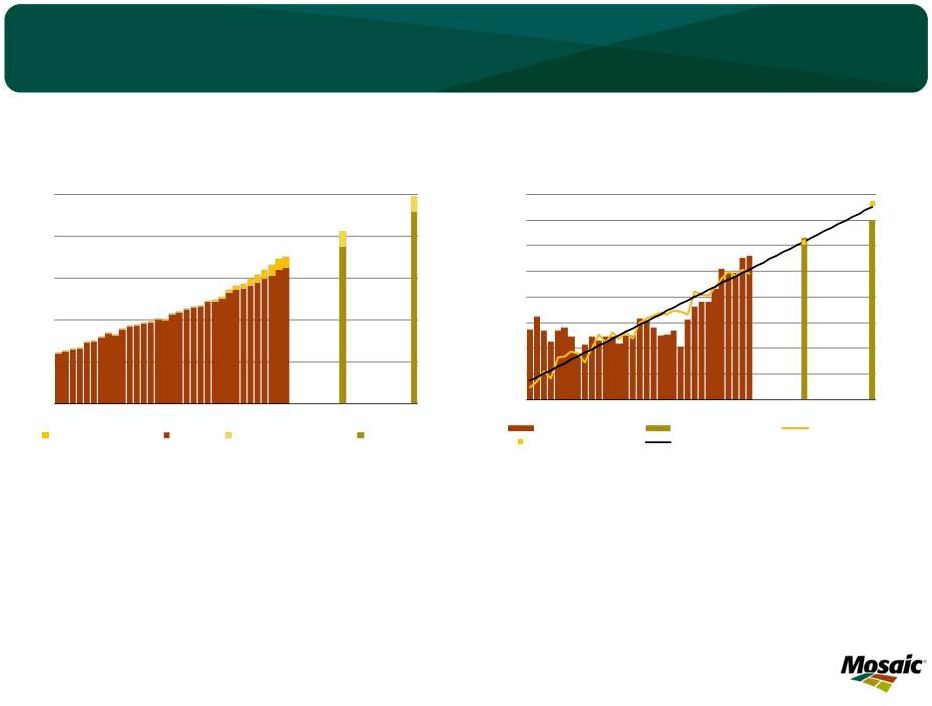
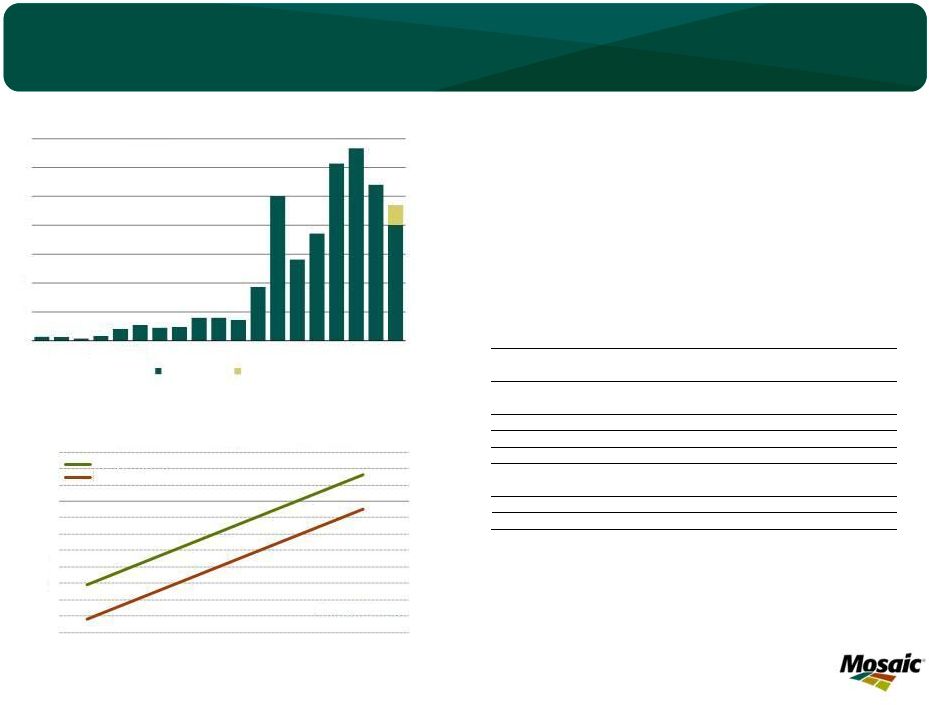
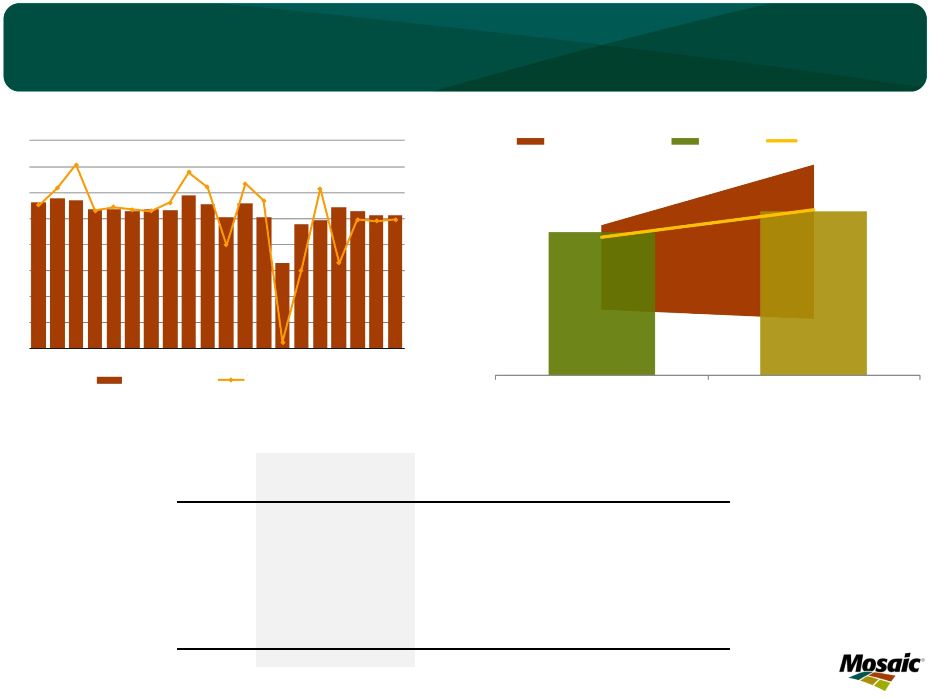
 No More Living off the Pipeline, so: Record Shipments and a Rebound in Import Demand 30 51 47 53 59 62 63 63-64 64-66 30 35 40 45 50 55 60 65 70 00 01 02 03 04 05 06 07 08 09 10 11 12 13F 14F Global Phosphate Shipments Likely Scenario MMT Product DAP/MAP/MES/TSP Source: Fertecon & Mosaic 0 5 10 15 20 25 00 01 02 03 04 05 06 07 08 09 10 11 12 13F 14F MMT Source: CRU/FRC and Mosaic Global Phosphate Import Demand Likely Scenario excluding China Asia and Oceania Latin America Europe Mideast Africa North America FSU |
 2014 Wildcard: China’s exports likely will cap the recent rally in DAP prices later in 2014 31 Chinese phosphates exports declined in 2013 due to a combination of lower Indian imports and profitability issues during a period of falling prices. Export tariffs have been set for 2014. While lower than last year, the tariff appears to remain prohibitive during the ‘high tax’ season. High-Tax 0.0 1.0 2.0 3.0 4.0 5.0 6.0 7.0 95 97 99 01 03 05 07 09 11 13 YTD Mil Tonnes China DAP/MAP/TSP Exports Actual Forecast Source: Fertecon, China Customs, Mosaic ($160) ($140) ($120) ($100) ($80) ($60) ($40) ($20) $0 $20 $40 $60 $300 $325 $350 $375 $400 $425 $450 $475 $500 $ Tonne DAP CNF India Chinese FOB Gross Export Margin to India Integrated Non-Integrated Source: Mosaic Product Urea DAP/MAP TSP/SSP MOP/SOP NPKs NPs PKs Amm Chloride CNY 600/tonne 30% CNY 50/tonne 15% + CNY 50/tonne 16 May-15 Oct 1 Jan-15 May / 16 Oct-31 Dec 5% 5% 16 May-15 Oct 1 Jan-15 May / 16 Oct-31 Dec 5% CNY 50/tonne 15% + CNY 50/tonne CNY 40/tonne 15% + CNY 40/tonne Jul-Oct Jan-Jun / Nov-Dec Chinese Export Tariffs for 2014 Off Season Peak Season |
 Potash Situation and Outlook |
 Key Features and Take Aways Prices likely at or near a floor Expected demand rebound in response to lower prices in 2014 – Less robust but still constructive demand drivers – Rebound led by the “Big Six” Large producer but lean channel inventories worldwide Trigger event required to get product moving down the pipeline – 2014 FH China contract settlement (following recently announced North American fill prices) – More clarity/certainty about agricultural commodity prices following the January 10 USDA reports – BPC 2.0: potential significant impact on psychology/sentiment but not on market fundamentals Still several uncertainties and caution flags – Agricultural commodity prices • Size of the Southern Hemisphere crop • 2014 U.S. Prospective Plantings report (March 31) • China corn imports (resolution to the GMO issue) • Instincts of the speculative herd – Indian 2014/15 potash subsidy – Impact of two Canpotex proving runs – Macroeconomic backdrop (especially impact on exchange rates) Bottom line: stable near term price outlook with modest upside risk later in 2014 33 |
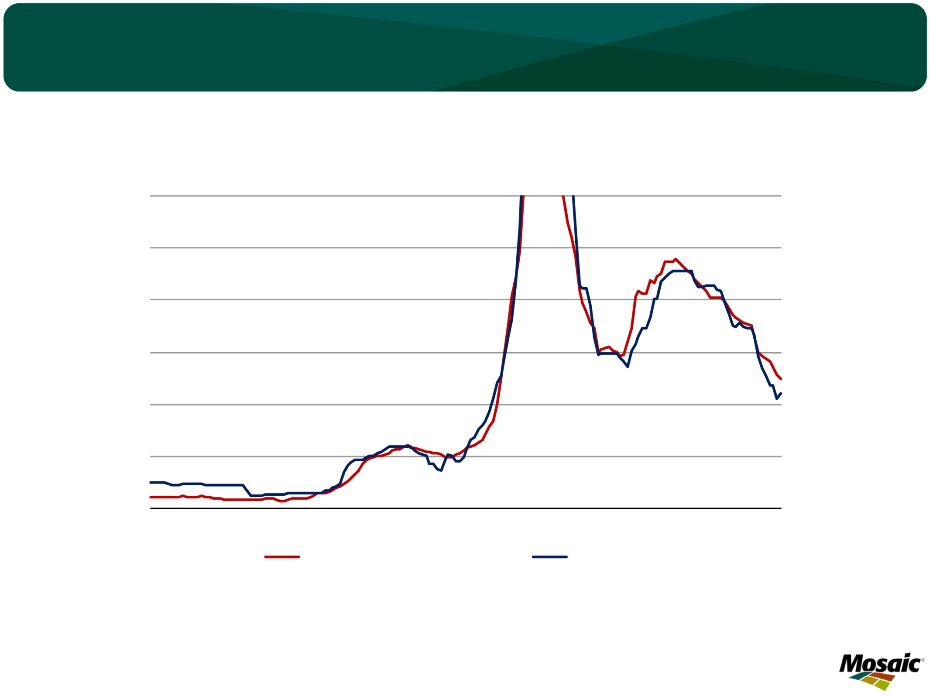 Prices likely at or near a bottom 34 100 200 300 400 500 600 700 100 200 300 400 500 600 700 00 01 02 03 04 05 06 07 08 09 10 11 12 13 14 $ MT c&f Brazil $ ST fob Midwest Terminal Blend Grade Muriate of Potash Prices fob U.S. Midwest Warehouse c&f Brazil Source: Green Markets and ICIS |
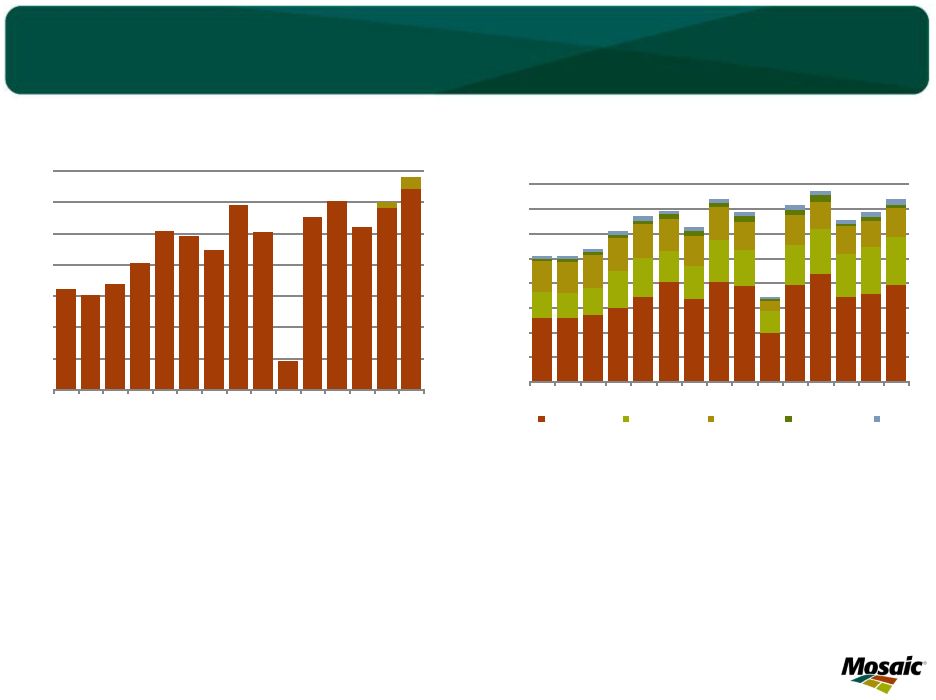 Demand rebound in response to lower prices in 2014 35 54 50 30 53 55 51 54-55 -59 25 30 35 40 45 50 55 60 00 01 02 03 04 05 06 07 08 09 10 11 12 13E 14F Global Potash Shipments Likely Scenario MMT Product KCl Source: Fertecon and Mosaic 57 0 5 10 15 20 25 30 35 40 00 01 02 03 04 05 06 07 08 09 10 11 12 13E 14F MMT KCl Global Potash Import Demand Likely Scenario excluding Canada => U.S. Asia/Oceania Latin America Europe/FSU North America Other Source: Fertecon and Mosaic |
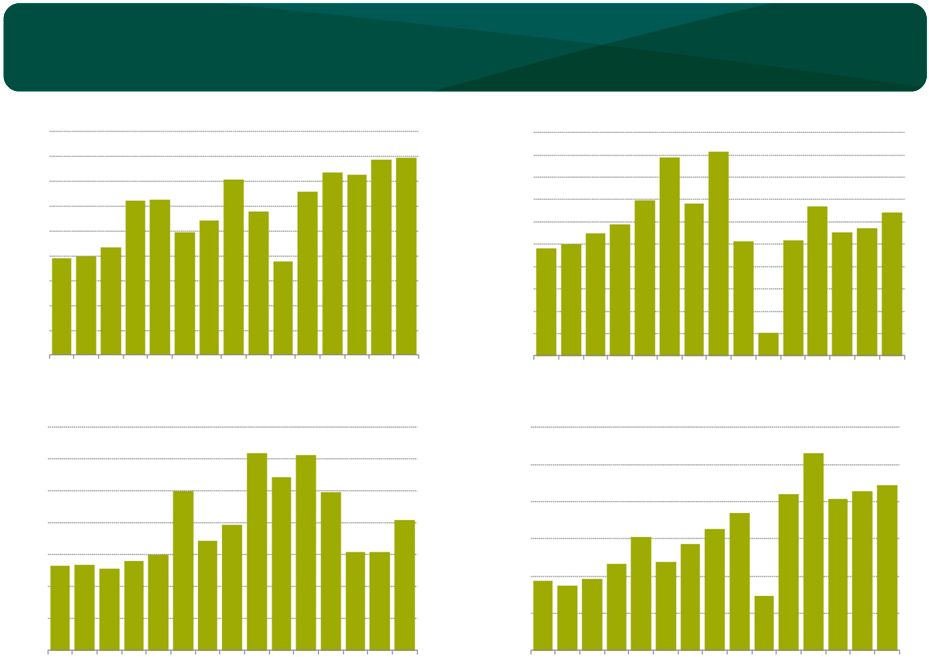 36 Rebound led by the “Big Six” 0.0 1.0 2.0 3.0 4.0 5.0 6.0 7.0 8.0 9.0 00 01 02 03 04 05 06 07 08 09 10 11 12 13E 14F MMT Brazil MOP Import Demand Source: Fertecon and Mosaic 0.0 1.0 2.0 3.0 4.0 5.0 6.0 7.0 8.0 9.0 10.0 00 01 02 03 04 05 06 07 08 09 10 11 12 13E 14F MMT China Net MOP Import Demand Source: Fertecon and Mosaic 0.0 1.0 2.0 3.0 4.0 5.0 6.0 7.0 00 01 02 03 04 05 06 07 08 09 10 11 12 13E 14F MMT India MOP Import Demand Source: Fertecon and Mosaic 0.0 1.0 2.0 3.0 4.0 5.0 6.0 00 01 02 03 04 05 06 07 08 09 10 11 12 13E 14F MMT Indonesia/Malaysia MOP Import Demand Source: Fertecon and Mosaic |
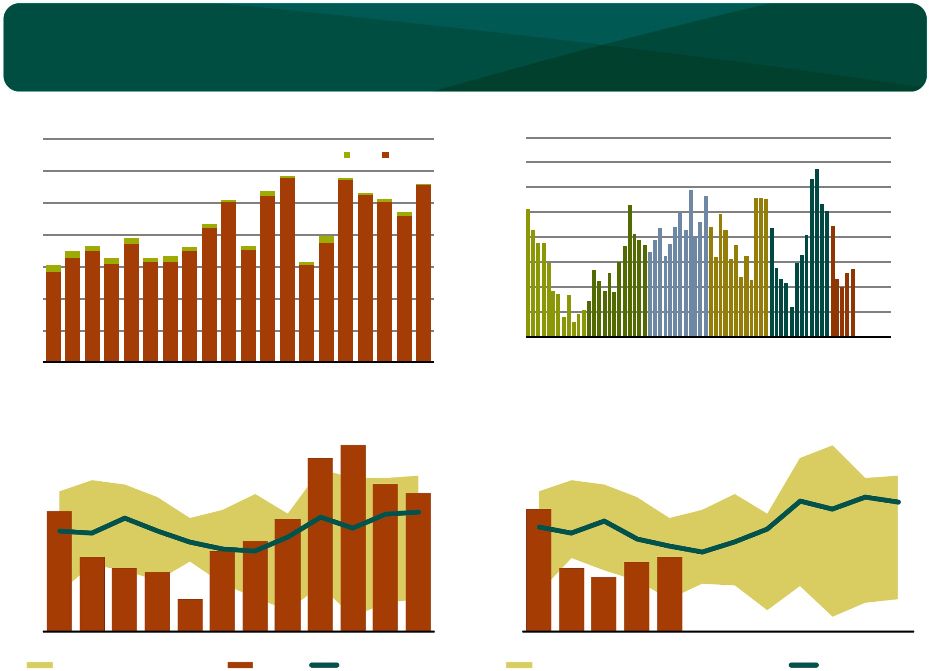 Large expected rebound in NA exports in response 37 North American MOP Exports Mil Tons KCl Source: IPNI and Mosaic 0.0 0.2 0.4 0.6 0.8 1.0 1.2 1.4 1.6 Jul Aug Sep Oct Nov Dec Jan Feb Mar Apr May Jun MIN MAX Range (05/06-11/12) 2012/13 7-Yr Olympic Avg 0 2 4 6 8 10 12 14 96 97 98 99 00 01 02 03 04 05 06 07 08 09 10 11 12 13 14F15F Mil Tons KCl North American MOP Exports U.S. Canada Source: IPNI and Mosaic Fertilizer Year Ending June 30 Mil Tons KCl North American MOP Exports Source: IPNI and Mosaic 0.0 0.2 0.4 0.6 0.8 1.0 1.2 1.4 1.6 Jul Aug Sep Oct Nov Dec Jan Feb Mar Apr May Jun MIN MAX Range (06/07-12/13) 2013/14 7-Yr Olympic Avg 0.0 0.2 0.4 0.6 0.8 1.0 1.2 1.4 1.6 Jul 2008/09 Jan Jul 2009/10 Jan Jul 2010/11 Jan Jul 2011/12 Jan Jul 2012/13 Jan Jul 2013/14 Jan Mil Tonnes KCl North America MOP Exports Source: IPNI |
 Actual Forecast Shipments 13/14 Shipments 13/14 Shipments 13/14 Jun-May % Chg Jun-Nov % Chg Dec-May % Chg. 2005/06 9,050 10% 4,355 7% 4,695 13% 2006/07 11,205 -11% 4,376 6% 6,829 -22% 2007/08 10,653 -7% 4,698 -1% 5,955 -11% 2008/09 5,764 73% 3,953 17% 1,811 193% 2009/10 7,671 30% 2,112 120% 5,558 -5% 2010/11 10,681 -7% 4,701 -1% 5,980 -11% 2011/12 8,667 15% 4,577 1% 4,090 30% 2012/13 10,092 -1% 4,867 -5% 5,225 1% 2013/14F 9,945 n/a 4,645 n/a 5,300 n/a 7-yr Oly Avg 9,553 4% 4,461 4% 5,362 -1% 1000 tons of MOP North American Domestic Muriate of Potash Shipments Rebound led by the “Big Six” including high and steady NA shipments 38 5 6 7 8 9 10 11 12 13 0 1 2 3 4 5 6 7 8 96 97 98 99 00 01 02 03 04 05 06 07 08 09 10 11 12 13 14F15F Mil Tons KCl Mil Tons K 2 O North American Potash Use and MOP Shipments Ag Use (L) Total Shipments (R) Source: IPNI and Mosaic Fertilizer Year Ending June 30 0.0 1.0 2.0 3.0 4.0 5.0 6.0 7.0 8.0 Jun-Nov 2013 Dec-May 2014 F Mil Tons KCl North American Potash Shipments 7-Yr Min-Max Range 2013/14 7-Yr Olympic Average |
 U.S. offshore imports expected to drop in 2013/14 and rebound to average levels in 2014/15 39 0 50 100 150 200 250 Jul 2008/09 Jan Jul 2009/10 Jan Jul 2010/11 Jan Jul 2011/12 Jan Jul 2012/13 Jan Jul 2013/14 Jan 1,000 Tonnes KCl U.S. MOP Offshore Imports Source: U.S. Department of Commerce U.S. trade data one month delayed 0.0 0.1 0.1 0.2 0.2 0.3 0.3 Jul Aug Sep Oct Nov Dec Jan Feb Mar Apr May Jun Mil Tons KCl North American MOP Imports MIN MAX Range (06/07-12/13) 13/14 Fcst 7-Yr Oly Avg Source: IPNI and Mosaic 0.0 0.2 0.4 0.6 0.8 1.0 1.2 1.4 1.6 1.8 96 97 98 99 00 01 02 03 04 05 06 07 08 09 10 11 12 13 14F15F Mil Tons KCl North American MOP Imports Source: IPNI, USDOC, and Mosaic Fertilizer Year Ending June 30 |
 Large producer but lean channel inventories – need a trigger to get the ‘K pig moving through the python’ 40 0.0 0.5 1.0 1.5 2.0 2.5 3.0 3.5 4.0 Jul 2008/09 Jan Jul 2009/10 Jan Jul 2010/11 Jan Jul 2011/12 Jan Jul 2012/13 Jan Jul 2013/14 Jan Mil Tonnes KCl North America MOP Producer Stocks Source: IPNI 0.0 0.5 1.0 1.5 2.0 2.5 3.0 3.5 4.0 4.5 Jul Aug Sep Oct Nov Dec Jan Feb Mar Apr May Jun Mil Tons KCl North American MOP Stocks MIN MAX Range (06/07-12/13) 13/14 7-Yr Oly Avg Source: IPNI and Mosaic |
 Factors to Watch and Handicap |
 Factors to Watch and Handicap 42 Agricultural Commodity Prices – South American crop progress • The market likely has baked in a record soybean crop but it could further weigh on prices once it is in the bin (Feb/Mar) – Energy, biofuels and livestock prices • But proposed changes to the U.S. RFS in 2014 likely will have only a limited impact in the near term – U.S. Prospective Plantings report on March 31 • Less corn acreage is required but will farmers plant too much if 2015 new crop is $4.50+ and it is an early spring? – China soybean (how large?) and corn (how low) imports – Macroeconomic developments and their impact on exchange rates – Instincts of the large speculative herd – what might drive them in or spook them out? |
 Factors to Watch and Handicap 43 Other P&K Fundamentals – Global pipeline and producer inventories • The “P” pig is moving through the python but when will the python swallow the “K” pig? – Developments in India • Plant nutrient subsidy rates (2014/15 budget tabled by February 28) • Settlement of P&K contracts – Developments in China • Settlement of K contract • Phosphate exports – what volume at what price? – New P&K supplies in 2014 • Continued ramp-up of Ma'aden production and commissioning of OCP granulation and acid plants • Indian JV plants in Tunisia (Tifert) and Jordan (Jifco) • Continued start-up of brownfield K projects and management of Canpotex proving runs Triggers that could change sentiment – Settlement of large contracts in China and India – Agricultural commodity price breakout from current range – Unexpected supply disruption (e.g. mine/plant outage or transportation glitch) – Political or macroeconomic event |
 Market Outlook Picking Up the Knife (and starting a fight?) Mosaic AgCollege Orlando, FL January 14, 2014 Michael R. Rahm Vice President Market and Strategic Analysis Andy Jung Director Market and Strategic Analysis Thank You for Your Business! |