Exhibit 99.1


Market Mosaic is a newsletter published for our customers, suppliers and stakeholders by the Market and Strategic Analysis group of The Mosaic Company. Some issues assess the near term outlook for agricultural and plant nutrient markets while others take an in-depth look at a topic of special interest to our readers. This issue examines the near term outlook for agricultural commodity and plant nutrient markets.
Michael R. Rahm
Vice President, Market and Strategic Analysis
Andy J. Jung
Director, Market and Strategic Analysis
Luis F. Dowling
Sr. Market Analyst
Josh Paula
Sr. Market Analyst
Mathew Philippi
Market Analyst
There is a bear-market rule of trading that says never try to catch a falling knife. Rather, let it hit the floor and then just pick it up. The risk, especially after a prolonged bear run, is that a knife fight breaks out among traders.
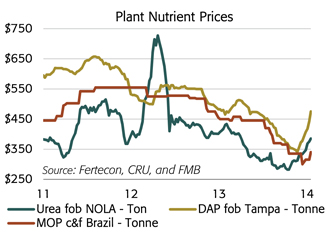
This rule helps to explain some of the recent developments in plant nutrient markets. Knives fell. The chart shows that prices of the leading plant nutrient products declined steadily during the last two-plus years for well-known reasons. Distributors adhered to this rule by running down and then maintaining lean channel inventories during this long and slow burn.
Once distributors perceived that prices had bottomed, or that knives had hit the floor, they rushed to position product. Based on the recent spikes in nitrogen and phosphate prices, distributors not only have picked up the knives, but they have started a few fights as they compete to position product for the upcoming application season.
In the case of phosphate, the combination of continued strong end-user demand, a lean distribution pipeline and the cumulative impact of several small planned and unplanned production outages has tightened the global market and changed sentiment overnight. As a result, phosphate prices are staging a powerful and earlier-than-expected rally during what typically is a seasonally slow period.
So, how will this knife fight end? The phosphate market no doubt is tight due to recent developments, and our assessment is that there is more upside than downside price risk in the near term. However, Chinese export economics likely will set a ceiling later in 2014. In the meantime, a fight for tonnage rages on.

– continued inside
In the case of potash, knives also have hit the floor, but only a few skirmishes have broken out so far. Now the question is will a more serious fight break out – or will potash prices follow the steep rise of nitrogen and phosphate prices? Several recent developments such as the settlement of first half contracts with Chinese buyers and price bumps in Brazil and Southeast Asia are changing sentiment. Our assessment is that potash prices have bottomed and will turn up modestly as the projected rebound in demand begins to tighten the market.
Phosphate: How Does This Knife Fight End?
The price of DAP loaded on a vessel at Tampa had surged to $475 per tonne during the last week of January, a 40% or $135 gain since the end of November. Tampa SWAP contracts for February, March and April were bid at $455 to $465 per tonne with offers at $465 to $470 at the end of January, indicating that prices likely would trade at these higher levels into the spring application season. The price of DAP loaded on a barge at New Orleans (NOLA) also had spiked to about $440 per ton, a 38% or $120 increase during the same period. NOLA SWAP contracts for February, March and April were bid at $430 per ton with offers just a few dollars higher.
Several factors typically combine to move markets by this much in such a short time. In this case, the combination of continued positive demand prospects, a lean distribution pipeline, the cumulative impact of several small planned and unplanned production outages, a spike in sulphur costs, and an increasing number of logistical problems has tightened the market and quickly changed sentiment. Many analysts point to the significant drop in phosphate prices following the fall application season, the sale of three U.S. panamax vessels to Chinese buyers and hints of several production outages as the events that changed expectations and triggered the early buying onslaught.
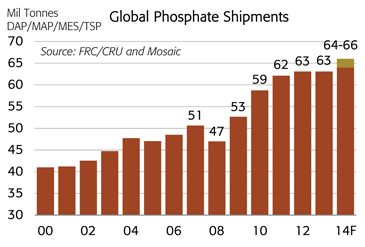
Despite somewhat less robust drivers, demand prospects continue to look positive. Global shipments of the leading phosphate products are forecast to climb to a record 64 to 66 million tonnes in 2014, up from our estimate of slightly more than 63 million in 2013. We also project that import demand for these products will rebound to a record 24 to 25 million tonnes this year, up from 22.5 million in 2013.
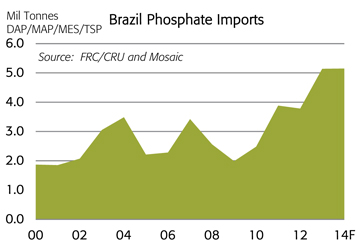
The demand outlook in the Americas remains outstanding. In Brazil, shipments continue to set new records. We estimate that total plant nutrient shipments increased to 31.3 million tonnes last year, up 6% from 2012. Shipments are projected to increase another 3% to more than 32 million tonnes in 2014. Imports of the leading phosphate products including MicroEssentials® jumped to nearly 5.1 million tonnes in 2013, an increase of 36% or 1.4 million from 2012 and more than double the volume just five years ago. Imports are projected to stay at this lofty level in 2014. Both total shipments and phosphate imports mirror the increase in soybean production. Based on the latest CONAB estimates, Brazilian farmers are expected to harvest a record 90.3


million tonnes of soybeans this year, up 10% from the record last year and up more than 50% from the 2005-07 average.
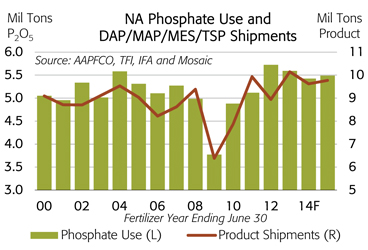
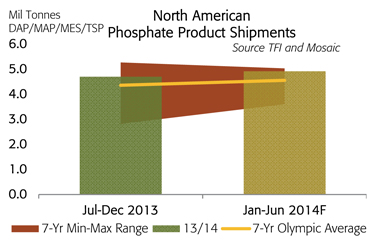
In North America, shipments of the leading phosphate products climbed to a modern-era record of 10.1 million tons in 2012/13. We estimate that shipments will remain at elevated levels of 9.6 million tons in 2013/14 and 9.8 million in 2014/15. The seven-year Olympic average is 9.0 million tons. Shipments during the 2013 fall application season (Jul-Dec) were off about 11% from the record level a year earlier partly due to the later harvest, but movement still exceeded the seven-year Olympic average by 6%. We project that shipments during the spring application season (Jan-Jun) will equal the total last year and exceed the seven-year Olympic average by 6%.
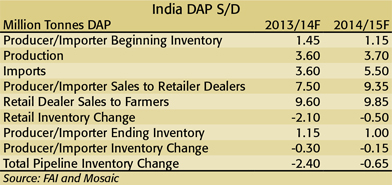
Channel inventories in many countries were pulled down to low levels during the slow price burn of the last two years. India provides the best example. Our Delhi team estimates that destocking of wholesale and retail inventories likely will total about 2.4 million tonnes for the fertilizer year that ends March 31, 2014. As a result, we project that Indian DAP imports will rebound from an estimated 3.6 million tonnes this year to around 5.5 million tonnes in 2014/15. Indian buyers are not expected in the market until the second quarter, but the prospect of a nearly two million tonne rebound in imports is expected to keep fundamentals snug well into the second half of 2014.
On the supply side of the ledger, the cumulative impact of several small planned and unplanned outages has reduced nearby availability. For example, we took down the large No. 5 DAP granulation plant at our Riverview, FL complex for an extended turnaround at the end of November (or during what we expected to be a seasonally slow period!). Modifications will enable this unit to produce DAP, MAP or MicroEssentials® once it is back online in early April.
The Ma’aden facility in Saudi Arabia also continues to ramp up at a slower-than-expected pace. Market publications have reported that the facility is operating at around 60% of capacity due to ongoing start-up issues at the mine, railroad and chemical plants. Finally, other planned and unplanned outages in Australia, Mexico, Tunisia and the United States as well as weather-related logistical disruptions in Morocco also have reduced or delayed shipments at a time when demand has perked up.
So, how will this knife fight end? Our assessment is that there is more upside than downside price risk in the near term given these recent developments as well as the prospect of continued tight fundamentals through the spring application season.
Chinese export economics, however, likely will set a ceiling later in 2014. China has lowered export taxes on nitrogen and phosphate products this year. In the case of DAP and MAP, the export tax during the peak domestic season was set at about $8 per tonne plus 15% of the fob port value. The peak season runs from Jan 1 to May 15 and from October 16 to December 31. The tax during the off-peak season that runs from May 16 to October 15 was set at $8 per tonne. Both the high and low tax rates are significantly less than those a year ago when the high rate was 80% and the low rate was 5% based on prices at the time.
Our Beijing team estimates that, given current raw materials and other costs, the breakeven price for the most efficient integrated Chinese DAP producers during this peak season is about $470 per tonne fob port. That is consistent with reports by industry publications in late January that Chinese exporters were offering DAP at $480 per tonne fob port and that the first ever export during the high-tax season was made to an Australian buyer at this level. We estimate that the breakeven price for non-integrated DAP produces is about $510 per tonne fob port during the current high-tax period.
Assuming no change in costs, the breakeven price for the most efficient integrated Chinese DAP producers during the off-peak season that begins on May 16 would drop to about $410 per tonne fob port. We estimate the breakeven price for non-integrated producers would fall to around $445 per tonne fob port during the off-peak season. If India ends up buying 5.5 million tonnes of DAP, Chinese producers are expected to supply significant volume during a narrow window, and part of this tonnage likely will need to come from higher cost producers.
Potash: Will a Knife Fight Break Out?
In the case of potash, benchmark prices appear to have found a bottom and are beginning to turn up in some regions. The price of blend grade MOP for March delivery to a Brazilian port had increased to $340 per tonne during the last week of January, a 13% or $40 increase from December, and offers for March and April deliveries had increased to the $350 range. We estimate that a Brazilian price of $340 per tonne and a NOLA barge price of $320 per ton result in comparable netbacks for suppliers from the former Soviet Union (FSU) and elsewhere.
The price of blend grade MOP at a U.S. Midwest warehouse had dropped to $350 per ton when spring fill programs were announced in early January and this price is in line with a NOLA barge value of $320, especially in light of northbound navigational challenges


on the river system. So, blend grade prices in the two largest importing countries had converged toward the end of January, and this development is one of the strongest indicators that North American prices likely had bottomed.
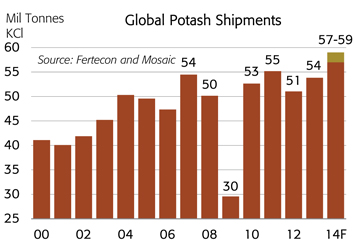
We continue to forecast that global shipments will rebound this year in response to lower prices as well as a need to restock lean distribution pipelines in some countries. In particular, we project that global MOP shipments will jump to a record 57 to 59 million tonnes in 2014, up from about 54 million in 2013. Similarly, global MOP trade, excluding Canadian shipments to the United States, is forecast to increase to 37 to 38 million tonnes this year, up from just more than 34 million last year.
The “big six” are expected to lead the demand rebound this year. North America, Brazil, China, India, Indonesia and Malaysia combined account for roughly two-thirds of world MOP shipments. Each region is expected to register a gain this year.
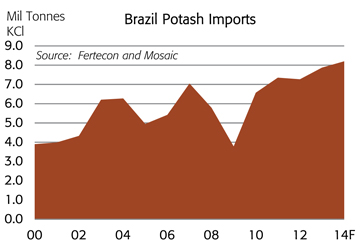
Brazil now ranks as the largest potash importer by a significant margin and is expected to extend its streak of record imports again this year. MOP imports are forecast to increase to 8.2 million tonnes this year, up 4% from 7.9 million in 2013. The growth in imports is driven by steady increases in demand as well as a drop in domestic production from Vale’s Taquari mine. Output from this mine declined another 11% to 487,000 tonnes last year, off 244,000 from the recent peak of 731,000 in 2006.
China’s net MOP imports are projected to increase to more than 6.4 million tonnes in 2014, up 9% from 5.9 million last year. Chinese buyers concluded first-half contracts with major suppliers during the last half of January at a delivered price of $305 per tonne. Total first-half imports likely will add up to 3.5 to 4.0 million tonnes. This estimate includes potential optional tonnage on recent seaborne contracts or additional spot purchases and also assumes average rail delivered volume. So, China is on its way to hitting this forecast. The lower and less volatile price outlook coupled with efforts to boost domestic use as well as build strategic stocks reduces the likelihood that Chinese buyers will withdraw from the market during the second half of 2014 as they did in 2012 and 2013.
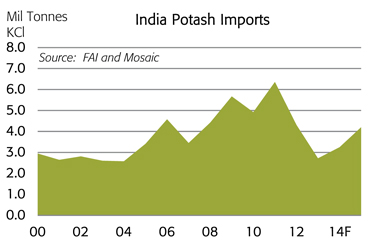
India also is noteworthy due to the expected rebound in imports in 2014/15. Imports are projected to increase about one million tonnes from 3.2 million in 2013/14 to 4.0 to 4.5 million in 2014/15. This forecast assumes that the rupee and retail prices remain stable and that the government sets the nutrient based subsidy (NBS) at a level that makes imports work at current prices.
MOP imports by Southeast Asian countries in general and Indonesia and Malaysia in particular also are expected to increase again this year due to continued strong rice prices and a decent, if not spectacular, rebound in palm oil prices. In particular, the combined imports by Indonesia and Malaysia are forecast to nudge up 4% or nearly 170,000 tonnes from less than 4.2 million tonnes last year to more than 4.3 million in 2014.
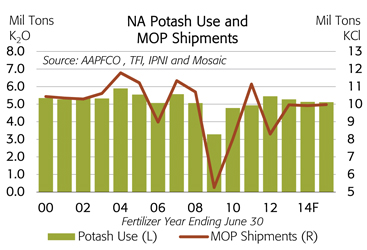
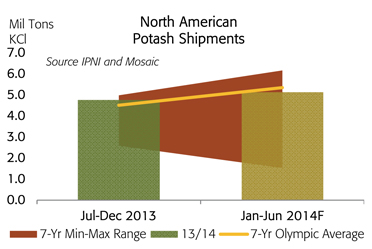
In North America, MOP shipments are expected to remain stable at just less than 10 million tons following several years of volatile swings. We project that MOP shipments will total 9.9 million tons in 2013/14 and then inch up to 10.0 million in 2014/15. That is up from a seven-year Olympic average of 9.6 million tons. Shipments last fall (Jul-Dec) were off only 2% from the lofty volume a year earlier, but movement was up 6% from the seven-year Olympic average. Shipments during the upcoming spring application season (Jan-Jun) are projected to exceed movement a year ago by 1% but fall short of the seven-year Olympic average by 4%.
On the supply side of the ledger, North American producers continue to carry high stocks while distributors in key importing countries such as Brazil, India and the United States continue to hold thin channel inventories. For example, MOP inventories held by North American producers at on-and off-site warehouses totaled 3.0 million tonnes on December 31, down about 5% from a year earlier but still 25% greater than the seven-year Olympic average for this date.
A trigger event is needed to move large producer inventories through the distribution pipeline. Recent developments may have convinced distributors that prices have bottomed. The USDA reports released on January 10 seem to have stabilized key agricultural commodity prices. The settlement of first half Chinese contracts has removed an important uncertainty. Higher realized prices in Brazil have resulted in the convergence of blend grade prices in the two largest import markets.
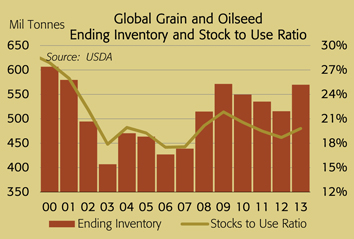
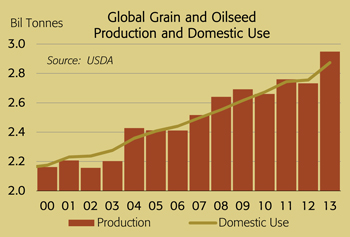
According to the estimates released by the U.S. Department of Agriculture (USDA) on January 10, global grain and oilseed production will total 2.94 billion tonnes in 2013/14, a big step-up from the previous record of 2.76 billion in 2011/12. The record harvest resulted from record harvested area and a record average yield.
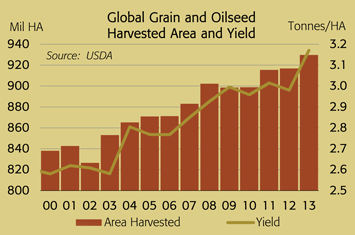
The USDA estimates that farmers harvested 930 million hectares of grain and oilseed crops in 2013/14. That is up almost 100 million hectares since the beginning of this century and is roughly equal to twice the area harvested by Brazilian farmers today! The average grain and oilseed yield also set a record and exceeded trend for the first time in three years. Unlike the previous three years, no weather disasters occurred last year, and nearly all countries produced good crops. A few countries such as Brazil and Canada shattered previous production records.
Global grain and oilseed use was nearly flat in 2012/13 due to the smaller-than-expected, but still second largest ever, crop. Prices of some key commodities spiked to record levels last year in order to allocate the smaller supplies to their highest valued uses. In fact, global grain and oilseed use increased just 0.4% in 2012/13 after increasing at a compound annual growth rate of 2.4% during the previous five years. Larger supplies and more moderate prices this year are expected to unleash pent-up demand from last year. In fact, the USDA estimates that global use will surge 4.3% in 2013/14, nearly equal to two years’ worth of growth.
Global grain and oilseed inventories will increase significantly this year. In fact, the latest USDA projections show that the expected stock build this year will make up for the drawdowns of the last three years.