
The Mosaic Company Earnings Conference Call – Third Quarter 2014 October 30, 2014 Jim Prokopanko, President and Chief Executive Officer Rich Mack, Executive Vice President and Chief Financial Officer Laura Gagnon, Vice President Investor Relations
Click to edit Master title style 2 Safe Harbor Statement This document contains forward-looking statements within the meaning of the Private Securities Litigation Reform Act of 1995. Such statements include, but are not limited to, statements about the Northern Promise Joint Venture, the acquisition and assumption of certain related liabilities of the Florida phosphate assets of CF Industries, Inc. (“CF”) and Mosaic’s ammonia supply agreements with CF; repurchases of stock; other proposed or pending future transactions or strategic plans and other statements about future financial and operating results. Such statements are based upon the current beliefs and expectations of The Mosaic Company’s management and are subject to significant risks and uncertainties. These risks and uncertainties include but are not limited to risks and uncertainties arising from the ability of the Northern Promise Joint Venture to obtain additional planned funding in acceptable amounts and upon acceptable terms, the future success of current plans for the Northern Promise Joint Venture and any future changes in those plans; difficulties with realization of the benefits of the transactions with CF, including the risks that the acquired assets may not be integrated successfully or that the cost or capital savings from the transactions may not be fully realized or may take longer to realize than expected, or the price of natural gas or ammonia changes to a level at which the natural gas based pricing under one of the long term ammonia supply agreements with CF becomes disadvantageous to Mosaic; customer defaults; the effects of Mosaic’s decisions to exit business operations or locations; the predictability and volatility of, and customer expectations about, agriculture, fertilizer, raw material, energy and transportation markets that are subject to competitive and other pressures and economic and credit market conditions; the level of inventories in the distribution channels for crop nutrients; changes in foreign currency and exchange rates; international trade risks and other risks associated with Mosaic’s international operations and those of joint ventures in which Mosaic participates, including the risk that protests against natural resource companies in Peru extend to or impact the Miski Mayo mine; changes in government policy; changes in environmental and other governmental regulation, including greenhouse gas regulation, implementation of numeric water quality standards for the discharge of nutrients into Florida waterways or efforts to reduce the flow of excess nutrients into the Mississippi River basin, the Gulf of Mexico or elsewhere; further developments in judicial or administrative proceedings, or complaints that Mosaic’s operations are adversely impacting nearby farms, business operations or properties; difficulties or delays in receiving, increased costs of or challenges to necessary governmental permits or approvals or increased financial assurance requirements; resolution of global tax audit activity; the effectiveness of Mosaic’s processes for managing its strategic priorities; adverse weather conditions affecting operations in Central Florida, the Mississippi River basin, the Gulf Coast of the United States or Canada, and including potential hurricanes, excess heat, cold, snow, rainfall or drought; actual costs of various items differing from management’s current estimates, including, among others, asset retirement, environmental remediation, reclamation or other environmental regulation, Canadian resources taxes and royalties, the liabilities Mosaic assumed in the Florida phosphate assets acquisition, or the costs of the Northern Promise Joint Venture, its existing or future funding and Mosaic’s commitments in support of such funding; reduction of Mosaic’s available cash and liquidity, and increased leverage, due to its use of cash and/or available debt capacity to fund share repurchases, financial assurance requirements and strategic investments; brine inflows at Mosaic’s Esterhazy, Saskatchewan, potash mine or other potash shaft mines; other accidents and disruptions involving Mosaic’s operations, including potential mine fires, floods, explosions, seismic events or releases of hazardous or volatile chemicals, as well as other risks and uncertainties reported from time to time in The Mosaic Company’s reports filed with the Securities and Exchange Commission. Actual results may differ from those set forth in the forward-looking statements.
Click to edit Master title style 3 ▪ Negative sentiment overblown ▪ This is a cyclical business ▪Mosaic is well positioned to take advantage of the trough Key Messages
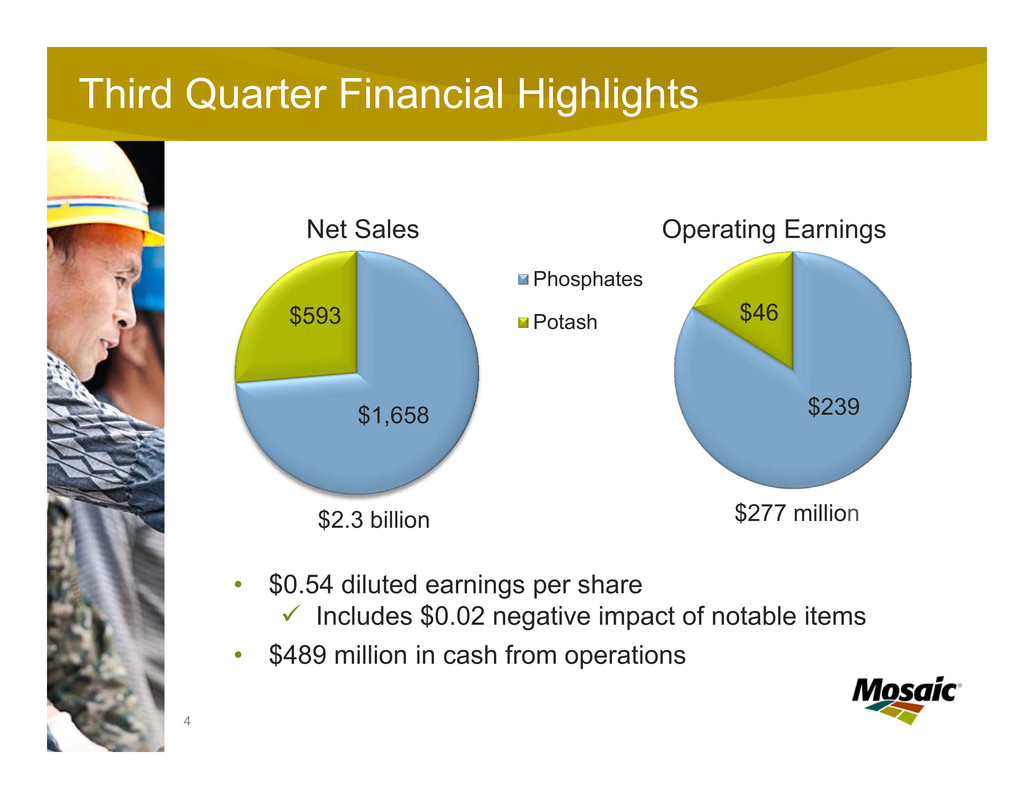
Click to edit Master title style 4 Third Quarter Financial H ghlights $1,658 $593 Net Sales Phosphates Potash $239 $46 Operating Earnings • $0.54 diluted earnings per share Includes $0.02 negative impact of notable items • $489 million in cash from operations $2.3 billion $277 million
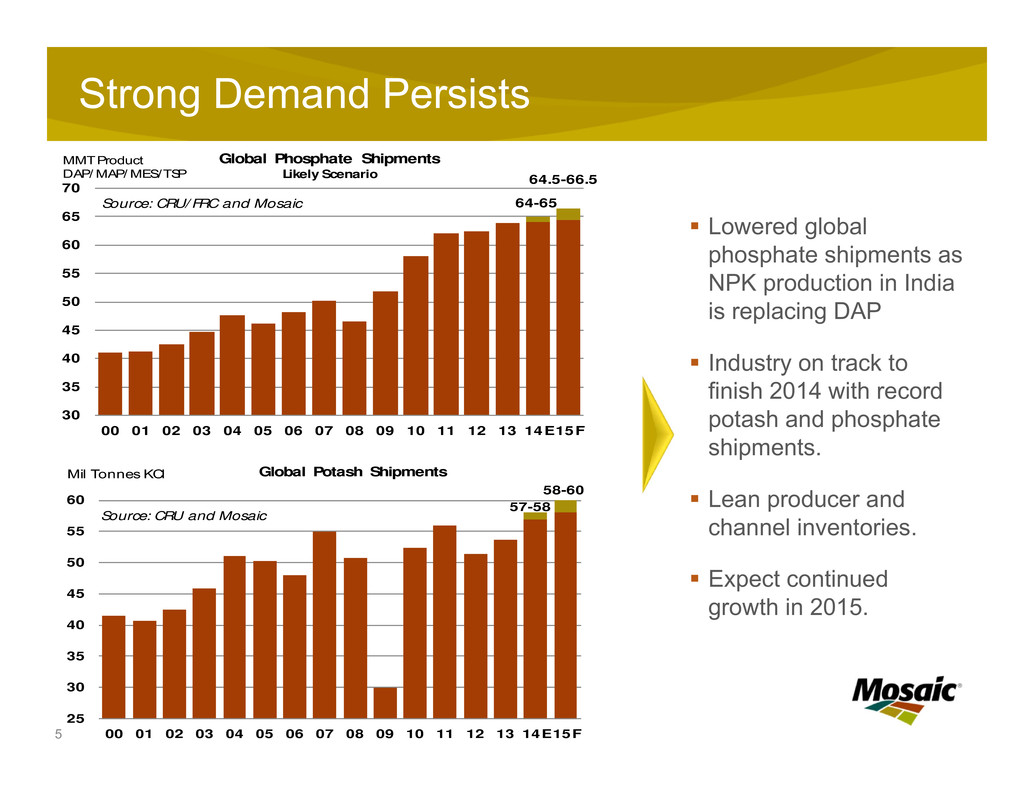
5 Strong Demand Persists 2 Lowered global phosphate shipments as NPK production in India is replacing DAP Industry on track to finish 2014 with record potash and phosphate shipments. Lean producer and channel inventories. Expect continued growth in 2015. 64-65 64.5-66.5 30 35 40 45 50 55 60 65 70 00 01 02 03 04 05 06 07 08 09 10 11 12 13 14E15F Global Phosphate Shipments Likely Scenario MMT Product DAP/ MAP/ MES/TSP Source: CRU/FRC and Mosaic 57-58 58-60 25 30 35 40 45 50 55 60 00 01 02 03 04 05 06 07 08 09 10 11 12 13 14E15F Global Potash ShipmentsMil Tonnes KCl Source: CRU and Mosaic
Click to edit Master title style 6 Continued Confidence in 2015 P&K Demand Expect growth in shipments in 2015: Significant nutrient removal after two large crops in a row Precision agriculture impact on application rates Little financial benefit of breaking the nutrient cycle Crop nutrient remain affordable Watching developments Cyclicality Presents Opportunities
Click to edit Master title style 7 Strategic Accomplishments Expect ADM acquisition to close by end of 2014 Potash expansions continue to be on time and on budget Closed sale of Hersey, Michigan salt mine Signed agreement to sell Argentina business On pace to realize targeted synergies from CF Industries’ phosphate acquisition Ma’aden phosphate joint venture is progressing as planned Continuing to invest in optimizing the phosphate business: Reviewing ammonia de-bottlenecking at Faustina Executing well on MicroEssentials® expansion at New Wales Investing in sulfur melting capacity

Progress on Ma’aden Joint Venture 8 Ammonia - Main Control Building

Financial Results Review
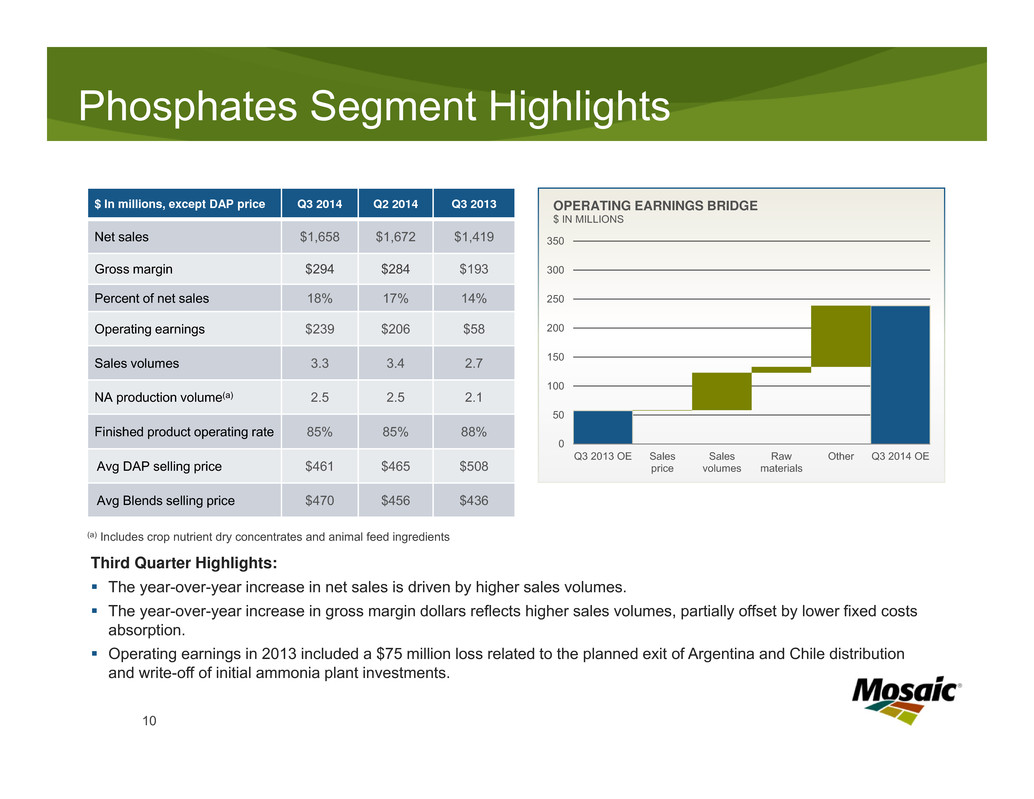
Third Quarter Highlights: The year-over-year increase in net sales is driven by higher sales volumes. The year-over-year increase in gross margin dollars reflects higher sales volumes, partially offset by lower fixed costs absorption. Operating earnings in 2013 included a $75 million loss related to the planned exit of Argentina and Chile distribution and write-off of initial ammonia plant investments. 10 Phosphates Segment Highlights $ In millions, except DAP price Q3 2014 Q2 2014 Q3 2013 Net sales $1,658 $1,672 $1,419 Gross margin $294 $284 $193 Percent of net sales 18% 17% 14% Operating earnings $239 $206 $58 Sales volumes 3.3 3.4 2.7 NA production volume(a) 2.5 2.5 2.1 Finished product operating rate 85% 85% 88% Avg DAP selling price $461 $465 $508 Avg Blends selling price $470 $456 $436 (a) Includes crop nutrient dry concentrates and animal feed ingredients 0 50 100 150 200 250 300 350 Q3 2013 OE Sales price Sales volumes Raw materials Other Q3 2014 OE OPERATING EARNINGS BRIDGE $ IN MILLIONS

Third Quarter Highlights: • The increase in net sales was driven by higher sales volumes, partially offset by lower realized MOP prices. • The year-over-year decrease in operating earnings was driven by lower realized prices, lower fixed cost absorption, higher Canadian resources taxes, changes in mark-to-market of derivatives and higher depreciation, partially offset by lower plant spending and higher sales volumes. • Production efficiencies more than offset the negative impact of lower operating rate. 11 Potash Segment Highlights $ In millions, except MOP price Q3 2014 Q2 2014 Q3 2013 Net sales $593 $762 $523 Gross margin $131 $250 $184 Percent of net sales 22% 33% 35% Operating earnings $46 $213 $92 Sales volumes 1.8 2.5 1.4 Production volume 1.7 2.0 2.0 Production operating rate 62% 76% 73% Avg MOP selling price $291 $267 $342 0 20 40 60 80 100 120 140 160 180 200 Q3 2013 OE Sales price Sales volumes Resource taxes & royalties Unrealized mark-to- market Production and other Q3 2014 OE OPERATING EARNINGS BRIDGE $ IN MILLIONS

Balance Sheet and Capital Update $47 per Share Increased debt levels by $800 million See repurchases at current levels as attractive opportunity: Repurchased 3.5 million shares in the open market since last earnings call Increased targeted liquidity buffer to $2.5 billion, including $1 billion cash on the balance sheet: Higher working capital requirements to fund acquired business growth $3 billion in cash and cash equivalents as of the end of Q3’2014: Includes $1 billion committed to ADM fertilizer business acquisition and RCRA asset retirement obligations 12
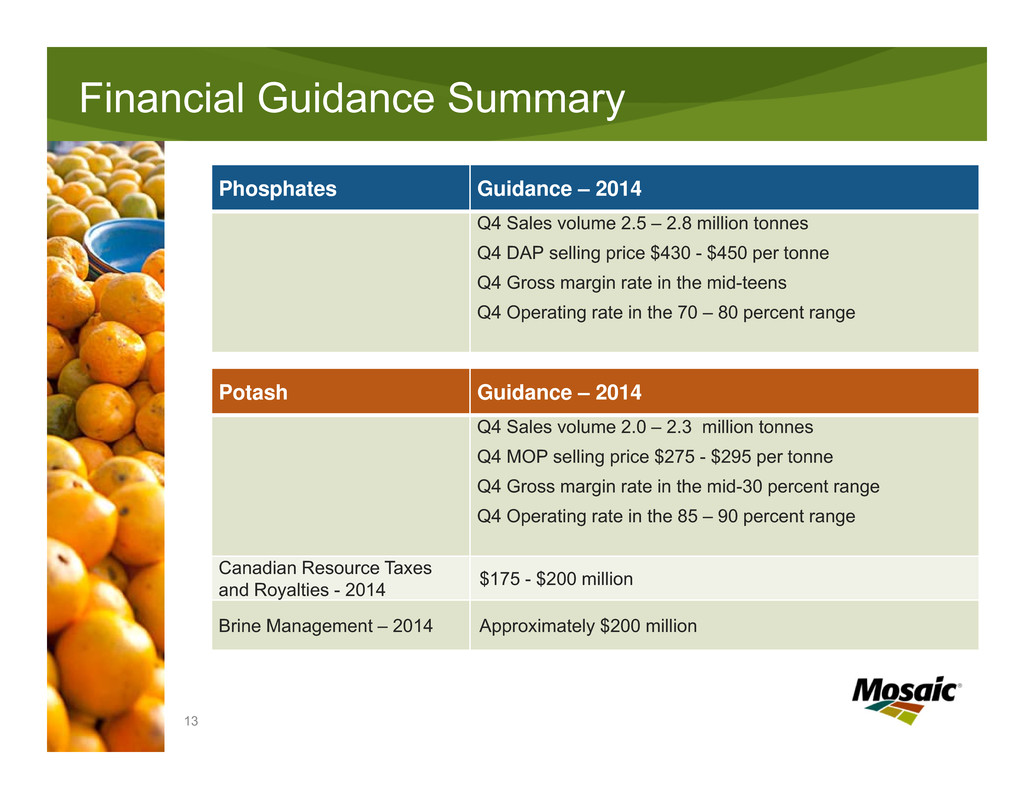
Click to edit Master title style 13 Financial Guidance Summary Phosphates Guidance – 2014 Q4 Sales volume 2.5 – 2.8 million tonnes Q4 DAP selling price $430 - $450 per tonne Q4 Gross margin rate in the mid-teens Q4 Operating rate in the 70 – 80 percent range Potash Guidance – 2014 Q4 Sales volume 2.0 – 2.3 million tonnes Q4 MOP selling price $275 - $295 per tonne Q4 Gross margin rate in the mid-30 percent range Q4 Operating rate in the 85 – 90 percent range Canadian Resource Taxes and Royalties - 2014 $175 - $200 million Brine Management – 2014 Approximately $200 million
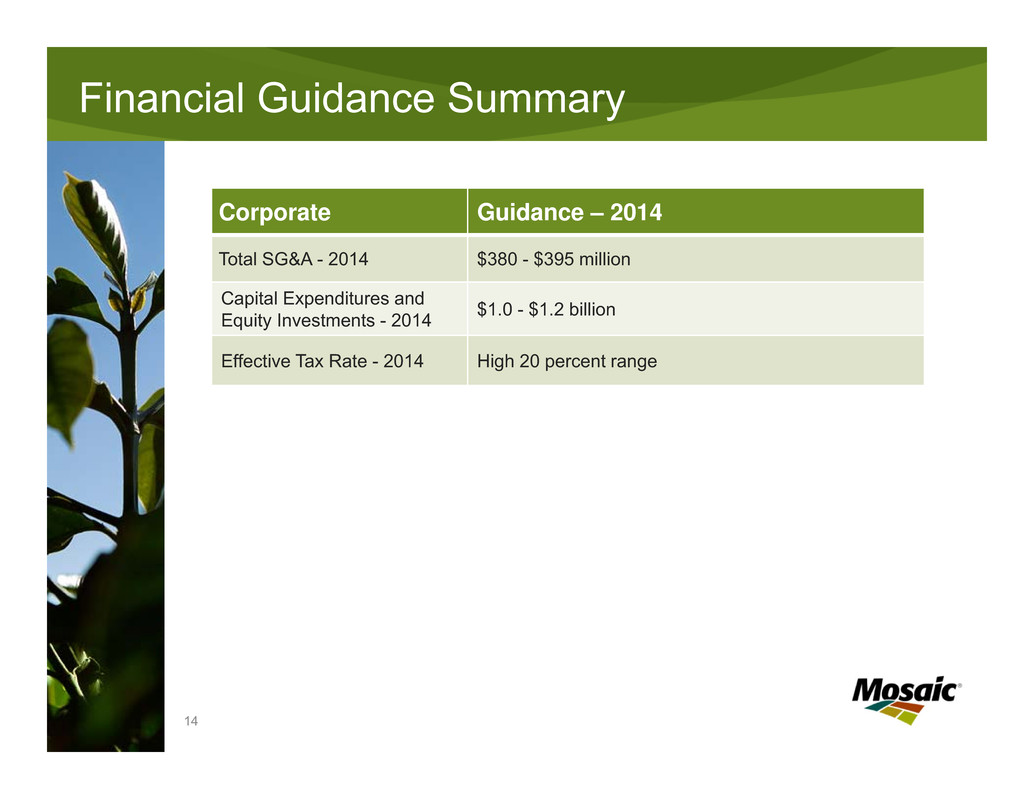
Click to edit Master title style 14 Financial Guidance Summary Corporate Guidance – 2014 Total SG&A - 2014 $380 - $395 million Capital Expenditures and Equity Investments - 2014 $1.0 - $1.2 billion Effective Tax Rate - 2014 High 20 percent range
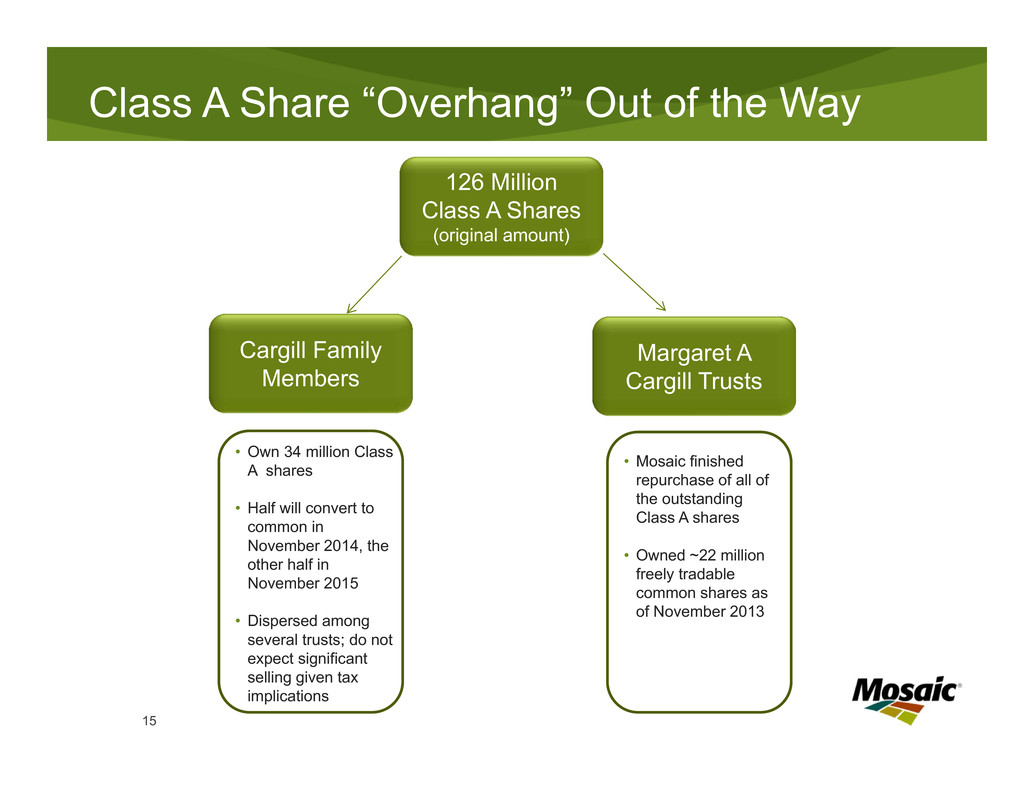
Class A Share “Overhang” Out of the Way 126 Million Class A Shares (original amount) Cargill Family Members Margaret A Cargill Trusts • Own 34 million Class A shares • Half will convert to common in November 2014, the other half in November 2015 • Dispersed among several trusts; do not expect significant selling given tax implications • Mosaic finished repurchase of all of the outstanding Class A shares • Owned ~22 million freely tradable common shares as of November 2013 15
Helping the World Grow the Food it Needs
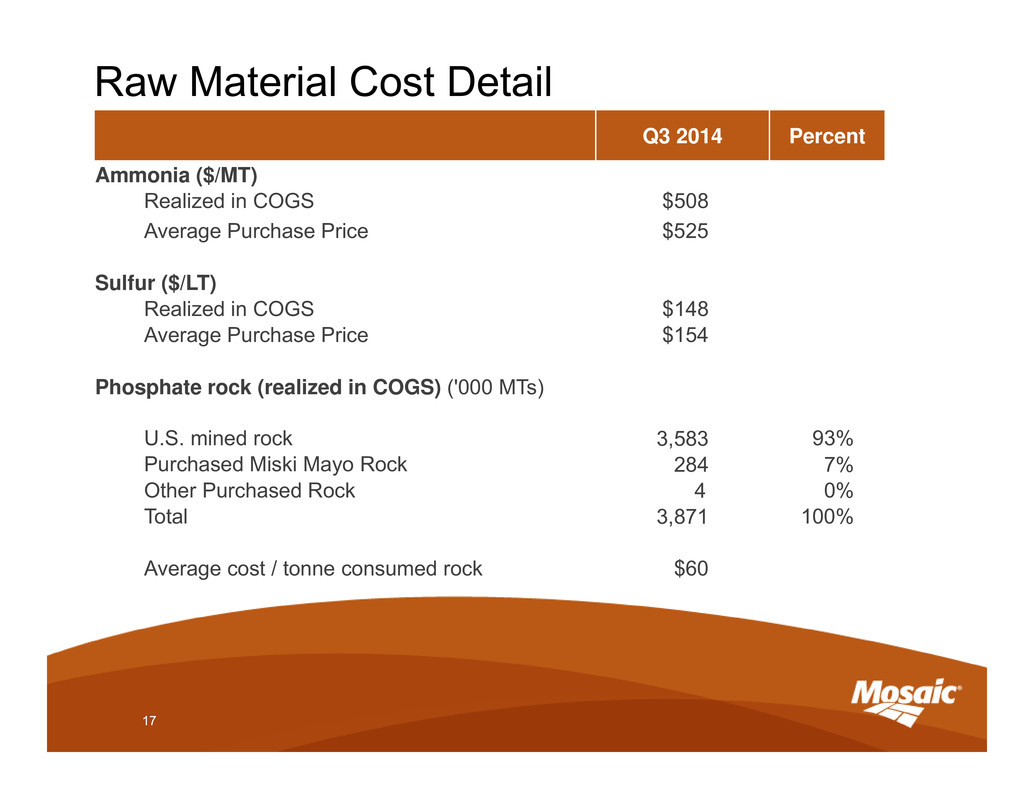
Q3 2014 Percent Ammonia ($/MT) Realized in COGS $508 Average Purchase Price $525 Sulfur ($/LT) Realized in COGS $148 Average Purchase Price $154 Phosphate rock (realized in COGS) ('000 MTs) U.S. mined rock 3,583 93% Purchased Miski Mayo Rock 284 7% Other Purchased Rock 4 0% Total 3,871 100% Average cost / tonne consumed rock $60 Raw Material Cost Detail 17

$- $20 $40 $60 $80 $100 $120 $140 $160 $180 $200 Q4 2012 Q1 2013 Q2 2013 Q3 2013 Q4 2013 Q1 2014 Q2 2014 Q3 2014F Q4 2014F Realized Costs Market Prices $- $100 $200 $300 $400 $500 $600 $700 $800 Q4 2012 Q1 2013 Q2 2013 Q3 2013 Q4 2013 Q1 2014 Q2 2014 Q3 2014F Q4 2014F Realized Costs Market Prices 18 Phosphate Raw Material Trends Ammonia Sulfur ($/tonne) ($/tonne) 1. Market ammonia prices are average prices based upon Tampa C&F as reported by Fertecon 2. Market sulfur prices are average prices based upon Tampa C&F as reported by Green Markets 3. Realized raw material costs include: ~$20/tonne of transportation, transformation and storage costs for sulfur ~$30/tonne of transportation and storage costs for ammonia 2 21
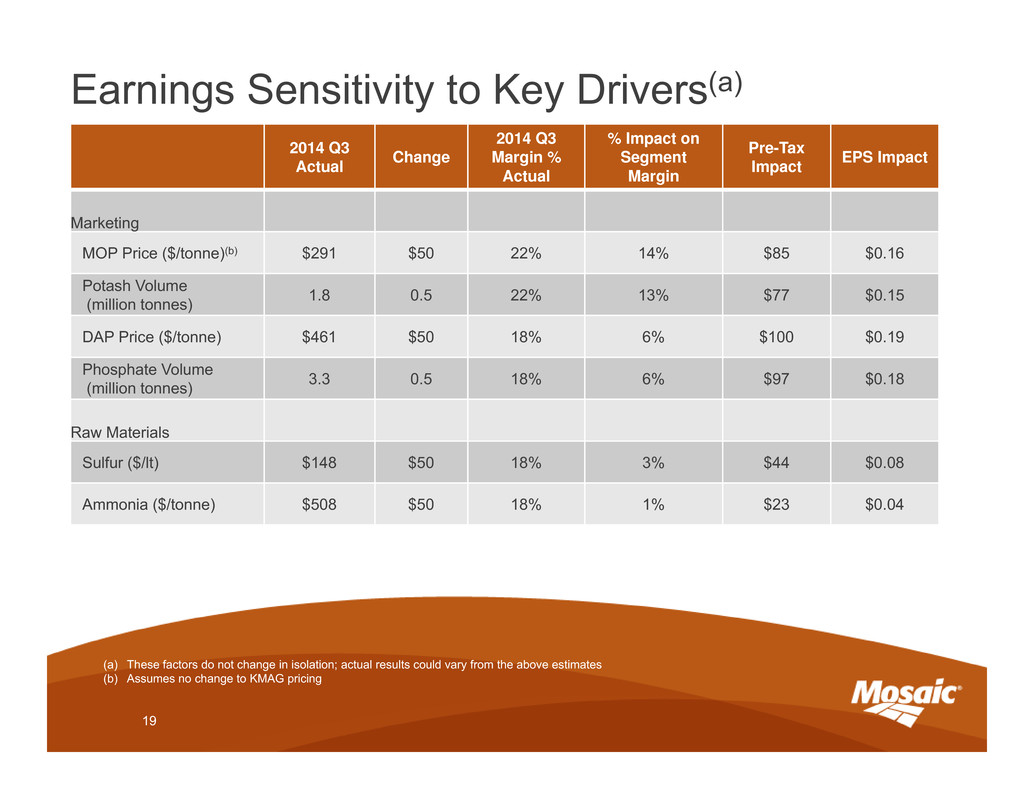
(a) These factors do not change in isolation; actual results could vary from the above estimates (b) Assumes no change to KMAG pricing 2014 Q3 Actual Change 2014 Q3 Margin % Actual % Impact on Segment Margin Pre-Tax Impact EPS Impact Marketing MOP Price ($/tonne)(b) $291 $50 22% 14% $85 $0.16 Potash Volume (million tonnes) 1.8 0.5 22% 13% $77 $0.15 DAP Price ($/tonne) $461 $50 18% 6% $100 $0.19 Phosphate Volume (million tonnes) 3.3 0.5 18% 6% $97 $0.18 Raw Materials Sulfur ($/lt) $148 $50 18% 3% $44 $0.08 Ammonia ($/tonne) $508 $50 18% 1% $23 $0.04 Earnings Sensitivity to Key Drivers(a) 19


