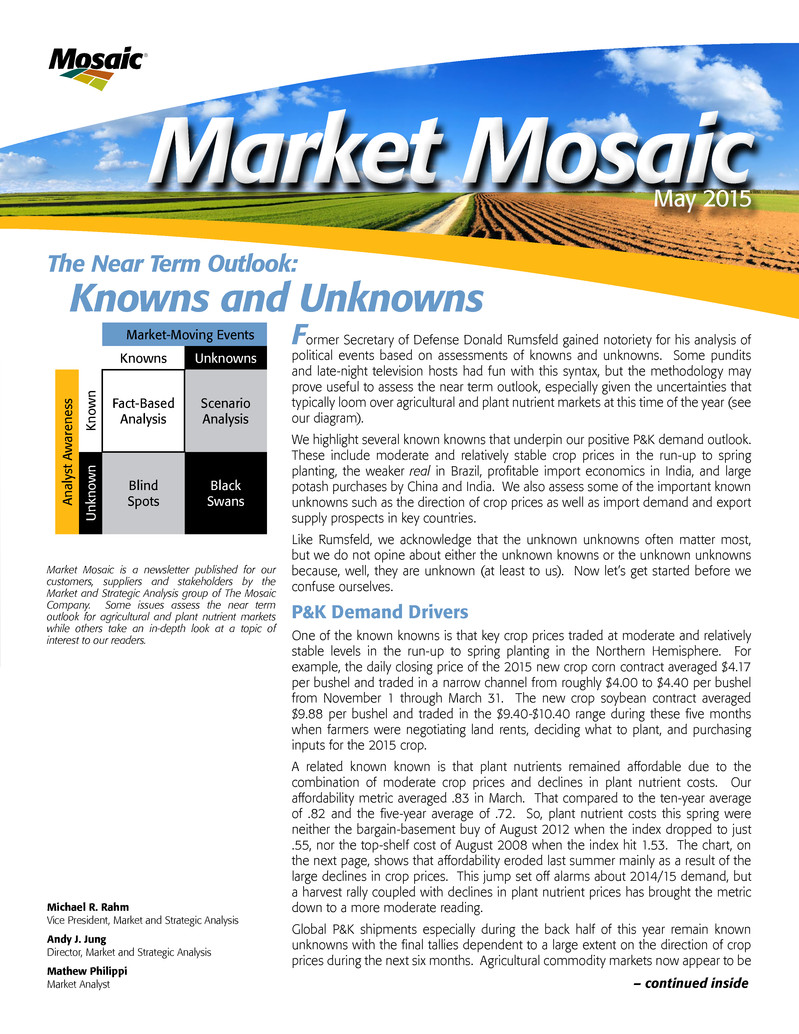
Michael R. Rahm Vice President, Market and Strategic Analysis Andy J. Jung Director, Market and Strategic Analysis Mathew Philippi Market Analyst Market Mosaic is a newsletter published for our customers, suppliers and stakeholders by the Market and Strategic Analysis group of The Mosaic Company. Some issues assess the near term outlook for agricultural and plant nutrient markets while others take an in-depth look at a topic of interest to our readers. The Near Term Outlook: Knowns and Unknowns – continued inside Former Secretary of Defense Donald Rumsfeld gained notoriety for his analysis of political events based on assessments of knowns and unknowns. Some pundits and late-night television hosts had fun with this syntax, but the methodology may prove useful to assess the near term outlook, especially given the uncertainties that typically loom over agricultural and plant nutrient markets at this time of the year (see our diagram). We highlight several known knowns that underpin our positive P&K demand outlook. These include moderate and relatively stable crop prices in the run-up to spring planting, the weaker real in Brazil, profitable import economics in India, and large potash purchases by China and India. We also assess some of the important known unknowns such as the direction of crop prices as well as import demand and export supply prospects in key countries. Like Rumsfeld, we acknowledge that the unknown unknowns often matter most, but we do not opine about either the unknown knowns or the unknown unknowns because, well, they are unknown (at least to us). Now let’s get started before we confuse ourselves. P&K Demand Drivers One of the known knowns is that key crop prices traded at moderate and relatively stable levels in the run-up to spring planting in the Northern Hemisphere. For example, the daily closing price of the 2015 new crop corn contract averaged $4.17 per bushel and traded in a narrow channel from roughly $4.00 to $4.40 per bushel from November 1 through March 31. The new crop soybean contract averaged $9.88 per bushel and traded in the $9.40-$10.40 range during these five months when farmers were negotiating land rents, deciding what to plant, and purchasing inputs for the 2015 crop. A related known known is that plant nutrients remained affordable due to the combination of moderate crop prices and declines in plant nutrient costs. Our affordability metric averaged .83 in March. That compared to the ten-year average of .82 and the five-year average of .72. So, plant nutrient costs this spring were neither the bargain-basement buy of August 2012 when the index dropped to just .55, nor the top-shelf cost of August 2008 when the index hit 1.53. The chart, on the next page, shows that affordability eroded last summer mainly as a result of the large declines in crop prices. This jump set off alarms about 2014/15 demand, but a harvest rally coupled with declines in plant nutrient prices has brought the metric down to a more moderate reading. Global P&K shipments especially during the back half of this year remain known unknowns with the final tallies dependent to a large extent on the direction of crop prices during the next six months. Agricultural commodity markets now appear to be Market Mosaic May 2015 ® Market-Moving Events Knowns Unknowns Analyst Awarenes s Know n Fact-Based Analysis Scenario Analysis Unknow n Blind Spots Black Swans
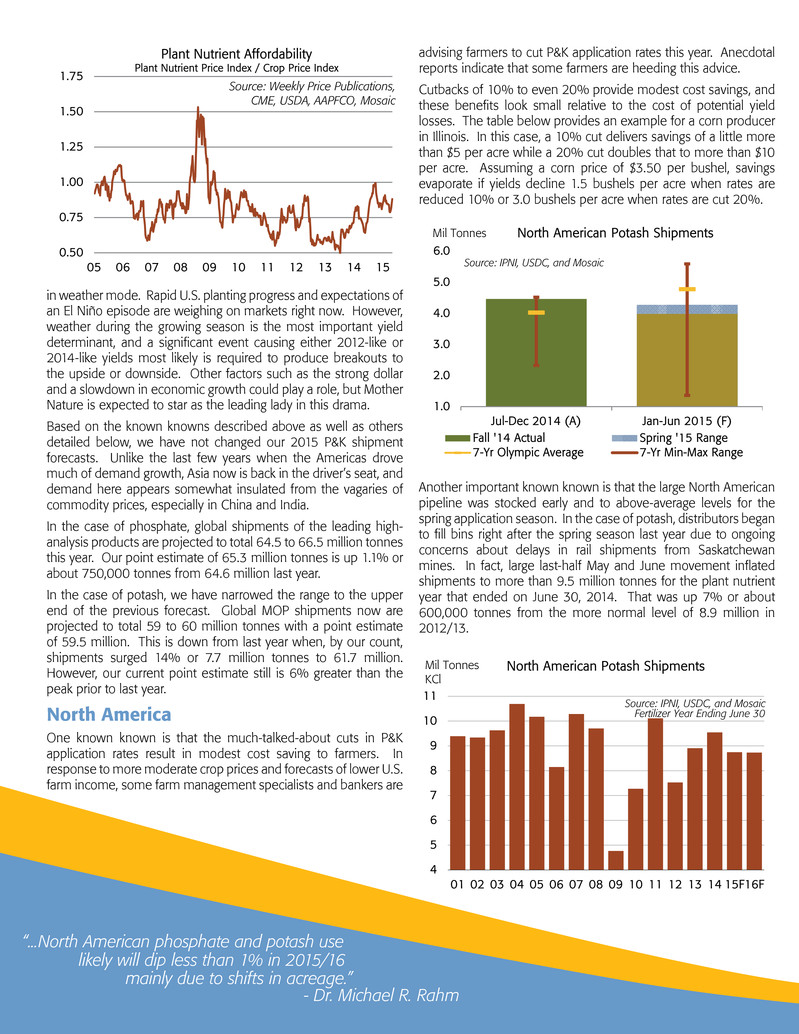
in weather mode. Rapid U.S. planting progress and expectations of an El Niño episode are weighing on markets right now. However, weather during the growing season is the most important yield determinant, and a significant event causing either 2012-like or 2014-like yields most likely is required to produce breakouts to the upside or downside. Other factors such as the strong dollar and a slowdown in economic growth could play a role, but Mother Nature is expected to star as the leading lady in this drama. Based on the known knowns described above as well as others detailed below, we have not changed our 2015 P&K shipment forecasts. Unlike the last few years when the Americas drove much of demand growth, Asia now is back in the driver’s seat, and demand here appears somewhat insulated from the vagaries of commodity prices, especially in China and India. In the case of phosphate, global shipments of the leading high- analysis products are projected to total 64.5 to 66.5 million tonnes this year. Our point estimate of 65.3 million tonnes is up 1.1% or about 750,000 tonnes from 64.6 million last year. In the case of potash, we have narrowed the range to the upper end of the previous forecast. Global MOP shipments now are projected to total 59 to 60 million tonnes with a point estimate of 59.5 million. This is down from last year when, by our count, shipments surged 14% or 7.7 million tonnes to 61.7 million. However, our current point estimate still is 6% greater than the peak prior to last year. North America One known known is that the much-talked-about cuts in P&K application rates result in modest cost saving to farmers. In response to more moderate crop prices and forecasts of lower U.S. farm income, some farm management specialists and bankers are advising farmers to cut P&K application rates this year. Anecdotal reports indicate that some farmers are heeding this advice. Cutbacks of 10% to even 20% provide modest cost savings, and these benefits look small relative to the cost of potential yield losses. The table below provides an example for a corn producer in Illinois. In this case, a 10% cut delivers savings of a little more than $5 per acre while a 20% cut doubles that to more than $10 per acre. Assuming a corn price of $3.50 per bushel, savings evaporate if yields decline 1.5 bushels per acre when rates are reduced 10% or 3.0 bushels per acre when rates are cut 20%. Another important known known is that the large North American pipeline was stocked early and to above-average levels for the spring application season. In the case of potash, distributors began to fill bins right after the spring season last year due to ongoing concerns about delays in rail shipments from Saskatchewan mines. In fact, large last-half May and June movement inflated shipments to more than 9.5 million tonnes for the plant nutrient year that ended on June 30, 2014. That was up 7% or about 600,000 tonnes from the more normal level of 8.9 million in 2012/13. “...North American phosphate and potash use likely will dip less than 1% in 2015/16 mainly due to shifts in acreage.” - Dr. Michael R. Rahm 1.0 2.0 3.0 4.0 5.0 6.0 Jul-Dec 2014 (A) Jan-Jun 2015 (F) Mil Tonnes North American Potash Shipments Fall '14 Actual Spring '15 Range 7-Yr Olympic Average 7-Yr Min-Max Range Source: IPNI, USDC, and Mosaic 2.0 2.5 3.0 3.5 4.0 4.5 5.0 Jul-Dec 2014 (A) Jan-Jun 2015 (F) Mil Tonnes North American Phosphate Shipments Fall '14 Actual Spring '15 Range 7-Yr Olympic Average 7-Yr Min-Max Range Source: TFI, USDC, and Mosaic 4 5 6 7 8 9 10 11 01 02 03 04 05 06 07 08 09 10 11 12 13 14 15F16F Mil Tonnes KCl North American Potash Shipments Source: IPNI, USDC, and Mosaic Fertilizer Year Ending June 30 0.50 0.75 1.00 1.25 1.50 1.75 05 06 07 08 09 10 11 12 13 14 15 Plant Nutrient Af f ord ab ility Plant Nutrient Price I nd ex / C rop Price I nd ex Source: Weekly Price Publications , CME, USDA, AAPFCO, Mosaic
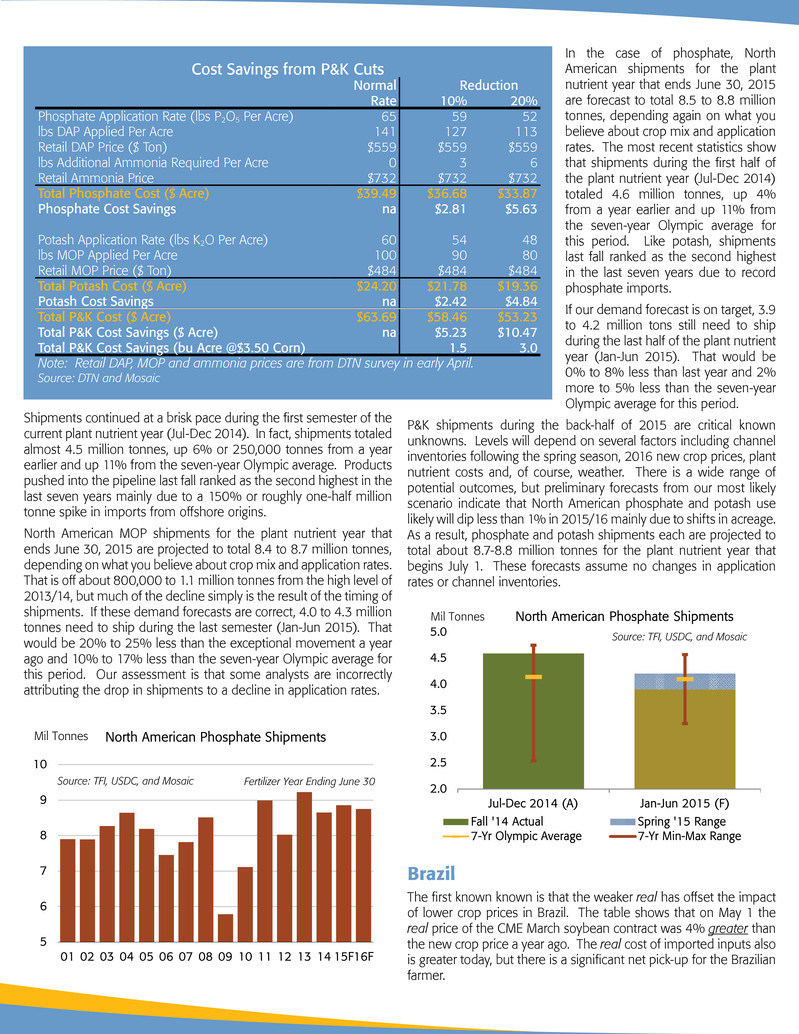
Shipments continued at a brisk pace during the first semester of the current plant nutrient year (Jul-Dec 2014). In fact, shipments totaled almost 4.5 million tonnes, up 6% or 250,000 tonnes from a year earlier and up 11% from the seven-year Olympic average. Products pushed into the pipeline last fall ranked as the second highest in the last seven years mainly due to a 150% or roughly one-half million tonne spike in imports from offshore origins. North American MOP shipments for the plant nutrient year that ends June 30, 2015 are projected to total 8.4 to 8.7 million tonnes, depending on what you believe about crop mix and application rates. That is off about 800,000 to 1.1 million tonnes from the high level of 2013/14, but much of the decline simply is the result of the timing of shipments. If these demand forecasts are correct, 4.0 to 4.3 million tonnes need to ship during the last semester (Jan-Jun 2015). That would be 20% to 25% less than the exceptional movement a year ago and 10% to 17% less than the seven-year Olympic average for this period. Our assessment is that some analysts are incorrectly attributing the drop in shipments to a decline in application rates. In the case of phosphate, North American shipments for the plant nutrient year that ends June 30, 2015 are forecast to total 8.5 to 8.8 million tonnes, depending again on what you believe about crop mix and application rates. The most recent statistics show that shipments during the first half of the plant nutrient year (Jul-Dec 2014) totaled 4.6 million tonnes, up 4% from a year earlier and up 11% from the seven-year Olympic average for this period. Like potash, shipments last fall ranked as the second highest in the last seven years due to record phosphate imports. If our demand forecast is on target, 3.9 to 4.2 million tons still need to ship during the last half of the plant nutrient year (Jan-Jun 2015). That would be 0% to 8% less than last year and 2% more to 5% less than the seven-year Olympic average for this period. P&K shipments during the back-half of 2015 are critical known unknowns. Levels will depend on several factors including channel inventories following the spring season, 2016 new crop prices, plant nutrient costs and, of course, weather. There is a wide range of potential outcomes, but preliminary forecasts from our most likely scenario indicate that North American phosphate and potash use likely will dip less than 1% in 2015/16 mainly due to shifts in acreage. As a result, phosphate and potash shipments each are projected to total about 8.7-8.8 million tonnes for the plant nutrient year that begins July 1. These forecasts assume no changes in application rates or channel inventories. Brazil The first known known is that the weaker real has offset the impact of lower crop prices in Brazil. The table shows that on May 1 the real price of the CME March soybean contract was 4% greater than the new crop price a year ago. The real cost of imported inputs also is greater today, but there is a significant net pick-up for the Brazilian farmer. 1.0 2.0 3.0 4.0 5.0 6.0 Jul-Dec 2014 (A) Jan-Jun 2015 (F) Mil Tonnes North American Potash Shipments Fall '14 Actual Spring '15 Range 7-Yr Olympic Average 7-Yr Min-Max Range Source: IPNI, USDC, and Mosaic 2.0 2.5 3.0 3.5 4.0 4.5 5.0 Jul-Dec 2014 (A) Jan-Jun 2015 (F) Mil Tonnes North American Phosphate Shipments Fall '14 Actual Spring '15 Range 7-Yr Olympic Average 7-Yr Min-Max Range Source: TFI, USDC, and Mosaic 5 6 7 8 9 10 01 02 03 04 05 06 07 08 09 10 11 12 13 14 15F16F Mil Tonnes North American Phosphate Shipments Source: TFI, USDC, and Mosaic Fertilizer Year Ending June 30 Cost Savings from P&K Cuts Normal Reduction Rate 10% 20% Phosphate Application Rate (lbs P2O5 Per Acre) 65 59 52 lbs DAP Applied Per Acre 141 127 113 Retail DAP Price ($ Ton) $559 $559 $559 lbs Additional Ammonia Required Per Acre 0 3 6 Retail Ammonia Price $732 $732 $732 Total Phosphate Cost ($ Acre) $39.49 $36.68 $33.87 Phosphate Cost Savings na $2.81 $5.63 Potash Application Rate (lbs K2O Per Acre) 60 54 48 lbs MOP Applied Per Acre 100 90 80 Retail MOP Price ($ Ton) $484 $484 $484 Total Potash Cost ($ Acre) $24.20 $21.78 $19.36 Potash Cost Savings na $2.42 $4.84 Total P&K Cost ($ Acre) $63.69 $58.46 $53.23 Total P&K Cost Savings ($ Acre) na $5.23 $10.47 Total P&K Cost Savings (bu Acre @$3.50 Corn) 1.5 3.0 Note: Retail DAP, MOP and ammonia prices are from DTN survey in early April. Source: DTN and Mosaic
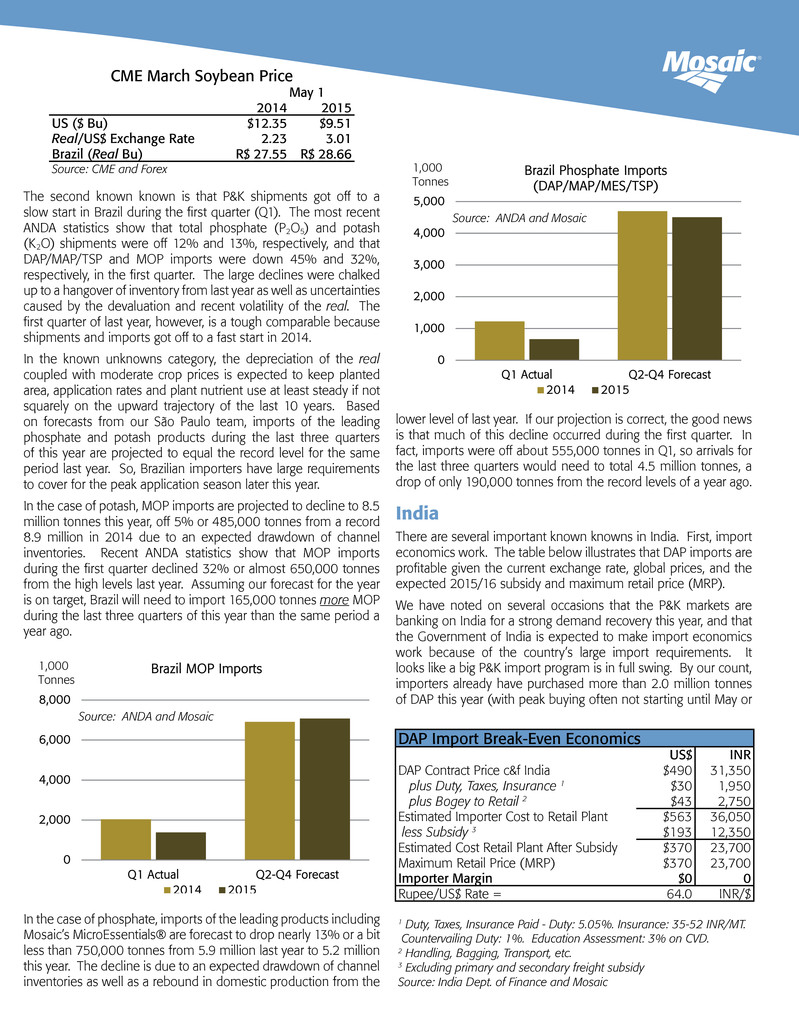
The second known known is that P&K shipments got off to a slow start in Brazil during the first quarter (Q1). The most recent ANDA statistics show that total phosphate (P2O5) and potash (K2O) shipments were off 12% and 13%, respectively, and that DAP/MAP/TSP and MOP imports were down 45% and 32%, respectively, in the first quarter. The large declines were chalked up to a hangover of inventory from last year as well as uncertainties caused by the devaluation and recent volatility of the real. The first quarter of last year, however, is a tough comparable because shipments and imports got off to a fast start in 2014. In the known unknowns category, the depreciation of the real coupled with moderate crop prices is expected to keep planted area, application rates and plant nutrient use at least steady if not squarely on the upward trajectory of the last 10 years. Based on forecasts from our São Paulo team, imports of the leading phosphate and potash products during the last three quarters of this year are projected to equal the record level for the same period last year. So, Brazilian importers have large requirements to cover for the peak application season later this year. In the case of potash, MOP imports are projected to decline to 8.5 million tonnes this year, off 5% or 485,000 tonnes from a record 8.9 million in 2014 due to an expected drawdown of channel inventories. Recent ANDA statistics show that MOP imports during the first quarter declined 32% or almost 650,000 tonnes from the high levels last year. Assuming our forecast for the year is on target, Brazil will need to import 165,000 tonnes more MOP during the last three quarters of this year than the same period a year ago. In the case of phosphate, imports of the leading products including Mosaic’s MicroEssentials® are forecast to drop nearly 13% or a bit less than 750,000 tonnes from 5.9 million last year to 5.2 million this year. The decline is due to an expected drawdown of channel inventories as well as a rebound in domestic production from the lower level of last year. If our projection is correct, the good news is that much of this decline occurred during the first quarter. In fact, imports were off about 555,000 tonnes in Q1, so arrivals for the last three quarters would need to total 4.5 million tonnes, a drop of only 190,000 tonnes from the record levels of a year ago. India There are several important known knowns in India. First, import economics work. The table below illustrates that DAP imports are profitable given the current exchange rate, global prices, and the expected 2015/16 subsidy and maximum retail price (MRP). We have noted on several occasions that the P&K markets are banking on India for a strong demand recovery this year, and that the Government of India is expected to make import economics work because of the country’s large import requirements. It looks like a big P&K import program is in full swing. By our count, importers already have purchased more than 2.0 million tonnes of DAP this year (with peak buying often not starting until May or ® 0 1,000 2,000 3,000 4,000 5,000 Q1 Actual Q2-Q4 Forecast Source: ANDA and Mosaic Brazil Phosphate Imports (DAP/MAP/MES/TSP) 2014 2015 1,000 Tonnes 0 2,000 4,000 6,000 8,000 Q1 Actual Q2-Q4 Forecast Source: ANDA and Mosaic Brazil MOP Imports 2014 2015 1,000 Tonnes 0 1,000 2,000 3,000 4,000 5,000 Q1 Actual Q2-Q4 Forecast Source: ANDA and Mosaic Brazil Phosphate Imports (DAP/MAP/MES/TSP) 2014 2015 1,000 Tonnes 0 2,000 4,000 6,000 8,000 Q1 Actual Q2-Q4 Forecast Source: ANDA and Mosaic Brazil MOP Imports 2014 2015 1,000 Tonnes CME March Soybean Price May 1 2014 2015 US ($ Bu) $12.35 $9.51 Real/US$ Exchange Rate 2.23 3.01 Brazil (Real Bu) R$ 27.55 R$ 28.66 Source: CME and Forex DAP Import Break-Even Economics US$ INR DAP Contract Price c&f India $490 31,350 plus Duty, Taxes, Insurance 1 $30 1,950 plus Bogey to Retail 2 $43 2,750 Estimated Importer Cost to Retail Plant $563 36,050 less Subsidy 3 $193 12,350 Estimated Cost Retail Plant After Subsidy $370 23,700 Maximum Retail Price (MRP) $370 23,700 Importer Margin $0 0 Rupee/US$ Rate = 64.0 INR/$ 1 Duty, Taxes, Insurance Paid - Duty: 5.05%. Insurance: 35-52 INR/MT. Countervailing Duty: 1%. Education Assessment: 3% on CVD. 2 Handling, Bagging, Transport, etc. 3 Excluding primary and secondary freight subsidy Source: India Dept. of Finance and Mosaic
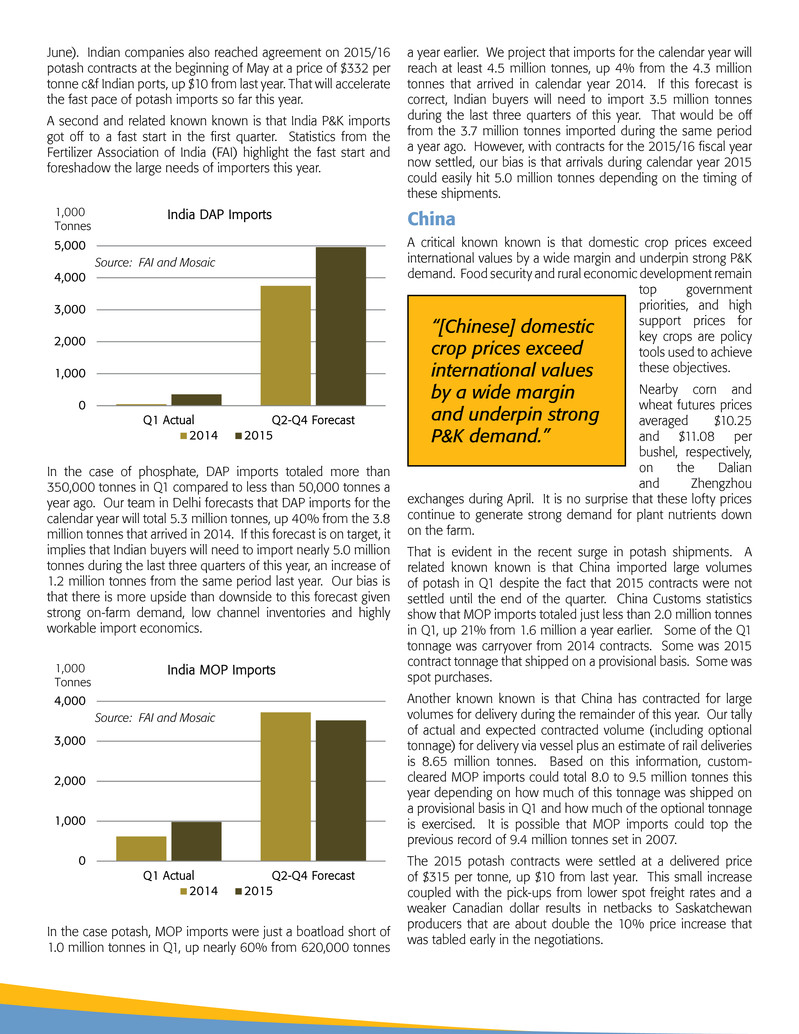
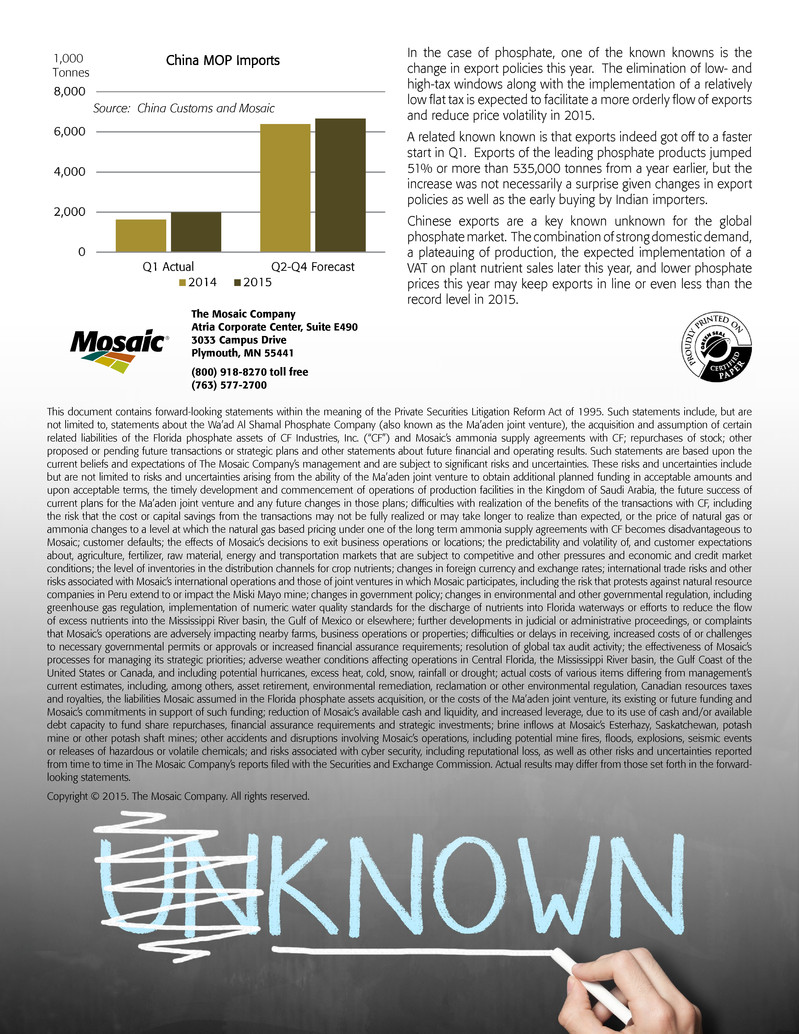
June). Indian companies also reached agreement on 2015/16 potash contracts at the beginning of May at a price of $332 per tonne c&f Indian ports, up $10 from last year. That will accelerate the fast pace of potash imports so far this year. A second and related known known is that India P&K imports got off to a fast start in the first quarter. Statistics from the Fertilizer Association of India (FAI) highlight the fast start and foreshadow the large needs of importers this year. In the case of phosphate, DAP imports totaled more than 350,000 tonnes in Q1 compared to less than 50,000 tonnes a year ago. Our team in Delhi forecasts that DAP imports for the calendar year will total 5.3 million tonnes, up 40% from the 3.8 million tonnes that arrived in 2014. If this forecast is on target, it implies that Indian buyers will need to import nearly 5.0 million tonnes during the last three quarters of this year, an increase of 1.2 million tonnes from the same period last year. Our bias is that there is more upside than downside to this forecast given strong on-farm demand, low channel inventories and highly workable import economics. In the case potash, MOP imports were just a boatload short of 1.0 million tonnes in Q1, up nearly 60% from 620,000 tonnes a year earlier. We project that imports for the calendar year will reach at least 4.5 million tonnes, up 4% from the 4.3 million tonnes that arrived in calendar year 2014. If this forecast is correct, Indian buyers will need to import 3.5 million tonnes during the last three quarters of this year. That would be off from the 3.7 million tonnes imported during the same period a year ago. However, with contracts for the 2015/16 fiscal year now settled, our bias is that arrivals during calendar year 2015 could easily hit 5.0 million tonnes depending on the timing of these shipments. China A critical known known is that domestic crop prices exceed international values by a wide margin and underpin strong P&K demand. Food security and rural economic development remain top government priorities, and high support prices for key crops are policy tools used to achieve these objectives. Nearby corn and wheat futures prices averaged $10.25 and $11.08 per bushel, respectively, on the Dalian and Zhengzhou exchanges during April. It is no surprise that these lofty prices continue to generate strong demand for plant nutrients down on the farm. That is evident in the recent surge in potash shipments. A related known known is that China imported large volumes of potash in Q1 despite the fact that 2015 contracts were not settled until the end of the quarter. China Customs statistics show that MOP imports totaled just less than 2.0 million tonnes in Q1, up 21% from 1.6 million a year earlier. Some of the Q1 tonnage was carryover from 2014 contracts. Some was 2015 contract tonnage that shipped on a provisional basis. Some was spot purchases. Another known known is that China has contracted for large volumes for delivery during the remainder of this year. Our tally of actual and expected contracted volume (including optional tonnage) for delivery via vessel plus an estimate of rail deliveries is 8.65 million tonnes. Based on this information, custom- cleared MOP imports could total 8.0 to 9.5 million tonnes this year depending on how much of this tonnage was shipped on a provisional basis in Q1 and how much of the optional tonnage is exercised. It is possible that MOP imports could top the previous record of 9.4 million tonnes set in 2007. The 2015 potash contracts were settled at a delivered price of $315 per tonne, up $10 from last year. This small increase coupled with the pick-ups from lower spot freight rates and a weaker Canadian dollar results in netbacks to Saskatchewan producers that are about double the 10% price increase that was tabled early in the negotiations. 0 1,000 2,000 3,000 4,000 5,000 Q1 Actual Q2-Q4 Forecast Source: FAI and Mosaic India DAP Imports 2014 2015 1,000 Tonnes 0 1,000 2,000 3,000 4,000 Q1 Actual Q2-Q4 Forecast Source: FAI and Mosaic India MOP Imports 2014 2015 1,0 Tonnes 0 1,000 2, 3,000 4,000 5,000 Q1 Actual Q2-Q4 Forecast Source: FAI and Mosaic India DAP Imports 2014 2015 1,000 Tonnes 0 1,000 2,000 3,000 4,000 Q1 Actual Q2-Q4 Forecast Source: FAI and Mosaic India MOP Imports 2014 2015 1,000 Tonnes “[Chinese] domestic crop prices exceed international values by a wide margin and underpin strong P&K demand.”
In the case of phosphate, one of the known knowns is the change in export policies this year. The elimination of low- and high-tax windows along with the implementation of a relatively low flat tax is expected to facilitate a more orderly flow of exports and reduce price volatility in 2015. A related known known is that exports indeed got off to a faster start in Q1. Exports of the leading phosphate products jumped 51% or more than 535,000 tonnes from a year earlier, but the increase was not necessarily a surprise given changes in export policies as well as the early buying by Indian importers. Chinese exports are a key known unknown for the global phosphate market. The combination of strong domestic demand, a plateauing of production, the expected implementation of a VAT on plant nutrient sales later this year, and lower phosphate prices this year may keep exports in line or even less than the record level in 2015. This document contains forward-looking statements within the meaning of the Private Securities Litigation Reform Act of 1995. Such statements include, but are not limited to, statements about the Wa’ad Al Shamal Phosphate Company (also known as the Ma’aden joint venture), the acquisition and assumption of certain related liabilities of the Florida phosphate assets of CF Industries, Inc. (“CF”) and Mosaic’s ammonia supply agreements with CF; repurchases of stock; other proposed or pending future transactions or strategic plans and other statements about future financial and operating results. Such statements are based upon the current beliefs and expectations of The Mosaic Company’s management and are subject to significant risks and uncertainties. These risks and uncertainties include but are not limited to risks and uncertainties arising from the ability of the Ma’aden joint venture to obtain additional planned funding in acceptable amounts and upon acceptable terms, the timely development and commencement of operations of production facilities in the Kingdom of Saudi Arabia, the future success of current plans for the Ma’aden joint venture and any future changes in those plans; difficulties with realization of the benefits of the transactions with CF, including the risk that the cost or capital savings from the transactions may not be fully realized or may take longer to realize than expected, or the price of natural gas or ammonia changes to a level at which the natural gas based pricing under one of the long term ammonia supply agreements with CF becomes disadvantageous to Mosaic; customer defaults; the effects of Mosaic’s decisions to exit business operations or locations; the predictability and volatility of, and customer expectations about, agriculture, fertilizer, raw material, energy and transportation markets that are subject to competitive and other pressures and economic and credit market conditions; the level of inventories in the distribution channels for crop nutrients; changes in foreign currency and exchange rates; international trade risks and other risks associated with Mosaic’s international operations and those of joint ventures in which Mosaic participates, including the risk that protests against natural resource companies in Peru extend to or impact the Miski Mayo mine; changes in government policy; changes in environmental and other governmental regulation, including greenhouse gas regulation, implementation of numeric water quality standards for the discharge of nutrients into Florida waterways or efforts to reduce the flow of excess nutrients into the Mississippi River basin, the Gulf of Mexico or elsewhere; further developments in judicial or administrative proceedings, or complaints that Mosaic’s operations are adversely impacting nearby farms, business operations or properties; difficulties or delays in receiving, increased costs of or challenges to necessary governmental permits or approvals or increased financial assurance requirements; resolution of global tax audit activity; the effectiveness of Mosaic’s processes for managing its strategic priorities; adverse weather conditions affecting operations in Central Florida, the Mississippi River basin, the Gulf Coast of the United States or Canada, and including potential hurricanes, excess heat, cold, snow, rainfall or drought; actual costs of various items differing from management’s current estimates, including, among others, asset retirement, environmental remediation, reclamation or other environmental regulation, Canadian resources taxes and royalties, the liabilities Mosaic assumed in the Florida phosphate assets acquisition, or the costs of the Ma’aden joint venture, its existing or future funding and Mosaic’s commitments in support of such funding; reduction of Mosaic’s available cash and liquidity, and increased leverage, due to its use of cash and/or available debt capacity to fund share repurchases, financial assurance requirements and strategic investments; brine inflows at Mosaic’s Esterhazy, Saskatchewan, potash mine or other potash shaft mines; other accidents and disruptions involving Mosaic’s operations, including potential mine fires, floods, explosions, seismic events or releases of hazardous or volatile chemicals; and risks associated with cyber security, including reputational loss, as well as other risks and uncertainties reported from time to time in The Mosaic Company’s reports filed with the Securities and Exchange Commission. Actual results may differ from those set forth in the forward- looking statements. Copyright © 2015. The Mosaic Company. All rights reserved. The Mosaic Company Atria Corporate Center, Suite E490 3033 Campus Drive Plymouth, MN 55441 (800) 918-8270 toll free (763) 577-2700 ® 0 2,000 4,000 6,000 8,000 Q1 Actual Q2-Q4 Forecast Source: China Customs and Mosaic China MOP Imports 2014 2015 1,000 Tonnes


