
Potash Outlook Andy J. Jung Director, Market and Strategic Analysis The Mosaic Company TFI Fertilizer Outlook & Technology Conference Jacksonville, FL November 11, 2015
Safe Harbor Statement 2 This document contains forward-looking statements within the meaning of the Private Securities Litigation Reform Act of 1995. Such statements include, but are not limited to, statements about the Wa’ad Al Shamal Phosphate Company (also known as the Ma’aden joint venture), the acquisition and assumption of certain related liabilities of the Florida phosphate assets of CF Industries, Inc. (“CF”) and Mosaic’s ammonia supply agreements with CF; repurchases of stock; other proposed or pending future transactions or strategic plans and other statements about future financial and operating results. Such statements are based upon the current beliefs and expectations of The Mosaic Company’s management and are subject to significant risks and uncertainties. These risks and uncertainties include but are not limited to risks and uncertainties arising from the ability of the Ma’aden joint venture to obtain additional planned funding in acceptable amounts and upon acceptable terms, the timely development and commencement of operations of production facilities in the Kingdom of Saudi Arabia, the future success of current plans for the Ma’aden joint venture and any future changes in those plans; difficulties with realization of the benefits of the long term ammonia supply agreements with CF, including the risk that the cost savings from the agreements may not be fully realized or that the price of natural gas or ammonia changes to a level at which the natural gas based pricing under one of these agreements becomes disadvantageous to Mosaic; customer defaults; the effects of Mosaic’s decisions to exit business operations or locations; the predictability and volatility of, and customer expectations about, agriculture, fertilizer, raw material, energy and transportation markets that are subject to competitive and other pressures and economic and credit market conditions; the level of inventories in the distribution channels for crop nutrients; the effect of future product innovations or development of new technologies on demand for our products; changes in foreign currency and exchange rates; international trade risks and other risks associated with Mosaic’s international operations and those of joint ventures in which Mosaic participates, including the risk that protests against natural resource companies in Peru extend to or impact the Miski Mayo mine; changes in government policy; changes in environmental and other governmental regulation, including expansion of the types and extent of water resources regulated under federal law, greenhouse gas regulation, implementation of numeric water quality standards for the discharge of nutrients into Florida waterways or efforts to reduce the flow of excess nutrients into the Mississippi River basin, the Gulf of Mexico or elsewhere; further developments in judicial or administrative proceedings, or complaints that Mosaic’s operations are adversely impacting nearby farms, business operations or properties; difficulties or delays in receiving, increased costs of or challenges to necessary governmental permits or approvals or increased financial assurance requirements; resolution of global tax audit activity; the effectiveness of Mosaic’s processes for managing its strategic priorities; adverse weather conditions affecting operations in Central Florida, the Mississippi River basin, the Gulf Coast of the United States or Canada, and including potential hurricanes, excess heat, cold, snow, rainfall or drought; actual costs of various items differing from management’s current estimates, including, among others, asset retirement, environmental remediation, reclamation or other environmental regulation, Canadian resources taxes and royalties, or the costs of the Ma’aden joint venture, its existing or future funding and Mosaic’s commitments in support of such funding; reduction of Mosaic’s available cash and liquidity, and increased leverage, due to its use of cash and/or available debt capacity to fund share repurchases, financial assurance requirements and strategic investments; brine inflows at Mosaic’s Esterhazy, Saskatchewan, potash mine or other potash shaft mines; other accidents and disruptions involving Mosaic’s operations, including potential mine fires, floods, explosions, seismic events or releases of hazardous or volatile chemicals; and risks associated with cyber security, including reputational loss, as well as other risks and uncertainties reported from time to time in The Mosaic Company’s reports filed with the Securities and Exchange Commission. Actual results may differ from those set forth in the forward-looking statements.
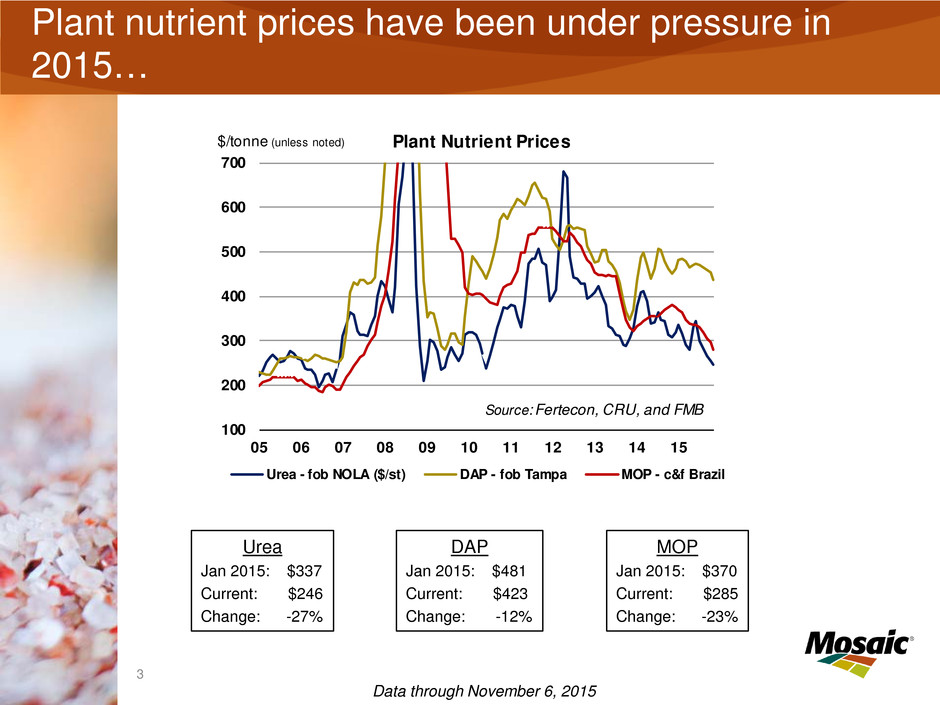
Click to edit Master title style 3 Plant nutrient prices have been under pressure in 2015… MOP Jan 2015: $370 Current: $285 Change: -23% DAP Jan 2015: $481 Current: $423 Change: -12% Urea Jan 2015: $337 Current: $246 Change: -27% 100 200 300 400 500 600 700 05 06 07 08 09 10 11 12 13 14 15 Plant Nutrient Prices Urea - fob NOLA ($/st) DAP - fob Tampa MOP - c&f Brazil Source: Fertecon, CRU, and FMB $/tonne (unless noted) Data through November 6, 2015

Click to edit Master title style 4 …but these lower prices underpin demand as crop nutrients become more affordable More Affordable Less Affordable • Our plant nutrient affordability metric has bobbed and weaved with changes in agricultural commodity and plant nutrient prices, but the current reading indicates that plant nutrients are right in line with the historical average and clearly affordable. • The metric – the ratio of a plant nutrient index to a crop price index – registered .75 in the midst of North American fall application at the end of October. That was down 12% from .85 a year ago and just a fraction higher than the average since 2010 of .74. • Versus a year ago, affordability has improved due to broadly flat crop prices, but significantly lower plant nutrient costs. 0.50 0.75 1.00 1.25 10 11 12 13 14 15 Plant Nutrient Affordability Plant Nutrient Price Index / Crop Price Index Affordability Metric Average 2010-present Source: Weekly Price Publications, CME, USDA, AAPFCO, Mosaic Data through November 6, 2015

Click to edit Master title style 5 Key takeaway: More constructive fundamentals than the market is trading, particularly with regard to K ▪ Ag commodity fundamentals remain positive − Cautious sentiment in the ag space appears to be driven as much by the contagion of the more dramatic downturns seen in other commodities (e.g. oil, iron ore) − While crop prices have moderated, farm economics are still profitable − The long term food story, though not in vogue today, is still valid ▪ Still positive potash demand/shipment prospects − No steep demand drop-off but rather a working down of channel inventories this year − 2015 on pace to be the second best year for global shipments, as well as providing a drawdown of pipeline inventories − Affordable plant nutrients ▪ Overblown supply worries − Material greenfield supplies by new entrants still 2 to 3 years away ▪ Lower prices offset by weaker currencies for major producers

Recap of Ag Commodity Markets: Prices remain at historically-elevated levels
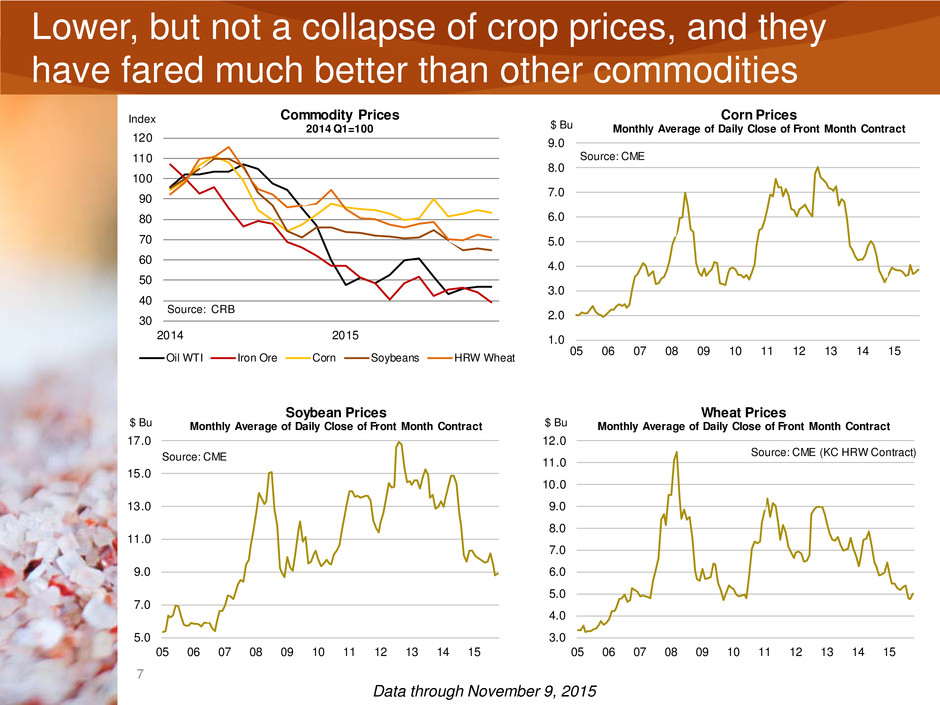
Click to edit Master title style 7 Lower, but not a collapse of crop prices, and they have fared much better than other commodities 30 40 50 60 70 80 90 100 110 120 2014 2015 Index Source: CRB Commodity Prices 2014 Q1=100 Oil WTI Iron Ore Corn Soybeans HRW Wheat 1.0 2.0 3.0 4.0 5.0 6.0 7.0 8.0 9.0 05 06 07 08 09 10 11 12 13 14 15 $ Bu Corn Prices Monthly Average of Daily Close of Front Month Contract Source: CME 5.0 7.0 9.0 11.0 13.0 15.0 17.0 05 06 07 08 09 10 11 12 13 14 15 $ Bu Soybean Prices Monthly Average of Daily Close of Front Month Contract Source: CME 3.0 4.0 5.0 6.0 7.0 8.0 9.0 10.0 11.0 12.0 05 06 07 08 09 10 11 12 13 14 15 $ Bu Wheat Prices Monthly Average of Daily Close of Front Month Contract Source: CME (KC HRW Contract) Data through November 9, 2015
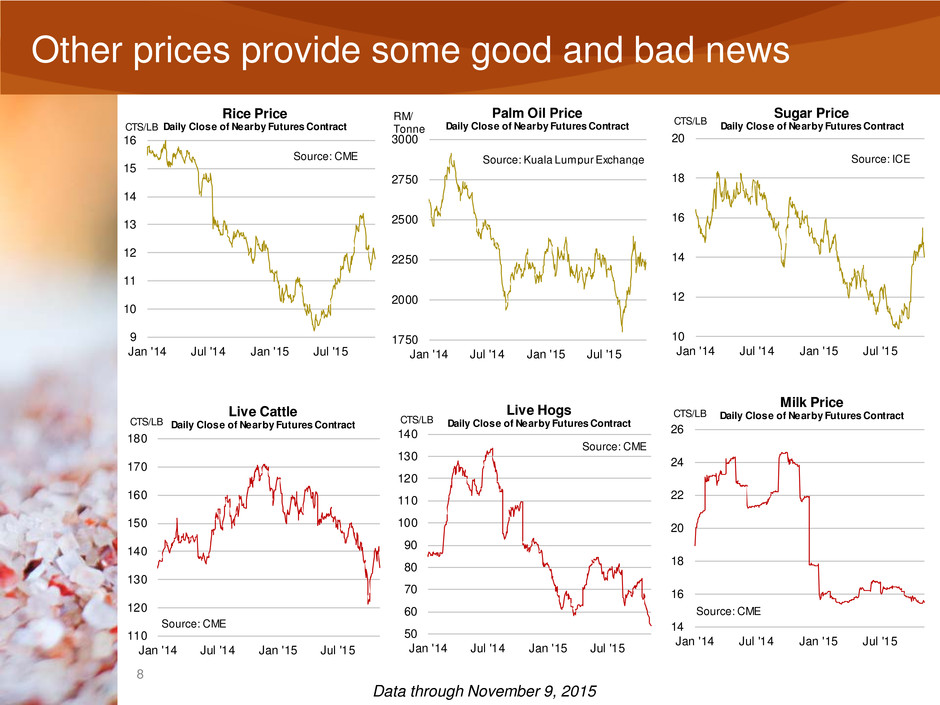
Click to edit Master title style 8 Other prices provide some good nd bad news 1750 2000 2250 2500 2750 3000 Jan '14 Jul '14 Jan '15 Jul '15 RM/ Tonne Palm Oil Price Daily Close of Nearby Futures Contract Source: Kuala Lumpur Exchange 9 10 11 12 13 14 15 16 Jan '14 Jul '14 Jan '15 Jul '15 CTS/LB Rice Price Daily Close of Nearby Futures Contract Source: CME 10 12 14 16 18 20 Jan '14 Jul '14 Jan '15 Jul '15 CTS/LB Sugar Price Daily Close of Nearby Futures Contract Source: ICE 50 60 70 80 90 100 110 120 130 140 Jan '14 Jul '14 Jan '15 Jul '15 CTS/LB Live Hogs Daily Close of Nearby Futures Contract Source: CME 110 120 130 140 150 160 170 180 Jan '14 Jul '14 Jan '15 Jul '15 CTS/LB Live Cattle Daily Close of Nearby Futures Contract Source: CME 14 16 18 20 22 24 26 Jan '14 Jul '14 Jan '15 Jul '15 CTS/LB Milk Price Daily Close of Nearby Futures Contract Source: CME Data through November 9, 2015

Click to edit Master title style 9 Mostly weather-related volatility and not long term structural imbalance 606 579 494 407 469 461 424 436 512 569 550 539 525 592 637 636 16% 18% 20% 22% 24% 26% 28% 30% 300 350 400 450 500 550 600 650 00 01 02 03 04 05 06 07 08 09 10 11 12 13 14E15F PercentMil Tonnes World Grain and Oilseed Stocks Stocks Percent of Use Source: USDA 2.5 2.6 2.7 2.8 2.9 3.0 3.1 3.2 3.3 800 820 840 860 880 900 920 940 960 00 01 02 03 04 05 06 07 08 09 10 11 12 13 14E15F Tonnes/HAMil Tonnes World Grain and Oilseed Area and Yield Harvested Area Yield Linear (Yield) Source: USDA • Farmers responded to high crop prices by expanding area and applying more technology, and then Mother Nature cooperated. • Average yield exceeded trend by a significant margin in both 2013/14 and 2014/15. • The latest USDA estimates, however, put the 2015/16 average yield a whisker below trend and thus a slight decline in inventories. • Continued demand growth is expected to gobble up the second largest crop the world has ever produced. 2.0 2.2 2.4 2.6 2.8 3.0 3.2 00 01 02 03 04 05 06 07 08 09 10 11 12 13 14E15F Bil Tonnes World Grain and Oilseed Production and Use Production Use Source: USDA

Potash Current Situation and Near Term Outlook
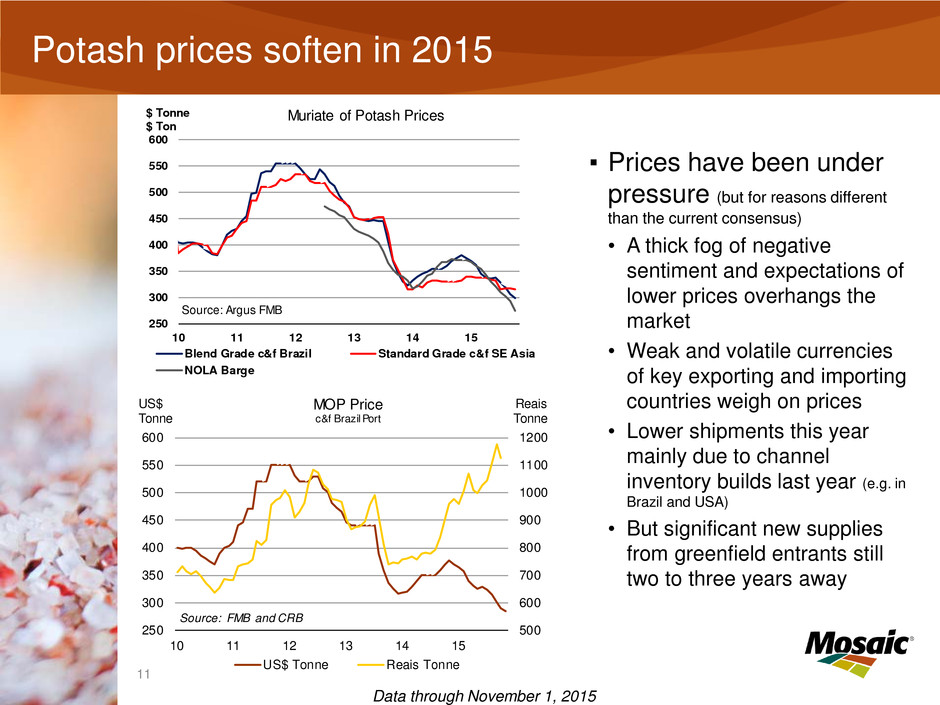
Click to edit Master title style 11 Potash prices soften in 2015 250 300 350 400 450 500 550 600 10 11 12 13 14 15 $ Tonne $ Ton Muriate of Potash Prices Blend Grade c&f Brazil Standard Grade c&f SE Asia NOLA Barge Source: Argus FMB ▪ Prices have been under pressure (but for reasons different than the current consensus) • A thick fog of negative sentiment and expectations of lower prices overhangs the market • Weak and volatile currencies of key exporting and importing countries weigh on prices • Lower shipments this year mainly due to channel inventory builds last year (e.g. in Brazil and USA) • But significant new supplies from greenfield entrants still two to three years away 500 600 700 800 900 1000 1100 1200 250 300 350 400 450 500 550 600 10 11 12 13 14 15 Reais Tonne US$ Tonne Source: FMB and CRB MOP Price c&f Brazil Port US$ Tonne Reais Tonne Data through November 1, 2015
Click to edit Master title style 12 A long litany of market c ncerns ▪ Further declines in crop prices • Could there be more above-trend harvests • Prospects of a strong dollar for years to come • Fallout from China’s economic slowdown • Other macroeconomic/financial market turbulence • Flat biofuels production ▪ More moderate demand prospects • Channel inventory builds last year • Weak/volatile exchange rates (e.g. Brazil, India) • China VAT and no-growth NPK plan • Expectation of no material subsidy reform in India ▪ Plentiful supplies due to: • New brownfield and greenfield capacity • Lower cost structure from the devaluation of currencies in key exporting countries ▪ Changes in the competitive landscape • New entrants at the doorstep − K+S potash in Saskatchewan − Eurochem in Russia
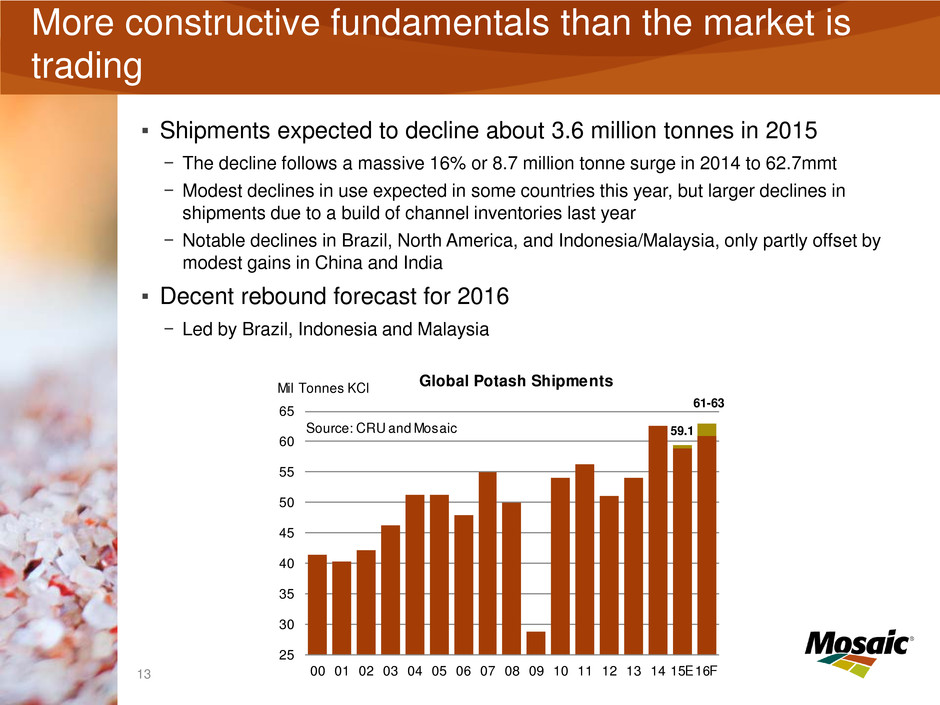
Click to edit Master title style 13 More constructive fundamentals than the market is trading ▪ Shipments expected to decline about 3.6 million tonnes in 2015 − The decline follows a massive 16% or 8.7 million tonne surge in 2014 to 62.7mmt − Modest declines in use expected in some countries this year, but larger declines in shipments due to a build of channel inventories last year − Notable declines in Brazil, North America, and Indonesia/Malaysia, only partly offset by modest gains in China and India ▪ Decent rebound forecast for 2016 − Led by Brazil, Indonesia and Malaysia 59.1 61-63 25 30 35 40 45 50 55 60 65 00 01 02 03 04 05 06 07 08 09 10 11 12 13 14 15E16F Global Potash ShipmentsMil Tonnes KCl Source: CRU and Mosaic
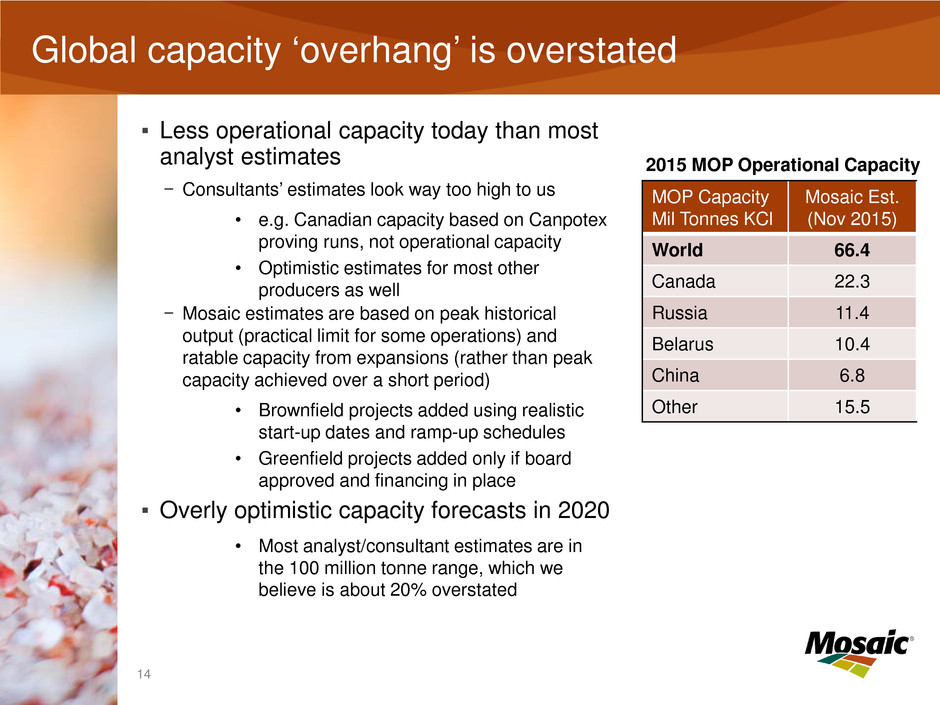
Click to edit Master title style 14 Global capacity ‘overhang’ is overstated ▪ Less operational capacity today than most analyst estimates − Consultants’ estimates look way too high to us • e.g. Canadian capacity based on Canpotex proving runs, not operational capacity • Optimistic estimates for most other producers as well − Mosaic estimates are based on peak historical output (practical limit for some operations) and ratable capacity from expansions (rather than peak capacity achieved over a short period) • Brownfield projects added using realistic start-up dates and ramp-up schedules • Greenfield projects added only if board approved and financing in place ▪ Overly optimistic capacity forecasts in 2020 • Most analyst/consultant estimates are in the 100 million tonne range, which we believe is about 20% overstated 2015 MOP Operational Capacity MOP Capacity Mil Tonnes KCl Mosaic Est. (Nov 2015) World 66.4 Canada 22.3 Russia 11.4 Belarus 10.4 China 6.8 Other 15.5
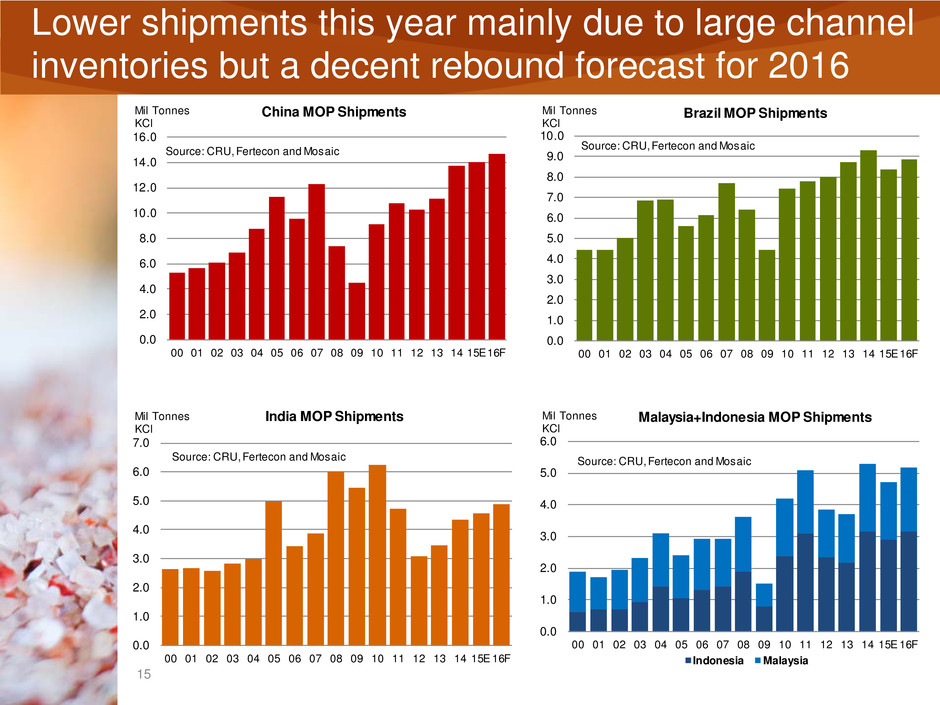
Click to edit Master title style 15 Lower shipments this year mainly due to large channel inventories but a decent rebound forecast for 2016 0.0 1.0 2.0 3.0 4.0 5.0 6.0 7.0 8.0 9.0 10.0 00 01 02 03 04 05 06 07 08 09 10 11 12 13 14 15E16F Mil Tonnes KCl Brazil MOP Shipments Source: CRU, Fertecon and Mosaic 0.0 2.0 4.0 6.0 8.0 10.0 12.0 14.0 16.0 00 01 02 03 04 05 06 07 08 09 10 11 12 13 14 15E16F Mil Tonnes KCl China MOP Shipments Source: CRU, Fertecon and Mosaic 0.0 1.0 2.0 3.0 4.0 5.0 6.0 7.0 00 01 02 03 04 05 06 07 08 09 10 11 12 13 14 15E 16F Mil Tonnes KCl India MOP Shipments Source: CRU, Fertecon and Mosaic 0.0 1.0 2.0 3.0 4.0 5.0 6.0 00 01 02 03 04 05 06 07 08 09 10 11 12 13 14 15E 16F Mil Tonnes KCl Malaysia+Indonesia MOP Shipments Indonesia Malaysia Source: CRU, Fertecon and Mosaic
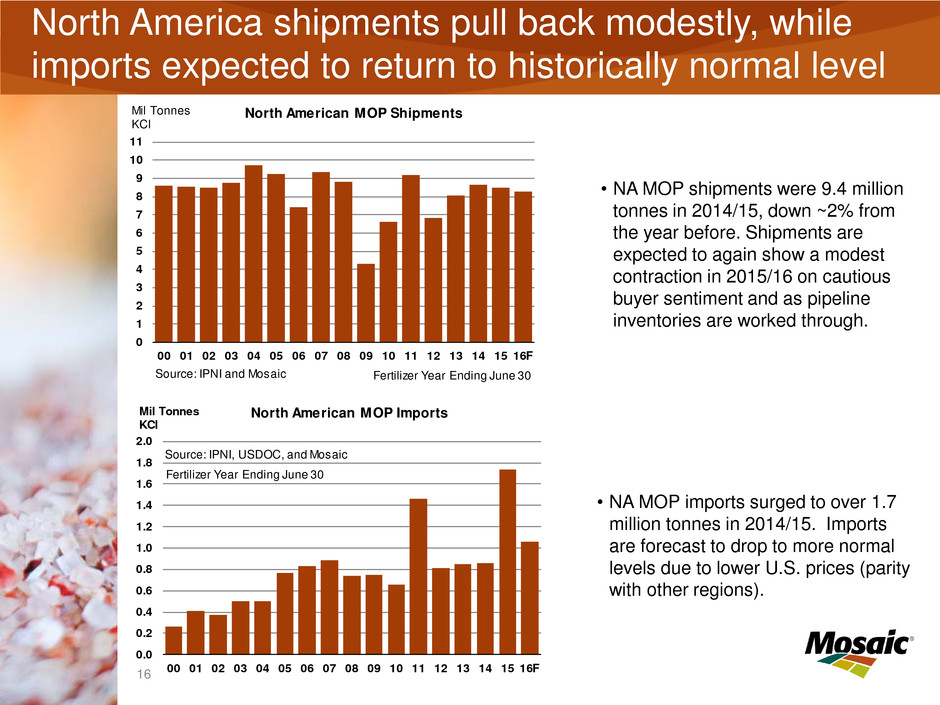
Click to edit Master title style 16 North America shipments pull back modestly, while imports expected to return to historically normal level • NA MOP imports surged to over 1.7 million tonnes in 2014/15. Imports are forecast to drop to more normal levels due to lower U.S. prices (parity with other regions). 0.0 0.2 0.4 0.6 0.8 1.0 1.2 1.4 1.6 1.8 2.0 00 01 02 03 04 05 06 07 08 09 10 11 12 13 14 15 16F Mil Tonnes KCl North American MOP Imports Source: IPNI, USDOC, and Mosaic Fertilizer Year Ending June 30 0 1 2 3 4 5 6 7 8 9 10 11 00 01 02 03 04 05 06 07 08 09 10 11 12 13 14 15 16F Mil Tonnes KCl North American MOP Shipments Source: IPNI and Mosaic Fertilizer Year Ending June 30 • NA MOP shipments were 9.4 million tonnes in 2014/15, down ~2% from the year before. Shipments are expected to again show a modest contraction in 2015/16 on cautious buyer sentiment and as pipeline inventories are worked through.

Click to edit Master title style 17 Brazil volumes have eased back from record- shattering levels seen in 2014 0.0 5.0 10.0 15.0 20.0 25.0 30.0 35.0 95 97 99 01 03 05 07 09 11 13 15 YTD Mil Tonnes Product Brazil Total Plant Nutrient Shipments Actual Forecast Source: ANDA, Mosaic • Total product shipments are projected to decline to 30.7 million tonnes this year, off 5% or 1.5 million from the record 32.2 million last year and equal to the 2013 total. Shipments are expected to rebound in 2016 to 31-33 million tonnes due to the combination of continued moderate grain and oilseed prices and the weaker real. • MOP imports are forecast to decline to 8.1 million tonnes this year, off 10% or 900,000 tonnes from the record- shattering level last year, but this would be the second highest total by a margin of one-half million tonnes. Imports are projected to rebound to 8.5-9.0 million tonnes next year. 0.0 1.0 2.0 3.0 4.0 5.0 6.0 7.0 8.0 9.0 10.0 95 97 99 01 03 05 07 09 11 13 15 YTD Mil Tonnes Brazil MOP Imports Actual Forecast Source: ANDA, Mosaic
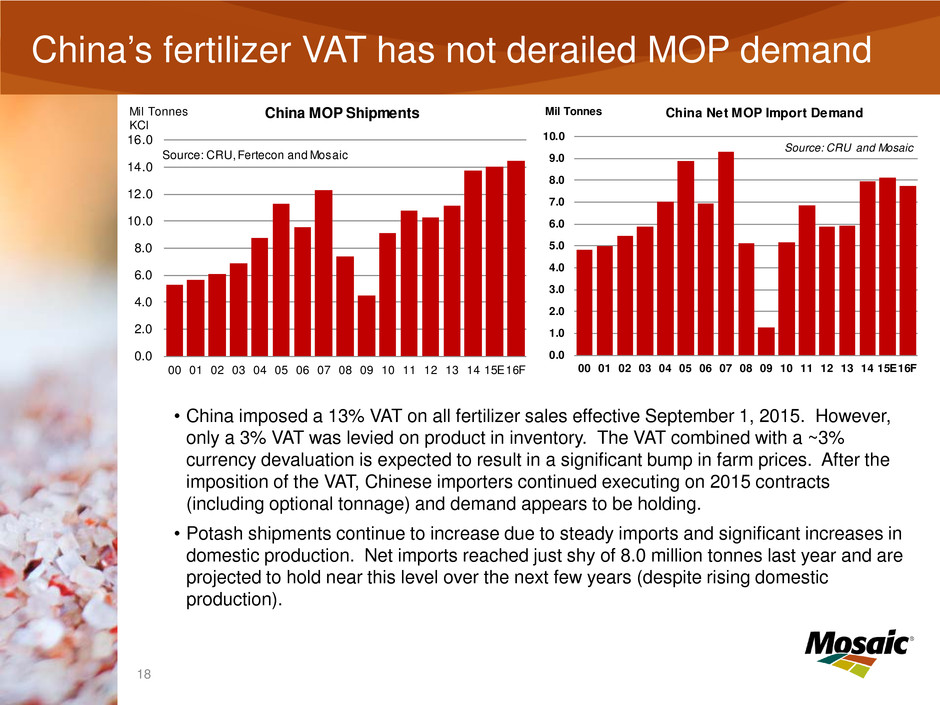
Click to edit Master title style 18 China’s fertilizer VAT has not derailed MOP demand • China imposed a 13% VAT on all fertilizer sales effective September 1, 2015. However, only a 3% VAT was levied on product in inventory. The VAT combined with a ~3% currency devaluation is expected to result in a significant bump in farm prices. After the imposition of the VAT, Chinese importers continued executing on 2015 contracts (including optional tonnage) and demand appears to be holding. • Potash shipments continue to increase due to steady imports and significant increases in domestic production. Net imports reached just shy of 8.0 million tonnes last year and are projected to hold near this level over the next few years (despite rising domestic production). 0.0 1.0 2.0 3.0 4.0 5.0 6.0 7.0 8.0 9.0 10.0 00 01 02 03 04 05 06 07 08 09 10 11 12 13 14 15E16F Mil Tonnes China Net MOP Import Demand Source: CRU and Mosaic 0.0 2.0 4.0 6.0 8.0 10.0 12.0 14.0 16.0 00 01 02 03 04 05 06 07 08 09 10 11 12 13 14 15E16F Mil Tonnes KCl China MOP Shipments Source: CRU, Fertecon and Mosaic
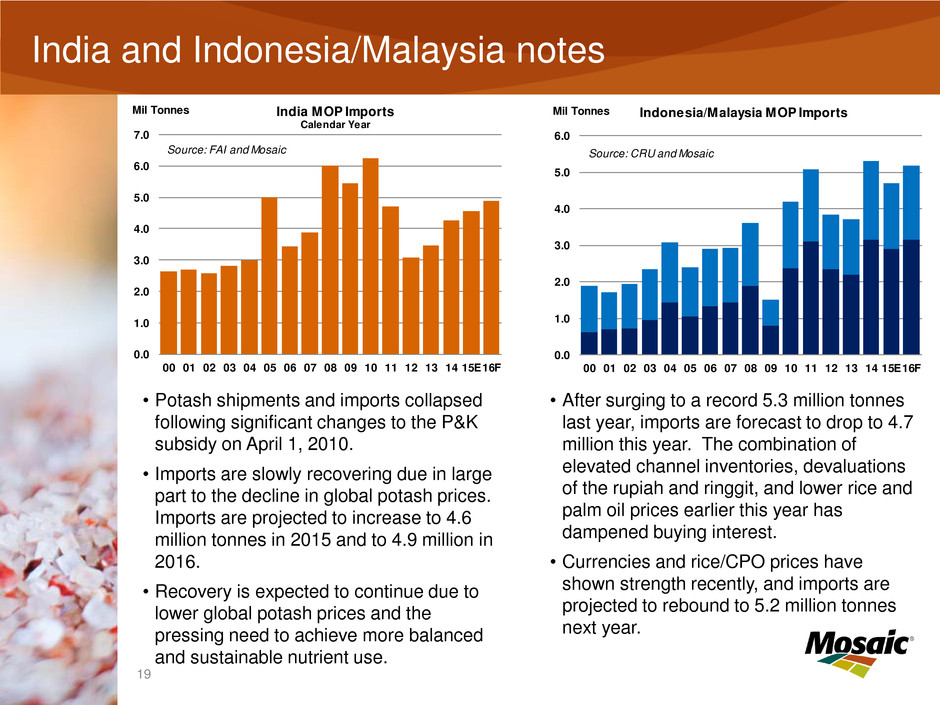
Click to edit Master title style 19 India and Indonesia/Malaysia note 0.0 1.0 2.0 3.0 4.0 5.0 6.0 7.0 00 01 02 03 04 05 06 07 08 09 10 11 12 13 14 15E16F Mil Tonnes India MOP Imports Calendar Year Source: FAI and Mosaic 0.0 1.0 2.0 3.0 4.0 5.0 6.0 00 01 02 03 04 05 06 07 08 09 10 11 12 13 14 15E16F Mil Tonnes Indonesia/Malaysia MOP Imports Source: CRU and Mosaic • Potash shipments and imports collapsed following significant changes to the P&K subsidy on April 1, 2010. • Imports are slowly recovering due in large part to the decline in global potash prices. Imports are projected to increase to 4.6 million tonnes in 2015 and to 4.9 million in 2016. • Recovery is expected to continue due to lower global potash prices and the pressing need to achieve more balanced and sustainable nutrient use. • After surging to a record 5.3 million tonnes last year, imports are forecast to drop to 4.7 million this year. The combination of elevated channel inventories, devaluations of the rupiah and ringgit, and lower rice and palm oil prices earlier this year has dampened buying interest. • Currencies and rice/CPO prices have shown strength recently, and imports are projected to rebound to 5.2 million tonnes next year.

Potash Long Term Outlook
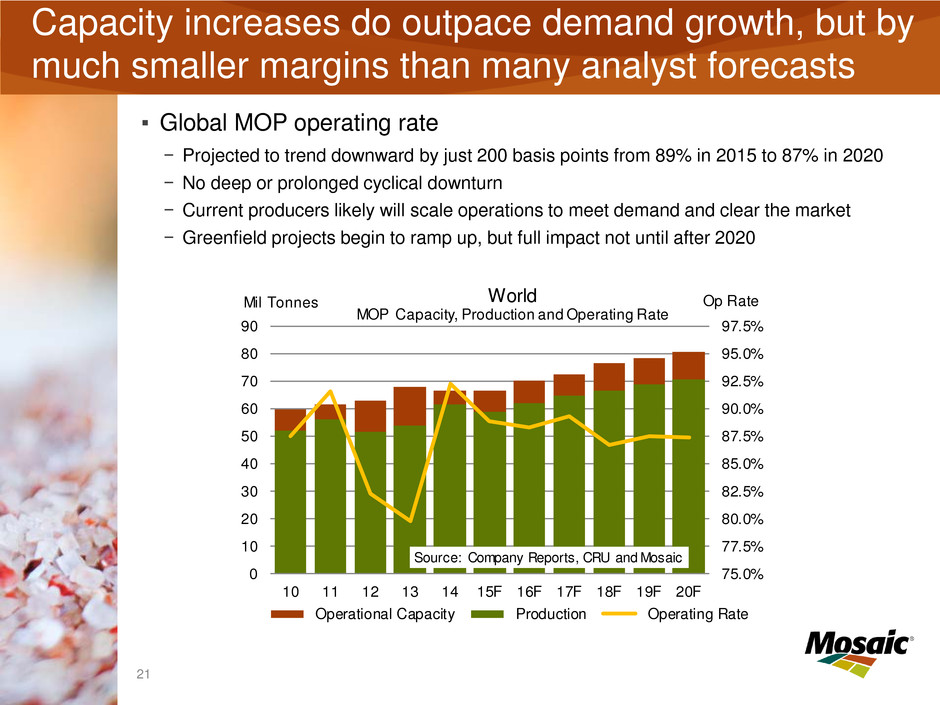
Click to edit Master title style 21 Capacity increases do outpace demand growth, but by much smaller margins than many analyst forecasts 75.0% 77.5% 80.0% 82.5% 85.0% 87.5% 90.0% 92.5% 95.0% 97.5% 0 10 20 30 40 50 60 70 80 90 10 11 12 13 14 15F 16F 17F 18F 19F 20F Op RateMil Tonnes Source: Company Reports, CRU and Mosaic World MOP Capacity, Production and Operating Rate Operational Capacity Production Operating Rate ▪ Global MOP operating rate − Projected to trend downward by just 200 basis points from 89% in 2015 to 87% in 2020 − No deep or prolonged cyclical downturn − Current producers likely will scale operations to meet demand and clear the market − Greenfield projects begin to ramp up, but full impact not until after 2020

Potash Outlook Andy J. Jung Director, Market and Strategic Analysis The Mosaic Company Thank You! TFI Fertilizer Outlook & Technology Conference Jacksonville, FL November 11, 2015