
The Mosaic Company Earnings Conference Call – Fourth Quarter 2015 February 11, 2016 Joc O’Rourke, President and Chief Executive Officer Rich Mack, Executive Vice President and Chief Financial Officer Laura Gagnon, Vice President Investor Relations

Safe Harbor Statement This document contains forward-looking statements within the meaning of the Private Securities Litigation Reform Act of 1995. Such statements include, but are not limited to, statements about the Wa’ad Al Shamal Phosphate Company (also known as the Ma’aden joint venture) and other proposed or pending future transactions or strategic plans and other statements about future financial and operating results. Such statements are based upon the current beliefs and expectations of The Mosaic Company’s management and are subject to significant risks and uncertainties. These risks and uncertainties include but are not limited to risks and uncertainties arising from the ability of the Ma’aden joint venture to obtain additional planned funding in acceptable amounts and upon acceptable terms, the timely development and commencement of operations of production facilities in the Kingdom of Saudi Arabia, the future success of current plans for the Ma’aden joint venture and any future changes in those plans; difficulties with realization of the benefits of our long term natural gas based pricing ammonia supply agreement with CF, including the risk that the cost savings from the agreement may not be realized or that the price of natural gas or ammonia during the agreement’s term are at levels at which the pricing becomes disadvantageous to Mosaic; customer defaults; the effects of Mosaic’s decisions to exit business operations or locations; the predictability and volatility of, and customer expectations about, agriculture, fertilizer, raw material, energy and transportation markets that are subject to competitive and other pressures and economic and credit market conditions; the level of inventories in the distribution channels for crop nutrients; the effect of future product innovations or development of new technologies on demand for our products; changes in foreign currency and exchange rates; international trade risks and other risks associated with Mosaic’s international operations and those of joint ventures in which Mosaic participates, including the risk that protests against natural resource companies in Peru extend to or impact the Miski Mayo mine; changes in government policy; changes in environmental and other governmental regulation, including expansion of the types and extent of water resources regulated under federal law, greenhouse gas regulation, implementation of numeric water quality standards for the discharge of nutrients into Florida waterways or efforts to reduce the flow of excess nutrients into the Mississippi River basin, the Gulf of Mexico or elsewhere; further developments in judicial or administrative proceedings, or complaints that Mosaic’s operations are adversely impacting nearby farms, business operations or properties; difficulties or delays in receiving, increased costs of or challenges to necessary governmental permits or approvals or increased financial assurance requirements; resolution of global tax audit activity; the effectiveness of Mosaic’s processes for managing its strategic priorities; adverse weather conditions affecting operations in Central Florida, the Mississippi River basin, the Gulf Coast of the United States or Canada, and including potential hurricanes, excess heat, cold, snow, rainfall or drought; actual costs of various items differing from management’s current estimates, including, among others, asset retirement, environmental remediation, reclamation or other environmental regulation, Canadian resources taxes and royalties, or the costs of the Ma’aden joint venture, its existing or future funding and Mosaic’s commitments in support of such funding; reduction of Mosaic’s available cash and liquidity, and increased leverage, due to its use of cash and/or available debt capacity to fund financial assurance requirements and strategic investments; brine inflows at Mosaic’s Esterhazy, Saskatchewan, potash mine or other potash shaft mines; other accidents and disruptions involving Mosaic’s operations, including potential mine fires, floods, explosions, seismic events or releases of hazardous or volatile chemicals; and risks associated with cyber security, including reputational loss, as well as other risks and uncertainties reported from time to time in The Mosaic Company’s reports filed with the Securities and Exchange Commission. Actual results may differ from those set forth in the forward-looking statements. 2

Challenging Environment; Agricultural Commodities Less Impacted 3 30 40 50 60 70 80 90 100 110 120 2014 2015 2016 Index Source: CRB Market Commodity Prices 2014 Q1=100 Oil WTI Iron Ore Corn Based on actual market prices

Potash: Currency Swings Exacerbating Price Movement Source: Factset Bringing costs of production down …… …… and costs for customers up. 4 1/1/15 12/31/15 1/1/15 12/31/15 0.70 0.75 0.80 0.85 0.90 Canada 0.04 0.05 0.06 0.07 0.08 0.09 0.10 Belarussia 0.012 0.014 0.016 0.018 0.020 0.022 Russia 2.0 2.5 3.0 3.5 4.0 4.5 Brazil 6.1 6.2 6.3 6.4 6.5 6.6 China 60.0 62.0 64.0 66.0 68.0 India ‐17% +49% ‐18% +5% ‐41% +5%
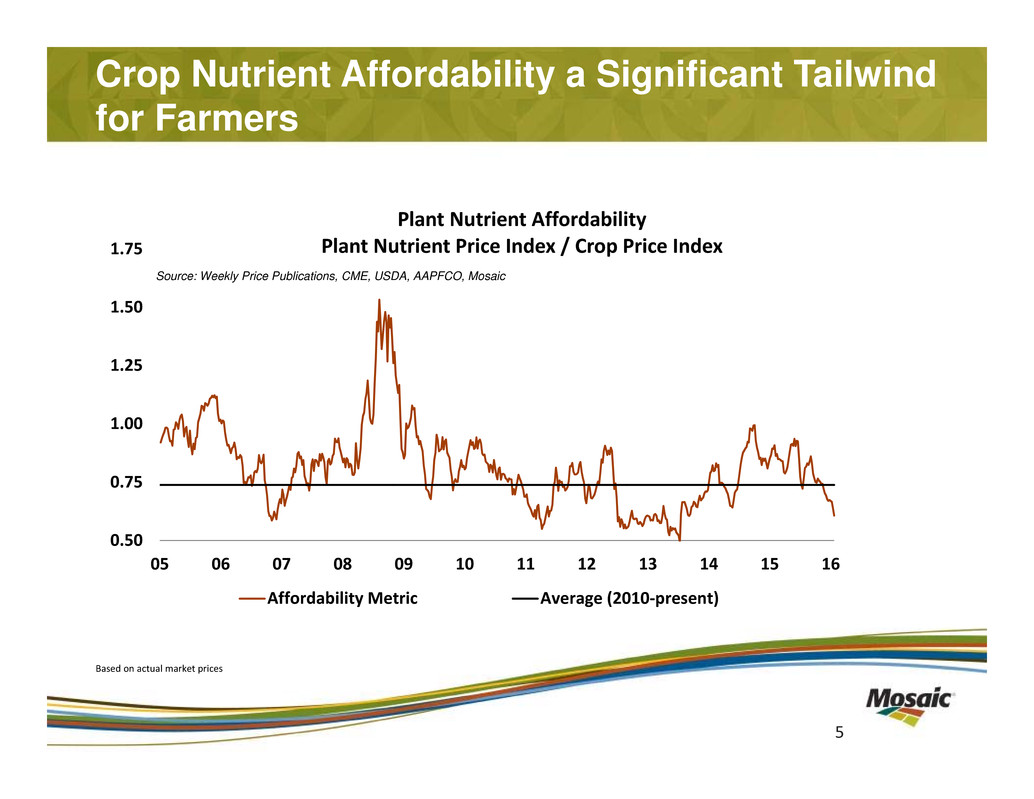
Crop Nutrient Affordability a Significant Tailwind for Farmers 5 0.50 0.75 1.00 1.25 1.50 1.75 05 06 07 08 09 10 11 12 13 14 15 16 Plant Nutrient Affordability Plant Nutrient Price Index / Crop Price Index Affordability Metric Average (2010‐present) Source: Weekly Price Publications, CME, USDA, AAPFCO, Mosaic Based on actual market prices
Challenges Lead to Strength 6 Positive Secular Trend Underpins Long‐Term Demand Growth Impact on Mosaic: Cyclicality presents opportunities Resilient business: • Effective cost control • Prudent balance sheet management Agriculture different from hard commodities

2015 Highlights 7 2015 EPS up 4 percent over last year $1.1 billion in share repurchases and dividends Lowest SG&A in six years Esterhazy K3 shaft on time, on budget CF and ADM acquisitions fully integrated Sulfur melter commissioned MicroEssentials® expansion on track Ma’aden JV expected to begin ammonia production in 2016

Financial Results Review
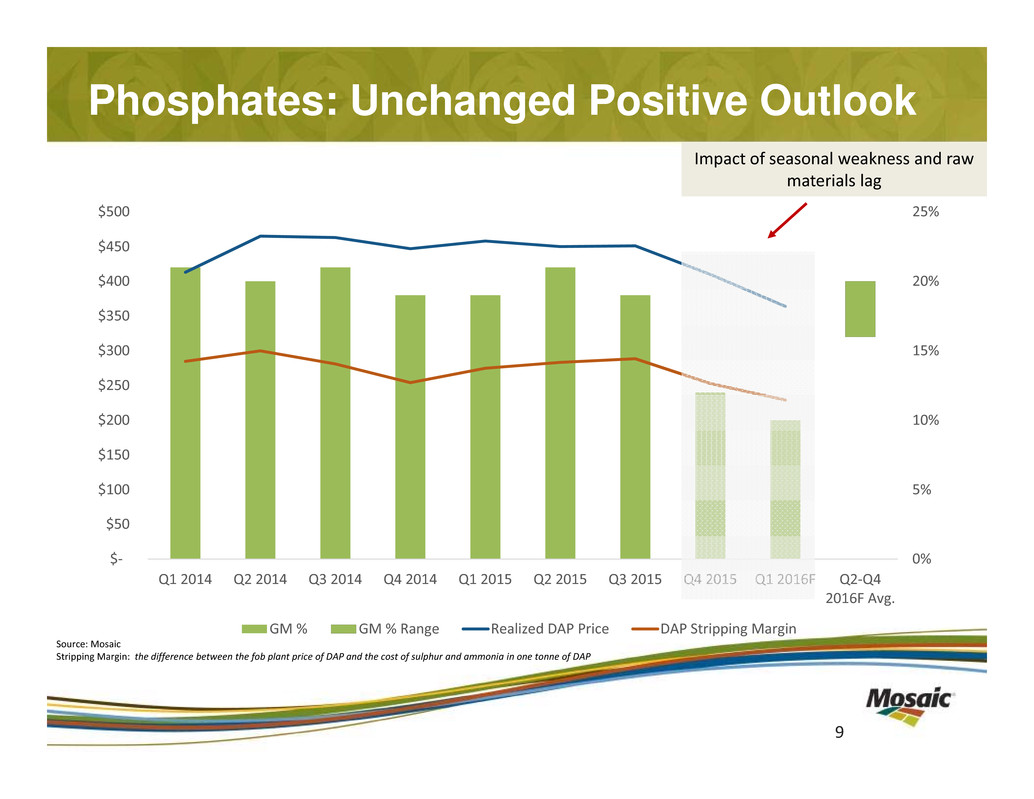
0% 5% 10% 15% 20% 25% $‐ $50 $100 $150 $200 $250 $300 $350 $400 $450 $500 Q1 2014 Q2 2014 Q3 2014 Q4 2014 Q1 2015 Q2 2015 Q3 2015 Q4 2015 Q1 2016F Q2‐Q4 2016F Avg. GM % GM % Range Realized DAP Price DAP Stripping Margin Phosphates: Unchanged Positive Outlook 9 Impact of seasonal weakness and raw materials lag Source: Mosaic Stripping Margin: the difference between the fob plant price of DAP and the cost of sulphur and ammonia in one tonne of DAP

Phosphates Guidance Phosphates 2016 Q1 Sales Volumes 1.8 to 2.2 million tonnes Q1 DAP Selling Price $350 to $370 per tonne Q1 Gross Margin Rate Around 10 percent Q1 Operating Rate 70 to 80 percent Full Year Sales Volumes 9 to 10 million tonnes Global Shipments 65 to 67 million tonnes 10

Potash: Optimizing Value 11 $‐ $20 $40 $60 $80 $100 $120 $140 $160 $230 $240 $250 $260 $270 $280 $290 $300 Q1 2014 Q2 2014 Q3 2014 Q4 2014 Q1 2015 Q2 2015 Q3 2015 Q4 2015 G r os s M a r g i n / M T A v e r a g e M O P P r i c e / M T GM/mt Average MOP Price/mt Maintaining profitability despite declining prices Includes impact of production shutdowns Source: Mosaic
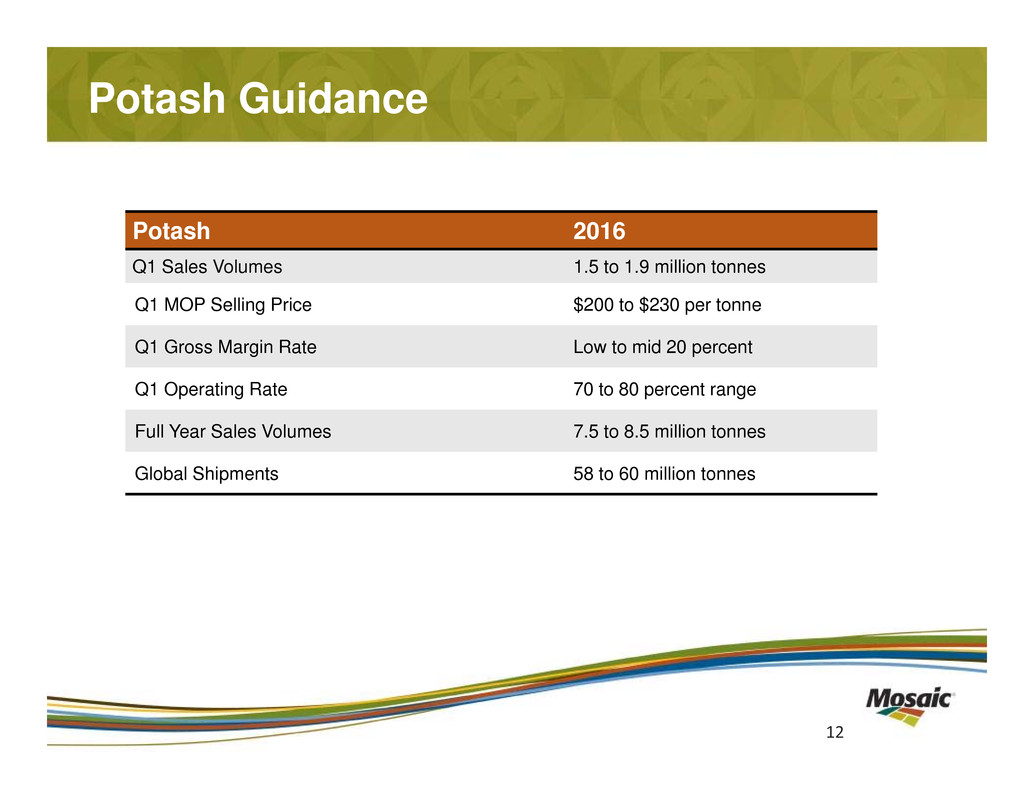
Potash Guidance Potash 2016 Q1 Sales Volumes 1.5 to 1.9 million tonnes Q1 MOP Selling Price $200 to $230 per tonne Q1 Gross Margin Rate Low to mid 20 percent Q1 Operating Rate 70 to 80 percent range Full Year Sales Volumes 7.5 to 8.5 million tonnes Global Shipments 58 to 60 million tonnes 12

International Distribution: Weak Real a Positive for Brazil Agriculture Brazil: Credit + Stable Soybean Prices = Strong H2 Soybean Prices Soybean Prices Monthly Average of CBOT Daily Nearby Close Main concern: ongoing credit issues Source: Mosaic 13 4 8 12 16 20 24 28 32 36 2 4 6 8 10 12 14 16 18 09 10 11 12 13 14 15 Reais$ BuUS$ Bu USD Bu Brazilian Reais Bu
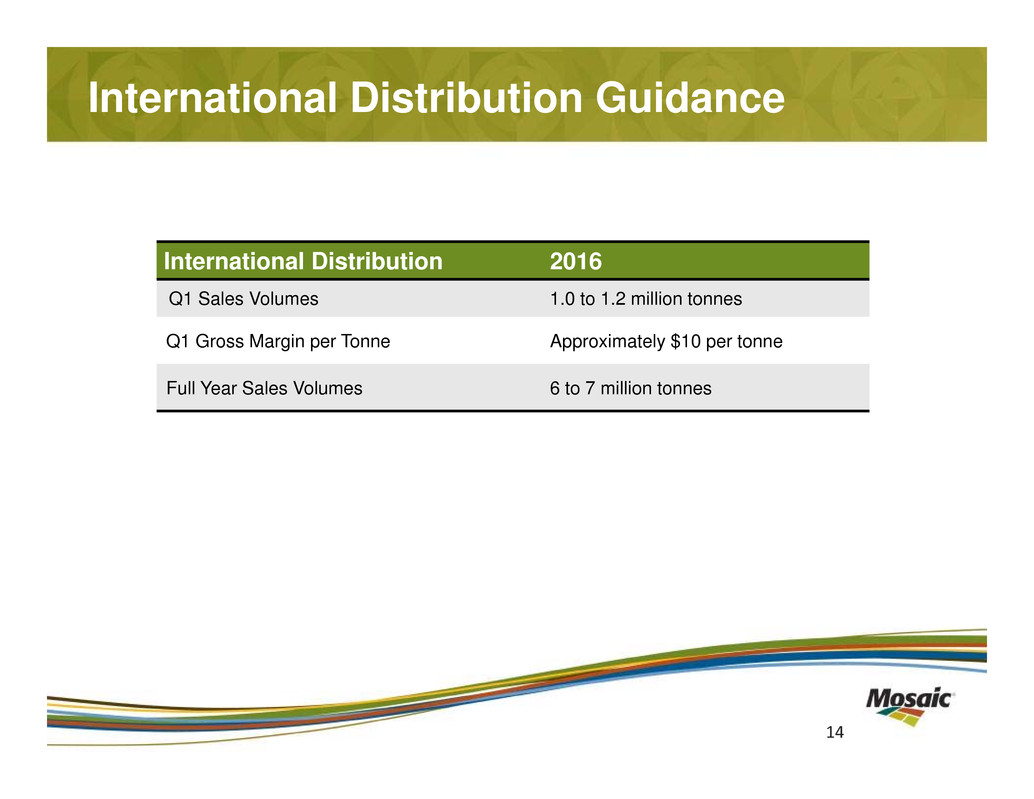
International Distribution Guidance International Distribution 2016 Q1 Sales Volumes 1.0 to 1.2 million tonnes Q1 Gross Margin per Tonne Approximately $10 per tonne Full Year Sales Volumes 6 to 7 million tonnes 14

Full-Year Guidance Summary Consolidated Full-Year 2016 Total SG&A $350 to $370 million Capital Expenditures and Equity Investments $1.2 to $1.4 billion Effective Tax Rate Upper teens 15 Potash 2016 Full-Year Canadian Resources Taxes and Royalties $180 to $220 million Full-Year Brine Management Costs $160 to $180 million

Closing Commentary
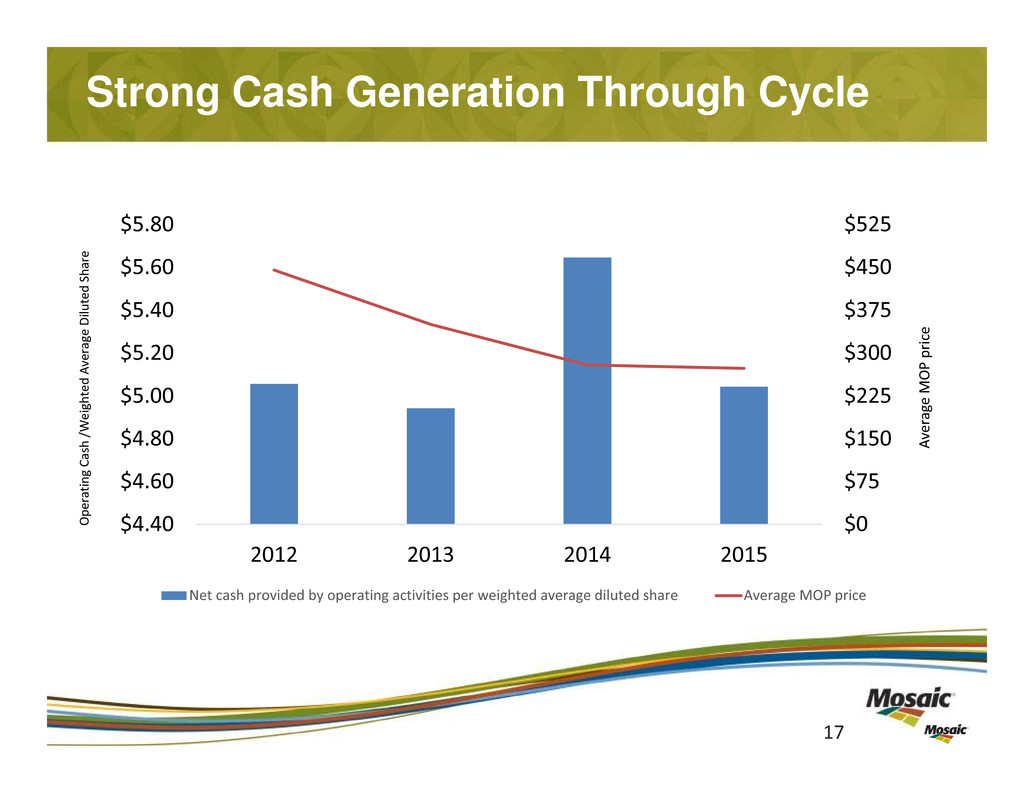
Strong Cash Generation Through Cycle O p e r a t i n g C a s h / W e i g h t e d A v e r a g e D i l u t e d S h a r e A v e r a g e M O P p r i c e 17 $0 $75 $150 $225 $300 $375 $450 $525 $4.40 $4.60 $4.80 $5.00 $5.20 $5.40 $5.60 $5.80 2012 2013 2014 2015 Net cash provided by operating activities per weighted average diluted share Average MOP price

Thank You The Mosaic Company Earnings Conference Call – Fourth Quarter 2015 February 11, 2016

Appendix

Phosphates Segment Highlights Key Drivers: • The year‐over‐year decrease in net sales is driven by lower sales volumes and lower average selling prices. • The year‐over‐year decrease in operating earnings reflects lower finished product selling prices and lower operating rates, partially offset by lower ammonia and sulfur costs. $ In millions, except DAP price Q4 2015 Q3 2015 Q4 2014 Net sales $1,031 $1,032 $1,212 Gross margin $121 $199 $231 Percent of net sales 12% 19% 19% Operating earnings $47 $157 $157 Sales volumes 2.2 2.1 2.4 Production volume(a) 2.2 2.4 2.4 Finished product operating rate 76% 83% 81% Avg DAP selling price $410 $451 $447 (a) Includes crop nutrient dry concentrates and animal feed ingredients 0 50 100 150 200 250 300 Q4 2014 OE Sales price Sales volumes Raw materials Other Q4 2015 OE OPERATING EARNINGS BRIDGE $ IN MILLIONS 20
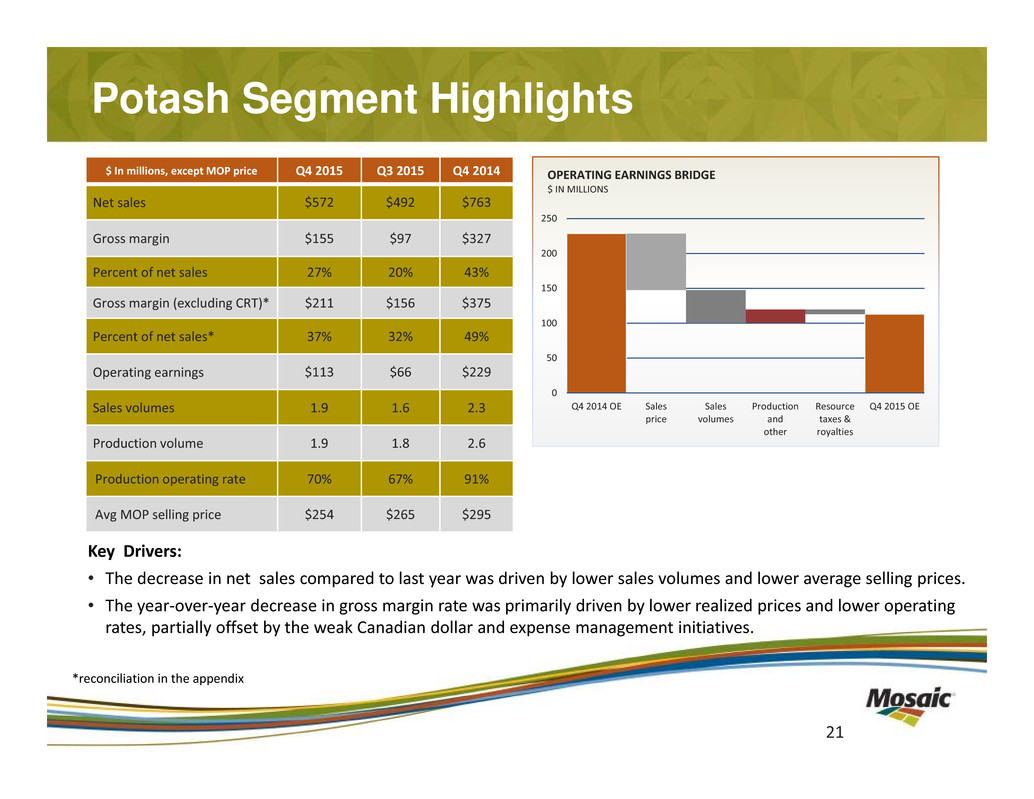
Potash Segment Highlights Key Drivers: • The decrease in net sales compared to last year was driven by lower sales volumes and lower average selling prices. • The year‐over‐year decrease in gross margin rate was primarily driven by lower realized prices and lower operating rates, partially offset by the weak Canadian dollar and expense management initiatives. 21 $ In millions, except MOP price Q4 2015 Q3 2015 Q4 2014 Net sales $572 $492 $763 Gross margin $155 $97 $327 Percent of net sales 27% 20% 43% Gross margin (excluding CRT)* $211 $156 $375 Percent of net sales* 37% 32% 49% Operating earnings $113 $66 $229 Sales volumes 1.9 1.6 2.3 Production volume 1.9 1.8 2.6 Production operating rate 70% 67% 91% Avg MOP selling price $254 $265 $295 0 50 100 150 200 250 Q4 2014 OE Sales price Sales volumes Production and other Resource taxes & royalties Q4 2015 OE OPERATING EARNINGS BRIDGE $ IN MILLIONS *reconciliation in the appendix
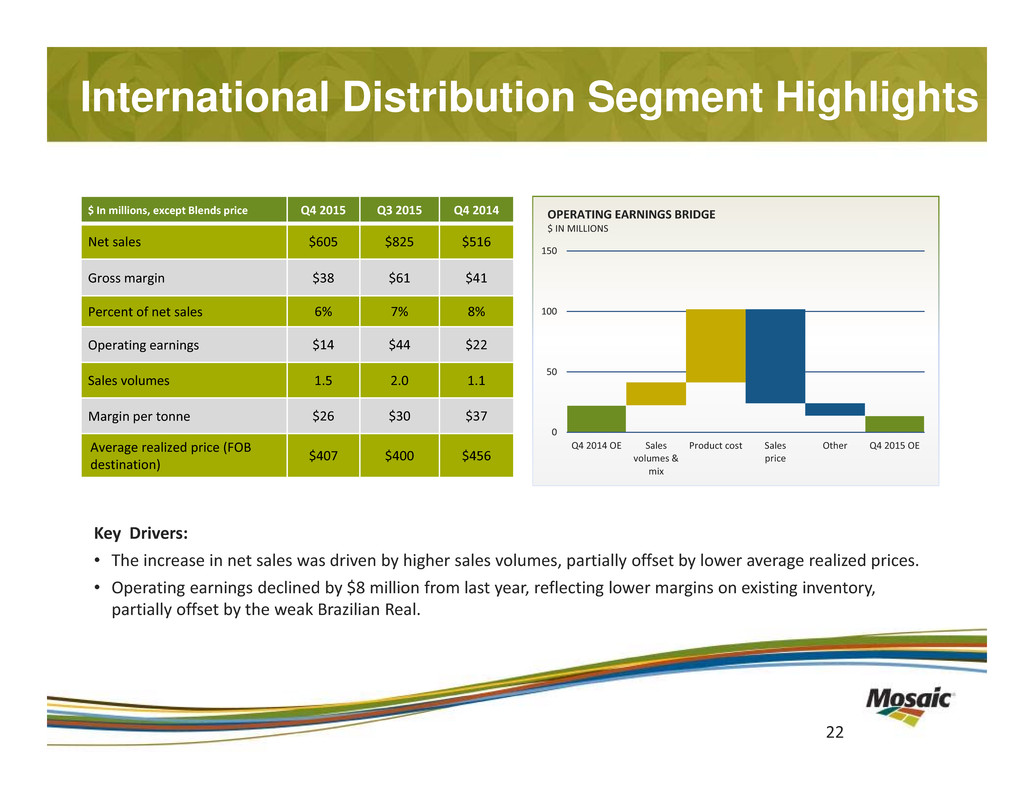
International Distribution Segment Highlights Key Drivers: • The increase in net sales was driven by higher sales volumes, partially offset by lower average realized prices. • Operating earnings declined by $8 million from last year, reflecting lower margins on existing inventory, partially offset by the weak Brazilian Real. 22 $ In millions, except Blends price Q4 2015 Q3 2015 Q4 2014 Net sales $605 $825 $516 Gross margin $38 $61 $41 Percent of net sales 6% 7% 8% Operating earnings $14 $44 $22 Sales volumes 1.5 2.0 1.1 Margin per tonne $26 $30 $37 Average realized price (FOB destination) $407 $400 $456 0 50 100 150 Q4 2014 OE Sales volumes & mix Product cost Sales price Other Q4 2015 OE OPERATING EARNINGS BRIDGE $ IN MILLIONS

Q4 2015 Percent Ammonia ($/tonnes) Realized in COGS $404 Average Purchase Price $413 Sulfur ($/ton) Realized in COGS $146 Average Purchase Price $133 Phosphate rock (realized in COGS) ('000 tonnes) U.S. mined rock 3,572 91% Purchased Miski Mayo Rock 340 9% Other Purchased Rock 9 0% Total 3,921 100% Average cost / tonne consumed rock $60 Raw Material Cost Detail 23
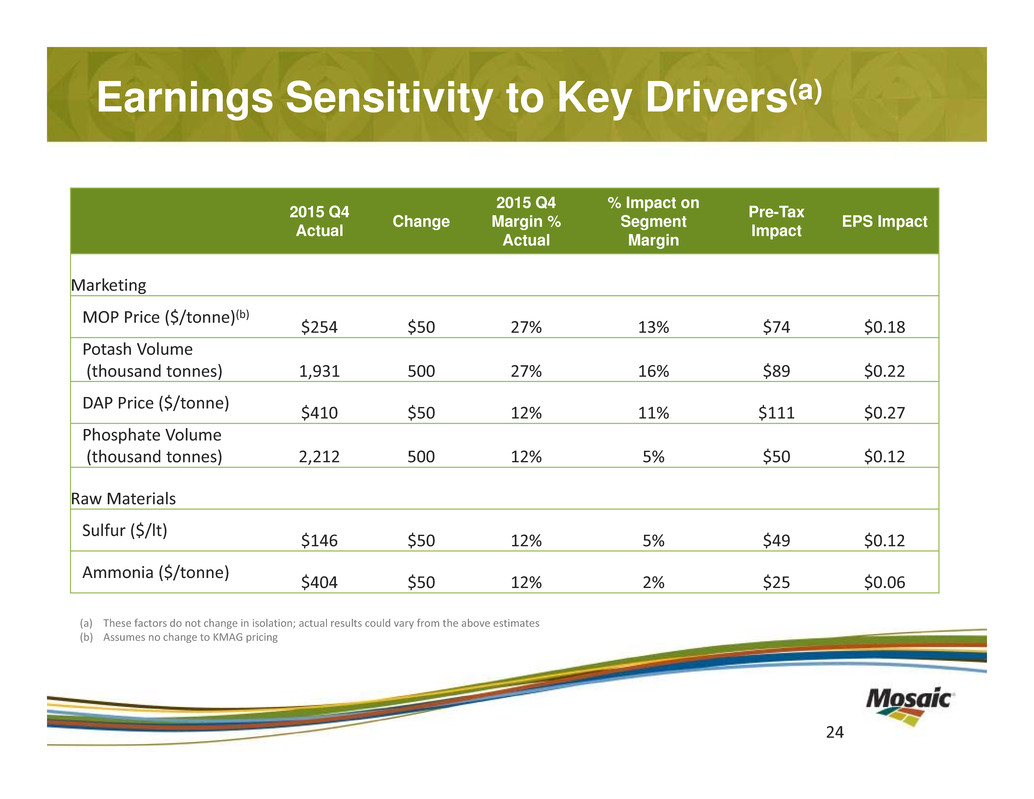
(a) These factors do not change in isolation; actual results could vary from the above estimates (b) Assumes no change to KMAG pricing Earnings Sensitivity to Key Drivers(a) 24 2015 Q4 Actual Change 2015 Q4 Margin % Actual % Impact on Segment Margin Pre-Tax Impact EPS Impact Marketing MOP Price ($/tonne)(b) $254 $50 27% 13% $74 $0.18 Potash Volume (thousand tonnes) 1,931 500 27% 16% $89 $0.22 DAP Price ($/tonne) $410 $50 12% 11% $111 $0.27 Phosphate Volume (thousand tonnes) 2,212 500 12% 5% $50 $0.12 Raw Materials Sulfur ($/lt) $146 $50 12% 5% $49 $0.12 Ammonia ($/tonne) $404 $50 12% 2% $25 $0.06

Phosphate Raw Material Trends Ammonia Sulfur ($/tonne) ($/tonne) 1. Market ammonia prices are average prices based upon Tampa C&F as reported by Fertecon 2. Market sulfur prices are average prices based upon Tampa C&F as reported by Green Markets 3. Realized raw material costs include: ~$20/tonne of transportation, transformation and storage costs for sulfur ~$30/tonne of transportation and storage costs for ammonia 25 0 100 200 300 400 500 600 700 Q1 2014 Q2 2014 Q3 2014 Q4 2014 Q1 2015 Q2 2015 Q3 2015 Q4 2015 Q1 2016F Realized Costs Market Prices 0 25 50 75 100 125 150 175 Q1 2014 Q2 2014 Q3 2014 Q4 2014 Q1 2015 Q2 2015 Q3 2015 Q4 2015 Q1 2016F Realized Costs Market Prices 1 2
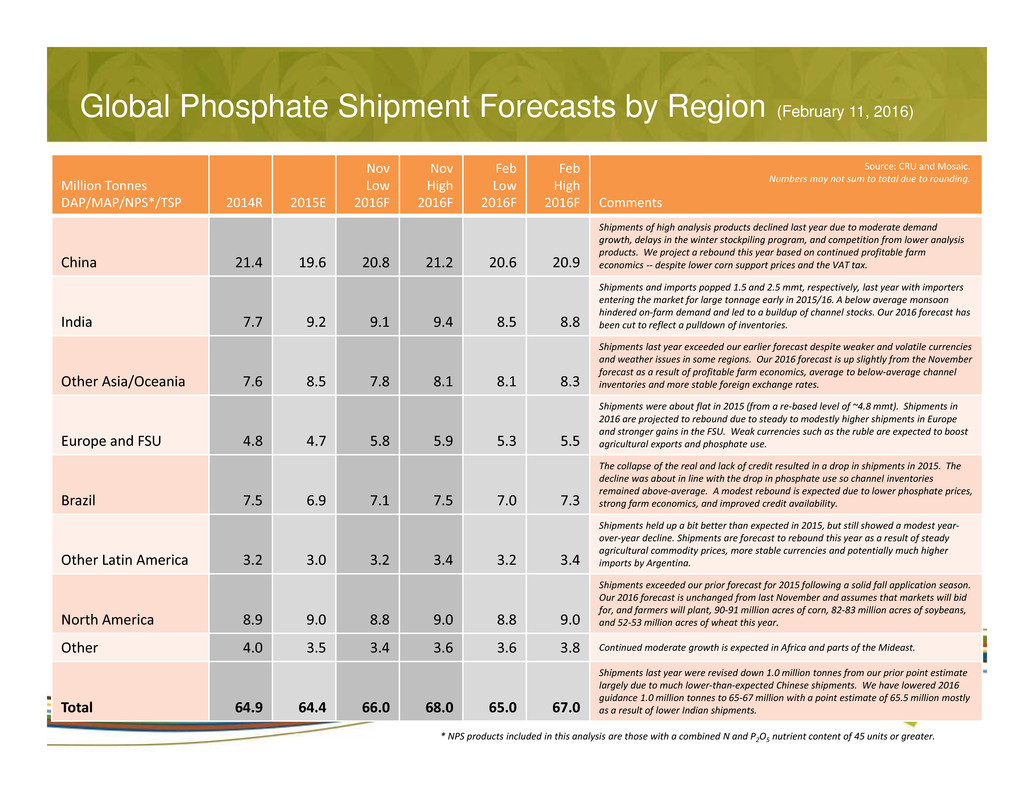
Global Phosphate Shipment Forecasts by Region (February 11, 2016) Million Tonnes DAP/MAP/NPS*/TSP 2014R 2015E Nov Low 2016F Nov High 2016F Feb Low 2016F Feb High 2016F Comments China 21.4 19.6 20.8 21.2 20.6 20.9 Shipments of high analysis products declined last year due to moderate demand growth, delays in the winter stockpiling program, and competition from lower analysis products. We project a rebound this year based on continued profitable farm economics ‐‐ despite lower corn support prices and the VAT tax. India 7.7 9.2 9.1 9.4 8.5 8.8 Shipments and imports popped 1.5 and 2.5 mmt, respectively, last year with importers entering the market for large tonnage early in 2015/16. A below average monsoon hindered on‐farm demand and led to a buildup of channel stocks. Our 2016 forecast has been cut to reflect a pulldown of inventories. Other Asia/Oceania 7.6 8.5 7.8 8.1 8.1 8.3 Shipments last year exceeded our earlier forecast despite weaker and volatile currencies and weather issues in some regions. Our 2016 forecast is up slightly from the November forecast as a result of profitable farm economics, average to below‐average channel inventories and more stable foreign exchange rates. Europe and FSU 4.8 4.7 5.8 5.9 5.3 5.5 Shipments were about flat in 2015 (from a re‐based level of ~4.8 mmt). Shipments in 2016 are projected to rebound due to steady to modestly higher shipments in Europe and stronger gains in the FSU. Weak currencies such as the ruble are expected to boost agricultural exports and phosphate use. Brazil 7.5 6.9 7.1 7.5 7.0 7.3 The collapse of the real and lack of credit resulted in a drop in shipments in 2015. The decline was about in line with the drop in phosphate use so channel inventories remained above‐average. A modest rebound is expected due to lower phosphate prices, strong farm economics, and improved credit availability. Other Latin America 3.2 3.0 3.2 3.4 3.2 3.4 Shipments held up a bit better than expected in 2015, but still showed a modest year‐ over‐year decline. Shipments are forecast to rebound this year as a result of steady agricultural commodity prices, more stable currencies and potentially much higher imports by Argentina. North America 8.9 9.0 8.8 9.0 8.8 9.0 Shipments exceeded our prior forecast for 2015 following a solid fall application season. Our 2016 forecast is unchanged from last November and assumes that markets will bid for, and farmers will plant, 90‐91 million acres of corn, 82‐83 million acres of soybeans, and 52‐53 million acres of wheat this year. Other 4.0 3.5 3.4 3.6 3.6 3.8 Continued moderate growth is expected in Africa and parts of the Mideast. Total 64.9 64.4 66.0 68.0 65.0 67.0 Shipments last year were revised down 1.0 million tonnes from our prior point estimate largely due to much lower‐than‐expected Chinese shipments. We have lowered 2016 guidance 1.0 million tonnes to 65‐67 million with a point estimate of 65.5 million mostly as a result of lower Indian shipments. Source: CRU and Mosaic. Numbers may not sum to total due to rounding. * NPS products included in this analysis are those with a combined N and P2O5 nutrient content of 45 units or greater.
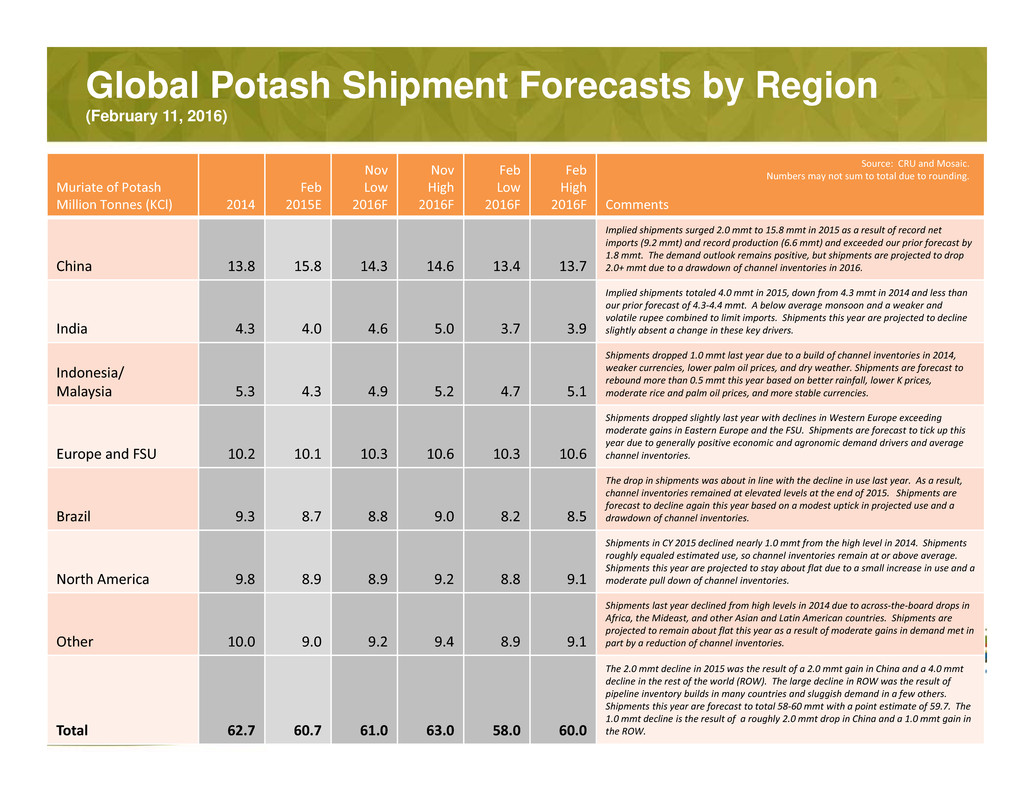
Global Potash Shipment Forecasts by Region (February 11, 2016) Muriate of Potash Million Tonnes (KCl) 2014 Feb 2015E Nov Low 2016F Nov High 2016F Feb Low 2016F Feb High 2016F Comments China 13.8 15.8 14.3 14.6 13.4 13.7 Implied shipments surged 2.0 mmt to 15.8 mmt in 2015 as a result of record net imports (9.2 mmt) and record production (6.6 mmt) and exceeded our prior forecast by 1.8 mmt. The demand outlook remains positive, but shipments are projected to drop 2.0+ mmt due to a drawdown of channel inventories in 2016. India 4.3 4.0 4.6 5.0 3.7 3.9 Implied shipments totaled 4.0 mmt in 2015, down from 4.3 mmt in 2014 and less than our prior forecast of 4.3‐4.4 mmt. A below average monsoon and a weaker and volatile rupee combined to limit imports. Shipments this year are projected to decline slightly absent a change in these key drivers. Indonesia/ Malaysia 5.3 4.3 4.9 5.2 4.7 5.1 Shipments dropped 1.0 mmt last year due to a build of channel inventories in 2014, weaker currencies, lower palm oil prices, and dry weather. Shipments are forecast to rebound more than 0.5 mmt this year based on better rainfall, lower K prices, moderate rice and palm oil prices, and more stable currencies. Europe and FSU 10.2 10.1 10.3 10.6 10.3 10.6 Shipments dropped slightly last year with declines in Western Europe exceeding moderate gains in Eastern Europe and the FSU. Shipments are forecast to tick up this year due to generally positive economic and agronomic demand drivers and average channel inventories. Brazil 9.3 8.7 8.8 9.0 8.2 8.5 The drop in shipments was about in line with the decline in use last year. As a result, channel inventories remained at elevated levels at the end of 2015. Shipments are forecast to decline again this year based on a modest uptick in projected use and a drawdown of channel inventories. North America 9.8 8.9 8.9 9.2 8.8 9.1 Shipments in CY 2015 declined nearly 1.0 mmt from the high level in 2014. Shipments roughly equaled estimated use, so channel inventories remain at or above average. Shipments this year are projected to stay about flat due to a small increase in use and a moderate pull down of channel inventories. Other 10.0 9.0 9.2 9.4 8.9 9.1 Shipments last year declined from high levels in 2014 due to across‐the‐board drops in Africa, the Mideast, and other Asian and Latin American countries. Shipments are projected to remain about flat this year as a result of moderate gains in demand met in part by a reduction of channel inventories. Total 62.7 60.7 61.0 63.0 58.0 60.0 The 2.0 mmt decline in 2015 was the result of a 2.0 mmt gain in China and a 4.0 mmt decline in the rest of the world (ROW). The large decline in ROW was the result of pipeline inventory builds in many countries and sluggish demand in a few others. Shipments this year are forecast to total 58‐60 mmt with a point estimate of 59.7. The 1.0 mmt decline is the result of a roughly 2.0 mmt drop in China and a 1.0 mmt gain in the ROW. Source: CRU and Mosaic. Numbers may not sum to total due to rounding.
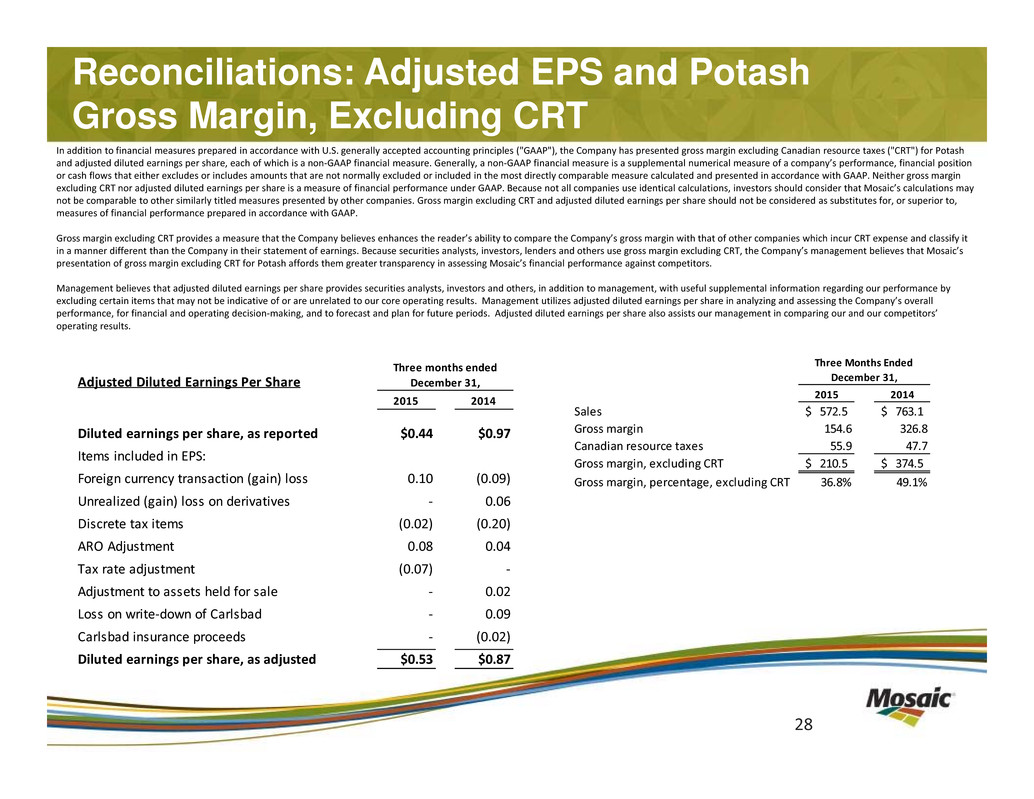
Reconciliations: Adjusted EPS and Potash Gross Margin, Excluding CRT 28 In addition to financial measures prepared in accordance with U.S. generally accepted accounting principles ("GAAP"), the Company has presented gross margin excluding Canadian resource taxes ("CRT") for Potash and adjusted diluted earnings per share, each of which is a non‐GAAP financial measure. Generally, a non‐GAAP financial measure is a supplemental numerical measure of a company’s performance, financial position or cash flows that either excludes or includes amounts that are not normally excluded or included in the most directly comparable measure calculated and presented in accordance with GAAP. Neither gross margin excluding CRT nor adjusted diluted earnings per share is a measure of financial performance under GAAP. Because not all companies use identical calculations, investors should consider that Mosaic’s calculations may not be comparable to other similarly titled measures presented by other companies. Gross margin excluding CRT and adjusted diluted earnings per share should not be considered as substitutes for, or superior to, measures of financial performance prepared in accordance with GAAP. Gross margin excluding CRT provides a measure that the Company believes enhances the reader’s ability to compare the Company’s gross margin with that of other companies which incur CRT expense and classify it in a manner different than the Company in their statement of earnings. Because securities analysts, investors, lenders and others use gross margin excluding CRT, the Company’s management believes that Mosaic’s presentation of gross margin excluding CRT for Potash affords them greater transparency in assessing Mosaic’s financial performance against competitors. Management believes that adjusted diluted earnings per share provides securities analysts, investors and others, in addition to management, with useful supplemental information regarding our performance by excluding certain items that may not be indicative of or are unrelated to our core operating results. Management utilizes adjusted diluted earnings per share in analyzing and assessing the Company’s overall performance, for financial and operating decision‐making, and to forecast and plan for future periods. Adjusted diluted earnings per share also assists our management in comparing our and our competitors’ operating results. 2015 2014 Sales 572.5$ 763.1$ Gross margin 154.6 326.8 Canadian resource taxes 55.9 47.7 Gross margin, excluding CRT 210.5$ 374.5$ Gross margin, percentage, excluding CRT 36.8% 49.1% Three Months Ended December 31,Adjusted Diluted Earnings Per Share 2015 2014 Diluted earnings per share, as reported $0.44 $0.97 Items included in EPS: Foreign currency transaction (gain) loss 0.10 (0.09) Unrealized (gain) loss on derivatives ‐ 0.06 Discrete tax items (0.02) (0.20) ARO Adjustment 0.08 0.04 Tax rate adjustment (0.07) ‐ Adjustment to assets held for sale ‐ 0.02 Loss on write‐down of Carlsbad ‐ 0.09 Carlsbad insurance proceeds ‐ (0.02) Diluted earnings per share, as adjusted $0.53 $0.87 Three months ended December 31,


