
Laura Gagnon Vice President Investor Relations Tel 763-577-8213 Cell 612-201-7550 laura.gagnon@mosaicco.com Anton Pshon Director Investor Relations Tel 763-577-2876 Investor Cell 612-834-0988 Information anton.pshon@mosaicco.com Second Quarter 2018 1

Safe Harbor Statement This presentation contains forward-looking statements within the meaning of the Private Securities Litigation Reform Act of 1995. Such statements include, but are not limited to, statements about the anticipated benefits and synergies of our acquisition of the global phosphate and potash operations of Vale S.A. previously conducted through Vale Fertilizantes S.A. (which, when combined with our legacy distribution business in Brazil, is now known as Mosaic Fertilizantes) (the “Transaction”), other proposed or pending future transactions or strategic plans and other statements about future financial and operating results. Such statements are based upon the current beliefs and expectations of The Mosaic Company’s management and are subject to significant risks and uncertainties. These risks and uncertainties include, but are not limited to: difficulties with realization of the benefits and synergies of the Transaction, including the risks that the acquired business may not be integrated successfully or that the anticipated synergies or cost or capital expenditure savings from the Transaction may not be fully realized or may take longer to realize than expected, including because of political and economic instability in Brazil or changes in government policy in Brazil; the predictability and volatility of, and customer expectations about, agriculture, fertilizer, raw material, energy and transportation markets that are subject to competitive and other pressures and economic and credit market conditions; the level of inventories in the distribution channels for crop nutrients; the effect of future product innovations or development of new technologies on demand for our products; changes in foreign currency and exchange rates; international trade risks and other risks associated with Mosaic’s international operations and those of joint ventures in which Mosaic participates, including the performance of the Wa’ad Al Shamal Phosphate Company (also known as MWSPC), the ability of MWSPC to obtain additional planned funding in acceptable amounts and upon acceptable terms, the timely development and commencement of operations of production facilities in the Kingdom of Saudi Arabia, and the future success of current plans for MWSPC and any future changes in those plans; the risk that protests against natural resource companies in Peru extend to or impact the Miski Mayo mine, which is operated by an entity in which we are the majority owner; difficulties with realization of the benefits of our long term natural gas based pricing ammonia supply agreement with CF Industries, Inc., including the risk that the cost savings initially anticipated from the agreement may not be fully realized over its term or that the price of natural gas or ammonia during the term are atlevelsatwhich the pricing is disadvantageous to Mosaic; customer defaults; the effects of Mosaic’s decisions to exit business operations or locations; changes in government policy; changes in environmental and other governmental regulation, including expansion of the types and extent of water resources regulated under federal law, carbon taxes or other greenhouse gas regulation, implementation of numeric water quality standards for the discharge of nutrients into Florida waterways or efforts to reduce the flow of excess nutrients into the Mississippi River basin, the Gulf of Mexico or elsewhere; further developments in judicial or administrative proceedings, or complaints that Mosaic’s operations are adversely impacting nearby farms, business operations or properties; difficulties or delays in receiving, increased costs of or challenges to necessary governmental permits or approvals or increased financial assurance requirements; resolution of global tax audit activity; the effectiveness of Mosaic’s processes for managing its strategic priorities; adverse weather conditions affecting operations in Central Florida, the Mississippi River basin, the Gulf Coast of the United States, Canada or Brazil, and including potential hurricanes, excess heat, cold, snow, rainfall or drought; actual costs of various items differing from management’s current estimates, including, among others, asset retirement, environmental remediation, reclamation or other environmental regulation, Canadian resources taxes and royalties, or the costs of the MWSPC, its existing or future funding and Mosaic’s commitments in support of such funding; reduction of Mosaic’s available cash and liquidity, and increased leverage, due to its use of cash and/or available debt capacity to fund financial assurance requirements and strategic investments; brine inflows at Mosaic’s Esterhazy, Saskatchewan, potash mine or other potash shaft mines; other accidents and disruptions involving Mosaic’s operations, including potential mine fires, floods, explosions, seismic events, sinkholes or releases of hazardous or volatile chemicals; and risks associated with cyber security, including reputational loss; as well as other risks and uncertainties reported from time to time in The Mosaic Company’s reports filed with the Securities and Exchange Commission. Actual results may differ from those set forth in the forward-looking statements. 2

The Mosaic Company Overview 3
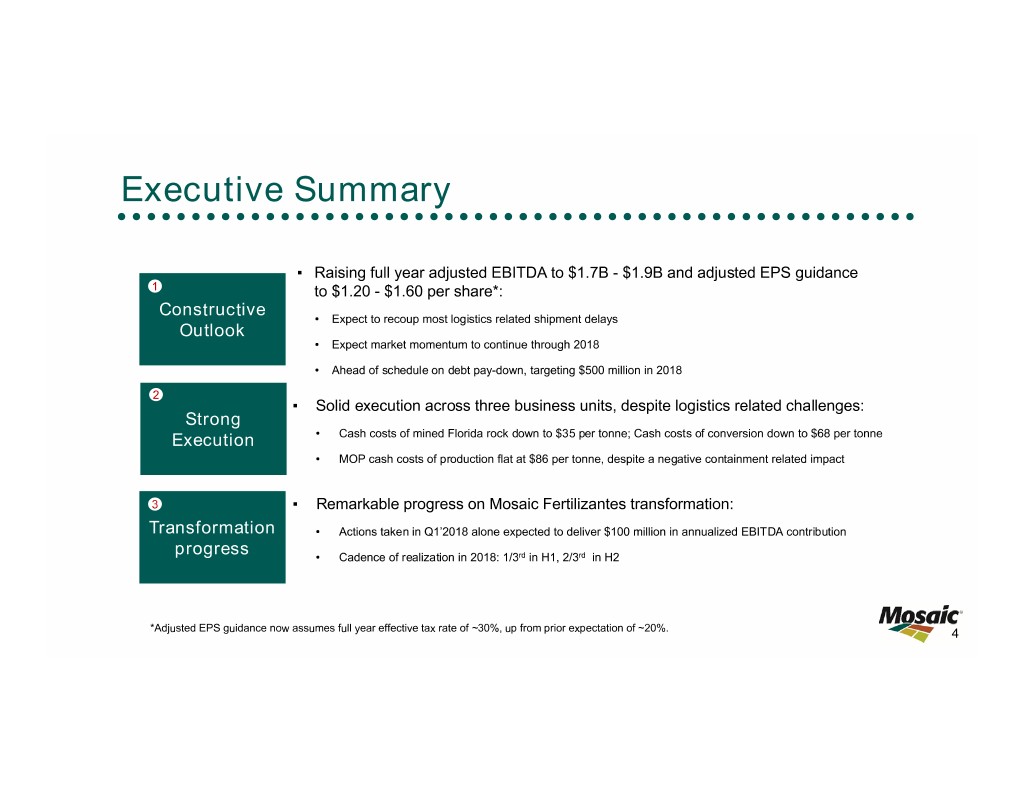
Executive Summary ▪ Raising full year adjusted EBITDA to $1.7B - $1.9B and adjusted EPS guidance 1 to $1.20 - $1.60 per share*: Constructive • Expect to recoup most logistics related shipment delays Outlook • Expect market momentum to continue through 2018 • Ahead of schedule on debt pay-down, targeting $500 million in 2018 2 ▪ Solid execution across three business units, despite logistics related challenges: Strong Execution • Cash costs of mined Florida rock down to $35 per tonne; Cash costs of conversion down to $68 per tonne • MOP cash costs of production flat at $86 per tonne, despite a negative containment related impact 3 ▪ Remarkable progress on Mosaic Fertilizantes transformation: Transformation • Actions taken in Q1’2018 alone expected to deliver $100 million in annualized EBITDA contribution progress • Cadence of realization in 2018: 1/3rd in H1, 2/3rd in H2 *Adjusted EPS guidance now assumes full year effective tax rate of ~30%, up from prior expectation of ~20%. 4

Mosaic Assets: Global, Long Life, Low Cost Phosphate Production Potash Production Distribution Facilities Joint Ventures 55

Transformation: Idled Plant City $/Tonne Conversion Costs Mined Rock Costs $/Tonne $50 $80 $70 $40 $60 $30 $50 $20 $40 2014 2015 2016 2017 Q1 2018 2014 2015 2016 2017 Q1 2018 Cash Production Costs Cash Conversion Costs * Phosphate cash conversion costs are reflective of actual costs, excluding realized mark-to-market gains and losses. These costs are captured in inventory 6 and are not necessarily reflective of costs included in costs of goods sold for the period.

Transformation: Anticipated S&D Impact of Idling Plant City Million Tonnes Forecast Global Phosphate Capacity vs. Shipments DAP/MAP/NPS Cumulative Change 2018-2020 5 Cumulative Net Capacity Growth 4 Cumulative Demand Growth 3 2 1 0 -1 18F 19F 20F Source: CRU and Mosaic Tightened phosphate supply & demand even without expected China capacity rationalization 7

Transformation in Potash: Asset Optimization and Cost Control $ Per Tonne Despite Logistics Related Costs $140 $120 $100 $80 $60 $40 $20 $- 2013 2014 2015 2016 2017 Q1 2018 MOP Cash Production Costs Per Tonne* Brine *MOP cash production costs are reflective of actual costs during the quarter, excluding CRT and realized mark-to-market gains and 8 losses. These costs are captured in inventory and are not necessarily reflective of costs included in costs of goods sold for the period.
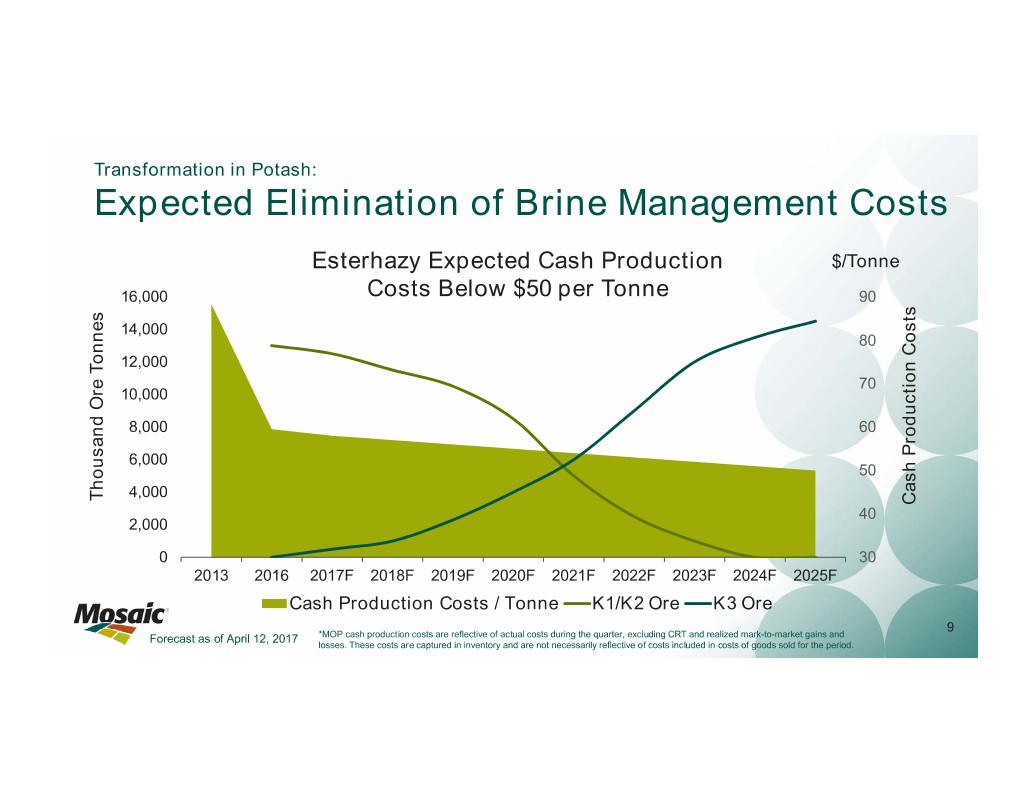
Transformation in Potash: Expected Elimination of Brine Management Costs Esterhazy Expected Cash Production $/Tonne 16,000 Costs Below $50 per Tonne 90 14,000 80 12,000 70 10,000 8,000 60 6,000 50 4,000 Thousand Ore Tonnes Cash Production Costs 40 2,000 0 30 2013 2016 2017F 2018F 2019F 2020F 2021F 2022F 2023F 2024F 2025F Cash Production Costs / Tonne K1/K2 Ore K3 Ore 9 Forecast as of April 12, 2017 *MOP cash production costs are reflective of actual costs during the quarter, excluding CRT and realized mark-to-market gains and losses. These costs are captured in inventory and are not necessarily reflective of costs included in costs of goods sold for the period.
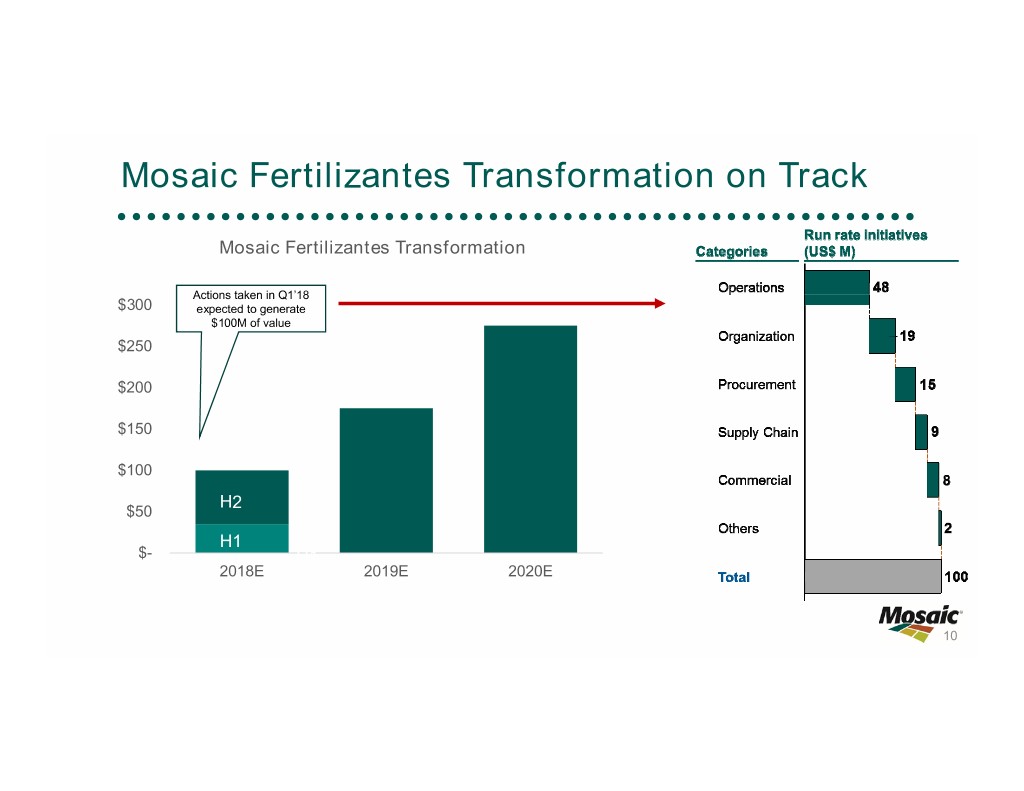
Mosaic Fertilizantes Transformation on Track Mosaic Fertilizantes Transformation Actions taken in Q1’18 $300 expected to generate $100M of value $250 $200 $150 $100 H2 $50 H1 $- H1 2018E 2019E 2020E 10
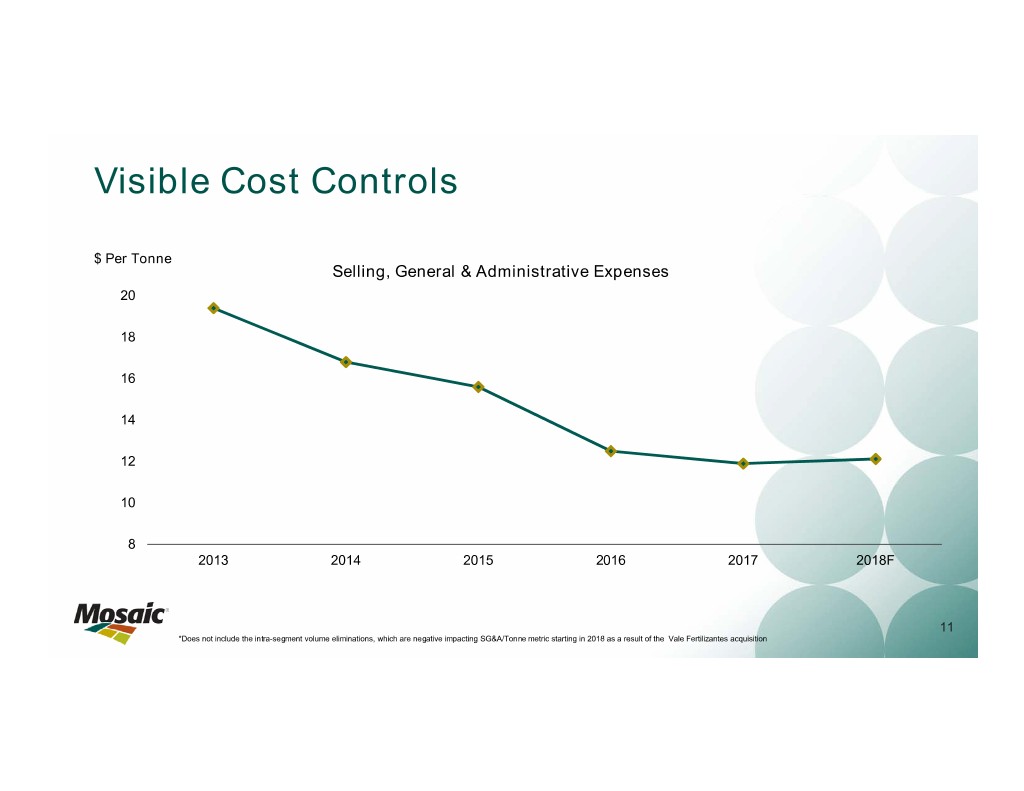
Visible Cost Controls $ Per Tonne Selling, General & Administrative Expenses 20 18 16 14 12 10 8 2013 2014 2015 2016 2017 2018F 11 *Does not include the intra-segment volume eliminations, which are negative impacting SG&A/Tonne metric starting in 2018 as a result of the Vale Fertilizantes acquisition

Capital Allocation Philosophy Further accelerating debt repayment in 2018 12
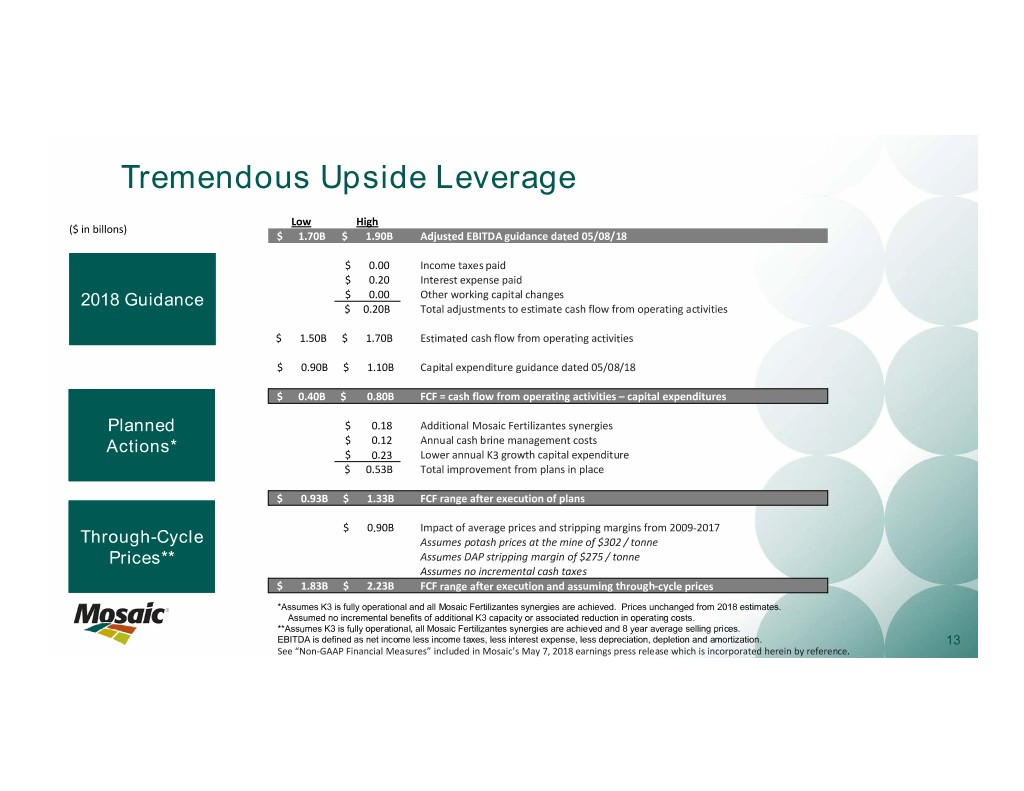
Tremendous Upside Leverage Low High ($ in billons) $ 1.70B $ 1.90B Adjusted EBITDA guidance dated 05/08/18 $ 0.00 Income taxes paid $ 0.20 Interest expense paid 2018 Guidance $ 0.00 Other working capital changes $ 0.20B Total adjustments to estimate cash flow from operating activities $ 1.50B $ 1.70B Estimated cash flow from operating activities $ 0.90B $ 1.10B Capital expenditure guidance dated 05/08/18 $ 0.40B $ 0.80B FCF = cash flow from operating activities – capital expenditures Planned $ 0.18 Additional Mosaic Fertilizantes synergies $ 0.12 Annual cash brine management costs Actions* $ 0.23 Lower annual K3 growth capital expenditure $ 0.53B Total improvement from plans in place $ 0.93B $ 1.33B FCF range after execution of plans $ 0.90B Impact of average prices and stripping margins from 2009‐2017 Through-Cycle Assumes potash prices at the mine of $302 / tonne Prices** Assumes DAP stripping margin of $275 / tonne Assumes no incremental cash taxes $ 1.83B $ 2.23B FCF range after execution and assuming through‐cycle prices *Assumes K3 is fully operational and all Mosaic Fertilizantes synergies are achieved. Prices unchanged from 2018 estimates. Assumed no incremental benefits of additional K3 capacity or associated reduction in operating costs. **Assumes K3 is fully operational, all Mosaic Fertilizantes synergies are achieved and 8 year average selling prices. EBITDA is defined as net income less income taxes, less interest expense, less depreciation, depletion and amortization. 13 See “Non‐GAAP Financial Measures” included in Mosaic’s May 7, 2018 earnings press release which is incorporated herein by reference.
Markets Agricultural Outlook 14
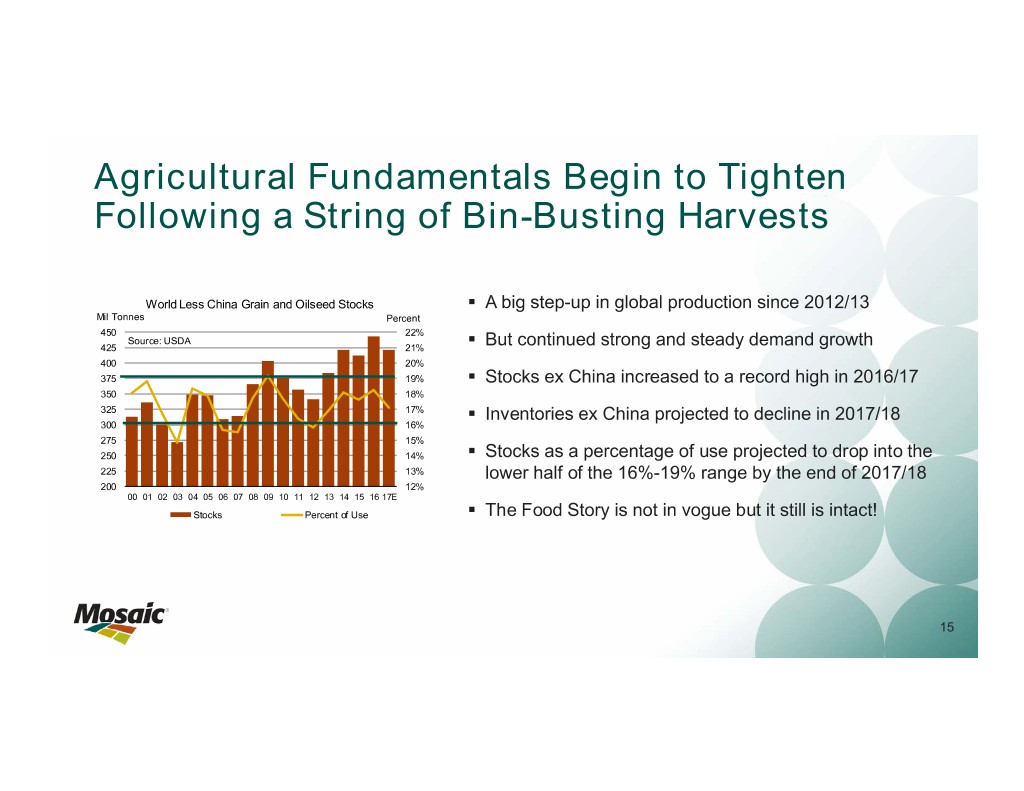
Agricultural Fundamentals Begin to Tighten Following a String of Bin-Busting Harvests World Less China Grain and Oilseed Stocks . A big step-up in global production since 2012/13 Mil Tonnes Percent 450 22% Source: USDA 425 21% . But continued strong and steady demand growth 400 20% 375 19% . Stocks ex China increased to a record high in 2016/17 350 18% 325 17% . Inventories ex China projected to decline in 2017/18 300 16% 275 15% 250 14% . Stocks as a percentage of use projected to drop into the 225 13% lower half of the 16%-19% range by the end of 2017/18 200 12% 00 01 02 03 04 05 06 07 08 09 10 11 12 13 14 15 16 17E Stocks Percent of Use . The Food Story is not in vogue but it still is intact! 15

Mostly Firm Crop Prices Underpin Positive P&K Demand Outlook Corn Prices Soybean Prices HRW Wheat Prices US$ BU US$ BU US$ BU Daily Close of the December Contract (Sep 1 - Aug 31) Daily Close of the November Contract (Sep 1 - Aug 31) Daily Close of the July Contract (Jun 1 - May 31) 4.50 12.00 6.50 Source: CME Source: CME Source: CME 6.25 11.50 4.25 6.00 11.00 5.75 4.00 5.50 10.50 3.75 5.25 10.00 5.00 3.50 9.50 4.75 4.50 3.25 9.00 4.25 3.00 8.50 4.00 SONDJFMAMJJA SONDJFMAMJJA JJASONDJFMAM 2018 2017 2016 2018 2017 2016 2018 2017 2016 US$ Rice Prices Malaysian Palm Oil Prices Sugar Prices Cotton Prices Rngts US$ US$ CWT Daily Close of Nearby Option Daily Clos e of Ne ar by Option CWT Daily Close of Nearby Option Daily Clos e of Ne ar by Option Tonne CWT 13.5 3,000 16 87.5 Source: NYMEX Source: NYMEX Source: CRB Source: NYMEX 2,900 85.0 13.0 15 82.5 2,800 80.0 12.5 2,700 14 77.5 12.0 2,600 75.0 13 2,500 72.5 11.5 70.0 2,400 12 67.5 11.0 2,300 16 Sep-17 Dec-17 Mar-18 Sep-17 Dec-17 Mar-18 11 65.0 Sep-17 Dec-17 Mar-18 Sep-17 Dec-17 Mar-18

Positive Agronomic & Economic Demand Drivers Record Harvests Remove Record Amounts of P&K Plant Nutrients Still Affordable World Grain and Oilseed Production Bil Tonnes Plant Nutrient Affordability Plant Nutrient Price Index / Crop Price Index 3.2 1.00 Source: USDA Less Affordable 3.0 0.90 2.8 0.80 2.6 0.70 2.4 0.60 2.2 0.50 Source: Weekly Price Publications, CME, More Affordable 2.0 USDA, AAPFCO, Mosaic 00 01 02 03 04 05 06 07 08 09 10 11 12 13 14 15 16 17E 0.40 10 11 12 13 14 15 16 17 18 Estimated World Grain & Oilseed Nutrient Removal Index Average 2010-17 2007-12 2013-17 Percent Stoop Stoop Mil Tonnes (2.74 bmt) (3,06 bmt) Change Change N Removal 59.3 66.2 6.9 11.6% P2O5 Removal 22.9 25.4 2.5 10.9% K2O Removal 19.2 21.5 2.2 11.7% Source: USDA, IPNI, M osaic 17

Brazil Farmers Benefit from the Argentine Drought, a Weaker Real, and the Threat of a U.S.-China Trade War Cents Bu Soybean Premium at Paranaguá Port 225 200 175 Soybean Premium at Paranaguá Port 150 Four-Year Cents Bu 125 2018 Average Change January $0.64 $0.36 77% 100 February $0.64 $0.34 91% 75 March $0.88 $0.29 204% 50 April $1.46 $0.39 274% 25 0 Jan Feb Mar Apr May Jun Jul Aug Sep Oct Nov Dec Average 2014 -2017 2018 18

Markets Brazil 19
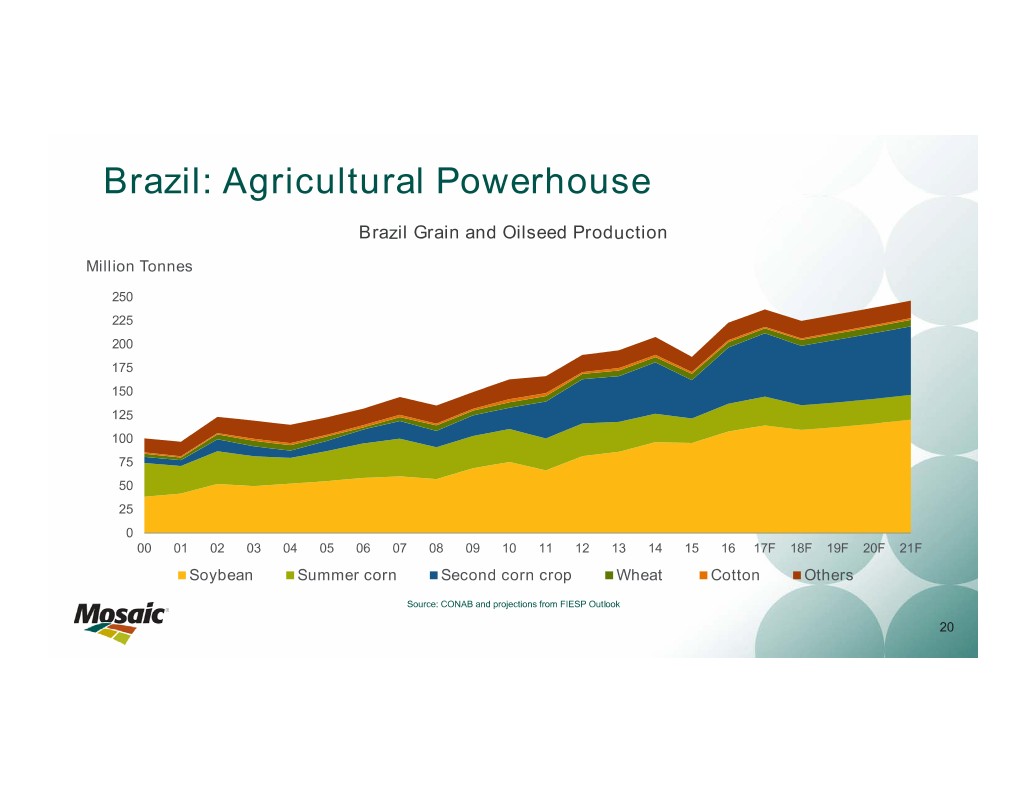
Brazil: Agricultural Powerhouse Brazil Grain and Oilseed Production Million Tonnes 250 225 200 175 150 125 100 75 50 25 0 00 01 02 03 04 05 06 07 08 09 10 11 12 13 14 15 16 17F 18F 19F 20F 21F Soybean Summer corn Second corn crop Wheat Cotton Others Source: CONAB and projections from FIESP Outlook 20
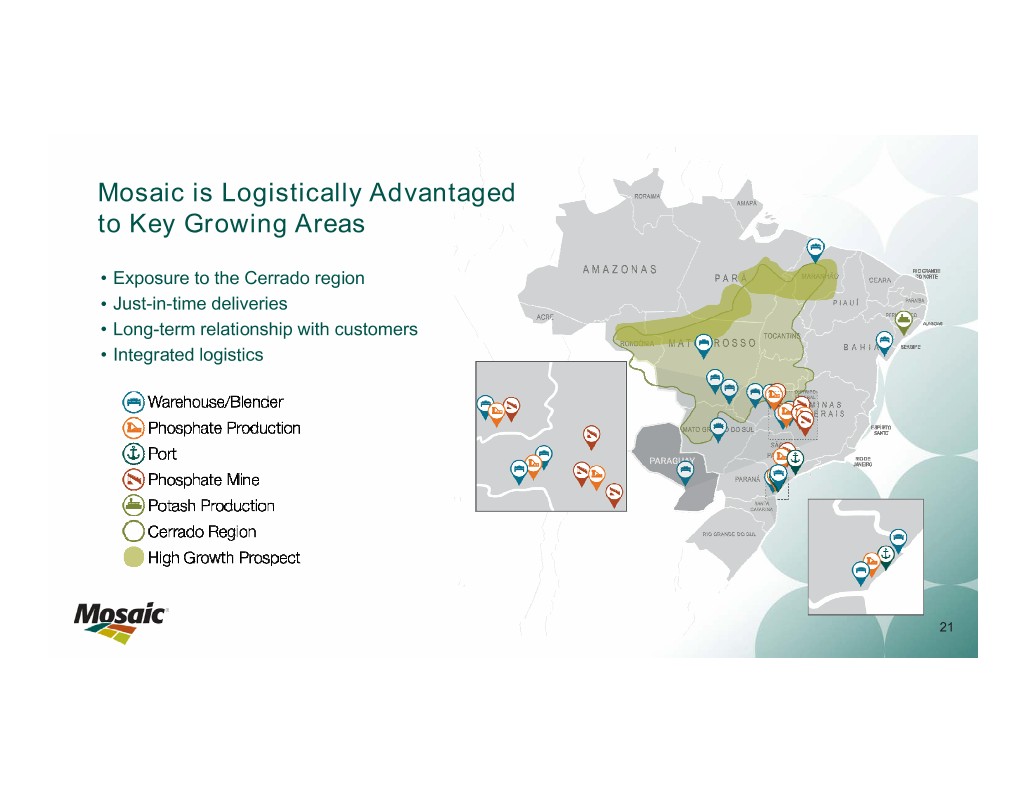
Mosaic is Logistically Advantaged to Key Growing Areas • Exposure to the Cerrado region • Just-in-time deliveries • Long-term relationship with customers • Integrated logistics 21
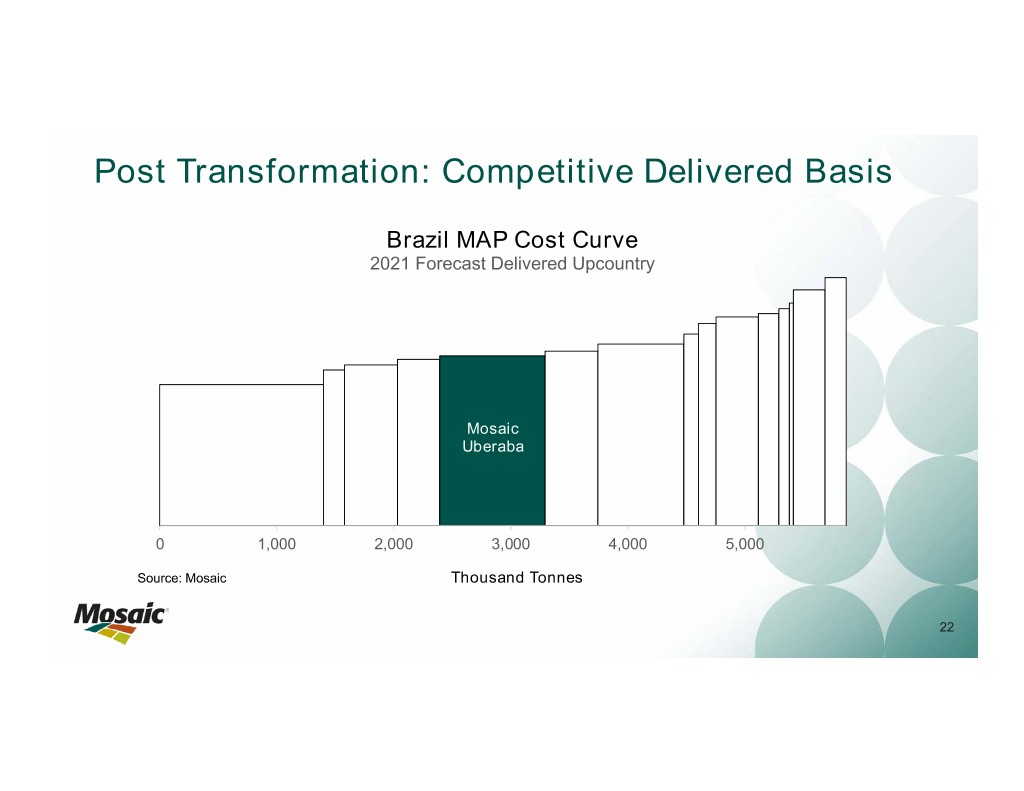
Post Transformation: Competitive Delivered Basis Brazil MAP Cost Curve 2021 Forecast Delivered Upcountry Mosaic Uberaba 0 1,000 2,000 3,000 4,000 5,000 Source: Mosaic Thousand Tonnes 22

Markets Potash Outlook 23

Key Prices Move Up Potash Prices $ Tonne KCl 475 450 425 400 375 . Strong broad-based demand growth 350 325 . Optimized/restructured operations 300 275 250 . No immediate threat from new capacity 225 Source: Argus 200 175 Jan-14 Jan-15 Jan-16 Jan-17 Jan-18 fob NOLA fob U.S. Corn Belt c&f Brazil c&f SE Asia 24
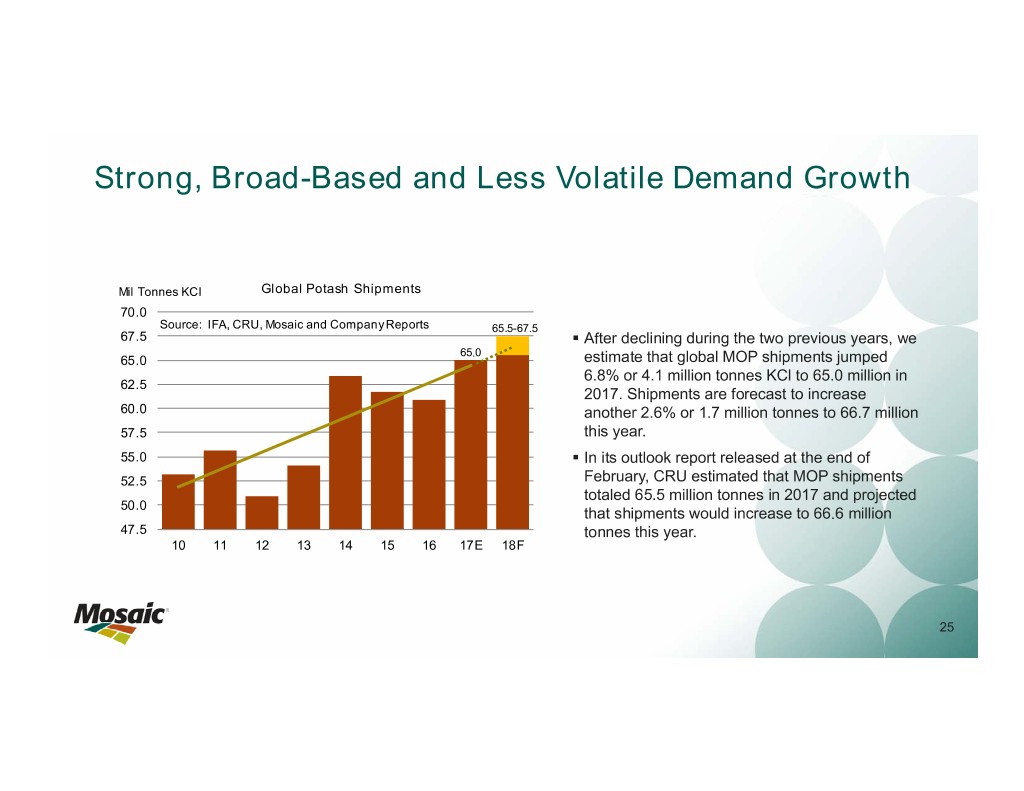
Strong, Broad-Based and Less Volatile Demand Growth Mil Tonnes KCl Global Potash Shipments 70.0 Source: IFA, CRU, Mosaic and Company Reports 65.5-67.5 67.5 . After declining during the two previous years, we 65.0 65.0 estimate that global MOP shipments jumped 6.8% or 4.1 million tonnes KCl to 65.0 million in 62.5 2017. Shipments are forecast to increase 60.0 another 2.6% or 1.7 million tonnes to 66.7 million 57.5 this year. 55.0 . In its outlook report released at the end of 52.5 February, CRU estimated that MOP shipments totaled 65.5 million tonnes in 2017 and projected 50.0 that shipments would increase to 66.6 million 47.5 tonnes this year. 10 11 12 13 14 15 16 17E 18F 25

Strong and Broad-Based Demand Growth Mil Tonnes Brazil MOP Shipments Mil Tonnes China MOP Shipments KCl KCl Chinese shipments also are 10.5 18.0 Source: ANDA, Mosaic and Company Reports 10.0 Source: CRU and Mosaic trending up due to record crop 16.0 9.5 Brazil demand continues its production as well as efforts to 9.0 14.0 8.5 upward march driven mainly by improve nutrient balance. Higher 12.0 8.0 steady increases in soybean domestic MOP production met 7.5 10.0 7.0 production. Shipments are much of the recent growth, but 8.0 6.5 forecast to breach the 10 million domestic output likely has 6.0 6.0 5.5 tonne mark this year. plateaued, implying strong growth 4.0 5.0 10 11 12 13 14 15 16 17E 18F 10 11 12 13 14 15 16 17E 18F in import demand. Mil Tonnes North American MOP Shipments Mil Tonnes India MOP Shipments KCl KCl 6.5 India shipments are beginning to 11.0 North American shipments surged Source: FAI, IFA, and Mosaic Source: IPNI, DOC and Mosaic 6.0 recover following 2010/11 subsidy 10.5 to 10.5 million tonnes KCl in 2017 5.5 10.0 changes that resulted in a near due to a strong fall application 5.0 9.5 tripling of retail potash prices. season and early positioning of 4.5 9.0 Higher crop support prices and 8.5 2018 needs. On-farm demand is 4.0 8.0 expected to stay stable this year, 3.5 initial forecasts of a normal 7.5 3.0 monsoon rainfall also are aiding 7.0 but shipments are projected to 2.5 the recovery this year. 6.5 drop to about 9.8 mmt this year. 2.0 10 11 12 13 14 15 16 17E 18F 10 11 12 13 14 15 16 17E 18F Mil Tonnes Mil Tonnes Rest of World MOP Shipments Malaysia+Indonesia MOP Shipments Indonesian and Malaysian KCl KCl 6.0 22.0 Source: IFA and Mosaic shipments also have trended 5.5 Source: IFA, CRU and Mosaic Shipments outside the “Big Six” 21.0 5.0 upward with surges in 2011 and 4.5 20.0 countries/regions have taken off 2014. Gains are driven mostly by 4.0 19.0 led mostly by other Asian and 3.5 increases in palm oil production, 3.0 18.0 other Latin American countries as but positive rice profitability also 2.5 17.0 well as a doubling of African use 2.0 has helped to underpin potash 1.5 16.0 during the last five years (albeit use in this region as well as in 1.0 15.0 from a low starting point). 10 11 12 13 14 15 16 17E 18F other Asian countries. 10 11 12 13 14 15 16 17E 18F Indonesia Malaysia 26

Global Potash Shipment Forecasts by Region (May 2018) Source: IFA, CRU and Mosaic Muriate of Potash Low High (Numbers may not sum to total due to rounding) Million Tonnes (KCl) 2015 2016 2017E 2018F 2018F Comments 2017 shipments were revised down to 14.6 mmt due to lower production (7.3 mmt production plus 7.3 mmt net imports). 2018 shipments are projected to rebound to 15.8 mmt (7.5 mmt production plus 8.3 mmt net China 16.4 14.0 14.6 15.6 15.9 imports) due to high crop prices, moderate potash prices and low channel stocks especially at NPK plants. CY 2017 shipments were revised down to 4.4 mmt based on the final import statistics. 2018 shipments are forecast to increase to 4.6 mmt due to higher minimum support prices for key crops, moderate K prices, a India 4.1 3.9 4.4 4.5 4.7 stable rupee, workable import economics, and initial forecasts of a normal monsoon this year. 2017 shipments were revised up again based on final import statistics. Shipments are expected to increase in Indonesia+Malaysia 4.6 4.7 5.1 5.0 5.2 2018 due to still favorable palm oil and rice prices and the expectation of normal rainfall this year. Shipments to this region jumped in 2017 led by big gains in Thailand, and Vietnam. Demand continues Other Asia 4.4 4.8 5.0 5.2 5.3 buoyed by good weather, favorable policies, OK crop prices and moderate K prices. We estimate that shipments dropped in 2017 as a result of elevated channel inventories and the aftermath of W. Europe 4.8 5.0 4.8 4.7 4.9 the drought in southern Europe last year. Shipments are forecast to stay in the 4.8 mmt range this year. Shipments here are following the increase in agricultural output. Demand is underpinned by mostly favorable E. Europe+FSU 4.7 4.6 5.2 5.3 5.5 weather, strong local-currency crop prices (bolstered by still weak currencies) and moderate K prices. Based on 2017 ANDA statistics, shipments were revised up to a record 9.7 mmt last year (.49 mmt production plus 9.20 mmt net imports). 2018 shipments are expected to breach the 10.0 mmt mark due to Brazil 8.8 9.3 9.7 10.0 10.2 continued good weather and positive agronomic and economic demand drivers. 2017 shipments were revised up as a result of broad-based gains in Central and other South America Other L. America 2.6 2.8 3.0 2.9 3.1 countries. Shipments this year are forecast to stay flat due to continued positive farm economics. 2017 shipments were revised up slightly due to another strong fall application season and early positioning of 2018 needs ahead of announced price increases. In 2018, on-farm use is expected to stay flat at higher new N. America 8.8 9.4 10.5 9.6 9.8 normal levels, but shipments are projected to drop to 9.8 mmt as some tonnage shipped late last year. Africa accounted for about two-thirds of the increase last year. Shipments are forecast to increase modestly Other 2.5 2.4 2.7 2.7 2.9 this year with additional but less robust gains in Africa, Oceania and the Mideast. Final statistics for 2017 show that shipments surged 6.8% or 4.1 mmt to 65.0 mmt last year. All regions except Western Europe posted gains last year. Shipments this year are forecast to increase to 65.5-67.5 mmt Total 61.7 60.9 65.0 65.5 67.5 with a point estimate of 66.7 mmt, a gain of 2.6% or 1.7 mmt.

Supply and Demand Scenarios Potential Potash Supply/Demand Changes in 2018 Price Scenario Mil Tonnes KCl Low Likely High Shipment Increase 1.00 1.70 2.50 Met from Drawdown of Producer Inventories 0.60 0.50 0.40 Supply Net Changes Price Scenario 1.90 1.40 0.95 Low Likely High ICL Boulby Closure -0.20 -0.20 -0.20 Garlyk Ramp-Up 0.15 0.10 0.05 K+S Bethune Ramp-Up 1.25 1.00 0.75 Eurochem Usolskiy Start-Up 0.65 0.50 0.35 Eurochem Volgakaliy Start-Up 0.05 0.00 0.00 Supply Surplus (+) or Deficit (-) 1.50 0.20 -1.15 . Demand/shipment swing factors − How much did 2017 steal from 2018 in North America? − Will crop prices hold up? − Will China post a big gain in shipments as forecast for this year? . Supply swing factors . Are FSU producers topped out for now? . How quickly will new capacity ramp up this year? . Will Canadian producers further optimize operations? 28
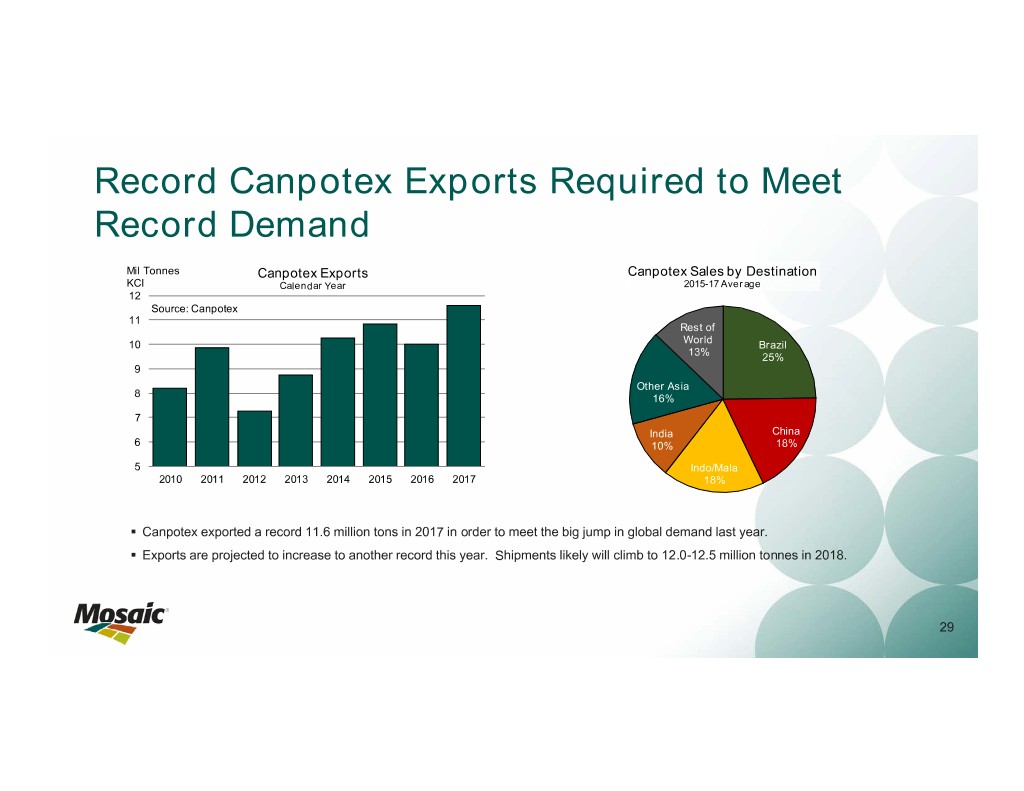
Record Canpotex Exports Required to Meet Record Demand Mil Tonnes Canpotex Exports Canpotex Sales by Destination KCl Calendar Year 2015-17 Average 12 Source: Canpotex 11 Rest of 10 World Brazil 13% 25% 9 Other Asia 8 16% 7 India China 6 10% 18% 5 Indo/Mala 2010 2011 2012 2013 2014 2015 2016 2017 18% . Canpotex exported a record 11.6 million tons in 2017 in order to meet the big jump in global demand last year. . Exports are projected to increase to another record this year. Shipments likely will climb to 12.0-12.5 million tonnes in 2018. 29
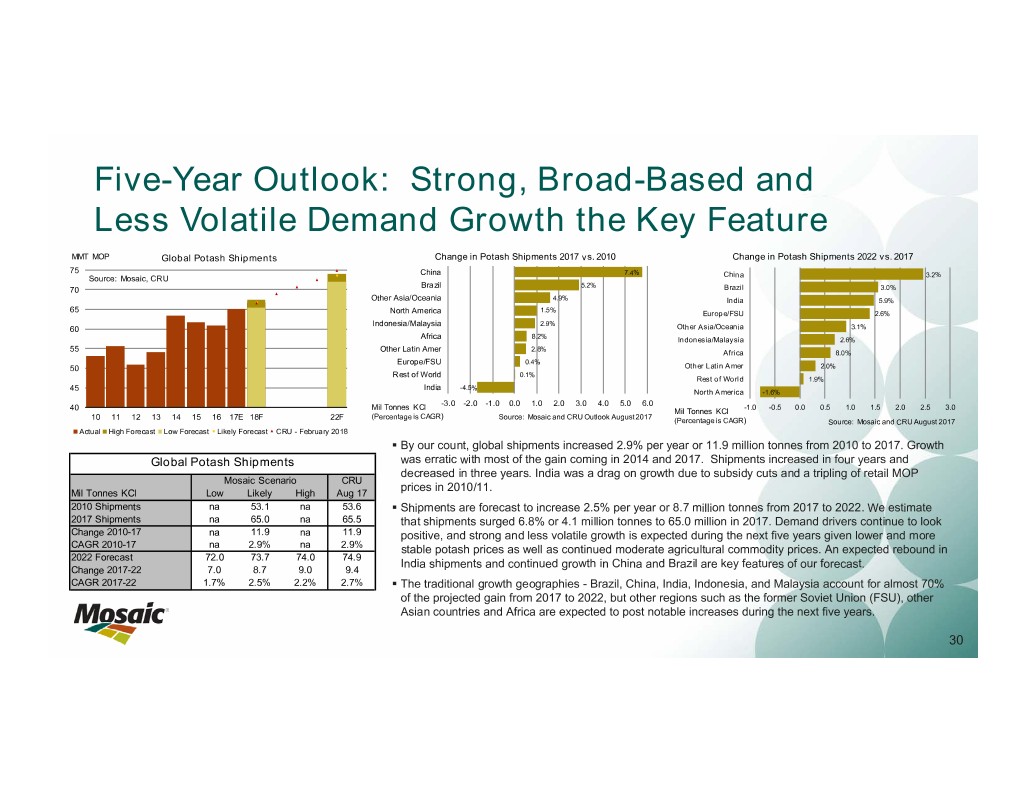
Five-Year Outlook: Strong, Broad-Based and Less Volatile Demand Growth the Key Feature MMT MOP Global Potash Shipments Change in Potash Shipments 2017 vs. 2010 Change in Potash Shipments 2022 vs. 2017 75 China 7.4% China 3.2% Source: Mosaic, CRU Brazil 5.2% 70 Brazil 3.0% Other Asia/Oceania 4.9% India 5.9% 65 1.5% North America Europe/FSU 2.6% Indonesia/Malaysia 2.9% 60 Other Asia/Oceania 3.1% 8.2% Africa Indonesia/Malaysia 2.6% 55 Other Latin Amer 2.8% Africa 8.0% Europe/FSU 0.4% 50 Other Latin Amer 2.0% Rest of World 0.1% Rest of World 1.9% 45 India -4.5% North America -1.6% -3.0 -2.0 -1.0 0.0 1.0 2.0 3.0 4.0 5.0 6.0 Mil Tonnes KCl -1.0 -0.5 0.0 0.5 1.0 1.5 2.0 2.5 3.0 40 Mil Tonnes KCl 10 11 12 13 14 15 16 17E 18F 22F (Percentage is CAGR) Source: Mosaic and CRU Outlook August 2017 (Percentage is CAGR) Source: Mosaic and CRU August 2017 Actual High Forecast Low Forecast Likely Forecast CRU - February 2018 . By our count, global shipments increased 2.9% per year or 11.9 million tonnes from 2010 to 2017. Growth Global Potash Shipments was erratic with most of the gain coming in 2014 and 2017. Shipments increased in four years and decreased in three years. India was a drag on growth due to subsidy cuts and a tripling of retail MOP Mosaic Scenario CRU prices in 2010/11. Mil Tonnes KCl Low Likely High Aug 17 2010 Shipments na 53.1 na 53.6 . Shipments are forecast to increase 2.5% per year or 8.7 million tonnes from 2017 to 2022. We estimate 2017 Shipments na 65.0 na 65.5 that shipments surged 6.8% or 4.1 million tonnes to 65.0 million in 2017. Demand drivers continue to look Change 2010-17 na 11.9 na 11.9 positive, and strong and less volatile growth is expected during the next five years given lower and more CAGR 2010-17 na 2.9% na 2.9% stable potash prices as well as continued moderate agricultural commodity prices. An expected rebound in 2022 Forecast 72.0 73.7 74.0 74.9 India shipments and continued growth in China and Brazil are key features of our forecast. Change 2017-22 7.0 8.7 9.0 9.4 CAGR 2017-22 1.7% 2.5% 2.2% 2.7% . The traditional growth geographies - Brazil, China, India, Indonesia, and Malaysia account for almost 70% of the projected gain from 2017 to 2022, but other regions such as the former Soviet Union (FSU), other Asian countries and Africa are expected to post notable increases during the next five years. 30
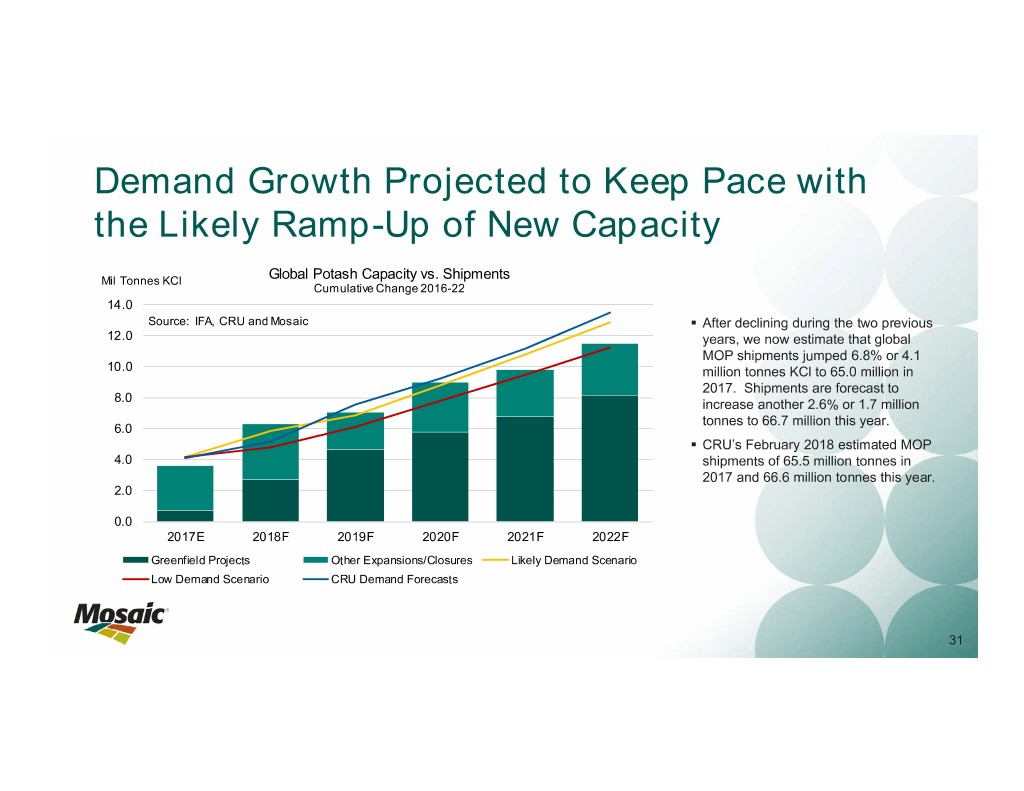
Demand Growth Projected to Keep Pace with the Likely Ramp-Up of New Capacity Mil Tonnes KCl Global Potash Capacity vs. Shipments Cumulative Change 2016-22 14.0 Source: IFA, CRU and Mosaic . After declining during the two previous 12.0 years, we now estimate that global MOP shipments jumped 6.8% or 4.1 10.0 million tonnes KCl to 65.0 million in 2017. Shipments are forecast to 8.0 increase another 2.6% or 1.7 million tonnes to 66.7 million this year. 6.0 . CRU’s February 2018 estimated MOP 4.0 shipments of 65.5 million tonnes in 2017 and 66.6 million tonnes this year. 2.0 0.0 2017E 2018F 2019F 2020F 2021F 2022F Greenfield Projects Other Expansions/Closures Likely Demand Scenario Low Demand Scenario CRU Demand Forecasts 31
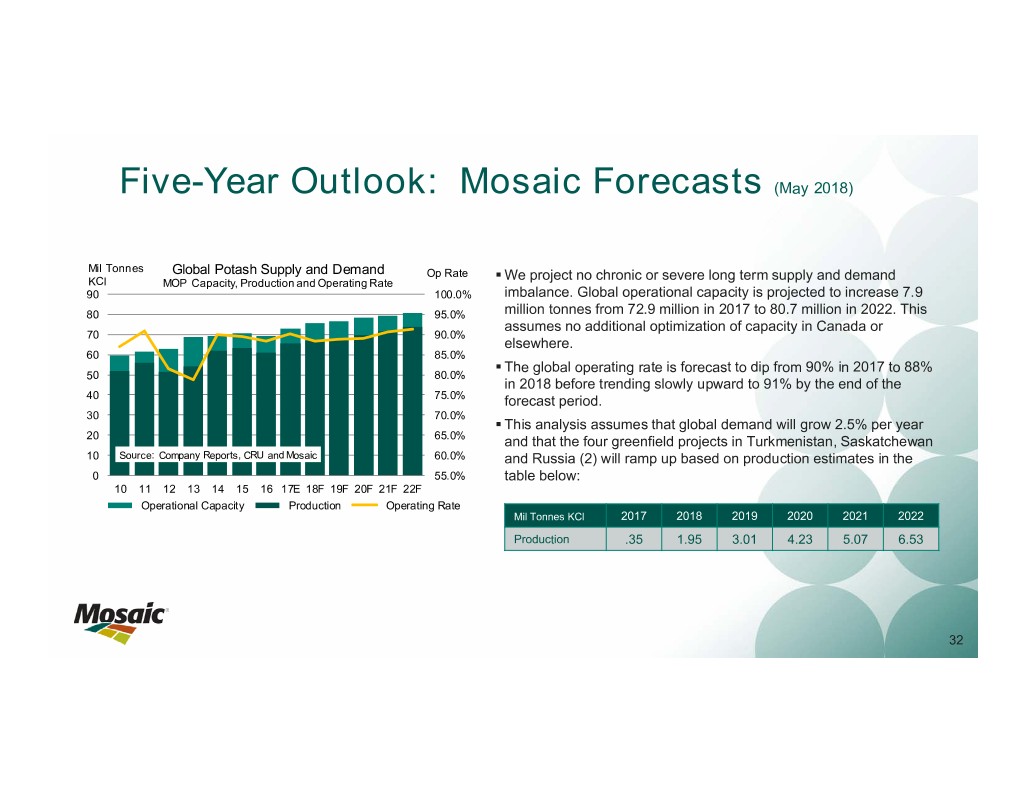
Five-Year Outlook: Mosaic Forecasts (May 2018) Mil Tonnes Global Potash Supply and Demand Op Rate . We project no chronic or severe long term supply and demand KCl MOP Capacity, Production and Operating Rate 90 100.0% imbalance. Global operational capacity is projected to increase 7.9 80 95.0% million tonnes from 72.9 million in 2017 to 80.7 million in 2022. This assumes no additional optimization of capacity in Canada or 70 90.0% elsewhere. 60 85.0% . The global operating rate is forecast to dip from 90% in 2017 to 88% 50 80.0% in 2018 before trending slowly upward to 91% by the end of the 40 75.0% forecast period. 30 70.0% . This analysis assumes that global demand will grow 2.5% per year 20 65.0% and that the four greenfield projects in Turkmenistan, Saskatchewan 10 Source: Company Reports, CRU and Mosaic 60.0% and Russia (2) will ramp up based on production estimates in the 0 55.0% table below: 10 11 12 13 14 15 16 17E 18F 19F 20F 21F 22F Operational Capacity Production Operating Rate Mil Tonnes KCl 2017 2018 2019 2020 2021 2022 Production .35 1.95 3.01 4.23 5.07 6.53 32
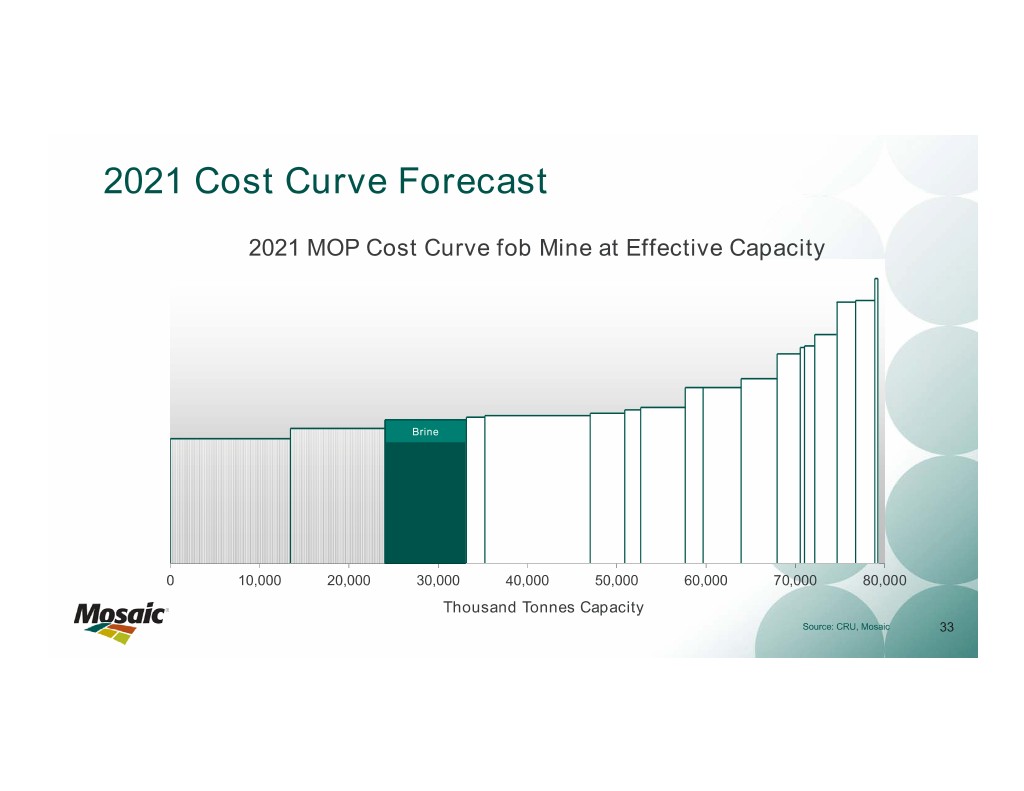
2021 Cost Curve Forecast 2021 MOP Cost Curve fob Mine at Effective Capacity Brine 0 10,000 20,000 30,000 40,000 50,000 60,000 70,000 80,000 Thousand Tonnes Capacity Source: CRU, Mosaic 33

Markets Phosphate Outlook 34
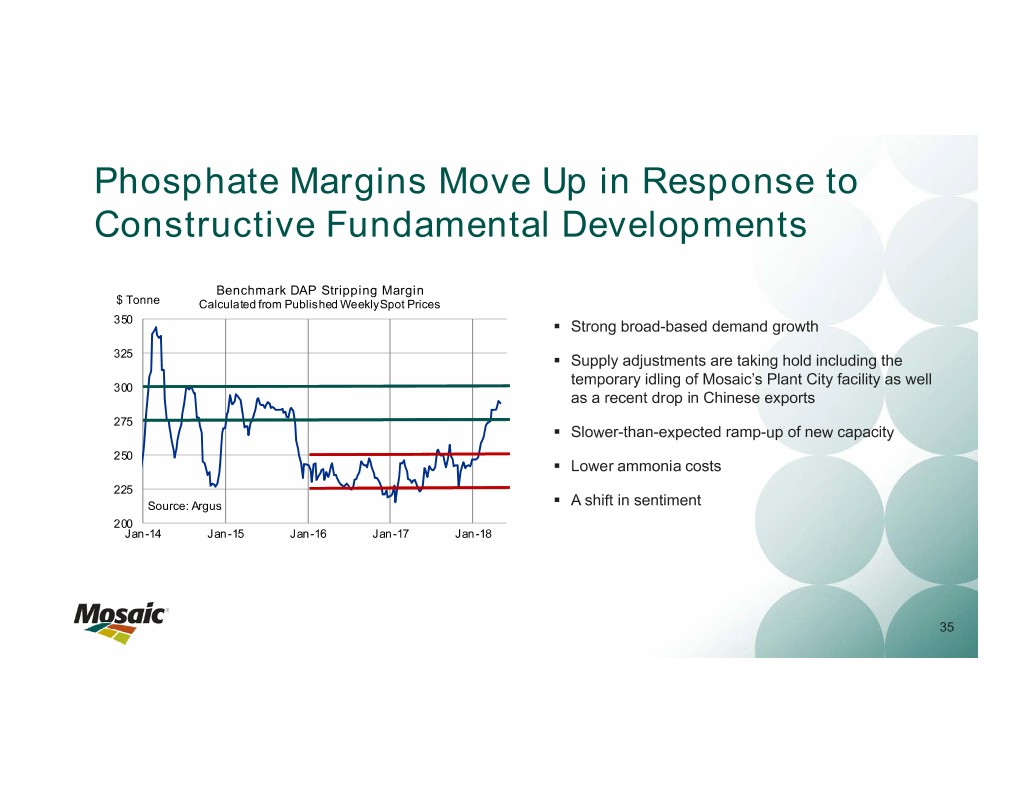
Phosphate Margins Move Up in Response to Constructive Fundamental Developments Benchmark DAP Stripping Margin $ Tonne Calculated from Published Weekly Spot Prices 350 . Strong broad-based demand growth 325 . Supply adjustments are taking hold including the temporary idling of Mosaic’s Plant City facility as well 300 as a recent drop in Chinese exports 275 . Slower-than-expected ramp-up of new capacity 250 . Lower ammonia costs 225 Source: Argus . A shift in sentiment 200 Jan-14 Jan-15 Jan-16 Jan-17 Jan-18 35
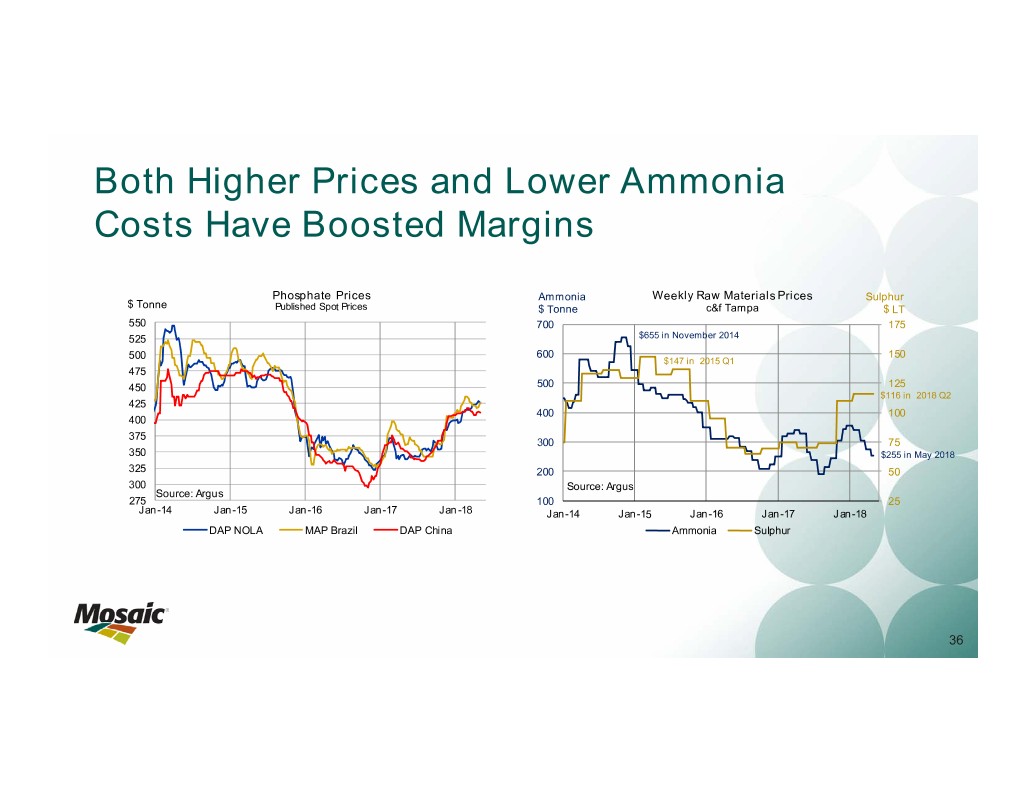
Both Higher Prices and Lower Ammonia Costs Have Boosted Margins Phosphate Prices Ammonia Weekly Raw Materials Prices Sulphur $ Tonne Published Spot Prices $ Tonne c&f Tampa $ LT 550 700 175 525 $655 in November 2014 500 600 150 $147 in 2015 Q1 475 450 500 125 $116 in 2018 Q2 425 400 100 400 375 300 75 350 $255 in May 2018 325 200 50 300 Source: Argus Source: Argus 275 100 25 Jan-14 Jan-15 Jan-16 Jan-17 Jan-18 Jan-14 Jan-15 Jan-16 Jan-17 Jan-18 DAP NOLA MAP Brazil DAP China Ammonia Sulphur 36

Pace of Demand Growth Has Picked Up MMT Product Global Phosphate Shipments DAP/MAP/NPS/TSP 72.5 Source: CRU and Mosaic 69-71 . Global shipments of the leading phosphate products increased 70.0 just 0.8% per year from 2011 to 2016. Shipments increased 2.4% 68.5 or 1.6 million tonnes to 68.5 million in 2017 and are forecast to 67.5 increase 1.8% or 1.2 million tonnes to 69.8 million in 2018. . The pace of demand growth has picked up for several reasons. 65.0 China and India no longer are a drag on demand. Chinese shipments have stabilized, and Indian shipments are back on a 62.5 growth trajectory following cuts to the subsidy that more than doubled retail prices in 2010/11 and cratered demand. 60.0 . Demand elsewhere is strong as a result of the agronomic need to replace record amounts of phosphate removed by record harvests 57.5 during the last five years as well as continued affordability due to stable crop prices and more moderate NPK costs. 55.0 10 11 12 13 14 15 16 17E 18F 37

Strong Broad-Based Demand Growth Mil China DAP/MAP/NPS/TSP Shipments Mil India DAP/MAP/NPS/TSP Shipments Tonnes Chinese shipments peaked at Tonnes Indian shipments collapsed 24.0 12.0 Source: CRU and Mosaic following subsidy cuts in 2010/11 more than 22 million tonnes in Source: CRU and Mosaic 21.0 11.0 that resulted in a doubling of 18.0 2014. Growth was driven by high 10.0 retail prices. Shipments are 15.0 support prices for leading crops 12.0 such as corn and a build-up of 9.0 growing again due to high crop 9.0 procurement prices, moderate strategic reserves. Shipments are 8.0 6.0 expected to stabilize in the 18 phosphate prices, a workable 3.0 7.0 million tonne range in the new subsidy, and average or better 0.0 6.0 10 11 12 13 14 15 16 17E 18F policy environment. 10 11 12 13 14 15 16 17E 18F monsoons. DAP MAP NPS TSP DAP MAP TSP Mil Brazil DAP/MAP/NPS/TSP Shipments Mil Latin America less Brazil Shipments in the rest of Latin Tonnes Tonnes DAP/MAP/NPS/TSP Shipments 9.0 4.0 Source: CRU, ANDA and Mosaic Phosphate demand in Brazil Source: CRU and Mosaic America dropped last year after 8.0 3.5 7.0 continues its strong upward trend the surge in 2016 that was driven 6.0 driven mainly by steady increases 3.0 largely by gains in Argentina 5.0 in soybean production. The 2.5 following the elimination or 4.0 3.0 growth in NPS shipments – 2.0 reduction of grain export taxes. 2.0 mostly Mosaic’s MicroEssentials – 1.5 Shipments are projected to 1.0 is noteworthy. increase in 2018 due to generally 0.0 1.0 10 11 12 13 14 15 16 17E 18F 10 11 12 13 14 15 16 17E 18F profitable farm economics DAP MAP NPS TSP DAP MAP NPS TSP throughout most of the region. Mil Asia/Oceania less China and India Mil Africa+FSU DAP/MAP/NPS/TSP Shipments Tonnes DAP/MAP/NPS/TSP Shipments Tonnes African demand is taking off (and 10.0 Shipments in the rest of Asia have 5.0 Source: CRU and Mosaic Source: CRU and Mosaic these statistics exclude NPKs) 9.0 increased significantly since 2013. 4.5 4.0 due to good public-private sector 8.0 The biggest gains were in 3.5 programs to boost productivity. In 7.0 Pakistan, Vietnam and Indonesia, 3.0 addition, the pace of recovery in 6.0 but most countries registered 2.5 the former Soviet Union is picking 5.0 increases during this period. 2.0 1.5 4.0 up in response to moderate crop Profitable farm economics 1.0 3.0 prices, weak currencies and a run 10 11 12 13 14 15 16 17E 18F underpin solid demand growth. 0.5 DAP MAP NPS TSP 10 11 12 13 14 15 16 17E 18F of generally good harvests. DAP MAP NPS TSP 38
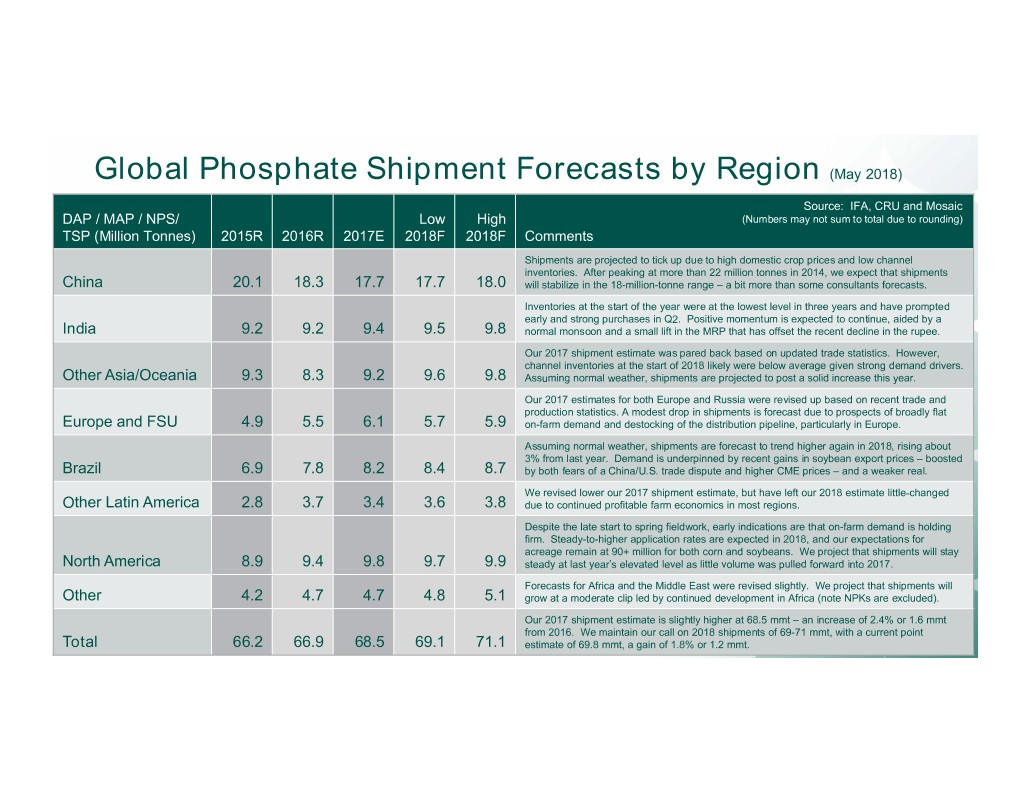
Global Phosphate Shipment Forecasts by Region (May 2018) Source: IFA, CRU and Mosaic DAP / MAP / NPS/ Low High (Numbers may notSource: sum to CRUtotal due and to Mosaic. rounding) TSP (Million Tonnes) 2015R 2016R 2017E 2018F 2018F Comments Numbers may not sum to total due to rounding. Shipments are projected to tick up due to high domestic crop prices and low channel inventories. After peaking at more than 22 million tonnes in 2014, we expect that shipments China 20.1 18.3 17.7 17.7 18.0 will stabilize in the 18-million-tonne range – a bit more than some consultants forecasts. Inventories at the start of the year were at the lowest level in three years and have prompted early and strong purchases in Q2. Positive momentum is expected to continue, aided by a India 9.2 9.2 9.4 9.5 9.8 normal monsoon and a small lift in the MRP that has offset the recent decline in the rupee. Our 2017 shipment estimate was pared back based on updated trade statistics. However, channel inventories at the start of 2018 likely were below average given strong demand drivers. Other Asia/Oceania 9.3 8.3 9.2 9.6 9.8 Assuming normal weather, shipments are projected to post a solid increase this year. Our 2017 estimates for both Europe and Russia were revised up based on recent trade and production statistics. A modest drop in shipments is forecast due to prospects of broadly flat Europe and FSU 4.9 5.5 6.1 5.7 5.9 on-farm demand and destocking of the distribution pipeline, particularly in Europe. Assuming normal weather, shipments are forecast to trend higher again in 2018, rising about 3% from last year. Demand is underpinned by recent gains in soybean export prices – boosted Brazil 6.9 7.8 8.2 8.4 8.7 by both fears of a China/U.S. trade dispute and higher CME prices – and a weaker real. We revised lower our 2017 shipment estimate, but have left our 2018 estimate little-changed Other Latin America 2.8 3.7 3.4 3.6 3.8 due to continued profitable farm economics in most regions. Despite the late start to spring fieldwork, early indications are that on-farm demand is holding firm. Steady-to-higher application rates are expected in 2018, and our expectations for acreage remain at 90+ million for both corn and soybeans. We project that shipments will stay North America 8.9 9.4 9.8 9.7 9.9 steady at last year’s elevated level as little volume was pulled forward into 2017. Forecasts for Africa and the Middle East were revised slightly. We project that shipments will Other 4.2 4.7 4.7 4.8 5.1 grow at a moderate clip led by continued development in Africa (note NPKs are excluded). Our 2017 shipment estimate is slightly higher at 68.5 mmt – an increase of 2.4% or 1.6 mmt from 2016. We maintain our call on 2018 shipments of 69-71 mmt, with a current point Total* NPS products included in this analysis are those 66.2 with a combined 66.9 N and P2O5 nutrient 68.5 content of 45 69.1 units or greater. 71.1 estimate of 69.8 mmt, a gain of 1.8% or 1.2 mmt.

Supply Adjustments are Taking Hold . Mosaic’s idling of its Plant City facility in December 2017 impacts both fundamentals and sentiment. . Later start-up and slower ramp-up of new capacity with commissioning of OCP JPH 4 now delayed until late Q2 2018, but still a significant but needed increase in Moroccan and Saudi exports this year. . Chinese phosphate exports during the last six months (17Q4 - 18Q1) declined 24% or 1.2 million tonnes from the same period a year earlier. The decline is the result of both a strong domestic pull as well as more stringent environmental regulations. Mil Tonnes Mil Tonnes China Phosphate Exports Mil Tonnes China Phosphate Exports Phosphate Exports DA P/MA P/TSP DA P/MA P/TSP DA P/MA P/TSP 12 4.0 12 Source: China Customs Source: China Customs Source: CRU 10 3.5 10 3.0 8 8 2.5 6 6 2.0 1.5 4 4 1.0 2 2 0.5 0 6.1 6.7 5.4 5.3 8.1 11.6 9.5 10.1 0 0.0 10 11 12 13 14 15 16 17 18 10 11 12 13 14 15 16 17 Q1 Q2 Q3 Q4 Morocco Saudi Arabia 2015=11.6 mmt 2016=9.5 mmt 2017=10.1 mmt 2018 40
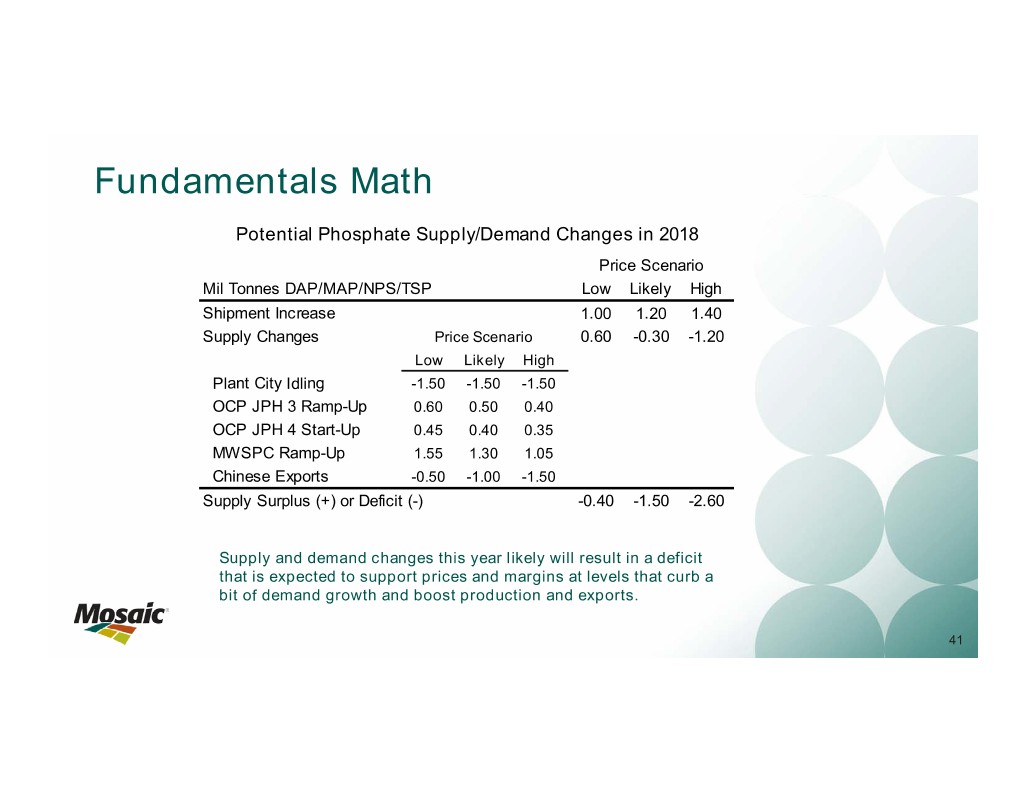
Fundamentals Math Potential Phosphate Supply/Demand Changes in 2018 Price Scenario Mil Tonnes DAP/MAP/NPS/TSP Low Likely High Shipment Increase 1.00 1.20 1.40 Supply Changes Price Scenario 0.60 -0.30 -1.20 Low Likely High Plant City Idling -1.50 -1.50 -1.50 OCP JPH 3 Ramp-Up 0.60 0.50 0.40 OCP JPH 4 Start-Up 0.45 0.40 0.35 MWSPC Ramp-Up 1.55 1.30 1.05 Chinese Exports -0.50 -1.00 -1.50 Supply Surplus (+) or Deficit (-) -0.40 -1.50 -2.60 Supply and demand changes this year likely will result in a deficit that is expected to support prices and margins at levels that curb a bit of demand growth and boost production and exports. 41

Five-Year Outlook: Positive Demand Outlook Global Phosphate Shipments Change in Phosphate Shipments 2017 vs. 2010 Change in Phosphate Shipments 2022F vs. 2017 MMT DA P/MA P/NPS/TSP 80 Source: Mosaic and CRU Phosphate Outlook April 2018 Brazil 6.7% India 4.0% 75 Other Asia + Oceania 4.5% Africa 9.1% North America 2.8% Other Asia + Oceania 2.8% 70 Europe/FSU 3.5% Brazil 3.1% Africa 7.5% Other Latin Am 4.3% 65 Other Latin Am 2.3% China 0.4% Mideast/Other -1.2% Mideast/Other 2.0% 60 China -0.2% Europe/FSU 0.3% India -3.0% North America -1.0% 55 10 11 12 13 14 15 16 17E 18F 22F MMT DAP/MAP/TSP -3.0 -2.0 -1.0 0.0 1.0 2.0 3.0 -1.0 0.0 1.0 2.0 3.0 (Percentage is CAGR) MMT DA P/MA P/ NPS /TS P Actual Range Low Forecast Likely Forecast CRU - April 2018 Source: Mosaic and CRU Phosphate Outlook April 2018(Percentage is CAGR) Source: Mosaic and CRU Phosphate Outlook April 2018 Global Phosphate Shipments . Global shipments increased 1.6% per year or 7.4 million tonnes from 2010 to 2017. India was a heavy drag on demand with shipments dropping 2.2 million tonnes during this period due to subsidy cuts that Mosaic Scenario CRU Mil Tonnes DAP/MAP/NPS/TSP Low Likely High Apr 2017 resulted in a doubling of retail phosphate prices. Demand declined slightly in China with shipments 2010 Shipments 61.1 61.0 increasing significantly during the first half of this period but then declining during the second half. 2017 Shipments 68.5 71.5 . Shipments are forecast to increase 2.0% per year or 7.2 million tonnes from 2017 to 2022. Prospects Change 2010-17 7.4 10.5 CAGR 2010-17 1.6% 2.3% for lower and more stable raw materials costs are expected to help keep phosphate prices at moderate 2022 Forecast 74.5 75.7 77.0 76.5 levels and fuel steady gains. Indian demand also is expected to recover due to high domestic crop Change 2017-22 6.0 7.2 8.5 5.0 prices, a workable subsidy, and a relatively stable rupee. Africa, other Asia/Oceania, and Brazil are CAGR 2017-22 1.7% 2.0% 2.4% 1.4% projected to post strong gains during this period. Source: Mosaic and CRU Phosphate Outlook April 2018 . CRU projects that demand will grow at a much slower rate of 1.4% from 2017 to 2022, but that mostly is the result of their much higher baseline demand estimate for 2017. 42
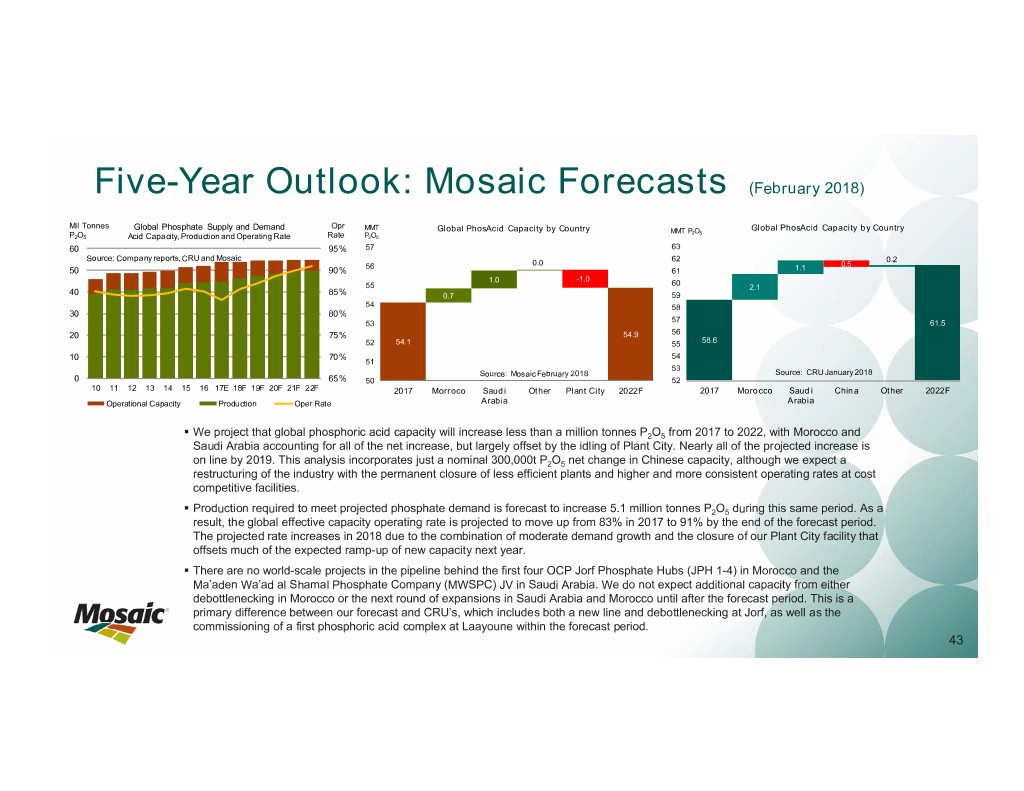
Five-Year Outlook: Mosaic Forecasts (February 2018) Mil Tonnes Global Phosphate Supply and Demand Opr MMT Global PhosAcid Capacity by Country Global PhosAcid Capacity by Country MMT P2O5 P2O5 Acid Capacity, Production and Operating Rate Rate P2O5 60 95% 57 63 Source: Company reports, CRU and Mosaic 62 0.2 56 0.0 0.5 50 90% 61 1.1 -1.0 1.0 60 55 2.1 40 85% 0.7 59 54 58 30 80% 57 53 61.5 20 75% 54.9 56 52 54.1 55 58.6 10 70% 54 51 53 Source: Mosaic February 2018 Source: CRU January 2018 0 65% 50 52 10 11 12 13 14 15 16 17E 18F 19F 20F 21F 22F 2017 Morroco Saudi Other Plant City 2022F 2017 Morocco Saudi China Other 2022F Operational Capacity Production Oper Rate Arabia Arabia . We project that global phosphoric acid capacity will increase less than a million tonnes P2O5 from 2017 to 2022, with Morocco and Saudi Arabia accounting for all of the net increase, but largely offset by the idling of Plant City. Nearly all of the projected increase is on line by 2019. This analysis incorporates just a nominal 300,000t P2O5 net change in Chinese capacity, although we expect a restructuring of the industry with the permanent closure of less efficient plants and higher and more consistent operating rates at cost competitive facilities. . Production required to meet projected phosphate demand is forecast to increase 5.1 million tonnes P2O5 during this same period. As a result, the global effective capacity operating rate is projected to move up from 83% in 2017 to 91% by the end of the forecast period. The projected rate increases in 2018 due to the combination of moderate demand growth and the closure of our Plant City facility that offsets much of the expected ramp-up of new capacity next year. . There are no world-scale projects in the pipeline behind the first four OCP Jorf Phosphate Hubs (JPH 1-4) in Morocco and the Ma’aden Wa’ad al Shamal Phosphate Company (MWSPC) JV in Saudi Arabia. We do not expect additional capacity from either debottlenecking in Morocco or the next round of expansions in Saudi Arabia and Morocco until after the forecast period. This is a primary difference between our forecast and CRU’s, which includes both a new line and debottlenecking at Jorf, as well as the commissioning of a first phosphoric acid complex at Laayoune within the forecast period. 43
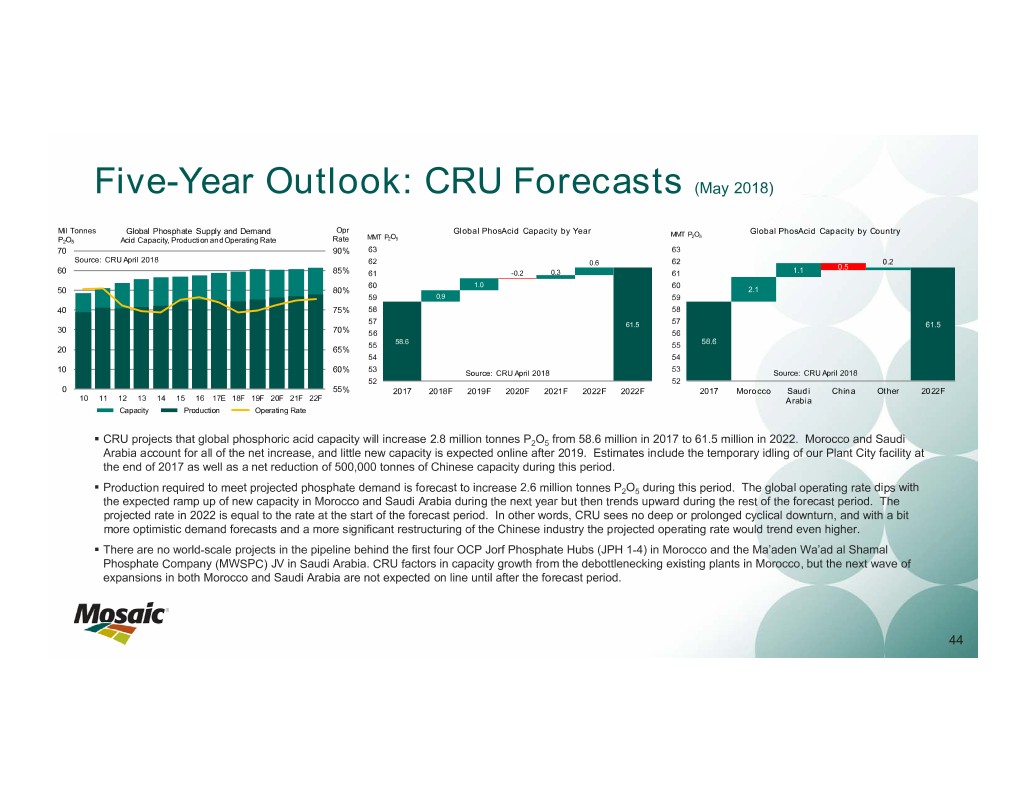
Five-Year Outlook: CRU Forecasts (May 2018) Mil Tonnes Global Phosphate Supply and Demand Opr Global PhosAcid Capacity by Year Global PhosAcid Capacity by Country MMT P2O5 MMT P2O5 P2O5 Acid Capacity, Production and Operating Rate Rate 70 90% 63 63 Source: CRU April 2018 62 0.6 62 0.2 0.5 60 85% 61 -0.2 0.3 61 1.1 60 1.0 60 50 80% 2.1 59 0.9 59 40 75% 58 58 57 61.5 57 61.5 30 70% 56 56 58.6 58.6 55 55 20 65% 54 54 53 53 10 60% Source: CRU April 2018 Source: CRU April 2018 52 52 0 55% 2017 2018F 2019F 2020F 2021F 2022F 2022F 2017 Morocco Saudi China Other 2022F 10 11 12 13 14 15 16 17E 18F 19F 20F 21F 22F Arabia Capacity Production Operating Rate . CRU projects that global phosphoric acid capacity will increase 2.8 million tonnes P2O5 from 58.6 million in 2017 to 61.5 million in 2022. Morocco and Saudi Arabia account for all of the net increase, and little new capacity is expected online after 2019. Estimates include the temporary idling of our Plant City facility at the end of 2017 as well as a net reduction of 500,000 tonnes of Chinese capacity during this period. . Production required to meet projected phosphate demand is forecast to increase 2.6 million tonnes P2O5 during this period. The global operating rate dips with the expected ramp up of new capacity in Morocco and Saudi Arabia during the next year but then trends upward during the rest of the forecast period. The projected rate in 2022 is equal to the rate at the start of the forecast period. In other words, CRU sees no deep or prolonged cyclical downturn, and with a bit more optimistic demand forecasts and a more significant restructuring of the Chinese industry the projected operating rate would trend even higher. . There are no world-scale projects in the pipeline behind the first four OCP Jorf Phosphate Hubs (JPH 1-4) in Morocco and the Ma’aden Wa’ad al Shamal Phosphate Company (MWSPC) JV in Saudi Arabia. CRU factors in capacity growth from the debottlenecking existing plants in Morocco, but the next wave of expansions in both Morocco and Saudi Arabia are not expected on line until after the forecast period. 44
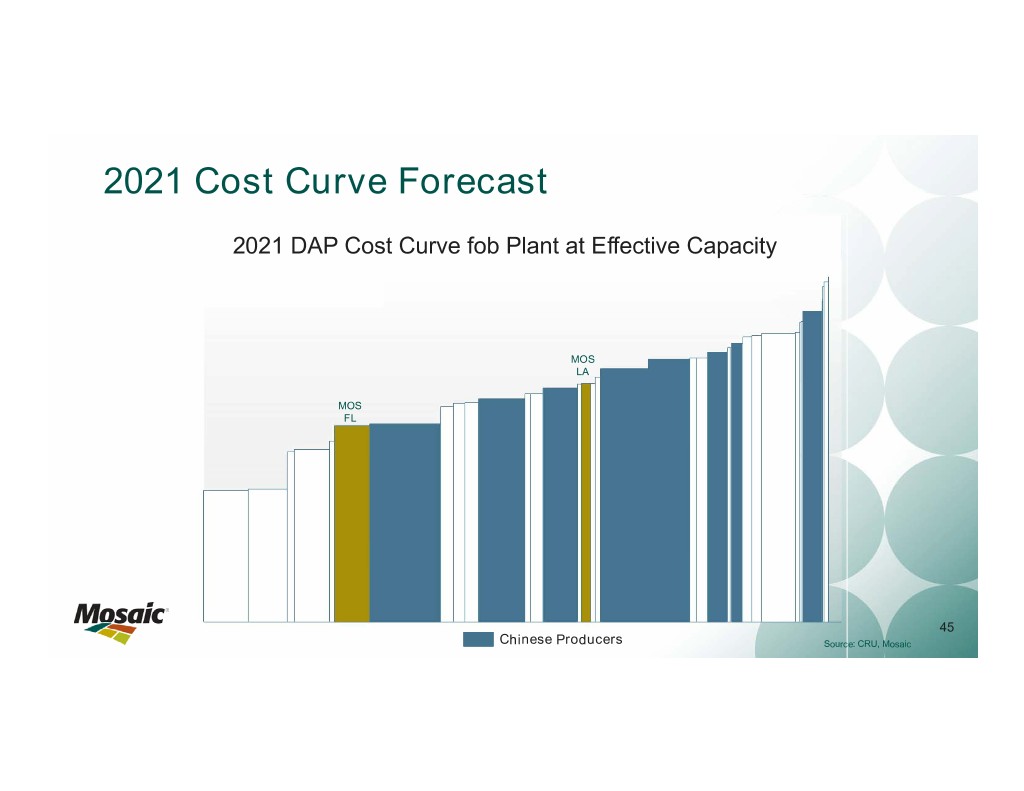
2021 Cost Curve Forecast 2021 DAP Cost Curve fob Plant at Effective Capacity MOS LA MOS FL 45 Chinese Producers Source: CRU, Mosaic


