
The Mosaic Company Earnings Conference Call – Second Quarter 2018 Joc O’Rourke, President and Chief Executive Officer Presenters: Laura Gagnon, Vice President Investor Relations Date: August 7, 2018

Forward Looking Statements This presentation contains forward-looking statements within the meaning of the Private Securities Litigation Reform Act of 1995. Such statements include, but are not limited to, statements about the anticipated benefits and synergies of our acquisition of the global phosphate and potash operations of Vale S.A. previously conducted through Vale Fertilizantes S.A. (which, when combined with our legacy distribution business in Brazil, is now known as Mosaic Fertilizantes) (the “Transaction”), other proposed or pending future transactions or strategic plans and other statements about future financial and operating results. Such statements are based upon the current beliefs and expectations of The Mosaic Company’s management and are subject to significant risks and uncertainties. These risks and uncertainties include, but are not limited to: difficulties with realization of the benefits and synergies of the Transaction, including the risks that the acquired business may not be integrated successfully or that the anticipated synergies or cost or capital expenditure savings from the Transaction may not be fully realized or may take longer to realize than expected, including because of political and economic instability in Brazil or changes in government policy in Brazil such as higher costs associated with the new freight tables; the predictability and volatility of, and customer expectations about, agriculture, fertilizer, raw material, energy and transportation markets that are subject to competitive and other pressures and economic and credit market conditions; the level of inventories in the distribution channels for crop nutrients; the effect of future product innovations or development of new technologies on demand for our products; changes in foreign currency and exchange rates; international trade risks and other risks associated with Mosaic’s international operations and those of joint ventures in which Mosaic participates, including the performance of the Wa’ad Al Shamal Phosphate Company (also known as MWSPC), the ability of MWSPC to obtain additional planned funding in acceptable amounts and upon acceptable terms, the timely development and commencement of operations of production facilities in the Kingdom of Saudi Arabia, and the future success of current plansforMWSPC and any future changes in those plans; the risk that protests against natural resource companies in Peru extend to or impact the Miski Mayo mine, which is operated by an entity in which we are the majority owner; difficulties with realization of the benefits of our long term natural gas based pricing ammonia supply agreement with CF Industries, Inc., including the risk that the cost savings initially anticipated from the agreement may not be fully realized over its term or that the price of natural gas or ammonia during the term are at levels at which the pricing is disadvantageous to Mosaic; customer defaults; the effects of Mosaic’s decisions to exit business operations or locations; changes in government policy; changes in environmental and other governmental regulation, including expansion of the types and extent of water resources regulated under federal law, carbon taxes or other greenhouse gas regulation, implementation of numeric water quality standards for the discharge of nutrients into Florida waterways or efforts to reduce the flow of excess nutrients into the Mississippi River basin, the Gulf of Mexico or elsewhere; further developments in judicial or administrative proceedings, or complaints that Mosaic’s operations are adversely impacting nearby farms, business operations or properties; difficulties or delays in receiving, increased costs of or challenges to necessary governmental permits or approvals or increased financial assurance requirements; resolution of global tax audit activity; the effectiveness of Mosaic’s processes for managing its strategic priorities; adverse weather conditions affecting operations in Central Florida, the Mississippi River basin, the Gulf Coast of the United States, Canada or Brazil, and including potential hurricanes, excess heat, cold, snow, rainfall or drought; actual costs of various items differing from management’s current estimates, including, among others, asset retirement, environmental remediation, reclamation or other environmental regulation, Canadian resources taxes and royalties, or the costs of the MWSPC, its existing or future funding and Mosaic’s commitments in support of such funding; reduction of Mosaic’s available cash and liquidity, and increased leverage, due to its use of cash and/or available debt capacity to fund financial assurance requirements and strategic investments; brine inflows at Mosaic’s Esterhazy, Saskatchewan, potash mine or other potash shaft mines; other accidents and disruptions involving Mosaic’s operations, including potential mine fires, floods, explosions, seismic events, sinkholes or releases of hazardous or volatile chemicals; and risks associated with cyber security, including reputational loss; as well as other risks and uncertainties reported from time to time in The Mosaic Company’s reports filed with the Securities and Exchange Commission. Actual results may differ from those set forth in the forward-looking statements. 2
Non-GAAP Financial Measures This presentation includes certain non-GAAP financial measures, including EBITDA, adjusted EBITDA, adjusted gross margins, adjusted earnings per share. For important information regarding the non-GAAP measures we present, see “Non-GAAP Financial Measures” in our August 6, 2018 earnings release and the performance data for the second quarter of 2018 that is available on our website at www.mosaicco.com in the “Financial Information – Quarterly Earnings” section under the “Investors” tab. The earnings release and performance data are also furnished as exhibits to our Current Report on Form 8-K dated August 6, 2018. We are not providing forward looking guidance for U.S. GAAP reported diluted net earnings per share or a quantitative reconciliation of forward-looking non-GAAP EPS, adjusted Gross Margins and adjusted EBITDA. Please see “Non-GAAP Financial Measures” in our August 6, 2018 earnings release for additional information. 3

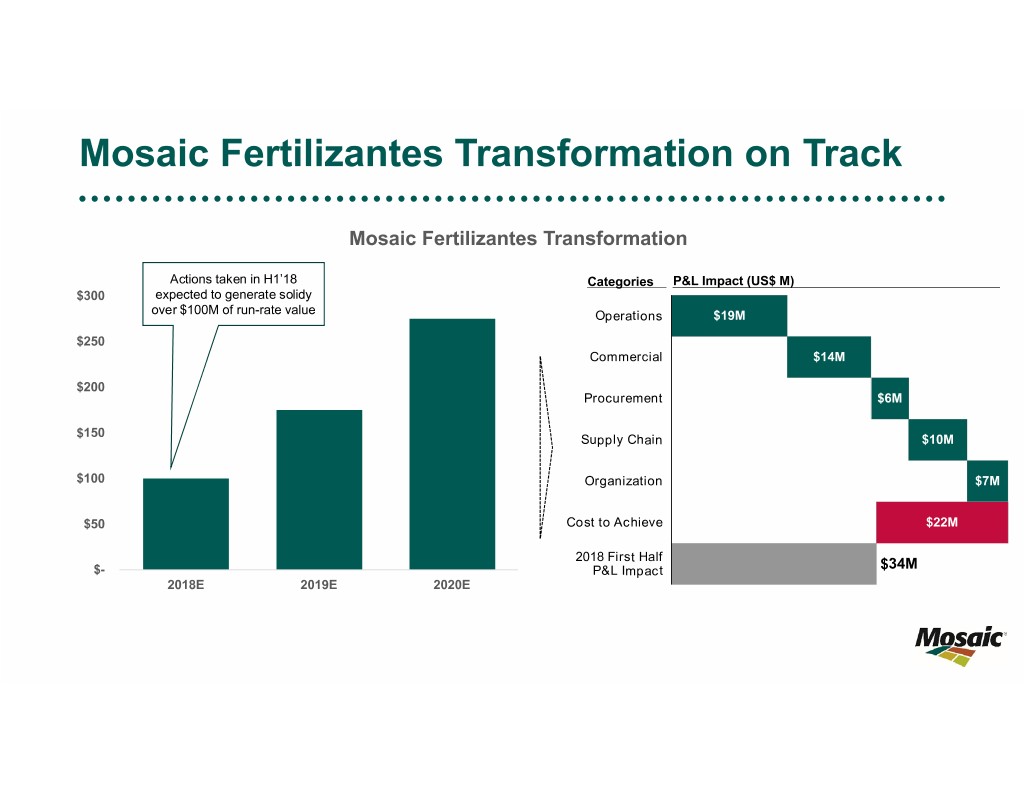
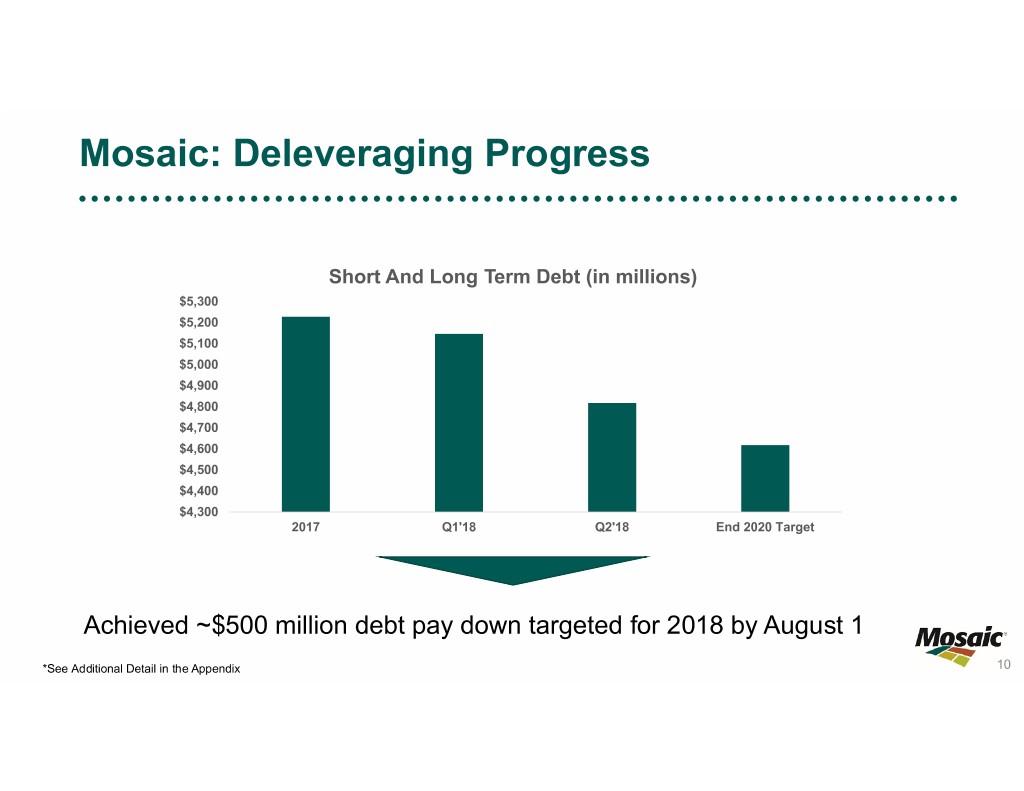
Executive Summary Raising full year guidance: adjusted EBITDA(1) to $1.80 - 1.95 billion; adjusted EPS(1) to $1.45 - $1.80 ▪ Second quarter adjusted EBITDA(1) of $461 million and first half 2018 of $833 million Strong Cash ▪ Second quarter adjusted EPS(1) of $0.40 and first half 2018 of $0.60 Flow and Earnings ▪ Year to date cash flow from operations above $700 million • Paid down ~$500 million in debt as of 8/1/2018, well ahead of communicated $700 million pay-down target by end of 2020 ▪ Solid execution across three business units: Constructive • Cash costs of mined Florida rock down at $36 per tonne Outlook and • MOP cash costs of production flat at $85 per tonne Solid Execution ▪ Expect market momentum to continue through 2018 ▪ Remarkable progress on Mosaic Fertilizantes transformation: Transformation • Actions taken in H1’2018 alone expected to deliver well over $100 million in run-rate EBITDA contribution progress • $56 million of year-to-date realized gross synergies, $34 million net of costs to achieve (1) See Non-GAAP Financial Measures for additional information 4
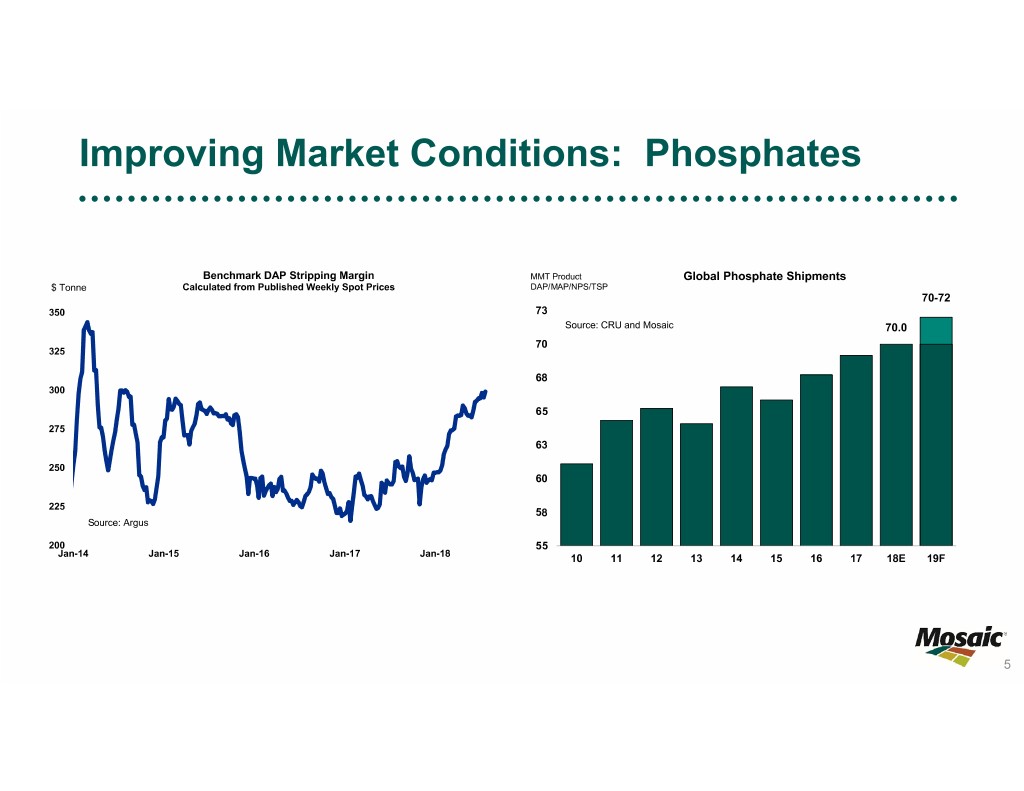
Improving Market Conditions: Phosphates Benchmark DAP Stripping Margin MMT Product Global Phosphate Shipments $ Tonne Calculated from Published Weekly Spot Prices DAP/MAP/NPS/TSP 70-72 350 73 Source: CRU and Mosaic 70.0 70 325 68 300 65 275 63 250 60 225 58 Source: Argus 200 55 Jan-14 Jan-15 Jan-16 Jan-17 Jan-18 10 11 12 13 14 15 16 17 18E 19F 5
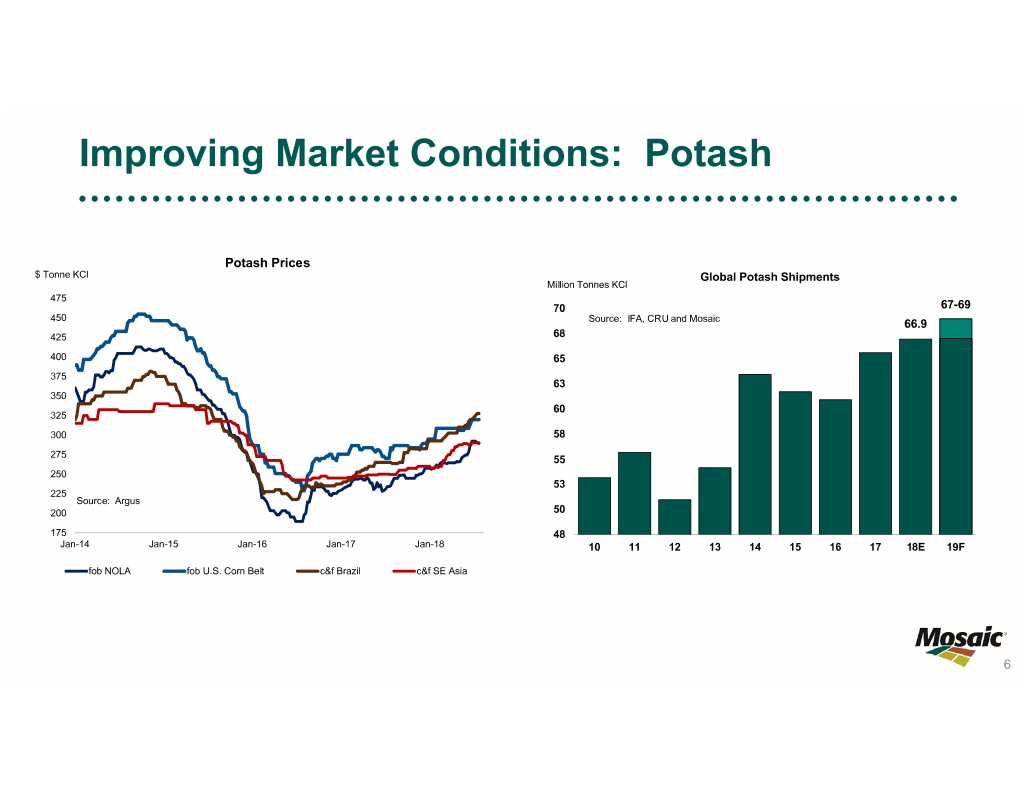
Improving Market Conditions: Potash Potash Prices $ Tonne KCl Global Potash Shipments Million Tonnes KCl 475 70 67-69 450 Source: IFA, CRU and Mosaic 66.9 425 68 400 65 375 63 350 60 325 300 58 275 55 250 53 225 Source: Argus 200 50 175 48 Jan-14 Jan-15 Jan-16 Jan-17 Jan-18 10 11 12 13 14 15 16 17 18E 19F fob NOLA fob U.S. Corn Belt c&f Brazil c&f SE Asia 6
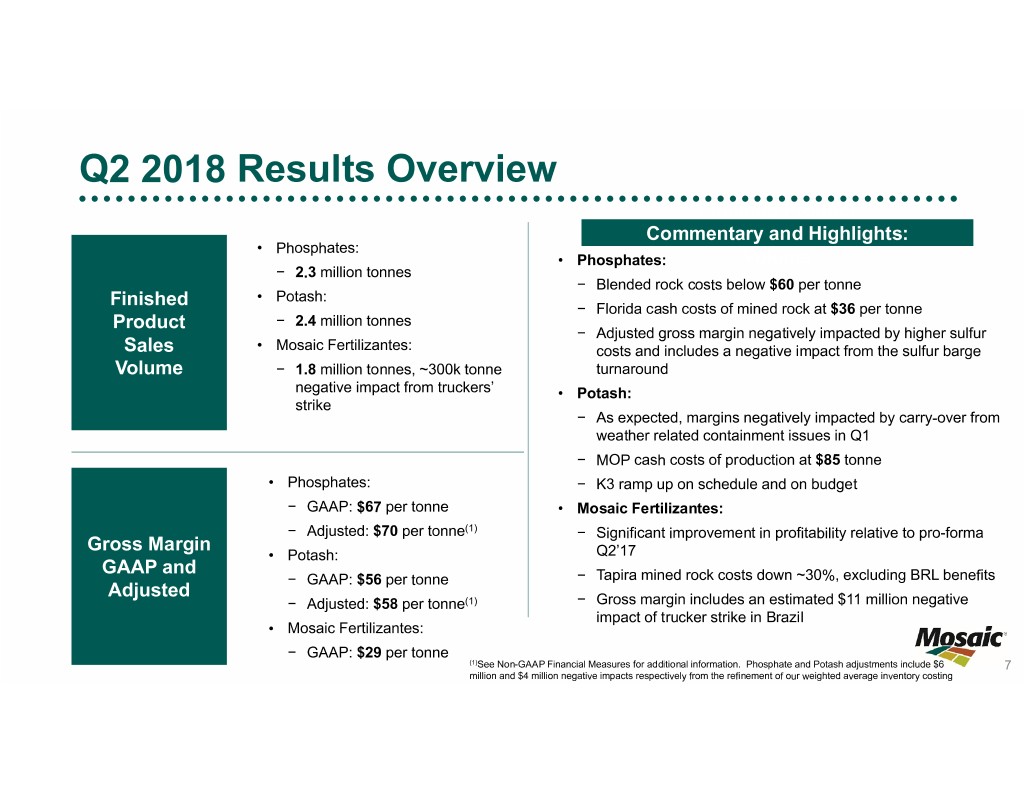
Q2 2018 Results Overview Finished Product Commentary and Highlights: • Phosphates: • Phosphates: Volume − 2.3 million tonnes − Blended rock costs below $60 per tonne Finished • Potash: − Florida cash costs of mined rock at $36 per tonne Product − 2.4 million tonnes − Adjusted gross margin negatively impacted by higher sulfur Sales • Mosaic Fertilizantes: costs and includes a negative impact from the sulfur barge Volume − 1.8 million tonnes, ~300k tonne turnaround negative impact from truckers’ • Potash: strike − As expected, margins negatively impacted by carry-over from weather related containment issues in Q1 − MOP cash costs of production at $85 tonne • Phosphates: − K3 ramp up on schedule and on budget − GAAP: $67 per tonne • Mosaic Fertilizantes: − Adjusted: $70 per tonne(1) − Significant improvement in profitability relative to pro-forma Gross Margin • Potash: Q2’17 GAAP and − GAAP: $56 per tonne − Tapira mined rock costs down ~30%, excluding BRL benefits Adjusted − Adjusted: $58 per tonne(1) − Gross margin includes an estimated $11 million negative impact of trucker strike in Brazil • Mosaic Fertilizantes: − GAAP: $29 per tonne (1)See Non-GAAP Financial Measures for additional information. Phosphate and Potash adjustments include $6 7 million and $4 million negative impacts respectively from the refinement of our weighted average inventory costing
Mosaic Fertilizantes Transformation on Track Mosaic Fertilizantes Transformation Actions taken in H1’18 Categories P&L Impact (US$ M) $300 expected to generate solidy over $100M of run-rate value Operations $19M $250 Commercial $14M $200 Procurement $6M $150 Supply Chain $10M $100 Organization $7M $50 Cost to Achieve $22M 2018 First Half $- P&L Impact $34M 2018E 2019E 2020E
Mosaic Fertilizantes: Well Positioned Brazil Plant Nutrient Use 2015-17 Average Nitrogen Million Tonnes Soybean Production 28% Potash 130 39% 120 110 100 90 P&K 80 accounts for Phosphate 70 Source: ANDA 33% ~2/3rds of all 60 Brazil 50 U.S. Plant Nutrient Use 40 2014/15-16/17 Average Nutrient Use 30 00 01 02 03 04 05 06 07 08 09 10 11 12 13 14 15 16 17 18E Potash Crop Year Beginning in 23% Source: USDA USA Brazil Brazil expected to overtake US in soybean Nitrogen production in 2018/19 crop year 57% Phosphate 20% 9 Source: TFI/AAFPCO
Mosaic: Deleveraging Progress Short And Long Term Debt (in millions) $5,300 $5,200 $5,100 $5,000 $4,900 $4,800 $4,700 $4,600 $4,500 $4,400 $4,300 2017 Q1'18 Q2'18 End 2020 Target Achieved ~$500 million debt pay down targeted for 2018 by August 1 *See Additional Detail in the Appendix 10
Capital Allocation Philosophy 11

Appendix 12
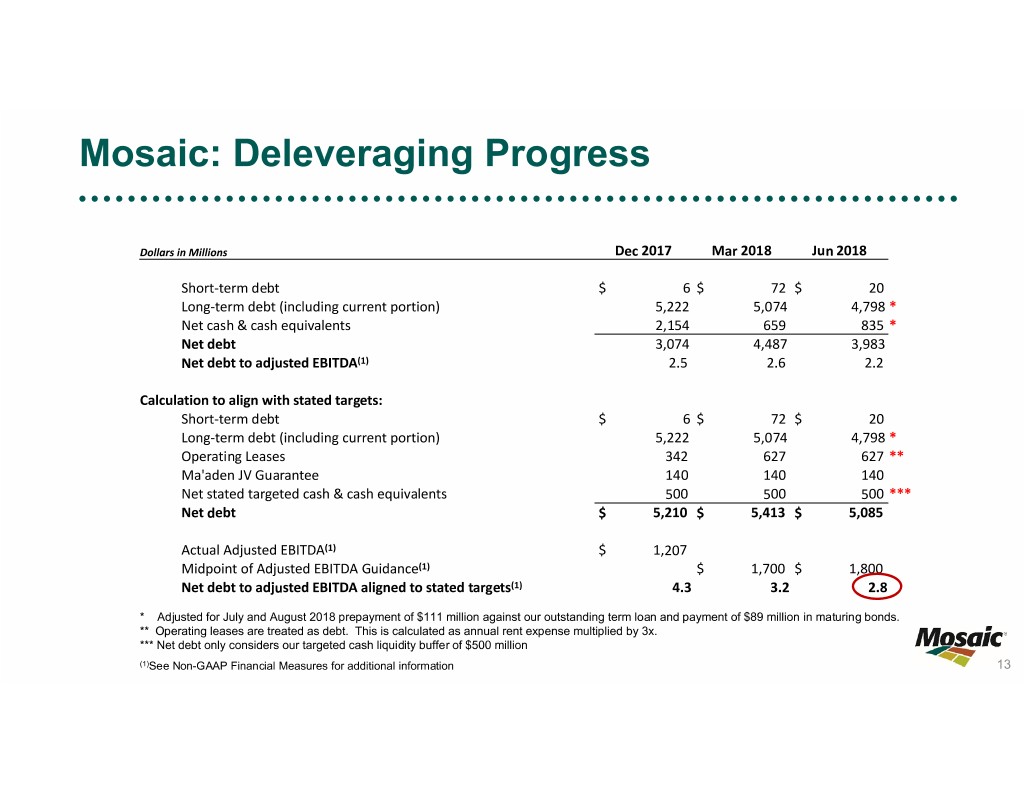
Mosaic: Deleveraging Progress Dollars in Millions Dec 2017 Mar 2018 Jun 2018 Short‐term debt $ 6 $ 72 $ 20 Long‐term debt (including current portion) 5,222 5,074 4,798 * Net cash & cash equivalents 2,154 659 835 * Net debt 3,074 4,487 3,983 Net debt to adjusted EBITDA(1) 2.5 2.6 2.2 Calculation to align with stated targets: Short‐term debt $ 6 $ 72 $ 20 Long‐term debt (including current portion) 5,222 5,074 4,798 * Operating Leases 342 627 627 ** Ma'aden JV Guarantee 140 140 140 Net stated targeted cash & cash equivalents 500 500 500 *** Net debt $ 5,210 $ 5,413 $ 5,085 Actual Adjusted EBITDA(1) $ 1,207 Midpoint of Adjusted EBITDA Guidance(1) $ 1,700 $ 1,800 Net debt to adjusted EBITDA aligned to stated targets(1) 4.3 3.2 2.8 * Adjusted for July and August 2018 prepayment of $111 million against our outstanding term loan and payment of $89 million in maturing bonds. ** Operating leases are treated as debt. This is calculated as annual rent expense multiplied by 3x. *** Net debt only considers our targeted cash liquidity buffer of $500 million (1)See Non-GAAP Financial Measures for additional information 13
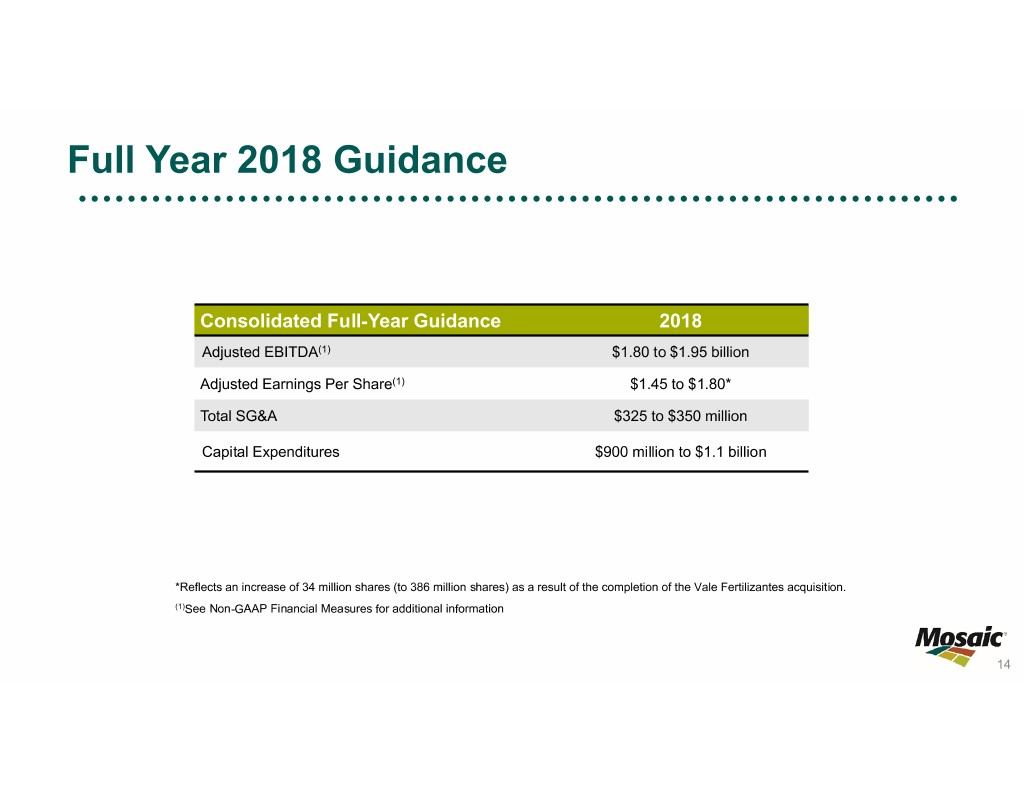
Full Year 2018 Guidance Consolidated Full-Year Guidance 2018 Adjusted EBITDA(1) $1.80 to $1.95 billion Adjusted Earnings Per Share(1) $1.45 to $1.80* Total SG&A $325 to $350 million Capital Expenditures $900 million to $1.1 billion *Reflects an increase of 34 million shares (to 386 million shares) as a result of the completion of the Vale Fertilizantes acquisition. (1)See Non-GAAP Financial Measures for additional information 14
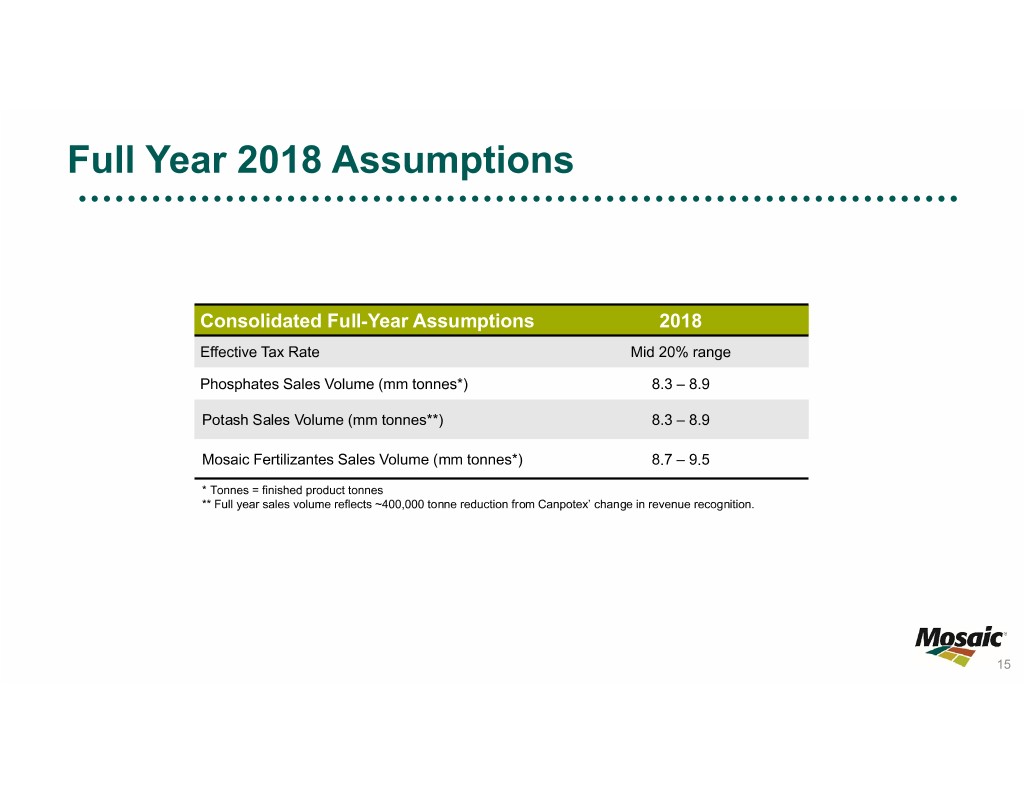
Full Year 2018 Assumptions Consolidated Full-Year Assumptions 2018 Effective Tax Rate Mid 20% range Phosphates Sales Volume (mm tonnes*) 8.3 – 8.9 Potash Sales Volume (mm tonnes**) 8.3 – 8.9 Mosaic Fertilizantes Sales Volume (mm tonnes*) 8.7 – 9.5 * Tonnes = finished product tonnes ** Full year sales volume reflects ~400,000 tonne reduction from Canpotex’ change in revenue recognition. 15
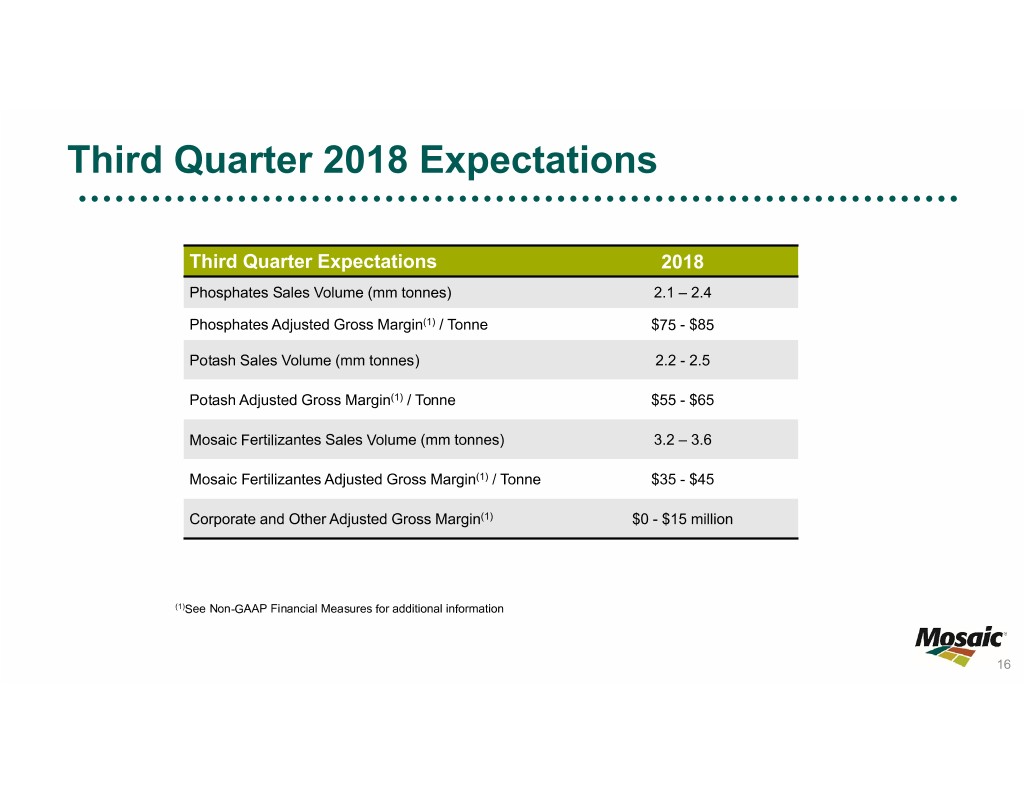
Third Quarter 2018 Expectations Third Quarter Expectations 2018 Phosphates Sales Volume (mm tonnes) 2.1 – 2.4 Phosphates Adjusted Gross Margin(1) / Tonne $75 - $85 Potash Sales Volume (mm tonnes) 2.2 - 2.5 Potash Adjusted Gross Margin(1) / Tonne $55 - $65 Mosaic Fertilizantes Sales Volume (mm tonnes) 3.2 – 3.6 Mosaic Fertilizantes Adjusted Gross Margin(1) / Tonne $35 - $45 Corporate and Other Adjusted Gross Margin(1) $0 - $15 million (1)See Non-GAAP Financial Measures for additional information 16

Global Phosphate Shipment Forecasts by Region (August 2018) Source: IFA, CRU and Mosaic DAP / MAP / NPS* / Low High (Numbers may not sum to total due to rounding) TSP (Million Tonnes) 2016 2017R 2018F 2019F 2019F Comments We have downgraded our forecast for 2018 by nearly 1.0 mmt, given our most recent data on use during the spring season. It is from this lower base that we look for stabilization of domestic phosphate demand after several years of China 18.5 17.7 16.9 16.7 17.0 decline (from a peak of 21.8 mmt in 2014, a decline of 22% over the past 4 years). As expected, low inventories as the start of the year prompted a big import program (Jan-Jun imports of 2.5 mmt are nearly double the pace seen last year). With domestic production for H1 down by ~750,000 tonnes y-o-y, we expect imports to remain strong through 2018, coming in at around 5.5 mmt (versus 4.1mmt in 2017), though inventories are India 9.3 9.5 9.8 9.8 10.1 expected to end the year at low levels. Demand across this region remains robust driven by favorable policy changes, generally profitable farm economics, and mostly normal weather. We expect recent trends to continue in 2019, although early indications of a developing El Niño Other Asia/Oceania 8.3 9.3 9.7 9.9 10.2 is a yellow flag. Our 2018 estimate is at the top end of our expectations on strong shipments in H1, though the drought conditions Europe and FSU 5.8 6.2 6.0 6.1 6.3 across much of the region coupled with potential destocking of the distribution pipeline could threaten H2 volumes. Farm economics continue to look very attractive on the strength of Brazilian soybean export prices and a weakened currency, though FX volatility and uncertainty surrounding truck freight tariffs have kept 2018 shipment growth in check. We expect that inventories will end the year well below average on the slow pace of imports (down 10% y-o-y through Brazil 7.8 8.2 8.5 8.7 9.0 June) and strong on-farm demand, leading to an acceleration of shipment growth in 2019. We have revised higher our 2017 shipment estimate on updated trade statistics, but have left our 2018 estimate little- Other Latin America 3.8 3.6 3.7 3.7 3.9 changed with continued profitable farm economics. On-farm demand held firm in spring 2018 despite spring arriving late in some parts, and we expect that shipments will also be robust in the fall, as the early maturation of this year’s crops should lead to a long, open season. This has the North America 9.4 9.9 10.1 9.8 10.1 potential to pull forward some volumes from spring 2019. Our forecasts for Africa have been revised upwards for 2017, which carries through to a higher estimate for 2018, as Other 4.7 4.9 5.2 5.3 5.4 growth in African demand continues to surprise to the upside. At 70.0 mmt, our point estimate for 2018 remains right in the middle of our previous guidance of 69-71 mmt. Excluding China, this represents an increase of 1.6 mmt or 3.1% from an upwardly-revised estimate for 2017. Our first call on 2019 shipments is 70-72 mmt, with a current point estimate in the middle of the range. Excluding China, this adds Total 67.7 69.2 70.0 70.0 72.0 another nearly 2% or 1.0 mmt to the lofty 2018 tally. * NPS products included in this analysis are those with a combined N and P O nutrient content of 45 units or greater. 2 5 17
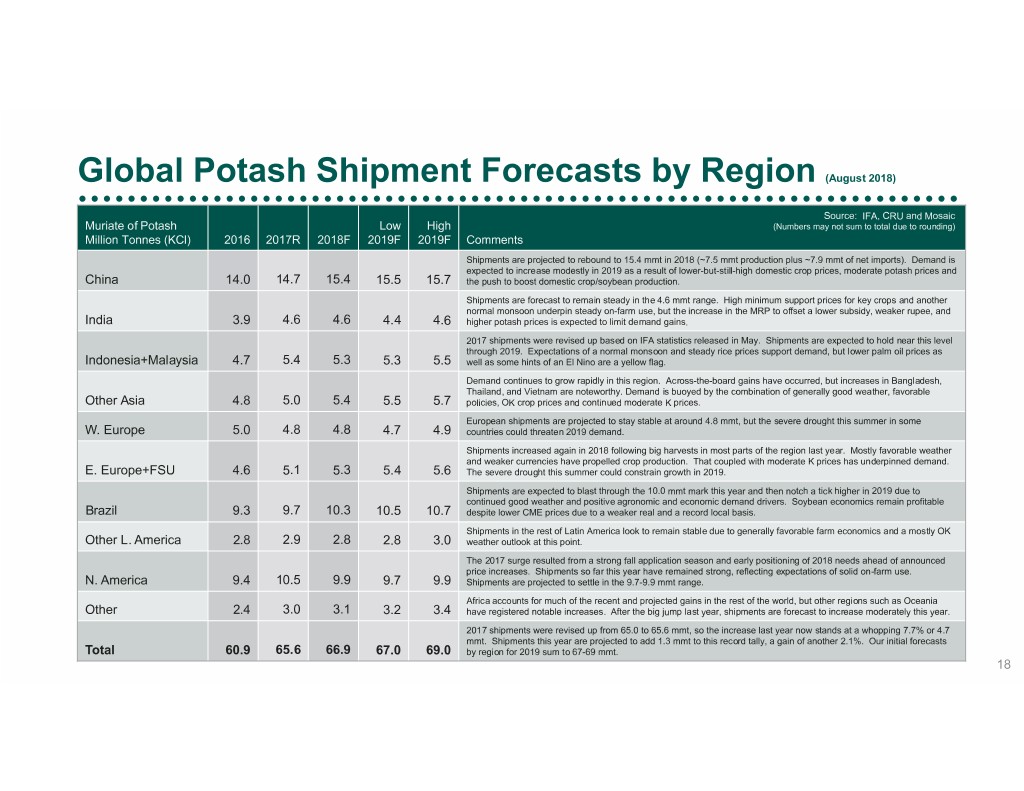
Global Potash Shipment Forecasts by Region (August 2018) Source: IFA, CRU and Mosaic Muriate of Potash Low High (Numbers may not sum to total due to rounding) Million Tonnes (KCl) 2016 2017R 2018F 2019F 2019F Comments Shipments are projected to rebound to 15.4 mmt in 2018 (~7.5 mmt production plus ~7.9 mmt of net imports). Demand is expected to increase modestly in 2019 as a result of lower-but-still-high domestic crop prices, moderate potash prices and China 14.0 14.7 15.4 15.5 15.7 the push to boost domestic crop/soybean production. Shipments are forecast to remain steady in the 4.6 mmt range. High minimum support prices for key crops and another normal monsoon underpin steady on-farm use, but the increase in the MRP to offset a lower subsidy, weaker rupee, and India 3.9 4.6 4.6 4.4 4.6 higher potash prices is expected to limit demand gains. 2017 shipments were revised up based on IFA statistics released in May. Shipments are expected to hold near this level through 2019. Expectations of a normal monsoon and steady rice prices support demand, but lower palm oil prices as Indonesia+Malaysia 4.7 5.4 5.3 5.3 5.5 well as some hints of an El Nino are a yellow flag. Demand continues to grow rapidly in this region. Across-the-board gains have occurred, but increases in Bangladesh, Thailand, and Vietnam are noteworthy. Demand is buoyed by the combination of generally good weather, favorable Other Asia 4.8 5.0 5.4 5.5 5.7 policies, OK crop prices and continued moderate K prices. European shipments are projected to stay stable at around 4.8 mmt, but the severe drought this summer in some W. Europe 5.0 4.8 4.8 4.7 4.9 countries could threaten 2019 demand. Shipments increased again in 2018 following big harvests in most parts of the region last year. Mostly favorable weather and weaker currencies have propelled crop production. That coupled with moderate K prices has underpinned demand. E. Europe+FSU 4.6 5.1 5.3 5.4 5.6 The severe drought this summer could constrain growth in 2019. Shipments are expected to blast through the 10.0 mmt mark this year and then notch a tick higher in 2019 due to continued good weather and positive agronomic and economic demand drivers. Soybean economics remain profitable Brazil 9.3 9.7 10.3 10.5 10.7 despite lower CME prices due to a weaker real and a record local basis. Shipments in the rest of Latin America look to remain stable due to generally favorable farm economics and a mostly OK Other L. America 2.8 2.9 2.8 2.8 3.0 weather outlook at this point. The 2017 surge resulted from a strong fall application season and early positioning of 2018 needs ahead of announced price increases. Shipments so far this year have remained strong, reflecting expectations of solid on-farm use. N. America 9.4 10.5 9.9 9.7 9.9 Shipments are projected to settle in the 9.7-9.9 mmt range. Africa accounts for much of the recent and projected gains in the rest of the world, but other regions such as Oceania Other 2.4 3.0 3.1 3.2 3.4 have registered notable increases. After the big jump last year, shipments are forecast to increase moderately this year. 2017 shipments were revised up from 65.0 to 65.6 mmt, so the increase last year now stands at a whopping 7.7% or 4.7 mmt. Shipments this year are projected to add 1.3 mmt to this record tally, a gain of another 2.1%. Our initial forecasts Total 60.9 65.6 66.9 67.0 69.0 by region for 2019 sum to 67-69 mmt. 18

China Phosphate Exports Source: IFA, CRU and Mosaic (Numbers may not sum to total due to rounding) Million Tonnes China Phosphate Exports China Phosphate Exports 12 1000 Tonnes Jan-Jun Source: China Customsc 3,000 10 2,500 8 2,000 6 1,500 4 1,000 2 500 0 0 10 11 12 13 14 15 16 17 2015 2016 2017 2018 DAP MAP TSP DAP MAP TSP China Phosphate Exports January-June 2018 vs. 2017 1000 Tonnes 2015 2016 2017 2018 Change Pct Chg DAP 2,823 2,088 2,266 2,485 219 9.7% MAP 1,392 825 1,357 908 -449 -33.1% TSP 461 300 413 467 55 13.3% Total 4,677 3,213 4,035 3,861 -175 -4.3% Source: China Customs and Mosaic 19
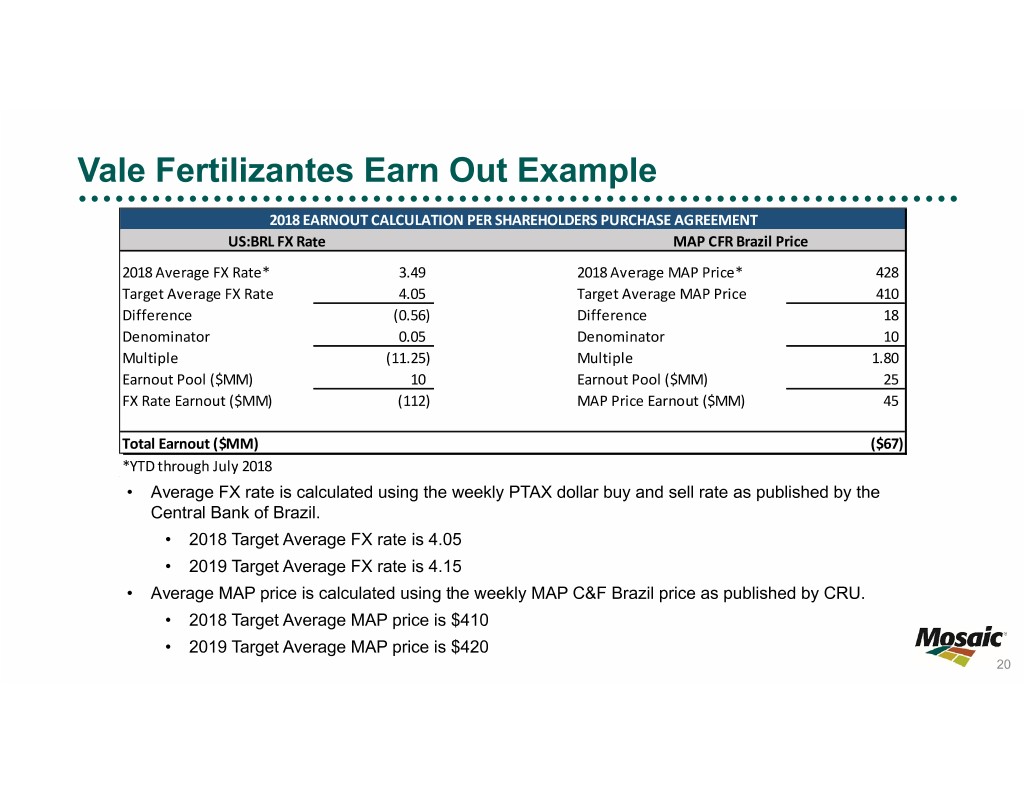
Vale Fertilizantes Earn Out Example 2018 EARNOUT CALCULATION PER SHAREHOLDERS PURCHASE AGREEMENT US:BRL FX Rate MAP CFR Brazil Price 2018 Average FX Rate* 3.49 2018 Average MAP Price* 428 Target Average FX Rate 4.05 Target Average MAP Price 410 Difference (0.56) Difference 18 Denominator 0.05 Denominator 10 Multiple (11.25) Multiple 1.80 Earnout Pool ($MM) 10 Earnout Pool ($MM) 25 FX Rate Earnout ($MM) (112) MAP Price Earnout ($MM) 45 Total Earnout ($MM) ($67) *YTD through July 2018 • Average FX rate is calculated using the weekly PTAX dollar buy and sell rate as published by the Central Bank of Brazil. • 2018 Target Average FX rate is 4.05 • 2019 Target Average FX rate is 4.15 • Average MAP price is calculated using the weekly MAP C&F Brazil price as published by CRU. • 2018 Target Average MAP price is $410 • 2019 Target Average MAP price is $420 20
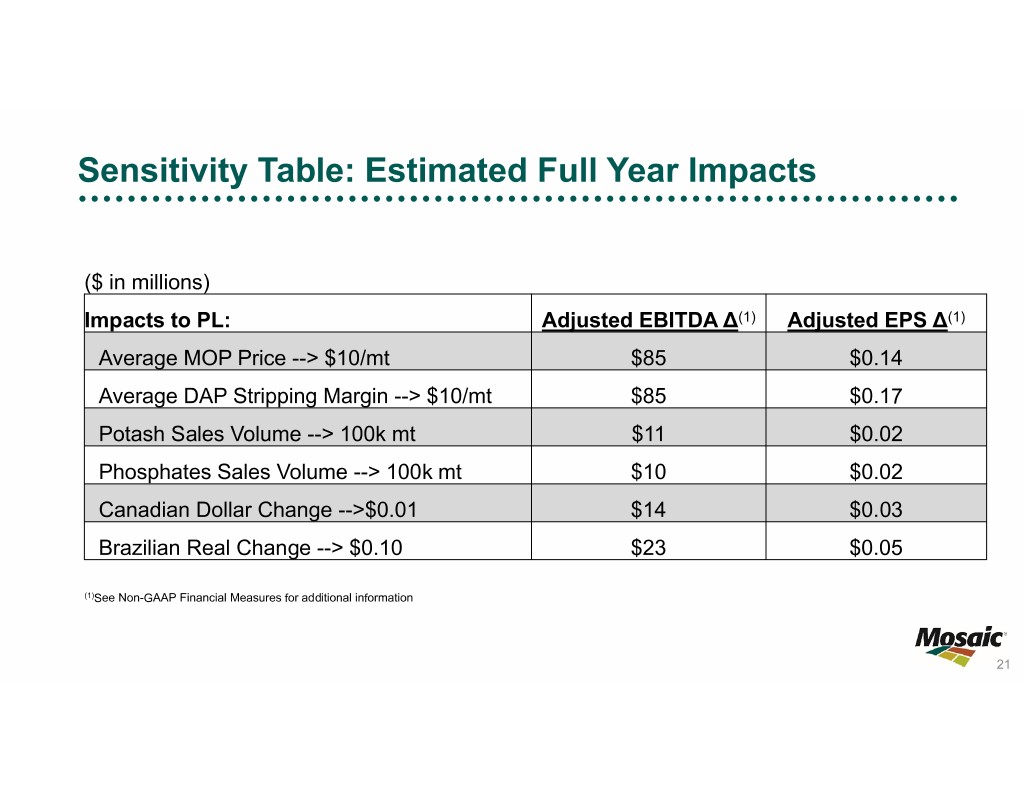
Sensitivity Table: Estimated Full Year Impacts ($ in millions) Impacts to PL: Adjusted EBITDA ∆(1) Adjusted EPS ∆(1) Average MOP Price --> $10/mt $85 $0.14 Average DAP Stripping Margin --> $10/mt $85 $0.17 Potash Sales Volume --> 100k mt $11 $0.02 Phosphates Sales Volume --> 100k mt $10 $0.02 Canadian Dollar Change -->$0.01 $14 $0.03 Brazilian Real Change --> $0.10 $23 $0.05 (1)See Non-GAAP Financial Measures for additional information 21


