Exhibit 99.2
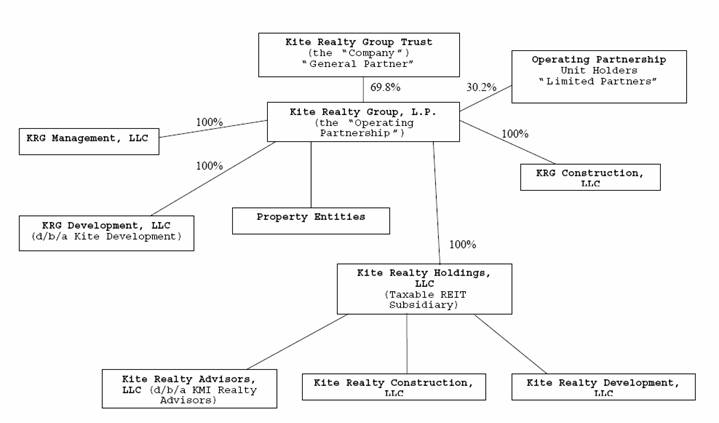
Kite Realty Group Trust
Quarterly Financial Supplement
December 31, 2004
| | Investor Relations | |
| | Daniel R. Sink, CFO | |

| | 30 S. Meridian Street | |
| Suite 1100 | |
| Indianapolis, IN 46204 | 
|
| 317.577.5600 |
| www.kiterealty.com |
Supplemental Information – December 31, 2004
1
Corporate Profile
General Description
Kite Realty Group Trust commenced operations in August 2004 as the successor to certain businesses of Kite Property Group, a nationally recognized real estate owner and developer. We are a full service, vertically integrated real estate company focused primarily on the development, construction, acquisition, ownership and operation of high quality neighborhood and community shopping centers in selected growth markets in the United States. We owned interests in 36 operating properties totaling approximately 5.2 million square feet and interests in 9 properties under development representing 1.3 million square feet as of December 31, 2004. We are organized as a real estate investment trust (“REIT”) for federal income tax purposes.
Our strategy is to maximize the cash flow of our operating properties, successfully complete the construction and lease-up of our development portfolio and identify additional growth opportunities in the form of new developments and acquisitions. New investments are focused in the shopping center sector, although we may selectively pursue commercial development or acquisition opportunities in markets where we currently operate and where we believe we can leverage the existing infrastructure and relationships to generate attractive risk adjusted returns.
Company Highlights (as of December 31, 2004)
• | Operating Retail Properties | | 30 | |
• | Operating Commercial Properties | | 6 | |
• | Total Properties Under Development | | 9 | |
• | States | | 9 | |
• | Total GLA/NRA (operating) | | 5,229,026 | |
• | Owned GLA/NRA (operating) | | 4,054,552 | |
• | Percentage of Owned GLA Leased - Retail | | 95.3 | % |
• | Percentage of Owned NRA Leased – Commercial | | 97.7 | % |
• | Total Employees | | 81 | |
Stock Listing
New York Stock Exchange - symbol KRG
2
Contact Information
Corporate Office
30 South Meridian Street, Suite 1100
Indianapolis, IN 46204
1-888-577-5600
317-577-5600
www.kiterealty.com
Investor Relations Contacts: | Analyst Coverage: |
| |
Daniel R. Sink, Chief Financial Officer | Goldman, Sachs & Co. |
Kite Realty Group Trust | Mr. Carey Callaghan |
30 South Meridian Street, Suite 1100 | (212) 902-4351 |
Indianapolis, IN 46204 | carey.callaghan@gs.com |
(317) 577-5609 | |
dsink@kiterealty.com | KeyBanc Capital Markets |
| Mr. Richard C. Moore II, CFA |
The Ruth Group | (216) 443-2815 |
Stephanie Carrington | rcmoore@keybanccm.com |
(646) 536-7017 | |
Jason Rando | Lehman Brothers |
(646) 536-7025 | Mr. David Harris |
| (212) 526-1790 |
Transfer Agent: | dharris4@lehman.com |
| |
LaSalle Bank, National Association | Raymond James |
135 South LaSalle Street | Mr. Paul Puryear |
Chicago, IL 60603-3499 | (727) 567-2253 |
(312) 904-2000 | paul.puryear@raymondjames.com |
| |
Stock Specialist: | Wachovia Securities |
| Mr. Jeffrey J. Donnelly, CFA |
Van der Moolen Specialists USA, LLC | (617) 603-4262 |
45 Broadway | jeff.donnelly@wachovia.com |
32nd Floor | |
New York, NY 10006 | |
(646) 576-2707 | |
3
Important Notes
Interim Information
This supplemental information package contains historical information of Kite Realty Group Trust (the “Company”) and Kite Property Group (the “Predecessor”) and is intended to supplement the Company’s Annual Report on Form 10-K for the year ended December 31, 2004, which should be read in conjunction with this package. The supplemental information is unaudited, although it reflects all adjustments which, in the opinion of management, are necessary for a fair presentation of operating results for the interim periods.
Forward-Looking Statements
This Quarterly Financial Supplement contains certain forward-looking statements within the meaning of Section 27A of the Securities Act of 1933 and Section 21E of the Securities Exchange Act of 1934. Such statements are based on assumptions and expectations that may not be realized and are inherently subject to risks, uncertainties and other factors, many of which cannot be predicted with accuracy and some of which might not even be anticipated. Future events and actual results, performance, transactions or achievements, financial or otherwise, may differ materially from the results, performance, transactions or achievements expressed or implied by the forward-looking statements. Risks, uncertainties and other factors that might cause such differences, some of which could be material, include, but are not limited to:
• national and local economic, business, real estate and other market conditions;
• the ability of tenants to pay rent;
• the competitive environment in which the Company operates;
• financing risks;
• property management risks;
• the level and volatility of interest rates;
• the Company’s ability to maintain its status as a REIT for federal income tax purposes;
• acquisition, disposition, development and joint venture risks;
• potential environmental and other liabilities;
• other factors affecting the real estate industry generally; and
• other risks identified in reports the Company files with the Securities and Exchange Commission
(the “SEC”) or in other documents that it publicly disseminates.
The Company undertakes no obligation to publicly update or revise these forward-looking statements, whether as a result of new information, future events or otherwise.
Funds From Operations
Funds from Operations (“FFO”) is a widely used performance measure for real estate companies and is provided here as a supplemental measure of operating performance. We calculate FFO in accordance with the best practices described in the April 2002 National Policy Bulletin of the National Association of Real Estate Investment Trusts (NAREIT), which we refer to as the White Paper. The White Paper defines FFO as net income (computed in accordance with GAAP), excluding gains (or losses) from sales of property, plus depreciation and amortization, and after adjustments for unconsolidated partnerships and joint ventures.
Given the nature of our business as a real estate owner and operator, we believe that FFO is helpful to investors in measuring our operational performance because it excludes various items included in net income that do not relate to or are not indicative of our operating performance such as gains (or losses) from sales of property and depreciation and amortization, which can make periodic and peer analyses of operating performance more difficult. FFO should not be considered as an alternative to net income (determined in accordance with generally accepted accounting principles (“GAAP”)) as an indicator of our financial performance, is not an alternative to cash flow from operating activities (determined in accordance with GAAP) as a measure of our liquidity, and is not indicative of funds available to fund our cash needs, including our ability to make distributions. Our computation of FFO may not be comparable to FFO reported by other REITs that do not define the term in accordance with the current NAREIT definition or that interpret the current NAREIT definition differently than we do.
Net Operating Income
Net operating income (“NOI”) is provided here as a supplemental measure of operating performance. NOI is defined as property revenues less property operating expenses, excluding depreciation and amortization, interest expense and other items. We believe that this presentation of NOI is helpful to investors as a measure of its operational performance because it is widely used in the real estate industry to measure the performance of real estate assets without regard to various items included in net imcome that do not relate to or are not indicative of operating performance, such as depreciation and amortization, which can vary depending upon accounting methods and book value of assets. We also believe NOI helps our investors to meaningfully compare the results of our operating performance from period to period by removing the impact of our capital structure (primarily interest expense on our outstanding indebtedness) and depreciation of our basis in our assets from our operating results. NOI should not, however, be considered as an alternative to net income (calculated in accordance with GAAP) as an indicator of our financial performance.
Basis for Presentation
Kite Realty Group Trust commenced operations on August 16, 2004 upon completion of its initial public offering. Prior to that date, the entities that owned the properties and service companies that we acquired as part of our formation transactions were under the common control of Al Kite, John Kite and Paul Kite (the “Principals”). Certain line items in the accompanying financial information in the period beginning August 16, 2004 may not be comparable to prior periods due to acquisitions, including the purchase of minority partner and joint venture interests of the properties previously accounted for under the equity method.
4
CONSOLIDATED AND COMBINED BALANCE SHEETS
| | Kite Realty Group Trust
December 31,
2004 | | The Predecessor
December 31,
2003 | |
Assets: | | | | | |
Investment properties, at cost: | | | | | |
Land | | $ | 115,806,345 | | $ | 19,319,563 | |
Land held for development | | 10,454,246 | | 7,137,095 | |
Buildings and improvements | | 365,043,023 | | 77,076,703 | |
Furniture, equipment and other | | 5,587,052 | | 1,596,820 | |
Construction in progress | | 52,485,321 | | 48,681,767 | |
| | 549,375,987 | | 153,811,948 | |
Less: accumulated depreciation | | (24,133,716 | ) | (4,465,775 | ) |
| | 525,242,271 | | 149,346,173 | |
| | | | | |
Cash and cash equivalents | | 10,103,176 | | 2,189,478 | |
Tenant receivables, including accrued straight-line rent | | 5,763,831 | | 1,520,487 | |
Other receivables | | 7,635,276 | | 5,139,118 | |
Due from affiliates | | — | | 3,905,605 | |
Investments in unconsolidated entities, at equity | | 155,495 | | 2,136,158 | |
Escrow deposits | | 4,497,337 | | 595,459 | |
Deferred costs, net | | 15,264,271 | | 6,053,515 | |
Prepaid and other assets | | 1,093,176 | | 449,713 | |
| | | | | |
Total Assets | | $ | 569,754,833 | | $ | 171,335,706 | |
| | | | | |
Liabilities and Shareholders’ Equity and Owners’ Equity: | | | | | |
Mortgage and other indebtedness | | $ | 283,479,363 | | $ | 141,498,289 | |
Cash distributions and losses in excess of net investment in unconsolidated entities, at equity | | 837,083 | | 2,864,690 | |
Accounts payable and accrued expenses | | 28,003,690 | | 9,541,494 | |
Deferred revenue | | 30,752,689 | | 9,266,250 | |
Due to affiliates | | — | | 1,469,560 | |
Minority interest | | 59,735 | | 1,137,914 | |
| | | | | |
Total liabilities | | 343,132,560 | | 165,778,197 | |
| | | | | |
Commitments and Contingencies | | | | | |
| | | | | |
Limited Partners’ interests in operating partnership | | 68,423,213 | | — | |
| | | | | |
Common stock, $.01 par value, 200,000,000 shares authorized, 19,148,267 shares issued and outstanding | | 191,483 | | — | |
Additional paid in capital and other | | 163,727,708 | | — | |
Accumulated deficit | | (5,720,131 | ) | — | |
Owners’ equity | | — | | 5,557,509 | |
| | | | | |
Total owners’ equity | | 158,199,060 | | 5,557,509 | |
| | | | | |
Total Liabilities and Shareholders’ Equity and Owners’ Equity | | $ | 569,754,833 | | $ | 171,335,706 | |
6
CONSOLIDATED AND COMBINED STATEMENTS OF OPERATIONS – 3 MONTHS
| | Kite Realty Group
Trust | | The Predecessor | |
| | For the Three Months Ended | |
| | December 31,2004 | | December 31, 2003 | |
Revenue: | | | | | |
Minimum rent | | $ | 11,152,243 | | $ | 3,107,293 | |
Tenant reimbursements | | 1,871,803 | | 388,170 | |
Other property related revenue | | 2,014,392 | | 528,158 | |
Construction and service fee revenue | | 7,471,746 | | 5,137,279 | |
Other income | | 13,526 | | 124,865 | |
Total revenue | | 22,523,710 | | 9,285,765 | |
| | | | | |
Expenses: | | | | | |
Property operating | | 2,596,286 | | 954,586 | |
Real estate taxes | | 1,230,030 | | 327,105 | |
Cost of construction and services | | 6,938,833 | | 3,254,885 | |
General, administrative, and other | | 1,200,641 | | 1,803,666 | |
Depreciation and amortization | | 6,176,751 | | 748,661 | |
Total expenses | | 18,142,541 | | 7,088,903 | |
| | | | | |
Operating income | | 4,381,169 | | 2,196,862 | |
Interest expense | | 3,186,662 | | 1,215,961 | |
Minority interest income | | (102,150 | ) | (240,113 | ) |
Equity in earnings (loss) of unconsolidated entities | | 81,183 | | (460,681 | ) |
Limited partners’ interests in operating partnership | | (352,065 | ) | — | |
Net income | | $ | 821,475 | | $ | 280,107 | |
| | | | | |
Basic and diluted income per share | | $ | 0.04 | | | |
| | | | | |
Weighted average common shares outstanding:
- basic | | 19,148,267 | | | |
- diluted | | 19,277,703 | | | |
7
CONSOLIDATED AND COMBINED STATEMENTS OF OPERATIONS – 12 MONTHS
| | Kite Realty Group
Trust
Period August 16,
2004
through
December 31, 2004 | | Kite Property Group
Period January 1,
2004
through
August 15, 2004 | | Combined
Period January 1,
2004
Through
December 31, 2004 | | Kite Property
Group
For the Year Ended
December 31, 2003 | |
| | | | | | | | | |
Revenue: | | | | | | | | | |
Minimum rent | | $ | 15,558,827 | | $ | 11,046,605 | | $ | 26,605,432 | | $ | 10,043,847 | |
Tenant reimbursements | | 2,637,230 | | 1,662,576 | | 4,299,806 | | 1,199,885 | |
Other property related revenue | | 2,087,256 | | 1,373,503 | | 3,460,759 | | 1,511,914 | |
Construction and service fee revenue | | 9,333,868 | | 5,257,201 | | 14,591,069 | | 14,851,925 | |
Other income | | 30,446 | | 110,819 | | 141,265 | | 149,930 | |
Total revenue | | 29,647,627 | | 19,450,704 | | 49,098,331 | | 27,757,501 | |
| | | | | | | | | |
Expenses: | | | | | | | | | |
Property operating | | 3,735,195 | | 4,130,747 | | 7,865,942 | | 3,772,147 | |
Real estate taxes | | 1,835,837 | | 1,595,578 | | 3,431,415 | | 1,206,773 | |
Cost of construction and services | | 8,786,999 | | 4,405,160 | | 13,192,159 | | 11,536,538 | |
General, administrative, and other | | 1,780,579 | | 1,477,112 | | 3,257,691 | | 2,745,657 | |
Depreciation and amortization | | 7,864,679 | | 3,584,290 | | 11,448,969 | | 2,892,506 | |
Total expenses | | 24,003,289 | | 15,192,887 | | 39,196,176 | | 22,153,621 | |
| | | | | | | | | |
Operating income | | 5,644,338 | | 4,257,817 | | 9,902,155 | | 5,603,880 | |
Interest expense | | 4,460,476 | | 4,828,888 | | 9,289,364 | | 4,207,213 | |
Loan prepayment penalties and expenses | | 1,671,449 | | — | | 1,671,449 | | — | |
Minority interest (income) loss | | (125,800 | ) | 214,887 | | 89,087 | | (232,819 | ) |
Equity in earnings of unconsolidated entities | | 134,097 | | 163,804 | | 297,901 | | 273,118 | |
Limited partners’ interests in operating partnership | | 146,968 | | — | | 146,968 | | — | |
Net income (loss) | | $ | (332,322 | ) | $ | (192,380 | ) | $ | (524,702 | ) | $ | 1,436,966 | |
| | | | | | | | | | |
Basic and diluted loss per share | | $ | (0.02 | ) | | | | | | |
| | | | | | | | | |
Weighted average common shares
outstanding:
- basic | | 18,727,977 | | | | | | | |
- diluted | | 18,857,413 | | | | | | | |
8
FUNDS FROM OPERATIONS AND OTHER FINANCIAL INFORMATION – 3 MONTHS
| | Kite Realty Group
Trust | | Kite Property Group | |
| | Three Months Ended December 31, 2003 and 2004 | |
| | December 31, 2004 | | December 31, 2003 | |
Funds From Operations: | | | | | |
| | | | | |
Net income | | $ | 821,475 | | $ | 280,107 | |
Add: Limited Partners’ interests | | 352,065 | | — | |
Add: depreciation and amortization of consolidated entities | | 6,157,936 | | 744,232 | |
Add: depreciation and amortization of unconsolidated entities | | 69,781 | | 310,140 | |
Add (deduct): minority interest* | | (14,607 | ) | 240,113 | |
Add: joint venture partners’ interests in net loss of unconsolidated entities* | | — | | (96,231 | ) |
Add: joint venture partners’ interests in depreciation and amortization of unconsolidated entities* | | — | | 604,828 | |
Funds From Operations of the Portfolio | | 7,386,650 | | 2,083,189 | |
| | | | | |
Plus: minority interest deficit | | — | | (240,113 | ) |
Less: minority interest share of depreciation and amortization | | — | | (215,073 | ) |
Less: joint venture partners’ interests in net loss of unconsolidated entities | | — | | 96,231 | |
Less: joint venture partners’ interests in depreciation and amortization of unconsolidated entities | | — | | (604,828 | ) |
Less: Limited Partners’ interests | | (2267850 | ) | — | |
Funds From Operations allocable to the Company | | $ | 5118800 | | $ | 1,119,406 | |
| | | | | |
Funds From Operations of the Portfolio - basic | | $ | 0.27 | | | |
- diluted | | $ | 0.27 | | | |
| | | | | |
Other Financial Information: | | | | | |
| | | | | |
Recurring Capital Expenditures | | | | | |
Tenant improvements | | $ | 386,581 | | | |
Leasing commissions | | 62,762 | | | |
Capital improvements | | 240,546 | | | |
Scheduled debt principal payments | | 570,441 | | | |
Straight line rent | | 319,782 | | | |
Market rent amortization income from acquired leases | | 908,924 | | | |
Market debt adjustment | | 394,617 | | | |
* 2003 amounts represent the minority and joint venture partners' interests acquired in connection with the initial public offering and related formation transactions.
9
FUNDS FROM OPERATIONS – 12 MONTHS
| | For the Year Ended December 31, 2004 | | | |
| | Kite Realty Group Trust
Period August 16, 2004
through December 31, 2004 | | Kite Property Group
Period January 1, 2004
through August 15, 2004 | | Combined
Twelve Months Ended
December 31, 2004 | | Kite Property Group
Twelve Months Ended
December 31, 2003 | |
Funds From Operations: | | | | | | | | | |
| | | | | | | | | |
Net income (loss) | | $ | (332,322 | ) | $ | (192,380 | ) | $ | (524,702 | ) | $ | 1,436,968 | |
Add: Limited Partners’ interests | | (146,968 | ) | — | | (146,968 | ) | — | |
Add: depreciation and amortization of consolidated entities | | 7,816,339 | | 3,563,176 | | 11,379,515 | | 2,887,199 | |
Add: depreciation and amortization of unconsolidated entities | | 103,518 | | 493,571 | | 597,089 | | 1,174,979 | |
Add (deduct): minority interest* | | (24,106 | ) | (214,887 | ) | (238,993 | ) | 232,819 | |
Add: joint venture partners’ interests in net income of unconsolidated entities* | | — | | 288,675 | | 288,675 | | 458,835 | |
Add: joint venture partners’ interests in depreciation and amortization of unconsolidated entities* | | — | | 519,277 | | 519,277 | | 1,672,003 | |
Funds From Operations of the Portfolio(1) | | 7,416,461 | | 4,457,432 | | 11,873,893 | | 7,862,803 | |
| | | | | | | | | |
Plus: minority interest deficit | | — | | 214,887 | | 214,887 | | (232,819 | ) |
Less: minority interest share of depreciation and amortization | | — | | (1,014,248 | ) | (1,014,248 | ) | (754,301 | ) |
Less: joint venture partners’ interests in net income of unconsolidated entities | | — | | (288,675 | ) | (288,675 | ) | (458,835 | ) |
Less: joint venture partners’ interests in depreciation and amortization of unconsolidated entities | | — | | (519,277 | ) | (519,277 | ) | (1,672,003 | ) |
Less: Limited Partners’ interests | | (2276853 | ) | — | | (2276853 | ) | — | |
Funds From Operations allocable to the Company | | $ | 5139608 | | $ | 2,850,119 | | $ | 7,989,727 | | $ | 4,744,845 | |
* Amounts for the period prior to August 16, 2004 represent the minority and joint venture partners’ interests acquired in connection with the initial public offering and related formation transactions.
(1) Funds From Operations for the period ending December 31, 2004 includes costs of approximately $2.2 million related to the initial public offering and related formation transactions.
10
MARKET CAPITALIZATION
As of December 31, 2004:
| | Percent of
Total Equity | | Total
Market
Capitalization | | Percent of
Total Market
Capitalization | |
Equity Capitalization: | | | | | | | |
Total Common Shares Outstanding | | 69.8% | | 19,148,267 | | | |
Operating Partnership (“OP”) Units | | 30.2% | | 8,281,882 | | | |
Combined Common Shares and OP Units | | 100.0% | | 27,430,149 | | | |
| | | | | | | |
Market Price at December 31, 2004 | | | | $ | 15.28 | | | |
| | | | | | | |
Total Equity Capitalization | | | | $ | 419,132,677 | | 59% | |
| | | | | | | |
Debt Capitalization: | | | | | | | |
| | | | | | | |
Company Outstanding Debt | | | | $ | 283,479,363 | | | |
Pro-rata Share of Joint Venture Debt | | | | 8,738,897 | | | |
| | | | | | | |
Total Debt Capitalization | | | | 292,218,260 | | 41% | |
| | | | | | | |
Total Market Capitalization | | | | $ | 711,350,937 | | 100% | |
Weighted Average Outstanding Common Shares and OP Units:
| | Common Shares | | OP Units | | Total | |
Outstanding Common Shares and OP Units (Basic) | | 19,148,267 | | 8,281,882 | | 27,430,149 | |
Effect of assumed exercise of stock options | | 129,436 | | — | | 129,436 | |
Outstanding Common Shares and OP Units (Diluted) | | 19,277,703 | | 8,281,882 | | 27,559,585 | |
11
NET OPERATING INCOME
| | THREE MONTHS ENDED* | | TWELVE MONTHS ENDED | |
| | December 31, 2004 | | September 30, 2004 | | June 30, 2004 | | December 31, 2004 | |
| | | | | | | | | |
Revenue: | | | | | | | | | |
Minimum rent | | $ | 11,152,243 | | $ | 7,282,422 | | $ | 4,901,039 | | $ | 26,605,432 | |
Tenant reimbursements | | 1,871,803 | | 1,300,525 | | 748,700 | | 4,299,806 | |
Other property related revenue | | 2,014,392 | | 233,651 | | 317,502 | | 3,460,759 | |
Other income, net | | 13,526 | | 52,929 | | 73,625 | | 141,265 | |
| | 15,051,964 | | 8,869,527 | | 6,040,866 | | 34,507,262 | |
Expenses: | | | | | | | | | |
Property operating | | 2,596,286 | | 2,220,984 | | 1,861,677 | | 7,865,942 | |
Real estate taxes | | 1,230,030 | | 972,896 | | 847,790 | | 3,431,415 | |
| | 3,826,316 | | 3,193,880 | | 2,709,467 | | 11,297,357 | |
| | | | | | | | | |
Net Operating Income - (Properties) | | 11,225,648 | | 5,675,647 | | 3,331,399 | | 23,209,905 | |
| | | | | | | | | |
Other Income (Expense) | | | | | | | | | |
Construction and service fee revenue | | 7,471,746 | | 3,073,897 | | 1,811,005 | | 14,591,069 | |
Cost of construction and services | | (6,938,833 | ) | (2,879,544 | ) | (1,240,376 | ) | (13,192,159 | ) |
General, administrative, and other | | (1,200,641 | ) | (997,358 | ) | (587,262 | ) | (3,257,691 | ) |
Depreciation and amortization | | (6,176,751 | ) | (2,816,696 | ) | (1,543,583 | ) | (11,448,969 | ) |
| | (6,844,479 | ) | (3,619,701 | ) | (1,560,216 | ) | (13,307,750 | ) |
| | | | | | | | | |
Earnings Before Interest and Taxes | | 4,381,169 | | 2,055,946 | | 1,771,183 | | 9,902,155 | |
| | | | | | | | | |
Interest expense | | 3,186,662 | | 2,633,621 | | 2,139,098 | | 9,289,364 | |
Loan prepayment penalties and expenses | | — | | 1,671,449 | | — | | 1,671,449 | |
Minority interest (income) loss | | (102,150 | ) | 263,280 | | (56,055 | ) | 89,087 | |
Equity in earnings of unconsolidated entities | | 81,183 | | 191,020 | | 42,508 | | 297,901 | |
Limited partners’ interests in operating partnership | | (352,065 | ) | 499,033 | | — | | 146,968 | |
Net income (loss) | | $ | 821,475 | | $ | (1,295,791 | ) | $ | (381,462 | ) | $ | (524,702 | ) |
* Results are unaudited although they reflect all adjustments which, in the opinion of management, are necessary for a fair presentation of operating results for the interim period.
12
SUMMARY OF OUTSTANDING DEBT(1)
TOTAL DEBT OUTSTANDING AS OF DECEMBER 31, 2004
| | Outstanding Amount | | Percent of Total Debt | | Weighted Average Interest
Rate | | Weighted Average Maturity
(in years) | |
Fixed Rate Debt: | | | | | | | | | |
Consolidated | | $ | 152,832 | | 53 | % | 6.75 | % | 6.8 | |
Unconsolidated | | 8,739 | | 3 | % | 6.61 | % | 7.4 | |
Total Fixed Rate Debt | | 161,571 | | 56 | % | 6.74 | % | 6.9 | |
Variable Rate Debt: | | | | | | | | | |
Construction Loans | | 59,522 | | 21 | % | 4.09 | % | 1.4 | |
Other Variable | | 66,986 | | 23 | % | 3.49 | % | 2.6 | |
Total Variable Rate Debt | | 126,508 | | 44 | % | 3.77 | % | 2.0 | |
Net Premiums | | 4,139 | | N/A | | N/A | | N/A | |
Total | | $ | 292,218 | | 100 | % | 5.24 | % | 4.7 | |
SCHEDULE OF MATURITIES BY YEAR (AS OF DECEMBER 31, 2004)
| | | | | | Secured Line of Credit | | Construction Loans | | Total
Consolidated Outstanding Debt | | KRG Share of Unconsolidated Mortgage Debt | | Total
Consolidated and Unconsolidated
Debt | |
Mortgage Debt |
Annual | | Term |
Maturity | | Maturities |
| | | | | | | | | | | | | | | |
2005 | | $ | 2,474 | | $ | 6,214 | | $ | 0 | | $ | 12,452 | | $ | 21,140 | | $ | 169 | | $ | 21,309 | |
2006 | | 2,279 | | 21,649 | | 0 | | 47,070 | | 70,998 | | 191 | | 71,189 | |
2007 | | 2,410 | | 0 | | 56,200 | | 0 | | 58,610 | | 204 | | 58,814 | |
2008 | | 2,427 | | 4,342 | | 0 | | 0 | | 6,769 | | 218 | | 6,987 | |
2009 | | 2,299 | | 27,452 | | 0 | | 0 | | 29,751 | | 2,223 | | 31,974 | |
2010 | | 2,024 | | 0 | | 0 | | 0 | | 2,024 | | 97 | | 2,121 | |
2011 | | 1,789 | | 19,655 | | 0 | | 0 | | 21,444 | | 104 | | 21,548 | |
2012 | | 1,336 | | 24,686 | | 0 | | 0 | | 26,022 | | 110 | | 26,132 | |
2013 | | 1,309 | | 4,027 | | 0 | | 0 | | 5,336 | | 5,423 | | 10,759 | |
2014 | | 901 | | 27,565 | | 0 | | 0 | | 28,466 | | 0 | | 28,466 | |
2015 | | 800 | | 0 | | 0 | | 0 | | 800 | | 0 | | 800 | |
2016 and beyond | | 3,548 | | 4,432 | | 0 | | 0 | | 7,980 | | 0 | | 7,980 | |
Net Premiums | | 0 | | 0 | | 0 | | 0 | | 4,139 | | 0 | | 4,139 | |
Total | | $ | 23,596 | | $ | 140,022 | | $ | 56,200 | | $ | 59,522 | | $ | 283,479 | | $ | 8,739 | | $ | 292,218 | |
(1) Dollars in thousands.
13
Schedule of Outstanding Debt(1)
CONSOLIDATED DEBT AS OF DECEMBER 31, 2004
Fixed Rate Debt: | | Lender/Servicer | | Interest Rate | | Maturity Date | | Balance as of
12/31/04 | | Monthly Debt Service as
of 12/31/04 | |
50th & 12th | | Wachovia Bank | | 5.67 | % | 11/11/2014 | | $ | 4,695 | | 27 | |
176th & Meridian | | Wachovia Bank | | 5.67 | % | 11/11/2014 | | 4,265 | | 25 | |
Boulevard Crossing | | Wachovia Bank | | 5.11 | % | 12/11/2009 | | 12,660 | | 69 | |
Centre at Panola, Phase I | | JP Morgan Chase | | 6.78 | % | 1/1/2022 | | 4,439 | | 37 | |
Corner Shops, The | | Sun Life Assurance Co. | | 7.65 | % | 7/1/2011 | | 1,926 | | 17 | |
Four Corner Square | | Four Corner Square, LP | | 4.00 | % | 1/3/2005 | | 2,500 | | 12 | |
International Speedway Square | | Lehman Brothers Bank | | 7.17 | % | 3/11/2011 | | 19,923 | | 139 | |
Plaza at Cedar Hill | | GECC | | 7.38 | % | 2/1/2012 | | 27,263 | | 194 | |
Preston Commons | | Wachovia Bank | | 5.90 | % | 3/11/2013 | | 4,653 | | 28 | |
Ridge Plaza | | Wachovia Bank | | 5.15 | % | 10/11/2009 | | 16,963 | | 93 | |
Sunland Towne Centre | | Nomura Asset Capital | | 8.85 | % | 1/11/2006 | | 17,719 | | 155 | |
Thirty South | | CS First Boston | | 6.09 | % | 1/11/2014 | | 23,241 | | 142 | |
Traders Point | | Huntington Real Estate Investment Company | | 12% (2% deferred | ) | 9/30/2006 | | 2,625 | | 104 | |
Whitehall Pike | | Banc One Capital Funding | | 6.71 | % | 7/5/2018 | | 9,960 | | 77 | |
TOTAL CONSOLIDATED FIXED RATE DEBT | | | | | | | | $ | 152,832 | | $ | 1,119 | |
| | | | | | | | | | | |
TOTAL NET PREMIUMS (FAS 141) | | | | | | | | $ | 4,139 | | | |
| | | | | | | | | | | | | |
Variable Rate Debt:
Mortgages | | Lender | | Interest Rate | | Maturity Date | | Balance as of
12/31/04 | |
Cool Creek Commons | | LaSalle Bank | | Prime + 200 | | 4/30/2006 | | $ | 1,135 | |
Eagle Creek Phase II (Pad 1) | | Wachovia Bank | | LIBOR + 250 | | 4/21/2005 | | 850 | |
Fishers Station(2) | | National City Bank | | LIBOR + 275 | | 9/1/2008 | | 5,466 | |
Geist Pavilion | | Star Financial | | Prime + 25 | | 4/5/2005 | | 864 | |
Traders Point III | | Huntington Bank | | Prime | | 10/6/2006 | | 471 | |
Traders Point II | | Whitaker Bank | | Prime + 100 | | 3/4/2005 | | 2,000 | |
Subtotal | | | | | | | | $ | 10,786 | |
(1) Dollars in thousands.
(2) The Company has a 25% interest in this property.
14
SCHEDULE OF OUTSTANDING DEBT (CONTINUED)(1)
Construction Loans | | Servicer | | Interest Rate | | Maturity Date | | Total Commitment | | Balance as of
12/31/04 | |
82nd & Otty | | KeyBank | | LIBOR + 225 | | 9/12/2005 | | $ | 1,792 | | $ | 1,587 | |
Circuit City Plaza | | Wachovia Bank | | LIBOR + 185 | | 6/30/2005 | | 6,900 | | 6,651 | |
Cool Creek Commons | | LaSalle Bank | | LIBOR + 225 | | 4/30/2006 | | 17,025 | | 13,817 | |
Indiana State Motor Pool | | Old National Bank | | LIBOR + 225 | | 4/1/2006 | | 4,168 | | 3,820 | |
Traders Point | | Huntington Bank | | LIBOR + 235 | | 10/5/2006 | | 40,000 | | 29,433 | |
Weston Park | | Old National Bank | | LIBOR + 215 | | 7/9/2005 | | 4,930 | | 4,214 | |
Subtotal | | | | | | | | | | $ | 59,522 | |
| | | | | | | | | | | | | |
Line of Credit | | Lender | | Interest Rate | | Maturity Date | | Total Available
as of 12/31/04 | | Balance as of
12/31/04 | |
Collateral Pool Properties(2): | | Wachovia Bank | | LIBOR + 135 | | 08/31/2007 | | $ | 91,254 | (3) | $ | 56,200 | (3) |
Total Consolidated Variable Rate Debt | | | | | | | | | | $ | 126,508 | |
TOTAL CONSOLIDATED DEBT | | | | | | | | | | $ | 283,479 | |
| | | | | | | | | | | | | |
(1) Dollars in thousands.
(2) There are currently fourteen operating properties encumbered under the line of credit. The following properties are currently unencumbered and available to expand borrowings under the line: 50 S. Morton, Centre at Panola Phase II, Eagle Creek Phase II, Eastgate Pavilion, Four Corner Square, Frisco Bridges, Greyhound Commons, Kite Spring Mill II, Martinsville Shops, Wal-Mart Plaza
(3) The total amount available for borrowing under the line is $91,254, of which $56,200 was outstanding at December 31, 2004.
15
SCHEDULE OF OUTSTANDING DEBT (CONTINUED)(1)
UNCONSOLIDATED DEBT(2) | | Lender | | Interest Rate | | Maturity Date | | Balance as of
12/31/04 | | Monthly Debt Service
as of 12/31/04 | |
Fixed Rate | | | | | | | | | | | |
The Centre | | Sun Life | | 6.99 | % | 6/1/2009 | | $ | 4,341 | | $ | 40 | |
Spring Mill Medical | | LaSalle Bank | | 6.45 | % | 9/1/2013 | | 12,269 | | 78 | |
TOTAL UNCONSOLIDATED DEBT | | | | | | | | $ | 16,610 | | $ | 118 | |
JOINT VENTURE PARTNERS’ SHARE OF TOTAL UNCONSOLIDATED DEBT | | | | | | | | <7,871 | > | | |
KRG’S SHARE OF TOTAL UNCONSOLIDATED DEBT | | | | | | | | $ | 8,739 | | | |
TOTAL KRG CONSOLIDATED DEBT | | | | | | | | $ | 283,479 | | | |
TOTAL KRG SHARE OF UNCONSOLIDATED DEBT | | | | | | | | 8,739 | | | |
TOTAL KRG DEBT | | | | | | | | $ | 292,218 | | | |
(1) Dollars in thousands.
(2) The Company owns a 50% interest in Spring Mill Medical and a 60% interest in The Centre.
16
Joint Venture Summary
The Company owns the following two unconsolidated properties with joint venture partners:
Property | | Percentage Owned by the Company | |
The Centre | | 60 | % |
Spring Mill Medical | | 50 | % |
17
Condensed Combined Balance Sheets of Unconsolidated Properties
(THE CENTRE AND SPRING MILL MEDICAL)
| | Kite Realty Group
Trust | | Kite Property
Group | |
| | December 31, 2004 | | December 31, 2003 | |
| | | | | |
Assets: | | | | | |
Investment properties, at cost | | | | | |
Land | | $ | 2,552,075 | | $ | 2,552,075 | |
Land held for development | | — | | — | |
Buildings and improvements | | 14,493,799 | | 14,450,685 | |
Furniture and equipment | | — | | — | |
Construction in progress | | — | | — | |
| | 17,045,874 | | 17,002,760 | |
Less: accumulated depreciation | | (2,338,829 | ) | (1,885,610 | ) |
| | 14,707,045 | | 15,117,150 | |
| | | | | |
Cash and cash equivalents | | 601,423 | | 747,632 | |
Tenant receivables, including accrued straight line rent | | 254,883 | | 311,040 | |
Other receivables | | 5,661 | | — | |
Due from affiliates | | — | | — | |
Investments in unconsolidated entities, at equity | | — | | — | |
Escrow deposits | | — | | — | |
Deferred costs, net | | 768,825 | | 761,216 | |
Prepaid and other assets | | 4,870 | | 8,104 | |
| | — | | — | |
Total Assets | | $ | 16,342,707 | | $ | 16,945,142 | |
| | | | | |
Liabilities and Accumulated Equity (Deficit): | | | | | |
Mortgage and other indebtedness | | $ | 16,609,675 | | $ | 16,909,121 | |
Cash distributions and losses in excess, net of investment in | | | | | |
Unconsolidated entities, at equity | | — | | — | |
Accounts payable and accrued expenses | | 458,289 | | 534,749 | |
Deferred revenue | | — | | — | |
Due to affiliate | | — | | — | |
Minority interest | | — | | — | |
Total Liabilities | | 17,067,964 | | 17,443,870 | |
| | | | | |
Accumulated equity (deficit) | | (725,257 | ) | (498,728 | ) |
| | | | | |
Total Liabilities and Accumulated Equity (Deficit) | | $ | 16,342,707 | | $ | 16,945,142 | |
18
Condensed Combined Statements of Operations of Unconsolidated Properties
(THE CENTRE AND SPRING MILL MEDICAL)
| | Three Months Ended December 31 | | Twelve Months Ended December 31 | |
| | 2004 | | 2003 | | 2004 | | 2003 | |
| | | | | | | | | |
Total Revenue | | $ | 863,582 | | $ | 748,760 | | $ | 3,267,976 | | $ | 2,983,949 | |
| | | | | | | | | |
Expenses: | | | | | | | | | |
Property operating and other | | 247,766 | | 276,767 | | 910,741 | | 915,929 | |
Real estate taxes | | 46,598 | | 43,808 | | 236,022 | | 175,235 | |
Depreciation and amortization | | 133,341 | | 132,328 | | 519,340 | | 503,657 | |
Total expenses | | 427,705 | | 452,903 | | 1,666,103 | | 1,594,821 | |
| | | | | | | | | |
Operating income | | 435,877 | | 295,857 | | 1,601,873 | | 1,389,128 | |
| | | | | | | | | |
Interest expense | | 290,929 | | 286,336 | | 1,159,371 | | 883,209 | |
| | | | | | | | | |
Net income | | $ | 144,948 | | $ | 9,521 | | $ | 442,502 | | $ | 505,919 | |
19
Top 10 Retail Tenants by Gross Leaseable Area (GLA)
AS OF DECEMBER 31, 2004
Information includes Operating Retail and Development Property tenants and non-owned anchors open for business as of December 31, 2004.
Tenant | | Number of
Locations | | Total GLA | | Number of Leases | | Company Owned GLA | | Number of Anchor Owned Locations | | Anchor Owned GLA | |
Lowe’s Home Center | | 5 | | 678,997 | | 1 | | 128,997 | | 4 | | 550,000 | |
Wal-Mart | | 2 | | 328,161 | | 1 | | 103,161 | | 1 | | 225,000 | |
L.S. Ayres | | 1 | | 237,455 | | 1 | | 237,455 | | 0 | | 0 | |
Publix | | 3 | | 129,357 | | 3 | | 129,357 | | 0 | | 0 | |
Dick’s Sporting Goods | | 2 | | 126,672 | | 2 | | 126,672 | | 0 | | 0 | |
Marsh Supermarkets | | 2 | | 122,000 | | 2 | | 122,000 | | 0 | | 0 | |
Kmart | | 1 | | 110,875 | | 1 | | 110,875 | | 0 | | 0 | |
Burlington Coat Factory | | 1 | | 107,400 | | 1 | | 107,400 | | 0 | | 0 | |
Winn-Dixie | | 2 | | 103,406 | | 2 | | 103,406 | | 0 | | 0 | |
Circuit City | | 3 | | 98,485 | | 3 | | 98,485 | | 0 | | 0 | |
Total | | 22 | | 2,042,808 | | 17 | | 1,267,808 | | 5 | | 775,000 | |
20
TOP 20 TENANTS BY ANNUALIZED BASE RENT
AS OF DECEMBER 31, 2004
Information includes Operating Retail and Commercial Properties and Development Property tenants open for business as of December 31, 2004.
Tenant | | Type | | Number of
Locations | | Leased GLA | | % of Total
GLA of Retail Portfolio | | Annualized Base Rent | | Annualized Base Rent per Sq. Ft. | | % of Total Portfolio Annualized Base Rent | |
Mid America Laboratories | | Commercial | | 1 | | 100,000 | | 2.3 | % | $ | 1,721,000 | | $ | 17.21 | | 3.6 | % |
State of Indiana | | Commercial | | 3 | | 210,393 | | 4.9 | % | $ | 1,663,733 | | $ | 7.91 | | 3.4 | % |
Eli Lilly | | Commercial | | 1 | | 99,542 | | 2.3 | % | $ | 1,642,443 | | $ | 16.50 | | 3.4 | % |
Marsh Supermarkets | | Retail | | 2 | | 122,000 | | 2.9 | % | $ | 1,547,847 | | $ | 12.69 | | 3.2 | % |
Circuit City | | Retail | | 3 | | 98,485 | | 2.3 | % | $ | 1,370,993 | | $ | 13.92 | | 2.8 | % |
Ultimate Electronics | | Retail | | 2 | | 63,627 | | 1.5 | % | $ | 1,242,732 | | $ | 19.53 | | 2.6 | % |
Dick’s Sporting Goods | | Retail | | 2 | | 126,672 | | 3.0 | % | $ | 1,220,000 | | $ | 9.63 | | 2.5 | % |
Walgreen’s | | Retail | | 3 | | 39,070 | | 0.9 | % | $ | 1,031,023 | | $ | 26.39 | | 2.1 | % |
Bed Bath & Beyond | | Retail | | 3 | | 85,895 | | 2.0 | % | $ | 1,021,921 | | $ | 11.90 | | 2.1 | % |
Lowe’s Home Center | | Retail | | 1 | | 128,997 | | 3.0 | % | $ | 1,014,000 | | $ | 7.86 | | 2.1 | % |
Publix | | Retail | | 3 | | 129,357 | | 3.0 | % | $ | 989,355 | | $ | 7.65 | | 2.1 | % |
Kmart | | Retail | | 1 | | 110,875 | | 2.6 | % | $ | 850,379 | | $ | 7.67 | | 1.8 | % |
UMDA | | Commercial | | 1 | | 32,256 | | 0.8 | % | $ | 844,402 | | $ | 26.18 | | 1.8 | % |
Winn-Dixie | | Retail | | 2 | | 103,406 | | 2.4 | % | $ | 806,266 | | $ | 7.80 | | 1.7 | % |
A & P | | Retail | | 1 | | 58,732 | | 1.4 | % | $ | 763,516 | | $ | 13.00 | | 1.6 | % |
Kerasotes Theatres | | Retail | | 2 | | 43,050 | | 1.0 | % | $ | 739,500 | | $ | 17.18 | | 1.5 | % |
City Securities | | Commercial | | 1 | | 34,949 | | 0.8 | % | $ | 694,900 | | $ | 19.88 | | 1.4 | % |
Indiana University Healthcare | | Commercial | | 1 | | 31,175 | | 0.7 | % | $ | 679,077 | | $ | 21.78 | | 1.4 | % |
Dominick’s | | Retail | | 1 | | 65,636 | | 1.5 | % | $ | 669,487 | | $ | 10.20 | | 1.4 | % |
Old Navy | | Retail | | 3 | | 70,620 | | 1.7 | % | $ | 587,958 | | $ | 8.33 | | 1.2 | % |
| | | | | | 1,754,737 | | 41.0 | % | $ | 21,100,532 | | $ | 12.03 | | 43.7 | % |
21
Lease Expiration Table – Operating Portfolio
AS OF DECEMBER 31, 2004
Information includes Operating Retail and Commercial Properties and Development Property tenants open for business as of December 31, 2004.
| | Number of Expiring
Leases(1) | | Expiring GLA/NRA(2) | | % of Total
Sq. Ft.
Expiring | | Expiring Annualized Base Rent(3) | | % of Total
Annualized Base Rent | | Expiring
Annualized Base Rent per Sq. Ft. | | Expiring
Ground Lease
Revenue | |
2005 | | 69 | | 218,156 | | 5.3 | % | $ | 2,409,956 | | 5.2 | % | $ | 11.05 | | $ | 0 | |
2006 | | 62 | | 184,944 | | 4.5 | % | $ | 2,254,720 | | 4.8 | % | $ | 12.19 | | $ | 0 | |
2007 | | 60 | | 191,311 | | 4.7 | % | $ | 2,412,280 | | 5.2 | % | $ | 12.61 | | $ | 0 | |
2008 | | 37 | | 294,849 | | 7.2 | % | $ | 2,372,677 | | 5.1 | % | $ | 8.05 | | $ | 0 | |
2009 | | 42 | | 168,841 | | 4.1 | % | $ | 2,350,442 | | 5.0 | % | $ | 13.92 | | $ | 0 | |
2010 | | 24 | | 301,946 | | 7.4 | % | $ | 2,912,161 | | 6.2 | % | $ | 9.64 | | $ | 0 | |
2011 | | 25 | | 513,157 | | 12.5 | % | $ | 4,389,374 | | 9.4 | % | $ | 8.55 | | $ | 0 | |
2012 | | 27 | | 213,443 | | 5.2 | % | $ | 2,966,309 | | 6.4 | % | $ | 13.90 | | $ | 85,000 | |
2013 & Beyond | | 98 | | 2,009,846 | | 49.1 | % | $ | 24,543,584 | | 52.7 | % | $ | 12.21 | | $ | 1,542,680 | |
Total | | 444 | | 4,096,493 | | 100.0 | % | $ | 46,611,503 | | 100.0 | % | $ | 11.38 | | $ | 1,627,680 | |
| | | | | | | | | | | | | | | | | | | |
(1) Lease expiration table does not include option periods and 2005 expirations include month to month tenants.
(2) Expiring GLA excludes square footage for Non-Owned Ground Lease structures.
(3) Excludes Ground Lease Revenue.
22
Lease Expiration Table – Retail Anchor Tenants(1)
AS OF DECEMBER 31, 2004
Information includes Operating Retail Properties and Development Property tenants open for business as of December 31, 2004.
| | Number of Expiring
Leases(2) | | Expiring GLA/NRA(3) | | % of Total
Sq. Ft.
Expiring | | Expiring Annualized Base Rent(4) | | % of Total
Annualized Base Rent | | Expiring
Annualized Base Rent
per Sq. Ft. | | Expiring Ground Lease Revenue | |
2005 | | 3 | | 65,117 | | 1.6 | % | $ | 487,491 | | 1.0 | % | $ | 7.49 | | $ | 0 | |
2006 | | 3 | | 60,034 | | 1.5 | % | $ | 388,266 | | 0.8 | % | $ | 6.47 | | $ | 0 | |
2007 | | 5 | | 76,926 | | 1.9 | % | $ | 609,076 | | 1.3 | % | $ | 7.92 | | $ | 0 | |
2008 | | 2 | | 210,561 | | 5.1 | % | $ | 792,783 | | 1.7 | % | $ | 3.77 | | $ | 0 | |
2009 | | 3 | | 65,656 | | 1.6 | % | $ | 598,240 | | 1.3 | % | $ | 9.11 | | $ | 0 | |
2010 | | 9 | | 248,324 | | 6.1 | % | $ | 2,140,944 | | 4.6 | % | $ | 8.62 | | $ | 0 | |
2011 | | 5 | | 360,651 | | 8.8 | % | $ | 1,635,905 | | 3.5 | % | $ | 4.54 | | $ | 0 | |
2012 | | 3 | | 94,890 | | 2.3 | % | $ | 716,757 | | 1.5 | % | $ | 7.55 | | $ | 0 | |
2013 & Beyond | | 38 | | 1,441,512 | | 35.2 | % | $ | 15,739,470 | | 33.8 | % | $ | 10.92 | | $ | 240,000 | |
Total | | 71 | | 2,623,671 | | 64.1 | % | $ | 23,108,932 | | 49.5 | % | $ | 8.81 | | $ | 240,000 | |
(1) Retail anchor tenants are defined as tenants of operating retail properties which occupy 10,000 square feet or more.
(2) Lease expiration table does not include option periods and 2005 expirations include month to month tenants.
(3) Expiring GLA excludes square footage for Non-Owned Ground Lease structures.
(4) Excludes Ground Lease Revenue.
23
Lease Expiration Table – Retail Shops
AS OF DECEMBER 31, 2004
Information includes Operating Retail Properties and Development Property tenants open for business as of December 31, 2004.
| | Number of Expiring
Leases(1) | | Expiring GLA/NRA(2) | | % of Total
Sq. Ft.
Expiring | | Expiring Base Rent(3) | | % of Total
Base Rent | | Expiring
Base Rent
per Sq. Ft. | | Expiring
Ground Lease
Revenue | |
2005 | | 66 | | 153,039 | | 3.7 | % | $ | 1,922,464 | | 4.1 | % | $ | 12.56 | | $ | 0 | |
2006 | | 57 | | 117,807 | | 2.9 | % | $ | 1,752,806 | | 3.8 | % | $ | 14.88 | | $ | 0 | |
2007 | | 53 | | 110,430 | | 2.7 | % | $ | 1,727,711 | | 3.7 | % | $ | 15.65 | | $ | 0 | |
2008 | | 34 | | 76,323 | | 1.9 | % | $ | 1,419,956 | | 3.0 | % | $ | 18.60 | | $ | 0 | |
2009 | | 39 | | 103,185 | | 2.5 | % | $ | 1,752,202 | | 3.8 | % | $ | 16.98 | | $ | 0 | |
2010 | | 14 | | 44,744 | | 1.1 | % | $ | 591,437 | | 1.3 | % | $ | 13.22 | | $ | 0 | |
2011 | | 17 | | 52,964 | | 1.3 | % | $ | 1,111,026 | | 2.4 | % | $ | 20.98 | | $ | 0 | |
2012 | | 21 | | 81,501 | | 2.0 | % | $ | 1,658,844 | | 3.6 | % | $ | 20.35 | | $ | 85,000 | |
2013 & Beyond | | 31 | | 85,629 | | 2.1 | % | $ | 1,884,736 | | 4.0 | % | $ | 22.01 | | $ | 1,302,680 | |
Total | | 332 | | 825,622 | | 20.2 | % | $ | 13,821,182 | | 29.7 | % | $ | 16.74 | | $ | 1,387,680 | |
(1) Lease expiration table does not include option periods and 2005 expirations include month to month tenants.
(2) Expiring GLA excludes square footage for Non-Owned Ground Lease structures.
(3) Excludes Ground Lease Revenue.
24
Summary Retail Portfolio Statistics
(INCLUDES JOINT VENTURE PROPERTIES)
Retail Portfolio | | 12/31/04 | | 9/30/04 | | 6/30/04 | | 3/31/04 | | 12/31/03 | |
| | | | | | | | | | | |
Company Owned GLA(1) – Operating Retail | | 3,391,900 | | 3,078,616 | | 1,845,631 | | 1,624,338 | | 1,465,628 | |
Total GLA(1) – Operating Retail | | 4,566,374 | | 4,108,090 | | 2,853,129 | | 2,531,457 | | 1,887,747 | |
Projected Total GLA Under Development | | 1,252,331 | | 1,382,202 | | 1,411,265 | | 1,411,265 | | 984,140 | |
Projected Company owned GLA Under Development(2) | | 560,300 | | 545,500 | | 574,560 | | 574,560 | | 533,560 | |
| | | | | | | | | | | |
Number of Operating Retail Properties | | 30 | | 27 | | 17 | | 14 | | 12 | |
Number of Retail Properties Under Development | | 9 | | 10 | | 12 | | 12 | | 8 | |
| | | | | | | | | | | |
Percentage Leased – Operating Retail | | 95.3 | % | 94.9 | % | 92.8 | % | 93.9 | % | 91.1 | % |
Percentage Leased – Retail Properties under Development – 2004 Deliveries(3) | | 73.9 | % | 71.8 | % | 73.0 | % | 62.1 | % | 62.1 | % |
| | | | | | | | | | | |
Annualized Base Rent & Ground Lease Revenue – Retail Properties | | $ | 35,187,179 | | $ | 31,814,134 | | $ | 24,939,090 | | $ | 21,508,397 | | $ | 19,344,588 | |
| | | | | | | | | | | | | | | | |
(1) “Company Owned GLA” represents gross leasable area that is owned by the Company. “Total GLA” includes Company Owned GLA, plus square footage attributable to non-owned outlot structures on land that is owned by the Company and ground leased to tenants, plus non-owned anchor space.
(2) “Projected Company Owned GLA Under Development” represents gross leaseable area under development that is projected to be owned by the Company. “Projected Total GLA” includes Projected Company Owned GLA, plus projected square footage attributable to non-owned outlot structures on land that is owned by the Company and ground leased to tenants, plus non-owned anchor space that is existing or under construction.
(3) “Percentage Leased – Retail Properties under Development” is calculated based on Projected Company Owned GLA plus projected square footage attributable to non-owned outlot structures on land that is owned by the Company and ground leased to tenants. The “2004 Deliveries” calculation reflects only properties that were projected for 2004, so that the 12/31/04 calculation includes 3 properties, the 9/30/04 calculation includes 4 properties, the 6/30/04 calculation includes 6 properties, the 3/31/04 calculation includes 6 properties, and the 12/31/03 calculation includes 8 properties.
25
Summary Commercial Portfolio Statistics
(INCLUDES JOINT VENTURE PROPERTIES)
Commercial Portfolio | | 12/31/04 | | 9/30/04 | | 6/30/04 | | 3/31/04 | | 12/31/03 | |
| | | | | | | | | | | |
Company Owned Net Rentable Area (NRA)(1) | | 662,652 | | 547,652 | | 547,652 | | 545,673 | | 545,673 | |
NRA under Development | | — | | 115,000 | | 115,000 | | 115,000 | | 115,000 | |
| | | | | | | | | | | |
Number of Operating Commercial Properties | | 6 | | 5 | | 5 | | 5 | | 5 | |
Number of Commercial Properties under Development | | — | | 1 | | 1 | | 1 | | 1 | |
| | | | | | | | | | | |
Percentage Leased – Operating Commercial Properties | | 97.7 | % | 96.9 | % | 98.8 | % | 98.8 | % | 95.8 | % |
Percentage Leased – Commercial Properties under Development | | — | | 100 | % | 100 | % | 100 | % | 100 | % |
| | | | | | | | | | | |
Annualized Base Rent – Commercial Properties(2) | | $ | 9,681,386 | | $ | 8,998,898 | | $ | 9,149,558 | | $ | 9,149,558 | | $ | 8,832,000 | |
| | | | | | | | | | | | | | | | |
(1) “Company Owned NRA” does not include square footage of Union Station Parking Garage, a detached parking garage supporting the Thirty South property that includes 851 parking spaces. It is operated by Denison Parking, a third party, pursuant to a lease of the entire property.
(2) “Annualized Base Rent” does not include approximately $500,000 in annualized income attributable to the Union Station Parking Garage.
26
Development Pipeline
AS OF DECEMBER 31, 2004
Property | | MSA | | Type of
Property | | Projected
Opening
Date | | Projected
Owned
GLA/NRA(1) | | Projected
Total
GLA/NRA(2) | | Total
Estimated
Project Cost(3) | | Cost
Incurred as
of 12/31/04(3) | | Percentage
of Owned
GLA/NRA
Pre-Leased(4) | | Major Tenants and Non-owned Anchors | |
Florida | | | | | | | | | | | | | | | | | | | |
Eagle Creek, Phase II | | Naples | | Retail | | Jan-05 | | (see below) | | 165,000 | | $ | 9,080 | | $ | 8,520 | | (see below) | | | |
| | | | | | | | | | | | | | | | | | | |
Indiana | | | | | | | | | | | | | | | | | | | |
Traders Point | | Indianapolis | | Retail | | Oct-04 | | 285,000 | | 366,377 | | 43,227 | | 35,395 | | 73.7 | % | Dick’s Sporting Goods, Marsh Supermarkets, Bed Bath & Beyond, Kerasotes Theatres, Michaels, Old Navy | |
Cool Creek Commons | | Indianapolis | | Retail | | Oct-04 | | 126,000 | | 138,529 | | 20,013 | | 17,954 | | 75.8 | % | SteinMart, Fresh Market | |
Traders Point II | | Indianapolis | | Retail | | Apr-05 | | 41,000 | | 48,600 | | 8,288 | | 4,379 | | 0.0 | % | (see Traders Point) | |
Weston Park, Phase I | | Indianapolis | | Retail | | Nov-04 | | 0 | | 12,200 | | 1,963 | | 4,290 | | n/a | | | |
Greyhound Commons | | Indianapolis | | Retail | | Feb-05 | | 0 | | 201,325 | | 4,397 | | 3,199 | | n/a | | Lowe’s (non-owned) | |
Red Bank Commons | | Evansville | | Retail | | Feb-05 | | 34,500 | | 246,500 | | 6,400 | | 4,252 | | 39.4 | % | Wal-Mart (non-owned; Home Depot (non-owned) | |
Martinsville Shops | | Martinsville | | Retail | | Mar-05 | | 11,000 | | 11,000 | | 1,197 | | 1,426 | | 0.0 | % | | |
Geist Pavilion | | Indianapolis | | Retail | | Mar-05 | | 62,800 | | 62,800 | | 7,747 | | 3,256 | | 25.8 | % | | |
| | | | | | Total | | 560,300 | | 1,252,331 | | $ | 102,312 | | $ | 82,671 | | 59.9 | % | | |
All of the land at Eagle Creek Phase II, Weston Park Phase I, and Greyhound Commons is intended to be ground leased to tenants.
• We have entered into an Agreement to Enter into Ground Lease for the entire Eagle Creek, Phase II property with a big box retailer. The retailer is obligated to pay and is paying a portion of its rent until the ground lease is executed.
• Weston Park, Phase I consists of three outlots, two of which were leased as of December 31, 2004.
• Greyhound Commons consists of four outlots, two of which were leased as of December 31, 2004.
(1) “Projected Owned GLA/NRA” represents gross leasable area/net rentable area that is owned by the Company. It excludes square footage attributable to non-owned outlot structures on land that is owned by KRG and ground leased to tenants.
(2) “Projected Total GLA/NRA” includes Projected Owned GLA, plus projected square footage attributable to non-owned outlot structures on land that is owned by KRG and ground leased to tenants, plus non-owned anchor space that is currently existing or under construction.
(3) Dollars in thousands.
(4) Excludes outlots and parcels owned by KRG and ground leased to tenants. Traders Point has seven such parcels, four of which were pre-leased as of December 31, 2004.
27
Geographic Diversification – Operating Portfolio
AS OF DECEMBER 31, 2004
| | Number of Operating Properties | | Owned GLA/NRA(1) | | Percentage of Owned GLA/NRA | | Total
Number
of
Leases | | Annualized Base Rent Revenue(2) | | % of Annualized Base Rent | | Annualized Base Rent per Leased Square Foot | |
Indiana | | 15 | | 1,805,599 | | 44.5 | % | 178 | | $ | 18,691,263 | | 42.6 | % | $ | 11.12 | |
• Retail – Mall | | 1 | | 579,189 | | 14.3 | % | 48 | | $ | 2,792,028 | | 6.3 | % | $ | 5.56 | |
• Retail | | 8 | | 563,758 | | 13.9 | % | 106 | | $ | 6,217,849 | | 14.2 | % | $ | 11.71 | |
• Commercial | | 6 | | 662,652 | | 16.3 | % | 24 | | $ | 9,681,386 | | 22.1 | % | $ | 14.96 | |
Texas | | 6 | | 830,910 | | 20.5 | % | 59 | | $ | 9,275,453 | | 21.2 | % | $ | 11.26 | |
Florida | | 6 | | 683,962 | | 16.9 | % | 88 | | $ | 6,823,254 | | 15.6 | % | $ | 10.16 | |
Illinois | | 1 | | 132,725 | | 3.3 | % | 19 | | $ | 1,627,756 | | 3.7 | % | $ | 13.88 | |
New Jersey | | 1 | | 114,928 | | 2.8 | % | 17 | | $ | 1,732,090 | | 4.0 | % | $ | 15.96 | |
Georgia | | 2 | | 142,707 | | 3.5 | % | 29 | | $ | 1,623,413 | | 3.7 | % | $ | 11.38 | |
Washington | | 3 | | 102,146 | | 2.5 | % | 24 | | $ | 1,590,234 | | 3.6 | % | $ | 16.88 | |
Ohio | | 1 | | 231,730 | | 5.7 | % | 6 | | $ | 2,209,767 | | 5.0 | % | $ | 9.54 | |
Oregon | | 1 | | 9,845 | | 0.3 | % | 7 | | $ | 273,156 | | 0.6 | % | $ | 27.75 | |
Total | | 36 | | 4,054,552 | | 100.0 | % | 427 | | $ | 43,846,386 | | 100.0 | % | $ | 11.30 | |
(1) “Owned GLA/NRA” represents gross leasable area or net rentable area owned by the Company. It does not include 12 parcels or outlots owned by the Company and ground leased to tenants, which contain non-owned structures totaling approximately 64,447 square feet. It also excludes the square footage of Union Station Parking Garage.
(2) “Annualized Base Rent Revenue” excludes $1,022,180 in annualized ground lease revenue attributable to parcels and outlots owned by the Company and ground leased to tenants. It also excludes approximately $500,000 in 2004 annualized income attributable to the Union Station Parking Garage as well as the leases on properties classified as development properties.
28
Operating Retail Properties (Part I)
AS OF DECEMBER 31, 2004
Property | | State | | MSA | | Year Built/
Renovated | | Year Added to
Operating Portfolio | | Acquired,
Redeveloped, or
Developed | | Total GLA | | Company Owned GLA | | Percentage of Owned
GLA Leased | |
Int’l Speedway Square | | FL | | Daytona Beach | | 1999 | | 1999 | | Developed | | 233,901 | | 220,901 | | 100.0 | % |
King’s Lake Square | | FL | | Naples | | 1986 | | 2003 | | Acquired | | 85,497 | | 85,497 | | 97.5 | % |
Wal-Mart Plaza | | FL | | Gainesville | | 1970 | | 2004 | | Acquired | | 177,766 | | 177,766 | | 99.1 | % |
Waterford Lakes | | FL | | Orlando | | 1997 | | 2004 | | Acquired | | 77,948 | | 77,948 | | 100.0 | % |
Shops at Eagle Creek | | FL | | Naples | | 1998 | | 2003 | | Acquired | | 75,944 | | 75,944 | | 93.6 | % |
Circuit City Plaza | | FL | | Ft. Lauderdale | | 2004 | | 2004 | | Developed | | 435,906 | | 45,906 | | 91.5 | % |
Centre at Panola | | GA | | Atlanta | | 2001 | | 2004 | | Acquired | | 73,079 | | 73,079 | | 100.0 | % |
Publix at Acworth | | GA | | Atlanta | | 1996 | | 2004 | | Acquired | | 69,628 | | 69,628 | | 100.0 | % |
Silver Glen Crossings | | IL | | Chicago | | 2002 | | 2004 | | Acquired | | 138,274 | | 132,725 | | 88.4 | % |
Glendale Mall | | IN | | Indianapolis | | 1958/2000 | | 1999 | | Redeveloped | | 724,026 | | 579,189 | | 86.7 | % |
Boulevard Crossing | | IN | | Kokomo | | 2004 | | 2004 | | Developed | | 214,696 | | 112,696 | | 90.3 | % |
Hamilton Crossing | | IN | | Indianapolis | | 1999 | | 2004 | | Acquired | | 87,374 | | 82,374 | | 92.7 | % |
Fishers Station | | IN | | Indianapolis | | 1989 | | 2004 | | Acquired | | 114,457 | | 114,457 | | 86.2 | % |
Whitehall Pike | | IN | | Bloomington | | 1999 | | 1999 | | Developed | | 128,997 | | 128,997 | | 100.0 | % |
The Centre | | IN | | Indianapolis | | 1986 | | 1986 | | Developed | | 80,689 | | 80,689 | | 100.0 | % |
The Corner | | IN | | Indianapolis | | 1984/2003 | | 1984 | | Developed | | 42,545 | | 42,545 | | 100.0 | % |
Stoney Creek Commons | | IN | | Indianapolis | | 2000 | | 2000 | | Developed | | 154,282 | | (* | ) | (* | ) |
50 S. Morton | | IN | | Indianapolis | | 1999 | | 1999 | | Developed | | 2,000 | | 2,000 | | 100.0 | % |
Ridge Plaza | | NJ | | Oak Ridge | | 2002 | | 2003 | | Acquired | | 114,928 | | 114,928 | | 94.4 | % |
Eastgate Pavilion | | OH | | Cincinnati | | 1995 | | 2004 | | Acquired | | 231,730 | | 231,730 | | 100.0 | % |
82nd & Otty | | OR | | Portland | | 2004 | | 2004 | | Developed | | 154,845 | | 9,845 | | 100.0 | % |
Plaza at Cedar Hill | | TX | | Dallas | | 2000 | | 2004 | | Acquired | | 299,783 | | 299,783 | | 100.0 | % |
Sunland Towne Centre | | TX | | El Paso | | 1996 | | 2004 | | Acquired | | 312,571 | | 307,595 | | 98.9 | % |
Galleria Plaza | | TX | | Dallas | | 2002 | | 2004 | | Acquired | | 44,306 | | 44,306 | | 100.0 | % |
Cedar Hill Village | | TX | | Dallas | | 2002 | | 2004 | | Acquired | | 139,092 | | 44,262 | | 100.0 | % |
Preston Commons | | TX | | Dallas | | 2002 | | 2002 | | Developed | | 142,564 | | 27,564 | | 85.6 | % |
Burlington Coat | | TX | | San Antonio | | 1992/2000 | | 2000 | | Redeveloped | | 107,400 | | 107,400 | | 100.0 | % |
50th & 12th | | WA | | Seattle | | 2004 | | 2004 | | Developed | | 14,500 | | 14,500 | | 100.0 | % |
176th & Meridian | | WA | | Seattle | | 2004 | | 2004 | | Developed | | 14,560 | | 14,560 | | 100.0 | % |
Four Corner Square | | WA | | Seattle | | 1985 | | 2004 | | Acquired | | 73,086 | | 73,086 | | 89.1 | % |
| | | | | | | | | | Total | | 4,566,374 | | 3,391,900 | | 95.3 | % |
Note: An (*) indicates that this property consists of parcels which are ground leased to tenants.
29
Operating Retail Properties (Part II)
AS OF DECEMBER 31, 2004
Property | | State | | MSA | | Annualized
Base Rent
Revenue | | Annualized
Ground Lease
Revenue | | Annualized
Total Revenue | | Percentage of
Annualized Total
Retail Revenue | | Base Rent Per
Leased Owned
Square Ft. | | Major Tenants and Non-Owned Anchors | |
Int’l Speedway Square | | FL | | Daytona Beach | | $ | 2,454,026 | | $ | 216,400 | | $ | 2,670,426 | | 7.6 | % | $ | 11.11 | | SteinMart, Bed Bath, Circuit City, Staples | |
King’s Lake Square | | FL | | Naples | | $ | 1,019,809 | | $ | 0 | | $ | 1,019,809 | | 2.9 | % | $ | 12.24 | | Publix, Walgreens | |
Wal-Mart Plaza | | FL | | Gainesville | | $ | 869,336 | | $ | 0 | | $ | 869,336 | | 2.5 | % | $ | 4.94 | | Wal-Mart, Books A Million, Save A Lot | |
Waterford Lakes | | FL | | Orlando | | $ | 890,942 | | $ | 0 | | $ | 890,942 | | 2.5 | % | $ | 11.43 | | Winn-Dixie | |
Shops at Eagle Creek | | FL | | Naples | | $ | 771,936 | | $ | 0 | | $ | 771,936 | | 2.2 | % | $ | 10.86 | | Winn-Dixie | |
Circuit City Plaza | | FL | | Ft. Lauderdale | | $ | 817,204 | | $ | 0 | | $ | 817,204 | | 2.3 | % | $ | 19.46 | | Circuit City | |
Centre at Panola | | GA | | Atlanta | | $ | 824,148 | | $ | 0 | | $ | 824,148 | | 2.3 | % | $ | 11.28 | | Publix | |
Publix at Acworth | | GA | | Atlanta | | $ | 799,265 | | $ | 0 | | $ | 799,265 | | 2.3 | % | $ | 11.48 | | Publix, CVS | |
Silver Glen Crossings | | IL | | Chicago | | $ | 1,627,756 | | $ | 85,000 | | $ | 1,712,756 | | 4.9 | % | $ | 13.88 | | Dominick’s, MC Sports | |
Glendale Mall | | IN | | Indianapolis | | $ | 2,792,029 | | $ | 140,000 | | $ | 2,932,029 | | 8.4 | % | $ | 5.56 | | L.S. Ayres, Kerasotes Theatre, Old Navy, Staples | |
Boulevard Crossing | | IN | | Kokomo | | $ | 1,271,605 | | $ | 75,000 | | $ | 1,346,605 | | 3.8 | % | $ | 12.50 | | TJ Maxx, Petco, Shoe Carnival, Kohl’s (non-owned) | |
Hamilton Crossing | | IN | | Indianapolis | | $ | 1,187,999 | | $ | 65,000 | | $ | 1,252,999 | | 3.6 | % | $ | 15.56 | | Office Depot | |
Fishers Station | | IN | | Indianapolis | | $ | 1,156,319 | | $ | 0 | | $ | 1,156,319 | | 3.3 | % | $ | 11.73 | | Marsh Supermarket | |
Whitehall Pike | | IN | | Bloomington | | $ | 1,014,000 | | $ | 0 | | $ | 1,014,000 | | 2.9 | % | $ | 7.86 | | Lowe’s | |
The Centre | | IN | | Indianapolis | | $ | 996,562 | | $ | 0 | | $ | 996,562 | | 2.8 | % | $ | 12.35 | | Osco | |
The Corner | | IN | | Indianapolis | | $ | 477,364 | | $ | 0 | | $ | 477,364 | | 1.4 | % | $ | 11.22 | | Hancock Fabrics | |
Stoney Creek Commons | | IN | | Indianapolis | | (* | ) | $ | 223,000 | | $ | 223,000 | | 0.6 | % | (* | ) | Lowe’s (non-owned) | |
50 S. Morton | | IN | | Indianapolis | | $ | 114,000 | | $ | 0 | | $ | 114,000 | | 0.3 | % | $ | 57.00 | | | |
Ridge Plaza | | NJ | | Oak Ridge | | $ | 1,732,090 | | $ | 0 | | $ | 1,732,090 | | 4.9 | % | $ | 15.96 | | A&P, CVS | |
Eastgate Pavilion | | OH | | Cincinnati | | $ | 2,209,767 | | $ | 0 | | $ | 2,209,767 | | 6.3 | % | $ | 9.54 | | Bed Bath Beyond, Dick’s, DSW, Value City Furniture, PETsMart, Best Buy | |
82nd & Otty | | OR | | Portland | | $ | 273,156 | | $ | 122,500 | | $ | 395,656 | | 1.1 | % | $ | 27.75 | | | |
Plaza at Cedar Hill | | TX | | Dallas | | $ | 3,501,144 | | $ | 0 | | $ | 3,501,144 | | 10.0 | % | $ | 11.68 | | Hobby Lobby, Linens ‘N Things, Marshall’s, Barnes & Noble | |
Sunland Towne Centre | | TX | | El Paso | | $ | 2,901,099 | | $ | 95,280 | | $ | 2,996,379 | | 8.5 | % | $ | 9.53 | | Kmart, Circuit City, Roomstore, Ross, PETsMart | |
Galleria Plaza | | TX | | Dallas | | $ | 1,193,750 | | $ | 0 | | $ | 1,193,750 | | 3.4 | % | $ | 26.94 | | Ultimate Electronics | |
Cedar Hill Village | | TX | | Dallas | | $ | 643,508 | | $ | 0 | | $ | 643,508 | | 1.8 | % | $ | 14.54 | | Ultimate Electronics, JC Penny (non-owned) | |
Preston Commons | | TX | | Dallas | | $ | 552,652 | | $ | 0 | | $ | 552,652 | | 1.6 | % | $ | 23.42 | | Lowe’s (non-owned) | |
Burlington Coat | | TX | | San Antonio | | $ | 483,300 | | $ | 0 | | $ | 483,300 | | 1.4 | % | $ | 4.50 | | Burlington Coat Factory | |
50th & 12th | | WA | | Seattle | | $ | 475,000 | | $ | 0 | | $ | 475,000 | | 1.3 | % | $ | 32.76 | | Walgreens | |
176th & Meridian | | WA | | Seattle | | $ | 433,000 | | $ | 0 | | $ | 433,000 | | 1.2 | % | $ | 29.74 | | Walgreens | |
Four Corner Square | | WA | | Seattle | | $ | 682,234 | | $ | 0 | | $ | 682,234 | | 1.9 | % | $ | 10.47 | | Johnson Hardware Store | |
Total | | $ | 34,165,000 | | $ | 1,022,180 | | $ | 35,187,180 | | 100.0 | % | $ | 10.57 | | | |
Note: An (*) indicates that this property consists of parcels which are ground leased to tenants.
30
Operating Commercial Properties
AS OF DECEMBER 31, 2004
Property | | MSA | | Year
Built/
Renovated | | Acquired,
Redeveloped, or Developed | | Owned NRA | | Percentage of
Owned NRA
Leased | | Annualized
Base Rent | | Percentage
of
Annualized
Commercial
Base Rent | | Base Rent Per
Leased Sq.
Ft. | | Major Tenants | |
Indiana | | | | | | | | | | | | | | | | | | | |
Thirty South | | Indianapolis | | 1905/2002 | | Redeveloped | | 298,346 | | 94.8 | % | $ | 4,930,221 | | 50.9 | % | $ | 17.43 | | Eli Lilly, City Securities, Kite Realty Group | |
Mid America Clinical Labs | | Indianapolis | | 1995/2002 | | Redeveloped | | 100,000 | | 100.0 | % | $ | 1,721,000 | | 17.8 | % | $ | 17.21 | | Mid-America Clinical Laboratories | |
PEN Products | | Indianapolis | | 2003 | | Developed | | 85,875 | | 100.0 | % | $ | 813,236 | | 8.4 | % | $ | 9.47 | | Indiana Department of Administration | |
Spring Mill Medical | | Indianapolis | | 1998/2002 | | Redeveloped | | 63,431 | | 100.0 | % | $ | 1,523,479 | | 15.7 | % | $ | 24.02 | | University Medical Diagnostic Associates; Indiana University Health Care Associates | |
Union Station Parking Garage(1) | | Indianapolis | | 1986 | | Acquired | | N/A | | N/A | | N/A | | | | | | Denison Parking | |
IN State Motor Pool | | Indianapolis | | 2004 | | Developed | | 115,000 | | 100.0 | % | $ | 693,450 | | 7.2 | % | $ | 6.03 | | Indiana Dept. of Administration | |
Total | | | | | | | | 662,652 | | 97.7 | % | $ | 9,681,386 | | 100.0 | % | $ | 14.96 | | | |
(1) 2004 annualized rent for Union Station Parking Garage is approximately $500,000.
31
RETAIL OPERATING PORTFOLIO – TENANT BREAKDOWN
AS OF DECEMBER 31, 2004
Retail anchor tenants are defined as tenants of operating retail properties which occupy 10,000 square feet or more.
| | Owned Gross Leasable Area | | Occupancy | | Annualized Base Rent | | Annualized Base Rent
per Occupied Square Foot | |
Property | | State | | Anchors | | Shops | | Total | | Anchors | | Shops | | Total | | Anchors | | Shops | | Ground
Leases | | Total | | Anchors | | Shops | | Total | |
Int’l Speedway Square | | FL | | 200,401 | | 20,500 | | 220,901 | | 100.0 | % | 100.0 | % | 100.0 | % | $ | 2,074,376 | | $ | 379,650 | | $ | 216,400 | | $ | 2,670,426 | | $ | 10.35 | | $ | 18.52 | | $ | 11.11 | |
King’s Lake Square | | FL | | 49,805 | | 35,692 | | 85,497 | | 100.0 | % | 93.9 | % | 97.5 | % | $ | 361,787 | | $ | 658,022 | | — | | $ | 1,019,809 | | $ | 7.26 | | $ | 19.62 | | $ | 12.24 | |
Wal-Mart Plaza | | FL | | 138,323 | | 39,443 | | 177,766 | | 100.0 | % | 95.9 | % | 99.1 | % | $ | 531,795 | | $ | 337,541 | | — | | $ | 869,336 | | $ | 3.84 | | $ | 8.92 | | $ | 4.94 | |
Waterford Lakes | | FL | | 51,703 | | 26,245 | | 77,948 | | 100.0 | % | 100.0 | % | 100.0 | % | $ | 408,452 | | $ | 482,490 | | — | | $ | 890,942 | | $ | 7.90 | | $ | 18.38 | | $ | 11.43 | |
Shops at Eagle Creek | | FL | | 51,703 | | 24,241 | | 75,944 | | 100.0 | % | 79.8 | % | 93.6 | % | $ | 397,814 | | $ | 374,122 | | — | | $ | 771,936 | | $ | 7.69 | | $ | 19.34 | | $ | 10.86 | |
Circuit City Plaza | | FL | | 33,014 | | 12,892 | | 45,906 | | 100.0 | % | 69.6 | % | 91.5 | % | $ | 594,252 | | $ | 222,952 | | — | | $ | 817,204 | | $ | 18.00 | | $ | 24.84 | | $ | 19.46 | |
Centre at Panola | | GA | | 51,674 | | 21,405 | | 73,079 | | 100.0 | % | 100.0 | % | 100.0 | % | $ | 413,388 | | $ | 410,760 | | — | | $ | 824,148 | | $ | 8.00 | | $ | 19.19 | | $ | 11.28 | |
Publix at Acworth | | GA | | 37,888 | | 31,740 | | 69,628 | | 100.0 | % | 100.0 | % | 100.0 | % | $ | 337,203 | | $ | 462,062 | | — | | $ | 799,265 | | $ | 8.90 | | $ | 14.56 | | $ | 11.48 | |
Silver Glen Crossings | | IL | | 78,675 | | 54,050 | | 132,725 | | 100.0 | % | 71.4 | % | 88.4 | % | $ | 812,916 | | $ | 814,839 | | $ | 85,000 | | $ | 1,712,756 | | $ | 10.33 | | $ | 21.11 | | $ | 13.88 | |
Glendale Mall | | IN | | 427,351 | | 151,838 | | 579,189 | | 92.0 | % | 71.7 | % | 86.7 | % | $ | 1,463,135 | | $ | 1,328,894 | | $ | 140,000 | | $ | 2,932,029 | | $ | 3.72 | | $ | 12.21 | | $ | 5.56 | |
Boulevard Crossing | | IN | | 74,440 | | 38,256 | | 112,696 | | 100.0 | % | 71.4 | % | 90.3 | % | $ | 827,460 | | $ | 444,145 | | $ | 75,000 | | $ | 1,346,605 | | $ | 11.12 | | $ | 16.26 | | $ | 12.50 | |
Hamilton Crossing | | IN | | 30,722 | | 51,652 | | 82,374 | | 100.0 | % | 88.3 | % | 92.7 | % | $ | 345,623 | | $ | 842,376 | | $ | 65,000 | | $ | 1,252,999 | | $ | 11.25 | | $ | 18.47 | | $ | 15.56 | |
Fishers Station | | IN | | 57,000 | | 57,457 | | 114,457 | | 100.0 | % | 72.4 | % | 86.2 | % | $ | 557,000 | | $ | 599,319 | | — | | $ | 1,156,319 | | $ | 9.77 | | $ | 14.40 | | $ | 11.73 | |
Whitehall Pike | | IN | | 128,997 | | — | | 128,997 | | 100.0 | % | — | | 100.0 | % | $ | 1,014,000 | | — | | — | | $ | 1,014,000 | | $ | 7.86 | | — | | $ | 7.86 | |
The Centre | | IN | | 18,720 | | 61,969 | | 80,689 | | 100.0 | % | 100.0 | % | 100.0 | % | $ | 170,352 | | $ | 826,210 | | — | | $ | 996,562 | | $ | 9.10 | | $ | 13.33 | | $ | 12.35 | |
The Corner | | IN | | 12,200 | | 30,345 | | 42,545 | | 100.0 | % | 100.0 | % | 100.0 | % | $ | 65,636 | | $ | 411,728 | | — | | $ | 477,364 | | $ | 5.38 | | $ | 13.57 | | $ | 11.22 | |
Stoney Creek | | IN | | — | | — | | — | | — | | — | | — | | — | | — | | $ | 223,000 | | $ | 223,000 | | — | | — | | — | |
50 S. Morton | | IN | | — | | 2,000 | | 2,000 | | — | | 100.0 | % | 100.0 | % | — | | $ | 114,000 | | — | | $ | 114,000 | | — | | $ | 57.00 | | $ | 57.00 | |
Ridge Plaza | | NJ | | 69,612 | | 45,316 | | 114,928 | | 100.0 | % | 85.8 | % | 94.4 | % | $ | 986,556 | | $ | 745,534 | | — | | $ | 1,732,090 | | $ | 14.17 | | $ | 19.16 | | $ | 15.96 | |
Eastgate Pavilion | | OH | | 231,730 | | — | | 231,730 | | 100.0 | % | — | | 100.0 | % | $ | 2,209,767 | | — | | — | | $ | 2,209,767 | | $ | 9.54 | | — | | $ | 9.54 | |
82nd & Otty | | OR | | — | | 9,845 | | 9,845 | | — | | 100.0 | % | 100.0 | % | — | | $ | 273,156 | | $ | 122,500 | | $ | 395,656 | | — | | $ | 27.75 | | $ | 27.75 | |
Plaza at Cedar Hill | | TX | | 227,106 | | 72,677 | | 299,783 | | 100.0 | % | 100.0 | % | 100.0 | % | $ | 2,157,468 | | $ | 1,343,676 | | — | | $ | 3,501,144 | | $ | 9.50 | | $ | 18.49 | | $ | 11.68 | |
Sunland Towne Centre | | TX | | 277,220 | | 30,375 | | 307,595 | | 100.0 | % | 89.2 | % | 98.9 | % | $ | 2,449,403 | | $ | 451,696 | | $ | 95,280 | | $ | 2,996,379 | | $ | 8.84 | | $ | 16.66 | | $ | 9.53 | |
Galleria Plaza | | TX | | 31,396 | | 12,910 | | 44,306 | | 100.0 | % | 100.0 | % | 100.0 | % | $ | 839,844 | | $ | 353,906 | | — | | $ | 1,193,750 | | $ | 26.75 | | $ | 27.41 | | $ | 26.94 | |
Cedar Hill Village | | TX | | 32,231 | | 12,031 | | 44,262 | | 100.0 | % | 100.0 | % | 100.0 | % | $ | 402,888 | | $ | 240,620 | | — | | $ | 643,508 | | $ | 12.50 | | $ | 20.00 | | $ | 14.54 | |
Preston Commons | | TX | | — | | 27,564 | | 27,564 | | — | | 85.6 | % | 85.6 | % | — | | $ | 552,652 | | — | | $ | 552,652 | | — | | $ | 23.42 | | $ | 23.42 | |
Burlington Coat | | TX | | 107,400 | | — | | 107,400 | | 100.0 | % | — | | 100.0 | % | $ | 483,300 | | — | | — | | $ | 483,300 | | $ | 4.50 | | — | | $ | 4.50 | |
50th & 12th | | WA | | 14,500 | | — | | 14,500 | | 100.0 | % | — | | 100.0 | % | $ | 475,000 | | — | | — | | $ | 475,000 | | $ | 32.76 | | — | | $ | 32.76 | |
176th & Meridian | | WA | | 14,560 | | — | | 14,560 | | 100.0 | % | — | | 100.0 | % | $ | 433,000 | | — | | — | | $ | 433,000 | | $ | 29.74 | | — | | $ | 29.74 | |
Four Corner Square | | WA | | 20,512 | | 52,574 | | 73,086 | | 100.0 | % | 84.9 | % | 89.1 | % | $ | 126,672 | | $ | 555,562 | | — | | $ | 682,234 | | $ | 6.18 | | $ | 12.45 | | $ | 10.47 | |
Total | | | | 2,468,883 | | 923,017 | | 3,391,900 | | 98.6 | % | 86.4 | % | 95.3 | % | 20,939,087 | | $ | 13,225,912 | | $ | 1,022,180 | | $ | 35,187,180 | | $ | 8.60 | | $ | 16.58 | | $ | 10.57 | |
| | | | | | | | | | | | | | | | | | | | | | | | | | | | | | | | | | | | | |
32
2004 ACQUISITIONS OF OPERATING PROPERTIES
Name of Operating Property | | MSA | | Date
Acquired | | Purchase
Price | | Assumed
Debt | | Total GLA | | Owned GLA | | Major Tenants and Non-Owned Anchors | |
| | | | | | | | | | | | | | | |
Silver Glen Crossings | | Chicago, Illinois | | 04/01/04 | | $ | 23,200,000 | | $ | — | | 138,274 | | 132,725 | | Dominick’s, MC Sports | |
Cedar Hill Village | | Dallas, Texas | | 06/28/04 | | 6,750,000 | | — | | 139,092 | | 44,262 | | Ultimate Electronics, JC Penney (non-owned) | |
Galleria Plaza | | Dallas, Texas | | 06/29/04 | | 5,960,000 | | — | | 44,306 | | 44,306 | | Ultimate Electronics | |
Wal-Mart Plaza | | Gainesville, Florida | | 07/01/04 | | 8,325,000 | | — | | 177,766 | | 177,766 | | Wal-Mart, Books A Million, Save A Lot | |
Fishers Station | | Indianapolis, Indiana | | 07/23/04 | | 7,100,000 | | 1,404,753 | | 114,457 | | 114,457 | | Marsh Supermarket | |
Hamilton Crossing | | Indianapolis, Indiana | | 08/19/04 | | 15,500,000 | | — | | 87,374 | | 82,374 | | Office Depot | |
Publix at Acworth | | Atlanta, Georgia | | 08/20/04 | | 9,200,000 | | — | | 69,628 | | 69,628 | | Publix, CVS | |
Waterford Lakes | | Orlando, Florida | | 08/20/04 | | 8,950,000 | | — | | 77,948 | | 77,948 | | Winn-Dixie | |
Plaza at Cedar Hill | | Dallas, Texas | | 08/31/04 | | 37,900,000 | | 27,374,359 | | 299,783 | | 299,783 | | Hobby Lobby, Linens ‘N Things, Marshall’s, Barnes ‘n Noble | |
Sunland Towne Centre | | El Paso, Texas | | 09/16/04 | | 32,000,000 | | 17,790,582 | | 312,571 | | 307,595 | | Kmart, Circuit City, Roomstore, Ross, PETsMART | |
Centre at Panola | | Atlanta, Georgia | | 09/30/04 | | 9,124,500 | | 4,482,277 | | 73,079 | | 73,079 | | Publix | |
Eastgate Pavilion | | Cincinnati, Ohio | | 12/01/04 | | 27,500,000 | | — | | 231,730 | | 231,730 | | Bed Bath Beyond, Dick’s, DSW, Value City Furniture, Petsmart, Best Buy | |
Four Corner Square | | Seattle, Washington | | 12/20/04 | | 10,500,000 | | — | | 73,086 | | 73,086 | | Johnson Hardware Store | |
| | | | | | | | | | | | | | | |
Acquisition Subsequent to December 31, 2004: | | Fox Lake Crossing Chicago, Illinois | | 02/07/05 | | 15,500,000 | (1) | 12,281,185 | | 99,100 | | 99,100 | | Dominick’s | |
| | | | | | | | | | | | | | | | | |
(1) Excludes tax-increment financing (TIF) receivable of $1.5 million.
33